Glazbena terapija za osobe oboljele od shizofrenije i poremećaja sličnih shizofreniji
Abstract
Background
Music therapy is a therapeutic approach that uses musical interaction as a means of communication and expression. Within the area of serious mental disorders, the aim of the therapy is to help people improve their emotional and relational competencies, and address issues they may not be able to using words alone.
Objectives
To review the effects of music therapy, or music therapy added to standard care, compared with placebo therapy, standard care or no treatment for people with serious mental disorders such as schizophrenia.
Search methods
We searched the Cochrane Schizophrenia Group’s Trials Study‐Based Register (December 2010 and 15 January, 2015) and supplemented this by contacting relevant study authors, handsearching of music therapy journals and manual searches of reference lists.
Selection criteria
All randomised controlled trials (RCTs) that compared music therapy with standard care, placebo therapy, or no treatment.
Data collection and analysis
Review authors independently selected, quality assessed and data extracted studies. We excluded data where more than 30% of participants in any group were lost to follow‐up. We synthesised non‐skewed continuous endpoint data from valid scales using a standardised mean difference (SMD). We employed a fixed‐effect model for all analyses. If statistical heterogeneity was found, we examined treatment dosage (i.e. number of therapy sessions) and treatment approach as possible sources of heterogeneity.
Main results
Ten new studies have been added to this update; 18 studies with a total 1215 participants are now included. These examined effects of music therapy over the short, medium, and long‐term, with treatment dosage varying from seven to 240 sessions. Overall, most information is from studies at low or unclear risk of bias
A positive effect on global state was found for music therapy compared to standard care (medium term, 2 RCTs, n = 133, RR 0.38 95% confidence interval (CI) 0.24 to 0.59, low‐quality evidence, number needed to treat for an additional beneficial outcome NNTB 2, 95% CI 2 to 4). No binary data were available for other outcomes. Medium‐term continuous data identified good effects for music therapy on negative symptoms using the Scale for the Assessment of Negative Symptoms (3 RCTs, n = 177, SMD ‐ 0.55 95% CI ‐0.87 to ‐0.24, low‐quality evidence). General mental state endpoint scores on the Positive and Negative Symptoms Scale were better for music therapy (2 RCTs, n = 159, SMD ‐0.97 95% CI ‐1.31 to ‐0.63, low‐quality evidence), as were average endpoint scores on the Brief Psychiatric Rating Scale (1 RCT, n = 70, SMD ‐1.25 95% CI ‐1.77 to ‐0.73, moderate‐quality evidence). Medium‐term average endpoint scores using the Global Assessment of Functioning showed no effect for music therapy on general functioning (2 RCTs, n = 118, SMD ‐0.19 CI ‐0.56 to 0.18, moderate‐quality evidence). However, positive effects for music therapy were found for both social functioning (Social Disability Screening Schedule scores; 2 RCTs, n = 160, SMD ‐0.72 95% CI ‐1.04 to ‐0.40), and quality of life (General Well‐Being Schedule scores: 1 RCT, n = 72, SMD 1.82 95% CI 1.27 to 2.38, moderate‐quality evidence). There were no data available for adverse effects, service use, engagement with services, or cost.
Authors' conclusions
Moderate‐ to low‐quality evidence suggests that music therapy as an addition to standard care improves the global state, mental state (including negative and general symptoms), social functioning, and quality of life of people with schizophrenia or schizophrenia‐like disorders. However, effects were inconsistent across studies and depended on the number of music therapy sessions as well as the quality of the music therapy provided. Further research should especially address the long‐term effects of music therapy, dose‐response relationships, as well as the relevance of outcome measures in relation to music therapy.
PICO
Laički sažetak
Glazbena terapija za shizofreniju i poremećaje slične shizofreniji
Istraživačko pitanje
Kakvi su učinci glazbene terapije ili dodatka glazbene terapije liječenju osoba sa shizofrenijom ili poremećajima sličnima shizofreniji?
Dosadašnje spoznaje
Karakteristike shizofrenije i poremećaja sličnih shizofreniji su dezorganizirane misli, osjećaji, uvjerenja i opažanja. Osobe sa shizofrenijom obično imaju dvije glavne skupine simptoma bolesti: akutne simptome u obliku slušnih i vizualnih halucinacija i neobičnih uvjerenja, kao i kronične simptome poput sniženog raspoloženja ili depresije, društvene izolacije i problema s pamćenjem. Glazbena terapija (ili muzikoterapija) terapeutska je metoda koja koristi glazbene doživljaje kako bi pomogla osobama s teškim mentalnim poremećajima da unaprijede svoje emocionalne sposobnosti i odnose s drugim ljudima. Ona pomaže riješiti poteškoće koje se ne bi mogle riješiti uz isključivo korištenje riječi ili govora.
Pretraživanje literature
Proveli smo elektroničko pretraživanje kako bi našli ispitivanja objavljena do siječnja 2015. godine koja su nasumičnim odabirom osobama sa shizofrenijom ili poremećajima sličnima shizofreniji dala ili glazbenu terapiju ili uobičajenu njegu. Pronašli smo i provjerili 176 potencijalnih ispitivanja.
Ključni rezultati
Šest ispitivanja s ukupno 1,215 sudionika zadovoljilo je kriterije ovog sustavnog pregleda i pružilo upotrebljive podatke.
Trenutno dostupni dokazi su niske do umjerene sigurnosti. Rezultati tih ispitivanja pokazali su kako terapija glazbom poboljšava opće stanje pacijenta, uz poboljšanje mentalnog stanja, funkcioniranja i kvalitete života ukoliko je proveden dovoljan broj seansi glazbene terapije.
Zaključci
Čini se da glazbena terapija pomaže osobama sa shizofrenijom, ali potrebna su daljnja istraživanja kako bi se potvrdili pozitivni učinci pronađeni u ovom pregledu. Buduća bi se ispitivanja trebala posebno pozabaviti dugoročnim učincima glazbene terapije, kvalitetom glazbene terapije, a mjeriti i ishode relevantne za glazbenu terapiju.
Authors' conclusions
Summary of findings
| Music therapy compared with standard care for schizophrenia and schizophrenia‐like disorders | ||||||
| Patient or population: People with schizophrenia and schizophrenia‐like disorders Settings: Individual and group setting Intervention: Music therapy (in addition to standard care) Comparison: Standard care alone | ||||||
| Outcomes | Illustrative comparative risks* (95% CI) | Relative effect | No of Participants | Quality of the evidence | Comments | |
| Assumed risk | Corresponding risk | |||||
| Risk with standard care | Risk difference with music therapy | |||||
| Global state: No clinically important overall improvement (as rated by individual trials) ‐ medium term (follow‐up: 3‐6 months) | Low risk population | RR 0.38 (0.24 to 0.59) | 133 | ⊕⊕⊝⊝ | ||
| 300 per 1000 | 114 per 1000 | |||||
| Moderate risk population | ||||||
| 655 per 1000 | 249 per 1000 | |||||
| High risk population | ||||||
| 800 per 1000 | 304 per 1000 | |||||
| Mental state: specific ‐ negative symptoms ‐ average endpoint score (SANS, high score = poor) medium term (follow‐up: 3‐6 months) | The mean mental state: specific ‐ 2. negative symptoms ‐ average endpoint score (SANS, high score = poor) in the intervention groups was 0.55 lower (0.87 lower to 0.24 lower) | 177 | ⊕⊕⊝⊝ | |||
| Mental state: general ‐ average endpoint score (PANSS, high score = poor) ‐ medium term, (follow‐up: 3‐6 months) | The mean mental state: general ‐ 1a. average endpoint score (PANSS, high score = poor) ‐ medium term in the intervention groups was 0.97 lower | 159 | ⊕⊕⊝⊝ | |||
| Mental state: General ‐ average endpoint score (BPRS, high score = poor) ‐ medium term (follow‐up: 3‐6 months) | The mean mental state: general ‐ 1b. average endpoint score (BPRS, high score=poor) in the intervention groups was 1.25 lower | 70 | ⊕⊕⊕⊝ | |||
| Functioning: general ‐ average endpoint score (GAF, high score = good) medium term (follow‐up: 3‐6 months) | The mean general functioning ‐ a. average endpoint score (GAF, high score = good) in the intervention groups was 0.19 lower | 118 | ⊕⊕⊕⊝ | |||
| Functioning: social ‐ average endpoint score (SDSS, high score = poor) medium term, (follow‐up: 3‐6 months) | The mean social functioning: average endpoint score (SDSS, high score = poor) ‐ medium term in the intervention groups was 0.72 lower | 160 | ⊕⊕⊕⊝ | |||
| Quality of life: general ‐ average endpoint score (GWB, high score = good) ‐ short term (follow‐up: less than 3 months) | The mean quality of life: general ‐ average endpoint score (GWB, high score = good) in the intervention groups was 1.82 higher | 72 | ⊕⊕⊕⊝ | |||
| *The basis for the assumed risk (e.g. the median control group risk across studies) is provided in footnotes. The corresponding risk (and its 95% confidence interval) is based on the assumed risk in the comparison group and the relative effect of the intervention (and its 95% CI). | ||||||
| GRADE Working Group grades of evidence | ||||||
| 1 Risk of bias ‐ limitations in study design such as poorly reported randomisation, allocation concealment, blinding or unclear outcome reporting. 2 Inconsistency ‐ heterogeneity between studies was high. 3 Imprecision ‐ the optimal information size is lower than 300 events. 4 Large effect ‐ RR < 0.5 5 Large effect ‐ the effect was in the large range according to Cohen 1988. | ||||||
Background
Description of the condition
Schizophrenia is a serious mental disorder with considerable impact on individuals and their families. It may take a life‐long course, although full recovery is also observed in a proportion of cases. Symptoms of schizophrenia are usually classified as 'positive' (where something is added, such as hallucinations or paranoid ideation) and 'negative' (where something is missing, such as the ability to express oneself emotionally or to form satisfying relationships with others). The aspects of schizophrenia that are linked to losing and regaining creativity, emotional expressiveness, social relationships, and motivation may be particularly important in relation to music therapy (Gold 2009).
Description of the intervention
Music therapy is generally defined as "a systematic process of intervention wherein the therapist helps the client to promote health, using music experiences and the relationships that develop through them as dynamic forces of change (Bruscia 1998)." It often addresses intra‐ and interpsychic, as well as social processes by using musical interaction as a means of communication, expression, and transformation. Within the area of serious mental disorders, the aim of the therapy is to help people improve their emotional and relational competencies, and to address issues they may not be able to using words alone.
Music therapy as a profession (with its own academic and clinical training courses) was first introduced in North and South America in the 1940s. The first European country (Austria) followed in 1959, and soon after that many other countries followed (Maranto 1993). It is now a state‐registered profession in some countries (Austria, Latvia, UK). A survey based in Germany showed that music therapy was used in 37% of all psychiatric and psychosomatic clinics (Andritzky 1996).
Music therapy models practised today are most commonly based on psychodynamic, humanistic, cognitive behavioural or developmental theory (Gold 2009; Wigram 2002). Traditionally, behavioural models have been more prevalent in the USA, whereas psychodynamic and humanistic models have dominated in Europe; in other parts of the world there may be mixed influences. However, the various theoretical models in music therapy and their applications do not necessarily form distinct categories, but rather prototypical positions in a varied but coherent field.
Other than by their theoretical orientation, approaches in music therapy may also be described by their modality ('active' versus 'receptive'), their level of structure, and the focus on the music itself versus on verbal processing of the music experiences. The active modality includes all activities where clients are invited to play or sing. This includes a variety of activities ranging from free improvisation to reproducing songs. Receptive techniques, on the other hand, refer to clients listening to music; this may be played by the therapist for the client, or recorded music may be selected by either therapist or client. Although some models of music therapy rely exclusively on one mode of musical interaction, most models use a mixture of both.
Secondly, the level of predefined structuring may vary. Some therapists may impose a greater degree of structure than others, either by using more structured forms of music‐making or by selecting activities before the sessions, as opposed to developing these in dialogue with the client. The level of structuring may depend on the client's needs, but may also vary between music therapy models. For example, it has been observed that there are considerable differences between American and European approaches in the level of structuring (Wigram 2002). A recent review concluded that extreme positions were rarely observed and most studies used some structure as well as some flexibility (Gold 2009). A third relevant distinction concerns the focus of attention. Some music therapists and music therapy models may focus more on the processes occurring within the music itself, whereas others have a greater focus on the verbal reflection of the client's issues brought forth by these musical processes (Gold 2009).
In summary, music therapy for people with serious mental disorders often relies on a mixture of active and receptive techniques, even though musical improvisation and verbalisation of the musical interaction are often central. Music therapists working in clinical practice with this population usually have extensive training. Music therapy with patients in mental health care is usually provided either in an individual or a small group setting and is often continued over an extended period of time (Wigram 1999). Active participation is crucial for the success of music therapy. Participants do not need musical skills, but a motivation to work actively within a music therapy process is important.
How the intervention might work
Music therapy is often justified by a proposed need for a medium for communication and expression other than verbal language. Some people with serious mental disorders may be too disturbed to use verbal language alone efficiently as a therapeutic medium. Research on parent‐infant communication is often cited as a rationale for using music therapy; this body of research has shown that the earliest communication that humans develop has many 'musical' qualities (Ansdell 2010a; Stern 2010; Trevarthen 2000). More pragmatically, clinical reports have suggested that music therapy can have unique motivating, relationship‐building, and emotionally expressive qualities that may help even those who do not benefit from verbal therapy (Rolvsjord 2001; Solli 2008). The musical interaction in music therapy might also support a re‐establishment of musical resources and competencies affecting the patient's everyday life. This has been described from a patient perspective as an important factor in music therapy increasing quality of life (Ansdell 2010b).
Why it is important to do this review
In its early years, music therapy was established in selected hospitals, by enthusiastic individuals (Mössler 2011a), on the basis of successful case histories. The degree to which music therapy is available still varies greatly across and even within countries. As music therapy is becoming more established as a profession and as a service in mental health care, the need for documented evidence of its effects increases.
Objectives
To review the effects of music therapy, or music therapy added to standard care, compared with placebo therapy, standard care or no treatment for people with serious mental disorders such as schizophrenia.
Methods
Criteria for considering studies for this review
Types of studies
All relevant randomised controlled trials (RCTs). If a trial was described in a way that implied that the study was randomised, we included such trials in a sensitivity analysis. If there was no substantive difference within primary outcomes (see Types of outcome measures) when these 'implied randomisation' studies were added, then we included them in the final analysis. If there was a substantive difference, we only used randomised trials and we described the results of the sensitivity analysis in the text. We excluded quasi‐randomised studies, such as those allocating by using alternate days of the week.
Types of participants
People with schizophrenia or schizophrenia‐like disorders, diagnosed by any criteria, irrespective of gender, age or nationality.
Types of interventions
1. Music therapy or music therapy added to standard care
Music therapy is defined as "a systematic process of intervention wherein the therapist helps the client to promote health, using music experiences and the relationships that develop through them as dynamic forces of change" (Bruscia 1998). This definition of music therapy is rather broad and inclusive of different models, but distinguishes clearly from music listening alone: for it to be music therapy, there has to be a therapist, and the client‐therapist relationship as well as the music experience are relevant factors.
2. Placebo
Defined as an alternative therapy designed to control for effects of the therapist's attention.
3. Standard care or no treatment
Types of outcome measures
Where possible, we reported outcomes for the short term (up to 12 weeks), medium term (13 to 26 weeks), and long term (more than 26 weeks).
Primary outcomes
There is currently no consensus as to what should be the primary outcomes of music therapy for people with schizophrenia. Goals described by music therapists tend to describe 'soft' outcomes such as well‐being, self‐esteem, the ability to express oneself and to relate to others, or a sense of identity; outcomes such as overall symptom reduction or improved general functioning seem to be only indirectly related to those goals. However, symptom‐related outcomes are most commonly measured in research studies. Notably, measures of negative symptoms include impairments in the ability to express oneself and to relate to others, but also include other domains. Because of the importance to people with schizophrenia we regard the following as primary outcomes.
1. Global state
1.1 Clinically important change in global state ‐ as defined by individual studies
2. Mental state
2.1 Clinically important change in general mental state ‐ as defined by individual studies
2.2 Clinically important change in specific symptoms: negative symptoms ‐ as defined by individual studies
3. Functioning
3.1 Clinically important change in general functioning ‐ as defined by individual studies
3.2 Clincially important change in social functioning ‐ as defined by individual studies
Secondary outcomes
A more comprehensive and general list of relevant outcomes has been defined by the Cochrane Schizophrenia Group as follows. Most of these outcomes and their particular sub‐categories are defined as secondary outcomes for this review.
1. Global state
1.1 Relapse
1.2 Time to relapse
1.3 Any change in global state
1.4 Average endpoint global state score
1.5 Average change in global state scores
1.6 Change in medication dose
2. Mental state
2.1 Any change in general mental state
2.2 Average endpoint general mental state score
2.3 Average change in general mental state scores
2.4 Clinically important change in other specific symptoms (e.g. positive, cognitive)
2.5 Any change in specific symptoms
2.6 Average endpoint specific symptom score
2.7 Average change in specific symptom scores
3. Functioning
3.1 General
3.1.1 Any change in general functioning
3.1.2 Average endpoint general functioning score
3.1.3 Average change in general functioning scores
3.2 Specific
3.2.1 Clinically important change in other specific aspects of functioning (such as cognitive functioning or life skills)
3.2.2 Any change in specific aspects of functioning (such as cognitive functioning, social functioning or life skills)
3.2.3 Average endpoint specific aspects of functioning (such as cognitive functioning, social functioning or life skills)
3.3.4 Average change in specific aspects of functioning (such as cognitive functioning, social functioning or life skills)
4. Leaving the study early
4.1 For specific reasons
4.2 For general reasons
5. Service outcomes
5.1 Hospitalisation
5.2 Time to hospitalisation
6. Behaviour
6.1 Clinically important change in general behaviour
6.2 Any change in general behaviour
6.3 Average endpoint general behaviour score
6.4 Average change in general behaviour scores
6.5 No clinically important change in specific aspects of behaviour
6.6 Not any change in specific aspects of behaviour
6.7 Average endpoint specific aspects of behaviour
6.8 Average change in specific aspects of behaviour
7. Adverse effects/event
7.1 Clinically important general adverse effects
7.2 Any general adverse effects
7.3 Average endpoint general adverse effect score
7.4 Average change in general adverse effect scores
7.5 Clinically important change in specific adverse effects
7.6 Any change in specific adverse effects
7.7 Average endpoint specific adverse effects
7.8 Average change in specific adverse effects
7.9 Adverse event: death (suicide or natural causes)
8. Engagement with services
8.1 Clinically important engagement
8.2 Any engagement
8.3 Average endpoint engagement score
8.4 Average change in engagement scores
9. Satisfaction with treatment
9.1 Recipient of care satisfied with treatment
9.2 Recipient of care average satisfaction score
9.3 Recipient of care average change in satisfaction scores
9.4 Carer satisfied with treatment
9.5 Carer average satisfaction score
9.6 Carer average change in satisfaction scores
10. Quality of life
10.1 Clinically important change in quality of life
10.2 Any change in quality of life
10.3 Average endpoint quality of life score
10.4 Average change in quality of life scores
10.5 Clinically important change in specific aspects of quality of life
10.6 Any change in specific aspects of quality of life
10.7 Average endpoint specific aspects of quality of life
10.8 Average change in specific aspects of quality of life
11. Economic outcomes
11.1 Direct costs
11.2 Indirect costs
'Summary of findings' table
We used the GRADE approach to interpret findings (Schünemann 2011). A 'Summary of findings' table was created using the GRADE profiler into which data were imported from RevMan. This table provides outcome‐specific information concerning the overall quality of evidence from each included study and the magnitude of effect of the interventions examined. Available data on those outcomes that we rated as most important regarding patient‐care and decision making are presented in this table. We selected the following main outcomes for inclusion in the summary of findings Table for the main comparison.
-
Global state: no clinically important overall improvement
-
Mental state: specific ‐ negative symptoms
-
Mental state: general mental state
-
General functioning
-
Social functioning
-
Quality of Life
Search methods for identification of studies
1. Cochrane Schizophrenia Group’s Trials Register
On January 15, 2015, the Information Specialist searched the Cochrane Schizophrenia Group’s Study‐Based Register of Trials using the following search strategy:
(*music*) in Intervention Field of STUDY.
The Cochrane Schizophrenia Group’s Registry of Trials is compiled by systematic searches of major resources (including AMED, BIOSIS, CINAHL, Embase, MEDLINE, PsycINFO, PubMed, and registries of clinical trials) and their monthly updates, handsearches, grey literature, and conference proceedings (see Group Module). There is no language, date, document type, or publication status limitations for inclusion of records into the register.
For previous searches, please see Appendix 1.
2. Handsearching
We searched the three American music therapy journals (Journal of Music Therapy, Music Therapy and Music Therapy Perspectives) as reissued on CD‐ROM by the American Music Therapy Association using the search term random* and then manually browsing through the results. The search covered the Journal of Music Therapy (1964‐1998), Music Therapy (1981‐1996) and Music Therapy Perspectives (1982‐1984, 1986‐1998).
3. Reference searching
We also inspected the references of all identified studies, included or excluded, for more studies.
4. Personal contact
We contacted corresponding authors of relevant reviews or studies to enquire about other sources of relevant information.
5. Review articles
We inspected existing review articles pertinent to the topic of this review (Oerter 2001; Silverman 2003b) for references to any additional studies.
6. Cited reference search (forward search)
We searched ISI Web of Science for articles citing any of the included studies, in order to identify any more recent studies that might have been missed.
Data collection and analysis
We have updated our methods in line with current Cochrane policy. For previous data collection and analysis methods please see Appendix 2. We have now for the most part adhered to the current template as provided by the Cochrane Schizophrenia Group (CSG). Substantial deviations from the template, in line with our protocol and previous review versions, are:
-
definite exclusion of therapist‐rated scales, rather than vague statement about possible exclusion (Data extraction and management);
-
exclusion of skewed data that cannot be transformed, rather than presenting skewed data from studies of less than 200 participants in additional tables (Data extraction and management);
-
use of standardised mean differences (SMDs) rather than mean differences (MDs) (Measures of treatment effect);
-
subgroups to be analysed (Subgroup analysis and investigation of heterogeneity).
Selection of studies
Review authors XJC, TOH, and KM independently inspected citations from the searches and identified relevant abstracts. Review author XJC first inspected study reports written in Chinese and then translated relevant sections. Those translated sections were then re‐inspected by CG, TOH and KM to ensure reliability. Where disputes arose, we acquired the full report for more detailed scrutiny. If citations met the inclusion criteria, we obtained full reports of the papers for more detailed inspection. Where it was not possible to resolve disagreement by discussion, we attempted to contact authors of the study for clarification.
Data extraction and management
1. Extraction
Review authors XJC, KM, and MG extracted data from all included studies. Any disagreement was discussed and review author CG helped to clarify any ongoing problems. We extracted data presented only in graphs and figures whenever possible, but we only included the data if two review authors independently had the same result. We reported all decisions and, if necessary, we contacted the authors of studies through an open‐ended request in order to obtain missing information or for clarification. If multi‐centre studies had been included, we would have extracted data relevant to each component centre separately where possible.
2. Management
We extracted data onto standard, simple forms. The emergence of studies with mixed samples (including eligible and non‐eligible participants) in the present update necessitated an additional decision rule. We decided to include such studies only if (i.) individual patient data or group data for the eligible subsample were available to us; (ii.) the number of eligible participants was at least as high as the sample of the smallest study with a non‐mixed sample; and (iii.) outcomes were relevant to schizophrenia (as judged by their use also in at least one non‐mixed sample).
2.1 Scale‐derived data
We included continuous data from rating scales only if:
a. the psychometric properties of the measuring instrument have been described in a peer‐reviewed journal (Marshall 2000); and
b. the measuring instrument has not been written or modified by one of the trialists for that particular trial.
To be considered in this review, the measuring instrument should either be i. a self‐report or ii. completed by an independent rater or relative (not the therapist). We realise that this is not often reported clearly. Therefore, detailed information on this was provided in the Characteristics of included studies section.
2.2 Endpoint versus change data
There are advantages of both endpoint and change data. Change data can remove a component of between‐person variability from the analysis. On the other hand, calculation of change needs two assessments (baseline and endpoint), which can be difficult to measure in unstable conditions such as schizophrenia. We decided primarily to use endpoint data, and would have used change data if the former had not been available.
2.3 Skewed data
Continuous data on clinical and social outcomes are often not normally distributed. To avoid the pitfall of applying parametric tests to non‐parametric data, we aimed to apply the following standards to all data before inclusion: a) standard deviations (SDs) and means were reported in the paper or were obtainable from the authors; b) when a scale starts from a finite number (such as zero), the SD, when multiplied by two, was less than the mean (as otherwise the mean was unlikely to be an appropriate measure of the centre of the distribution, (Altman 1996); c) if a scale started from a positive value (such as the Positive and Negative Symptoms Scale (PANSS, Kay 1986) which can have values from 30 to 210), the calculation described above was modified to take the scale starting point into account. In these cases skewness was present if 2 SD > (S‐S min), where S is the mean score and S min is the minimum score. Endpoint scores on scales often have a finite start and endpoint and these rules can be applied. When continuous data are presented on a scale that includes a possibility of negative values (such as change data), it is difficult to tell whether data are skewed or not. When individual patient data were available, we attempted to remove skewness through log‐transformation. Where this was not possible, we did not consider skewed data in this review.
2.4 Common measure
To facilitate comparison between trials, we would have converted variables that can be reported in different metrics, such as days in hospital (mean days per year, per week or per month) to a common metric (e.g. mean days per month).
2.5 Conversion of continuous to binary
Where possible, we made efforts to convert outcome measures to dichotomous data. This can be done by identifying cut‐off points on rating scales and dividing participants accordingly into 'clinically improved' or 'not clinically improved'. It is generally assumed that if there is a 50% reduction in a scale‐derived score such as the Brief Psychiatric Rating Scale (BPRS, Overall 1962) or the PANSS (Kay 1986), this could be considered as a clinically significant response (Leucht 2005; Leucht 2005a). If data based on these thresholds were not available, we used the primary cut‐off presented by the original authors.
2.6 Direction of graphs
We entered data in such a way that the area to the left of the line of no effect indicated a favourable outcome for music therapy when the outcome was negative (where 'high' means 'poor'), and reversed for positive outcomes (where 'high' means 'good').
Assessment of risk of bias in included studies
Review authors XJC and KM independently assessed the risk of bias for evaluating trial quality by using criteria described in the Cochrane Handbook for Systematic Reviews of Interventions (Higgins 2011). This set of criteria is based on evidence of associations between overestimate of effect and high risk of bias of the article such as sequence generation, allocation concealment, blinding, incomplete outcome data, and selective reporting. If the raters disagreed, we made the final rating by consensus with the involvement of CG. Where inadequate details of randomisation and other characteristics of trials were provided, we contacted the authors of the studies in order to obtain further information. We reported non‐concurrence in quality assessment, but if disputes arose as to which category a trial was to be allocated, again, we resolved this by discussion. We noted the level of risk of bias in both the text of the review and in the summary of findings Table for the main comparison.
Measures of treatment effect
1. Binary data
For binary outcomes, we calculated a standard estimation of the fixed‐effect risk ratio (RR) and its 95% confidence interval (CI). It has been shown that RR is more intuitive (Boissel 1999) than odds ratios and that odds ratios tend to be interpreted as RR by clinicians (Deeks 2000). For statistically significant results, we calculated the number needed to treat for an additional beneficial outcome (NNTB) and the number needed to treat for an additional harmful outcome (NNTH), and its 95% CI taking account of the event rate in the control group.
2. Continuous data
For continuous outcomes, we estimated standardised mean differences (SMD) between groups. As standardised measures of effect size, these are often more readily interpretable than mean differences (MDs) on the original scale, particularly when the scale is not universally well‐known (Cohen 1988; Gold 2004). However, we also transformed the effect size back to the units of one or more of the specific instruments to further aid interpretation and to ensure comparability across schizophrenia reviews.
Unit of analysis issues
1. Cluster trials
Studies may employ 'cluster randomisation' (such as randomisation by clinician or practice), but analysis and pooling of clustered data poses problems. Authors often fail to account for intra‐class correlation in clustered studies, leading to a 'unit of analysis' error (Divine 1992) where P values are spuriously low, CIs unduly narrow and statistical significance overestimated causing type I errors (Bland 1997; Gulliford 1999).
Although no cluster trials were identified for this review, the planned procedure for analysis would have been as follows. Where clustering was not accounted for in primary studies, we would have presented the data in a table, with an (*) symbol to indicate the presence of a probable unit of analysis error. We would have attempted to contact the first authors of studies to seek intra‐class correlation coefficients (ICCs) of their clustered data and to adjust for this using accepted methods (Gulliford 1999). If the intra‐class correlation was not available, we would have used an external estimate from similar studies (Higgins 2008). If clustering had been incorporated into the analysis of primary studies, we would have presented these data as if from a non‐cluster randomised study, but adjusted for the clustering effect.
We have sought statistical advice and have been advised that the binary data as presented in a report should be divided by a 'design effect'. This would have been calculated using the mean number of participants per cluster (m) and the (ICC) [Design effect=1+(m‐1)*ICC] (Donner 2002). If the ICC was not reported it would have been assumed to be 0.1 (Ukoumunne 1999).
If cluster studies had been appropriately analysed taking into account ICCs and relevant data documented in the report, synthesis with other studies would have been possible using the generic inverse variance technique.
2. Cross‐over trials
A major concern of cross‐over trials is the carry‐over effect. It occurs if an effect (e.g. pharmacological, physiological or psychological) of the treatment in the first phase is carried over to the second phase. As a consequence, on entry to the second phase the participants can differ systematically from their initial state despite a wash‐out phase. For the same reason cross‐over trials are not appropriate if the condition of interest is unstable (Elbourne 2002). As both effects are very likely in severe mental illness, had we included such trials, we would only have used data from the first phase of cross‐over studies.
3. Studies with multiple treatment groups
Where a study involved more than two treatment arms, if relevant, we presented the additional treatment arms in comparisons. If data were binary, we simply added and combined the data within the two‐by‐two table. If data were continuous, we combined data following the formula in section 7.7.3.8 (Combining groups) of the Cochrane Handbook for Systematic Reviews of Interventions. Where the additional treatment arms were not relevant, we did not reproduce these data.
Dealing with missing data
1. Overall loss of credibility
At some degree of loss of follow‐up, data must lose credibility (Xia 2009). We excluded data from studies where more than 30% of participants in any group were lost to follow‐up (this did not include the outcome of 'leaving the study early'). If, however, more than 30% of those in one arm of a study were lost, but the total loss was less than 30%, we marked such data with (*) to indicate that such a result may well be prone to bias.
2. Binary
In the case where attrition for a binary outcome was between 0% and 30% and where these data were not clearly described, we presented data on a 'once‐randomised‐always‐analyse' basis (an intention‐to‐treat analysis). In studies with less than 30% dropout rate, people leaving early were considered to have had the negative outcome for dichotomous outcomes, except for the event of death and adverse effects. For these outcomes, the rate of those who stayed in the study ‐ in that particular arm of the trial ‐ would have been used for those who did not. We analysed the impact of including studies with high attrition rates (20% to 30%) in a sensitivity analysis. If inclusion of data from this latter group did result in a substantive change in the estimate of effect, we did not add these data to trials with less attrition but presented them separately.
3. Continuous
3.1 Attrition
In the case where attrition for a continuous outcome was between 0% and 30% and completer‐only data were reported, we reproduced these.
3.2 Standard deviations
If SDs were not reported in the original studies, we tried to obtain the missing values from the authors. In cases where measures of variance for continuous data were missing, but an exact standard error (SE) and CIs were available for group means and either P or t values were available for differences in mean, we would have made calculations according to the rules described in the Cochrane Handbook for Systematic Reviews of Interventions (Higgins 2011): When only the SE is reported, SDs are calculated by the formula SD = SE * square root (n).Chapters 7.7.3 and 16.1.3 of the Cochrane Handbook for Systematic Reviews of Interventions (Higgins 2011) present detailed formulae for estimating SDs from P values, t or F values, CIs, ranges or other statistics. If these formulae did not apply, we calculated or estimated the SDs according to a validated imputation method which is based on the SDs of the other included studies (Furukawa 2006). Although some of these imputation strategies can introduce error, the alternative would be to exclude a given study’s outcome and thus to lose information. We nevertheless would have examined the validity of the imputations in a sensitivity analysis excluding imputed values.
3.3 Last observation carried forward
We anticipated that in some studies the method of last observation carried forward (LOCF) would be employed within the study report. As with all methods of imputation to deal with missing data, LOCF introduces uncertainty about the reliability of the results (Leucht 2007). Therefore, where LOCF data had been used in the trial, if less than 30% of the data had been assumed, we would have reproduced these data and indicated that they were the product of LOCF assumptions.
Assessment of heterogeneity
1. Clinical heterogeneity
We considered all included studies initially, without seeing comparison data, to judge clinical heterogeneity. We simply inspected all studies for outlying people or situations which we had not predicted would arise. When such situations or participant groups arose, we discussed them fully.
2. Methodological heterogeneity
We considered all included studies initially, without seeing comparison data, to judge methodological heterogeneity. We simply inspected all studies for clearly outlying methods which we had not predicted would arise. When such methodological outliers arose, we discussed them fully.
3. Statistical heterogeneity
3.1. Visual inspection
We visually inspected graphs to investigate the possibility of statistical heterogeneity.
3.2 Employing the I2 statistic
We supplemented the visual inspection primarily by employing the I2 statistic alongside the Chi2 P value. This provides an estimate of the percentage of inconsistency thought to be due to chance (Higgins 2003). The importance of the observed value of I2 depends on i. magnitude and direction of effects and ii. strength of evidence for heterogeneity (e.g. a P value from Chi2 test, or a CI for I2). We interpreted an I2 estimate greater than or equal to around 50% accompanied by a statistically significant Chi2 statistic as evidence of substantial levels of heterogeneity (Higgins 2011). When substantial levels of heterogeneity were found in the primary outcome, we explored reasons for heterogeneity (Subgroup analysis and investigation of heterogeneity).
Assessment of reporting biases
We entered data from all included studies into a funnel graph (trial effect against trial size) in an attempt to investigate the likelihood of overt publication bias (Davey Smith 1997). Reporting biases arise when the dissemination of research findings is influenced by the nature and direction of results (Egger 1997). These are described in Section 10 of the Cochrane Handbook for Systematic Reviews of Interventions (Higgins 2011). We are aware that funnel plots may be useful in investigating reporting biases but are of limited power to detect small‐study effects. We did not use funnel plots for outcomes where there were 10 or fewer studies, or where all studies were of similar sizes. In other cases, where funnel plots were possible, we would have sought statistical advice in their interpretation.
Data synthesis
We understand that there is no closed argument for preference for use of fixed‐effect or random‐effects models. The random‐effects method incorporates an assumption that the different studies are estimating different, yet related, intervention effects. This often seems to be true to us and the random‐effects model takes into account differences between studies, even if there is no statistically significant heterogeneity. There is, however, a disadvantage to the random‐effects model. It puts added weight onto small studies which often are the most biased ones. Depending on the direction of effect, these studies can either inflate or deflate the effect size. We chose fixed‐effect model for all analyses.
Subgroup analysis and investigation of heterogeneity
1. Subgroups
We anticipated no subgroup analyses.
2. Investigation of heterogeneity
If we found heterogeneity (see under Assessment of heterogeneity), we examined the following possible sources of heterogeneity:
-
treatment dosage (20 sessions or more versus less than 20 sessions); and
-
treatment approach (quality of music therapy method and training).
Sensitivity analysis
We planned to investigate the effect of including studies with high attrition rates on the primary outcomes, but no such studies were identified in this review. We did however compare the results when we included our assumptions regarding those lost to follow‐up (see Dealing with missing data) with 'completer only' analyses.
Results
Description of studies
Results of the search
The search for the first published version identified 34 potentially relevant studies (Gold 2005a). Updated searches for the version published in 2011 yielded 115 additional records (from 99 studies) for a total of 149 records (Mössler 2011b). The search for the current update yielded 31 new records for a total of 176 records. After excluding duplicates and clearly irrelevant references, a total of 115 studies (31 new for the current update) were inspected closely for possible inclusion. Of these, we included a total of 18 studies (Characteristics of included studies) and excluded 97 studies (Characteristics of excluded studies); no ongoing studies were identified (Figure 1).

Study flow diagram (all searches)
Included studies
We included 18 studies (1215 participants) that compared music therapy added to standard care with standard care alone (Ceccato 2009; Cha 2012; Chang 2013; Fu 2013; Gold 2013; He 2005; Li 2007a; Liu 2013; Lu 2013; Mao 2013; Mohammadi 2012; Qu 2012; Talwar 2006; Tang 1994; Ulrich 2007; Wang 2013; Wen 2005; Yang 1998). The characteristics of these studies are described below (see also Additional tables 'Music therapeutic approach' and Characteristics of included studies).
1. Length of trials
The duration of studies varied from one to six months. Ten studies examined the short‐term effects of music therapy over about one to one‐and‐a‐half months (Cha 2012; Chang 2013; Fu 2013; He 2005; Li 2007a; Lu 2013; Mohammadi 2012; Tang 1994; Ulrich 2007; Wen 2005). Seven trials investigated medium‐term effects over three to four months (Ceccato 2009; Gold 2013; Liu 2013; Qu 2012; Talwar 2006; Wang 2013; Yang 1998). Two studies (Gold 2013; Mao 2013) examined the long‐term effects of music therapy over six to nine months.
2. Participants
All studies included adults with schizophrenia or related psychoses. The included studies differed somewhat with respect to diagnostic heterogeneity. Three studies included people with schizophrenia as well as people with related psychoses (Gold 2013; Talwar 2006; Ulrich 2007). The other 15 trials were more restrictive, allowing only people with schizophrenia (Ceccato 2009; Cha 2012; Chang 2013; Fu 2013; Li 2007a; Lu 2013; Mao 2013; Mohammadi 2012; Qu 2012; Wen 2005), or only a certain subtype of schizophrenia (chronic: Liu 2013; Tang 1994; Wang 2013; Yang 1998; type II: He 2005). People with acute positive symptoms were also excluded by Ulrich 2007. Diagnosis was based on three different psychiatric classification systems primarily used in the Western world (International Classification of Diseases (ICD), Diagnostic and Statistical Manual of Mental Disorders (DSM)) and China (Chinese Classification of Mental Disorders (CCMD)). The CCMD is similar in categorisation and structure to the ICD and DSM in terms of most diagnostic items, though acknowledging cultural‐related differences (Lee 2001). ICD‐10 was used in Ceccato 2009, Fu 2013, Gold 2013, Talwar 2006, and Ulrich 2007; Tang 1994 referred to the DSM‐III‐R; Cha 2012, Lu 2013, and Mohammadi 2012 referred to the DSM‐IV. The CCMD‐2 was used in Yang 1998, and the current third version of the CCMD was used as classification system in Chang 2013, He 2005, Li 2007a, Liu 2013, Mao 2013, Qu 2012, Wang 2013, and Wen 2005.
History of the disorder was reported in nine of the studies (Chang 2013: mean 6.6 years; Fu 2013: mean 3.6 years; He 2005: around nine years; Liu 2013: mean 9.7 years; Lu 2013: mean 25.0 years; Mao 2013: mean 1.8 years; Qu 2012: range 2.2 to 5 years; Wang 2013: mean 13.6 years; Yang 1998: range two to 26 years).
One study targeted a broader population of mental healthcare clients (Gold 2013); low motivation was the main inclusion criterion. Although we did include the study in the review, we examined its results separately from the other studies that were specifically targeted at schizophrenia or related psychoses.
3. Setting
Sixteen studies concerned inpatients. Ceccato 2009 and Gold 2013, however, included both in‐ and outpatients.
4. Study size
Sample sizes (of participants meeting inclusion criteria for this review) ranged from 30 to 96.
5. Interventions
5.1 Setting
All studies compared music therapy added to standard care with standard care alone. The setting of music therapy was group therapy in most of the studies; two studies (Gold 2013; Talwar 2006) used an individual setting, while two others (Wang 2013; Yang 1998) used a combination of group and individual settings.
Music therapy varied according to the use of active and receptive methods, level of structure, focus of discussions and verbal reflection. In five studies, the content of music therapy included receptive working modalities (listening to music) (Ceccato 2009; Cha 2012; He 2005; Li 2007a; Wen 2005). Four trials included exclusively active music making (improvisation, singing) (Fu 2013; Qu 2012; Talwar 2006; Ulrich 2007), and the remaining nine made use of both active and receptive ingredients (Chang 2013; Gold 2013; Liu 2013; Lu 2013; Mao 2013; Mohammadi 2012; Tang 1994; Wang 2013; Yang 1998). For all trials, except for Ceccato 2009 and Mohammadi 2012, the musical experiences were described as being accompanied by a discussion or verbal reflection of therapy contents. The focus of discussions and level of structure varied between patients, depending on their ability level (explicitly mentioned in Ulrich 2007). There was variation in music therapy methods including process‐oriented approaches and more fixed‐session structures, but overall, all were within the accepted range. There was more worrisome variation in music therapy training (Table 1; see also below: Other potential sources of bias).
| No. of | Adequate | Adequate | Modality | Form of therapy | Therapy | ||||||
| Improvisation | Playing and/or singing pre‐ | Songwriting | Listening | Verbal | Others | ||||||
| Max. 16 (1/week over 4 months) | Yes | Yes | Receptive | No | No | No | Central | No | No | Fixed structure | |
| Max. 12 (3/week over 4 weeks) | Yes | Unclear | Receptive | No | No | No | Yes | Yes | Music memory; Music imagery | Process‐oriented | |
| Max. 40 (5/week over 8 weeks) | Yes | Yes | Both | No | Yes | Yes | Yes | Yes | Music memory; improvisation; Musical psychodrama | Fixed structure | |
| Max. 12 (3/week over 4 weeks) | Yes | Unclear | Active | Yes | Yes | No | No | Yes | No | Fixed structure | |
| 18 sessions received | Yes | Yes | Both | Yes | Yes | Yes | Yes | Yes | No | Process‐oriented | |
| Max. 30 | Yes | Unclear | Receptive | No | No | No | Central | Yes | Dancing, reading poems with music background | Unclear | |
| Max. 30 | Yes | Unclear | Receptive | No | No | No | Central | Yes | No | Unclear | |
| Max. 32 (2/week over 16 weeks) | Yes | Limited | Both | No | Yes | No | Yes | Yes | Recreative music therapy, Orff music therapy | Unclear | |
| Max. 10 (2/week over 5 weeks) | Yes | Yes | Both | No | Yes | No | Yes | Yes | Playing percussion instruments, watching music videos | Unclear | |
| Max. 240 (2/day, 5 days/week, over 6 months) | Unclear | Limited | Both | No | Yes | No | Yes | Yes | Music theory class, instrument playing, music appreciation | Unclear | |
| Max. 5 (weekly sessions/one month) | Yes | Unclear | Both | Yes | Yes | No | Yes | No | Making bodily movements according to the rhythm of the music | Unclear | |
| Max. 224 (2/day, over 16 weeks) | Unclear | Limited | Both | No | Yes | No | Yes | Yes | Music appreciation | Unclear | |
| Max. 12 sessions (1/week over 3 months) | Yes | Yes | Active | Central | Yes | No | No | Central | No | Process‐ | |
| 19 sessions received | Yes | Unclear | Both | Yes | Yes | No | Central | Yes | No | Fixed structure | |
| 7.5 sessions received | Yes | Yes | Active | Yes | Yes | No | No | Yes | No | Process‐ | |
| Max. 36 (3/week, over 3 months) | Unclear | Limited | Both | Yes | Yes | No | Yes | Yes | Musical appreciation, rhythm training | Unclear | |
| Max. 30 | Yes | Unclear | Receptive | No | No | No | Central | Yes | Dancing | Unclear | |
| Max. 78 (6/week over 3 months) | Yes | Yes | Both | Yes | Yes | No | Yes | Yes | Learning musicology | Unclear | |
Adequate music therapeutic method: A "yes" indicates that the method applied considered both musical experiences and relational aspects as dynamic forces of change in music therapy. A "no" indicates that relational aspects are missing.
Adequate music therapy training: A "yes" indicates that the persons conducting the music therapy have attended an appropriate music therapy training. A "no" indicates that the person conducting the music therapy had limited or even no music therapy training.
The number of sessions per week varied greatly from one (Talwar 2006) to six (Yang 1998). Where not explicitly stated, we calculated the maximum possible number of sessions received by patients from session frequency and treatment duration. The overall number of sessions offered was below 20 in seven studies which according to the a priori criteria for this review can be classified as low dosage of music therapy; in 10 studies, 20 or more studies were offered, corresponding to a high dosage; for three of these, numbers of sessions offered were much higher than in other studies (a total of 78 in Yang 1998, up to 160 in Qu 2012, and up to 240 in Mao 2013). The actual number of sessions received, however, could have been less: Talwar 2006 reported that only 58% of all participants received more than eight sessions. In one study (Cha 2012), the number of sessions offered was not reported.
There was also considerable variation in the total duration of therapy (from one to six months). Ten of the studies can be classified as short‐term music therapy (up to 12 weeks) (Cha 2012; Chang 2013; Fu 2013; He 2005; Li 2007a; Lu 2013; Mohammadi 2012; Tang 1994; Ulrich 2007; Wen 2005), seven studies as medium‐term music therapy (13 to 26 weeks) (Ceccato 2009; Gold 2013; Liu 2013; Qu 2012; Talwar 2006; Wang 2013; Yang 1998), and one (Mao 2013) as long‐term music therapy (six months).
6. Outcomes
This section describes the outcomes used in the included studies, categorised according to the list of relevant outcomes in the Methods section.
6.1 Global state
Global overall improvement, as judged by independent assessors, was rated as clinically important improvement versus no such improvement (Gold 2013; Yang 1998).
6.2 Mental state
6.2.1 General mental state
a. Positive and Negative Symptoms Scale ‐ PANSS (Kay 1987)
The PANSS scale was designed to address the severity of psychopathology in patients with psychotic disorders. It consists of 30 items which belong to three subscales: positive symptoms, negative symptoms, and general psychopathology. Ratings are based on a clinical interview and additional information from caregivers or family members and clinical material. Each item is scored on a seven‐point Likert scale.
b. Brief Psychiatric Rating Scale ‐ BPRS (Overall 1988)
The BPRS scale is a clinician‐rated tool designed to address severity of psychopathology in patients with psychotic disorders as well as those with severe mood disorders. The 18 items of the scale include common psychotic symptoms as well as mood disturbances. The scale is administered by an experienced clinician based on a clinical interview and observation of the patient. The items are scored on a seven‐point Likert scale.
6.2.2 Negative symptoms
Scale for the Assessment of Negative Symptoms ‐ SANS (Andreasen 1982)
The SANS is a clinician‐rated instrument used to rate the presence and severity of negative symptoms, including affective flattening and blunting, alogia, avolition‐apathy, anhedonia‐associality, and attentional impairment. It consists of 20 items which are rated by trained raters using a clinical interview and additional collateral information from clinical material and family or caregivers. The items are scored using a six‐point Likert scale.
6.2.3 Positive symptoms
a. Scale for the Assessment of Positive Symptoms ‐ SAPS (Andreasen 1984)
The SAPS is a scale used to rate the presence and severity of positive symptoms, including hallucinations, delusions, bizarre behavior, and positive formal thought disorder. It consists of 30 items, which like in the SANS are rated by trained raters using a six‐point Likert scale.
6.2.4 Other specific aspects of mental state ‐ Depression
a. Self‐Rating Depression Scale ‐ SDS (Zhang 2003)
The SDS scale is a self‐report instrument designed to measure levels of depression. It consists of 20 items each of which is scored on a four‐point Likert scale.
b. Hamilton Depression Scale ‐ Ham‐D (Hamilton 1960; Hamilton 2000)
The Ham‐D scale is a questionnaire for clinicians designed to assess the severity of a patient's major depression.
c. Calgary Depression Scale for Schizophrenia ‐ CDSS (Addington 1992).
The CDSS is a scale to assess the severity of depression separate from positive, negative and extrapyramidal symptoms in people with schizophrenia. It is a semi‐structured interview consisting of nine items; ratings of the items are defined according to operational criteria from zero to three.
6.2.5 Other specific aspects of mental state ‐ Anxiety
Self‐Rating Anxiety Scale ‐ SAS (Zhang 2003)
The SAS scale is a self‐report instrument designed to measure anxiety‐associated symptoms. It consists of 20 items each of which is scored on a four‐point Likert scale.
6.3 Leaving the study early
This outcome was available in all studies, but events occurred only in three studies (Gold 2013; Talwar 2006; Yang 1998).
6.4 Functioning
6.4.1 General functioning
a. Global Assessment of Functioning ‐ GAF (Spitzer 2000)
The GAF scale is a clinician‐rated scale to rate global functioning on a continuum of mental health to mental disorder. It consists of a single item ranging from one to 100 with anchor points. It is usually rated on the basis of a clinical interview.
b. Lawton Instrumental Activities of Daily Living Scale ‐ IADL (Lawton 1969)
The IADL is an instrument to assess independent living skills. It measures how a person is functioning at the present time in eight domains of function. In Mao 2013, a modified scoring procedure with four levels (one = independent to four = unable) was used where lower scores indicate better ability (personal communication, 25 July 2016).
6.4.2 Social functioning
Social Disability Screening Schedule ‐ SDSS (Wu 1998)
The SDSS (in Yang 1998 referred to as Social Disability Schedule for Inpatients ‐ SDSI) is a psychiatrist‐rated scale used to rate levels of social functioning on the basis of a semi‐structured clinical interview. As only scores of subscales were reported in Fu 2013, we added up these subscale scores to a sum score, and imputed standard deviation (SDs) from subscale SDs.
6.4.3 Cognitive functioning
a. Paced Auditory Serial Addition Task ‐ PASAT (Gronwall 1977; Tombaugh 2006)
The PASAT scale is a computerised serial‐addition task used to assess rate of information, processing, sustained attention, and working memory. Responses are recorded by a blinded assessor.
b. Conners Continuous Performance Task ‐ CCPT (Rosvold 1956)
The CCPT is a computerised neurophysiological test assessing attention disorders and neurological functioning. Response patterns indicate, for example, inattentiveness or impulsivity, activation and arousal problems, or difficulties in maintaining vigilance.
c. Wechsler Memory Scale ‐ WMS (Saggino 1983)
The WMS is a neurophysiological test assessing various memory functions including five index scores: auditory memory, visual memory, visual working memory, immediate memory, and delayed memory.
d. Clinical Memory Test ‐ CMT (Xu 1986)
The CMT is a test developed for the assessment of memory. It consists of five subtests including directed memory, paired‐association learning, free recall of pictures, recognition of meaningless figures, and recall of connection between portraits and their characteristics.
e. Berg's Card Sorting Test ‐ BCST (Berg 1948; Nelson 1976)
The BCST is a neurophysiological test assessing executive functions of the brain responsible for, among others, planning, cognitive flexibility, abstract thinking, or initiating appropriate actions and inhibiting inappropriate actions.
f. Wisconsin Card Sorting Test ‐ WCST (Heaton 1993)
The WCST is a standard test measuring executive function. The domain "correctly completed categories" (WCST‐Cc) is a score that reflects an individual's overall level of executive functioning and the ability to utilise new information and previous experiences.
6.5 Behaviour
Nurses' Observation Scale for Inpatient Evaluation ‐ NOSIE (Honigfeld 1965)
The NOSIE scale is an assessment instrument for nurses designed to assess behaviour of patients on an inpatient unit. It consists of 30 items measuring various aspects of positive behaviour (social competence, personal neatness) and negative behaviour (e.g. irritability, manifest psychosis, depression, retardation). Items are scored on a five‐point Likert scale. Scoring was reversed in one study (Li 2007a).
6.6 Patient satisfaction
Client Satisfaction Questionnaire ‐ CSQ (Atkinson 1994)
The CSQ is a self‐report instrument designed to measure patients' satisfaction with care. It consists of eight items which are scored on a four‐point Likert scale.
6.7 Quality of life
6.7.1 General quality of life
a. General Well‐Being Schedule ‐ GWB (Fazio 1977)
The GWB is a self‐administered questionnaire focusing on an individual's subjective feelings of well‐being and distress. The scale covers the dimensions of anxiety, depression, general health, positive well‐being, self‐control and vitality.
6.7.2 Specific aspects of quality of life
b. Skalen zur psychischen Gesundheit ‐ SPG (Tönnies 1996)
The SPG scale is a self‐report instrument designed to address mental health‐related quality of life. It consists of 76 items each of which is scored on a four‐point Likert scale.
c. Social Support Questionnaire ‐ SSQ (Sarason 1983)
The SSQ is a 27‐item questionnaire designed to measure perceptions of social support and satisfaction with that social support. Each item is a question that solicits a two‐part answer: Part 1 asks participants to list all the people that fit the description of the question, and Part 2 asks participants to indicate how satisfied they are, in general, with these people, on a six‐point Likert scale.
6.8 Missing outcomes
In addition to symptom and functioning scales, mainly represented here, it will be important to include more "positive" outcomes such as further quality of life measures, outcomes related with engagement with services as well as music‐related outcomes in future studies. Such outcomes might play an important role from a client perspective. Furthermore, studies focusing on cost‐effectiveness will be a next step when investigating music therapy.
Excluded studies
A total of 97 studies were excluded for the following reasons:
We excluded 38 studies because they were not randomised (14 CCTs, 20 case series, four single‐case studies).
We excluded a further 43 studies because the intervention was not music therapy. Twenty‐one of these investigated another type of therapy, e.g. art therapy, movement therapy, psychotherapy, a treatment package, or medication. Twenty‐two studies investigated the effects of music interventions that did not meet the definition of music therapy (e.g. music listening alone or Karaoke singing).
The remaining 16 studies were excluded for various reasons: We excluded one study because information needed could not be retrieved from the authors. Three studies compared music therapy with another type of therapy and we therefore excluded them. Four studies were excluded because only some of the participants were diagnosed with schizophrenia or related psychoses. Finally, no adequate outcome data were reported for eight studies (see Characteristics of excluded studies).
Awaiting assessment
There are no studies awaiting assessment.
Ongoing
We did not identify any ongoing studies.
Risk of bias in included studies
Overall, most information is from studies at low or unclear risk of bias. A summary of the risk of bias across domains, as described below, and for each included study is provided in Figure 2 and Figure 3.


Allocation
While all studies stated that participants were randomly assigned, only 2 of them described concealment procedures. Talwar 2006 described that randomisation was concealed through a remote randomisation using a central telephone. Similarly, Gold 2013 conducted remote randomisation. An independent person who had no contact with the involved clinicians and participants provided individual allocations by e‐mail or text message. In the other studies it was unclear whether randomisation was really concealed.
Blinding
Five studies were explicitly single‐blind, using blinded assessment (Ceccato 2009; Gold 2013; Talwar 2006; Tang 1994; Ulrich 2007). For the other 13 studies it was unclear whether the persons conducting the assessments were blinded to treatment provision (Cha 2012; Chang 2013; Fu 2013; He 2005; Li 2007a; Liu 2013; Lu 2013; Mao 2013; Mohammadi 2012; Qu 2012; Wang 2013; Wen 2005; Yang 1998). Three studies tested the success of blinding. Gold 2013 verified the success of blinding and found that only in 8% of all cases assessors became aware of the participant's correct allocation. Ulrich 2007 tested whether assessors were aware of the study aim and found that they were not aware that the aim of the study had to do with music therapy. Talwar 2006 asked assessors to guess which group the participants were assigned to and identified that they guessed correctly in more than 50% of the cases. However, as this would always be the case when an experimental treatment is effective, this cannot be taken as an indication of unsuccessful blinding (Higgins 2008).
No study had a double‐blind design as the nature of the intervention does not allow to blind those who received music therapy or those who delivered it. However, in Ulrich 2007, participants were blinded to the fact that the study aim was the investigation of music therapy.
Incomplete outcome data
The majority of studies had low or zero attrition rates (Analysis 1.10). All analyses were conducted on an intention‐to‐treat basis. Gold 2013, Lu 2013, and Ulrich 2007 reported rates of missing data, i.e. participants who were followed up but where outcome data were incomplete. In Gold 2013, rates of missing data at the various outcome time points varied from 13% to 31%. Only 9% of the participants were lost for all time points of outcome assessment. The potential impact of missing data was assessed in two sensitivity analysis. For unobserved outcomes, either no change from the last observed value or no change from the baseline value was assumed. No changes in the effect were found. In Lu 2013, 6% of the participants were lost for all time points of outcome assessment. Also in this study a last observation carried forward (LOCF) procedure was applied for 3% of the missing cases. In Ulrich 2007, rates of missing data varied from 8% to 19% for the different outcome variables. All other studies had complete data for all cases that were followed up. For He 2005, the attrition rate was not reported. According to the setting (only inpatients) and apparent reporting standards in the Chinese trials (people leaving early were usually reported if there were any), we assumed that all participants had completed the trial.
Selective reporting
A published study protocol was only available for Gold 2013. In all the other studies, all outcomes that were described in the method section were also used for analyses. All studies reported means and SDs of both groups before and after treatment. We performed log transformation to remove skewness when this was present (as was the case with one outcome ‐ negative symptoms ‐ in Ulrich 2007). We considered all outcomes for all studies in the analyses.
Other potential sources of bias
1. Co‐intervention (treatment contamination)
For all studies, medication was reported as standard care. Tang 1994 reported a higher drop of medication level in the music therapy group than in the control group, but no significant difference at follow‐up. The other studies reported no significant differences in medication level. Standard care available to all participants included other therapies and activities (e.g. supportive counselling, occupational therapy, social activities).
2. Adequate music therapy method and training
Results may be biased if the quality of music therapy (method or training level) does not match that required in clinical practice. The quality of the music therapy methods applied was rated as satisfactory in most studies, although it was unclear in three (Table 1). The level of music therapy training was more uneven' adequate training level was ascertained only in seven of the 18 studies (Table 1).
According to the given definition of music therapy, both musical experiences and relationships developing through them could be identified as working mechanisms within these studies, although the level of intensity of the client‐therapist relationship might have varied between them. For example, Ceccato 2009 used a highly structured approach but therapists were nevertheless also instructed to "pay attention to relational atmosphere". The most prevalent modalities used were listening to music (15 studies), playing or singing pre‐composed music (13 studies), and improvisation (seven studies), along with verbal discussion of the processes (16 studies; Table 1), reflecting typical clinical practice.
Whether music therapists were adequately trained was not always clear. Some studies (e.g. Ceccato 2009, Talwar 2006, Ulrich 2007), stated that music therapy was conducted by "qualified music therapists". Some referred to quality standards in music therapy (Ulrich 2007), or approved training courses (Talwar 2006). In other studies, the level of training was clarified through personal communication (Ceccato 2009;Yang 1998). In other studies, the level of training was limited or unclear. For example, music therapy was conducted by nurses and psychiatrists who had attended a minimal music therapy training course (Tang 1994); "musicians who were employed full‐time as music therapists" (He 2005); or nurses and psychiatrists whose level of training was unclear (Li 2007a; Wen 2005).
Effects of interventions
See: Summary of findings for the main comparison
All 18 included studies are included in meta‐analysis. Outcomes are presented in the order specified in the Methods section and according to their prespecified time frame (short, medium, or long term). All comparisons concerned music therapy in addition to standard care versus standard care alone. When heterogeneity was present, we attempted to explain this via the dosage (less than 20 versus 20 or more sessions) or the adequacy of the music therapy (well‐defined versus less well‐defined music therapy; see Table 1).
COMPARISON 1: MUSIC THERAPY plus standard care versus STANDARD CARE alone
1.1 Global state
1.1.1 No clinically important overall improvement (as rated by individual trials)
Global state (no clinically important overall improvement) was addressed as a dichotomous outcome in two randomised controlled trials (RCTs) (Gold 2013; Yang 1998). There was no significant short‐term effect (1 RCT, n = 61, risk ratio (RR) 0.82 95% confidence interval (CI) 0.55 to 1.24, Analysis 1.1). There was a significant medium‐term effect favouring music therapy, suggesting that clinically important overall improvement was more likely to occur than with standard care alone (2 RCTs, n = 133, RR 0.38 95% CI 0.24 to 0.59, NNTB 2 95% CI 2 to 4). Heterogeneity was high (P = 0.0003, I² = 90%) and might be explained by high attrition in Gold 2013 (10/30 > 30% in the control group; 13/61 > 20% overall), although alternative explanations might be differences in populations (the study with the smaller effect consisted of 'low‐motivation', or treatment‐refractory, patients) or dose of therapy (the study with the smaller effect had a much smaller dose of music therapy). Excluding the study with high attrition resulted in stronger effects in favour of music therapy and no heterogeneity. In a sensitivity analysis where only complete data were used, the effects were unchanged. In the long term, no usable data were available (Gold 2013 had 24/61 > 30% attrition overall).
1.2 Mental state
Mental state was measured using eight continuous scales. These included endpoint scores of general mental state (PANSS and BRPS) as well as specific endpoint scores for negative (SANS) and positive (SAPS) symptoms of schizophrenia, depression (SDS, Ham‐D, CDSS), and anxiety (SAS).
1.2.1 General
Average endpoint general mental state scores using PANSS (high score = poor) were used in three studies (Lu 2013; Mao 2013; Talwar 2006). These showed significant effects in the short, medium, and long term (short term: 1 RCT, n=75, standardised mean difference (SMD) ‐0.69 95% CI ‐1.16 to ‐0.23; medium term: 2 RCTs, n = 159, SMD ‐0.97 95% CI ‐1.31 to ‐0.63; long term: 1 RCT, n = 90, SMD ‐3.41 95% CI ‐4.07 to ‐2.76, Analysis 1.2). High heterogeneity at medium term might be explained by dosage (the study with the smaller effect had a much smaller dose of music therapy; Table 1). BPRS scores (high score = poor) were used in two studies (Wen 2005; Yang 1998). On this scale, the overall effects were significant in favour of music therapy at medium term (1 RCT, n = 70, SMD ‐1.25 95% CI ‐1.77 to ‐0.73), but not at short term (1 RCT, n = 30, SMD 0.27 95% CI ‐0.45 to 0.99) (Analysis 1.3). Across both scales and all time points, it was notable that effects increased over time.
1.2.2 Specific ‐ Negative symptoms
Average endpoint scores of negative symptoms (SANS, high score = poor) were available from seven studies (Gold 2013; He 2005; Mohammadi 2012; Qu 2012; Tang 1994; Ulrich 2007;Yang 1998). As described above, the data from Ulrich 2007 were log‐transformed to remove skew, and missing SDs for Qu 2012 were estimated from those of the other studies using this outcome. The overall short‐ and medium‐term effects were significant in favour of music therapy (short term: 5 RCTs, n = 319, SMD ‐0.50 95% CI ‐0.73 to ‐0.27; medium term: 3 RCTs, n = 177, SMD ‐0.55 95% CI ‐0.87 to ‐0.24). Substantial heterogeneity between studies (short term: P=0.02, I² = 67%; medium term: P = 0.0002, I² = 89%) was removed when excluding the study on treatment‐refractory patients (Gold 2013), and the effects at both time points remained significant. In the long term, no usable data were available (Gold 2013 had 22/61 > 30% attrition overall). The effect was similar at short and medium term (Analysis 1.4).
1.2.3 Specific ‐ Positive symptoms
Average endpoint scores of positive symptoms (SAPS, high score = poor) were available from one study (Mohammadi 2012). Effects at short term were not significant (1 RCT, n = 96, SMD ‐0.18 95% CI ‐0.60 to 0.24, Analysis 1.5 ).
1.2.4 Specific ‐ Depression, anxiety
Depression and anxiety were assessed in several studies using a variety of scales. Average endpoint scores of depression (SDS, high score = poor) were measured in two studies (Li 2007a; Wen 2005) and showed a significant short‐term effect in favour of music therapy (2 RCTs, n = 90, SMD ‐0.63 95% CI ‐1.06 to ‐0.21, Analysis 1.6). There was no heterogeneity between the studies (P = 0.73, I² = 0%). One of the same studies (Wen 2005), also used average endpoint depression scores using another scale (Ham‐D, high score = poor). The short‐term effect from this scale was of comparable size but did not become statistically significant from this small study alone (1 RCT, n = 30, SMD ‐0.52 95% CI ‐1.25 to 0.21, Analysis 1.7). Average endpoint depression scores on a third scale (CDSS, high score = poor) in a study of well‐defined music therapy (Lu 2013) were analysed but excluded from interpretation due to likely skewness (1 RCT, n = 75, Analysis 1.8).
Average endpoint scores of anxiety (SAS, high score = poor) were available from one study (Li 2007a), yielding a significant short‐term effect in favour of music therapy (1 RCT, n = 60, SMD ‐0.61 95% CI ‐1.13 to ‐0.09, Analysis 1.9).
1.3. Leaving the study early
Data on leaving the study early were available for all 18 studies, but events occurred only in three (Gold 2013; Talwar 2006; Yang 1998). There were no significant differences on this outcome (short term: 11 RCTs, n = 692, RR 0.14 95% CI 0.02 to 1.06; medium term: 8 RCTs, n = 531, RR 0.62 95% CI 0.30 to 1.30; long term: 2 RCTs, n = 151, RR 0.97 95% CI 0.50 to 1.89, Analysis 1.10).
1.4. Functioning
1.4.1 General functioning
General functioning was measured in two studies of low‐dose music therapy (Gold 2013; Talwar 2006) using GAF scores (high score = good). No significant effects were found for the short term or medium term (short term: 1 RCT, n = 53, SMD 0.08 95% CI ‐0.47 to 0.62; medium term: 2 RCTs, n = 118, SMD ‐0.19 95% CI ‐0.56 to 0.18, Analysis 1.11 ). In the long term, no usable data were available (Gold 2013 had 22/61 > 30% attrition overall). One study of 'high‐dose' music therapy (Mao 2013) used IADL scores (high score = poor), with results showing significant effects favouring music therapy both in the medium term (1 RCT, n = 90, SMD ‐1.20 95% CI ‐1.65 to ‐0.75) and in the long term (1 RCT, n = 90, SMD ‐1.80 95% CI ‐2.29 to ‐1.30, Analysis 1.12).
1.4.2 Social functioning
Average endpoint scores of social functioning (SDSS, high score = poor) was used in three studies (Fu 2013; Mao 2013; Yang 1998). Significant effects favouring music therapy were found in the short term (1 RCT, n = 40, SMD ‐1.25 95% CI ‐1.94 to ‐0.57), medium term (2 RCTs, n = 160, SMD ‐0.72 95% CI ‐1.04 to ‐0.40), and long term (1 RCT, n = 90, SMD ‐0.56 95% CI ‐0.98 to ‐0.14, Analysis 1.13).
No usable data were available for social functioning scores using IPROS. As this scale was only used in Qu 2012 and only scores of subscales were reported therein, we were not able to impute SDs for a total score from other studies and hence were not able to include this outcome measure in the analysis.
1.4.3 Cognitive functioning
Various aspects of cognitive functioning (attention/vigilance, memory, and abstract thinking) were addressed in three studies (Ceccato 2009; Cha 2012; Liu 2013).
Average endpoint scores of attention (PASAT, high score = good) showed a significant medium‐term effect favouring music therapy (1 RCT, n = 67, SMD 0.72 95% CI 0.22 to 1.21, P = 0.005, Analysis 1.14). However, CCPT scores measuring vigilance and attention (high score = good) in the same study, also at medium term, did not show a significant effect (1 RCT, n = 67, SMD 0.25 95% CI ‐0.23 to 0.74, Analysis 1.15).
At medium term, average endpoint scores of memory (WMS, high score = good) were not significant (1 RCT, n = 67, SMD 0.43 95% CI ‐0.06 to 0.92, Analysis 1.16 ). Average endpoint scores of memory (CMT, high score = good) showed significant short‐term effects favouring music therapy (1 RCT, n = 60, SMD 0.58 95% CI 0.06 to 1.09, Analysis 1.17).
Average endpoint scores of abstract thinking (BCST, high score = good) were not significant at medium term (1 RCT, n = 67, SMD 0.09 95% CI ‐0.39 to 0.58, Analysis 1.18). Average endpoint scores of abstract thinking (WCST‐Cc, high score = good) showed no effects at short term (2 RCTs, n = 90, SMD ‐0.02 95% CI ‐0.07 to 0.03), but significant effects favouring music therapy at medium term (1 RCT, n = 30, SMD 1.18 95% CI 0.33 to 2.03, Analysis 1.19).
1.5 Behaviour
Average endpoint scores of behaviour (NOSIE total score, high score = good; individual study data were reversed where necessary) were used in two studies, however data from both studies were not interpretable due to likely skewness (2 RCTs, n = 100, Analysis 1.20). Average change scores of behaviour of the same outcome (NOSIE total score, high score = good) were used in one 'high‐dose' study (Wang 2013), showing a significant medium‐term effect favouring music therapy (1 RCT, n = 62, SMD 0.69 95% CI 0.18 to 1.20, Analysis 1.21).
1.6 Recipient of care satisfaction
Satisfaction with care was assessed using CSQ scores (high score = good) in one low‐dose study (12 sessions, Talwar 2006) of well‐defined music therapy. No significant effect was found (1 RCT, n = 69, SMD 0.32 95% CI ‐0.16 to 0.80, Analysis 1.22).
1.7 Quality of life
1.7.1 General
In a 'high‐dose' study (Chang 2013), GWB scores (high score = good) showed a significant effect (1 RCT, n = 72, SMD 1.82 95% CI 1.27 to 2.38, Analysis 1.23).
1.7.2 Specific
Average endpoint scores of mental health‐related quality of life were available from two short‐term studies. In one low‐dose study (Ulrich 2007), SPG scores (high score = good) did not show a significant effect (1 RCT, n = 31, SMD 0.05 95% CI ‐0.66 to 0.75, Analysis 1.24). Specific aspects of quality of life (social support; SSQ, high score = good) were assessed in a 'high‐dose' study (Chang 2013) and showed a significant effect favouring music therapy (1 RCT, n = 72, SMD 0.73 95% CI 0.26 to 1.21, Analysis 1.25).
Discussion
Summary of main results
COMPARISON 1: MUSIC THERAPY plus standard care versus STANDARD CARE alone
1. Global state
Although there are data from only two studies, these results suggest that music therapy has a strong effect on global state in the medium term (three to six months). The number needed to treat for an additional beneficial outcome is small (total n = 133, NNTB 2 95% CI 2 to 4). These results seem to be mediated by the number of sessions. This is an important result that should be replicated.
2. Mental state
Mental state was measured considering symptom scores of general mental state (PANSS, BPRS), negative symptoms (SANS), positive symptoms (SAPS), depression (SDS, Ham‐D) and anxiety (SAS). Significant results were found on five of the seven scales.
Effects tended to increase over time and were clearly seen in the medium term (three to six months). According to Cohen's guidelines (Cohen 1988), music therapy showed large effects (standardised mean difference (SMD) > 0.80) on general mental state (PANSS: total n = 159, SMD ‐0.97 95% confidence interval (CI) ‐1.31 to ‐0.63; BPRS: total n = 70, SMD ‐1.25 95% CI ‐1.77 to ‐0.73) and medium‐sized effects (SMD ≈ 0.50) on negative symptoms (SANS: total n = 177, SMD ‐0.55 95% CI ‐0.87 to ‐0.24).
Short‐term effects of medium size were seen for negative symptoms (total n = 319, SMD ‐0.50 95% CI ‐0.73 to ‐0.27). For other aspects of mental state (general mental state, positive symptoms, depression, and anxiety), interpretation was complicated by the use of different scales. Some scales were used only in a single small study. Differences between the results may also reflect differences in the number of sessions or differences in the quality of the music therapy applied (music therapy method and training).
Data on long‐term effects were available from one study and were strongly in favour of music therapy (total n = 90, SMD ‐3.41 95% CI ‐4.07 to ‐2.76). This is a very large effect size using general guidelines for the interpretation of intervention effects in the social sciences (Cohen 1988).
It clearly takes time for the effects of music therapy to unfold. This can be seen not only from the tendency of effects to increase over time, but also from examining the numbers of sessions provided in each of the studies. The strongest effects were found in studies that provided long‐term, high‐frequency music therapy (Table 1). This is in line with another review that specifically focused on the dose‐effect relation in music therapy (Gold 2009). Music as a medium of therapy addresses issues related to emotion and social interaction and is described as motivating. Therefore, it has been speculated earlier (e.g. Mössler 2011b) that it may be particularly well‐suited to the treatment of negative symptoms, which are related to problems in that area (affective flattening and bluntness, poor social interaction and a general lack of interest). However, the present review update suggests that effects on general mental state are at least as strong as those on negative symptoms.
In summary, large effects of music therapy were found for general symptoms and negative symptoms. The effect sizes for general symptoms in the medium and long term, corresponding to a 9‐ to 12‐point difference on the PANSS scale, were large by common standards (Cohen 1988). They were also much larger than those found in a recent systematic review of cognitive behaviour therapy (Jauhar 2015).
3. Leaving the study early
There were no differences concerning the outcome of leaving the study early. Both treatment conditions seemed to be well‐tolerated ‐ few people left either group.
4. Functioning
Functioning was measured in terms of three different aspects: general, social and cognitive functioning.
Effects on general functioning were significant and large for 'high‐dose' music therapy, both in the medium term (SMD ‐1.20 95% CI ‐1.65 to ‐0.75) and in the long term (SMD ‐1.80 95% CI ‐2.29 to ‐1.30). In contrast, low‐dose music therapy (less than 20 sessions) did not affect general functioning (short term: SMD 0.08 95% CI ‐0.47 to 0.62; medium term: SMD ‐0.19 95% CI ‐0.56 to 0.18).
Effects on social functioning were in favour of music therapy in the short, medium, and long term, with effect sizes ranging from medium to large. Results for cognitive functioning were mixed, with some scales suggesting benefit and others suggesting no effect.
Overall, it seems that music therapy can affect social functioning more quickly than general functioning. This appears plausible, given the focus of especially active music therapy on social interaction. General functioning may be harder to change. Effects of music therapy on general functioning require more sessions and more time, but can then be large (SMD > 0.80) using Cohen's guidelines (Cohen 1988). This is again in line with a previous systematic review that found increasing effects on functioning with dose of music therapy (Gold 2009).
5. Behaviour
Usable data on behaviour were limited, but suggested large effects of high‐dose music therapy in the medium term, similar to mental state and functioning.
6. Satisfaction with care
No effects on patient satisfaction with care could be identified. Data were to sparse to make any conclusions.
7. Quality of life
Quality of life (short to medium term) showed a similar pattern as other outcomes above, with high‐dose music therapy showing beneficial effects with large effect sizes, but low‐dose music therapy showing no such effects.
Overall completeness and applicability of evidence
1. Music therapy techniques
All studies used a combination of typical music therapeutic techniques: active music‐making (often improvisation, but also songs) and music listening. Verbal discussion and reflection emerging from, and connected to, the musical processes was described for all studies. The techniques of clinical music therapy were, therefore, relatively well represented.
2. Setting
In comparison to previous versions of this review, the time span of music therapy has expanded and now covers not only short‐term, but also medium‐term music therapy (from one up to six months). However, the majority of studies investigated music therapy in hospital settings, including primarily inpatients (in both acute and longer‐term wards) and some outpatients (in two studies). Therefore, direct applicability of the evidence is restricted to hospital settings. Clinical music therapy is commonly provided in such settings, but longer‐term individual and group music therapy with outpatients, also outside hospital settings, is also common. In terms of numbers of sessions, studies covered a broad range (from less than 10 to more than 200), which reflects the variety of clinical settings well. Interesting variations were found in the frequency of sessions: one to two sessions per week were common in Europe and Western Asia, whereas twice‐weekly to daily or even twice‐daily sessions were provided in East Asia. All studies were conducted in Europe, Asia or Australia.
3. Outcomes
The outcomes of included studies mainly reflect symptom and functioning scales assessing the patient's deficits. Recently, "positive" outcomes (such as quality of life, but also for example, music‐related outcomes) have been considered as well. However, there is not yet an agreement as to which outcome measures are to be preferred for those domains. This meant that we had to exclude some outcomes and even whole studies that may have been interesting (Gold 2013; Grocke 2014; Silverman 2009; Silverman 2014a; Silverman 2016). Agreement on outcomes that link more closely to processes and mechanisms of music therapy has not been reached. However, this appears to be a widespread and persistent problem in schizophrenia trials more generally (Miyar 2012).
Quality of the evidence
The included trials were of moderate quality, so at moderate risk of bias. All studies stated explicitly that randomisation was used, but concealment of allocation was unclear in most studies. There was no indication of unintended co‐intervention. In some studies (e.g. Talwar 2006), however, it was reported that some participants received less sessions than planned, which may have lowered the observed effects. Attrition rates were relatively low. All analyses were intention‐to‐treat. Blinding of assessment was reported in only a minority of studies. The adequacy of the music therapeutic approach is reflected satisfactorily by the applied music therapeutic techniques for most studies. However, the training level of music therapists was unclear in about half of the included studies. The clinical heterogeneity in music therapy may indicate the use of sensitivity analyses using random‐effects models; while this was not included in the protocol for the present version of this review, it will be considered in future updates.
Potential biases in the review process
The extensive search strategy that was undertaken for this review might make it seem likely that all relevant studies were identified. No restrictions concerning nationality or language have been made within the search process. Non‐English articles were included in the review and relevant articles were translated into English. Furthermore, dealing with data was done thoroughly and we contacted authors of relevant studies when data were insufficient.
There is, however, the possibility that our interest in this area (see Declarations of interest) or past knowledge of the literature (Gold 2005a) could have resulted in a biased view of the data. We think it would be hard to avoid some degree of similar risks of bias in the reviewing process.
Agreements and disagreements with other studies or reviews
The findings of this review are in agreement with a review of randomised and observational studies on music therapy for serious mental disorders (Gold 2009). That review confirmed and quantified the relationship between the number of sessions and the size of the effect of music therapy. Using meta‐regression, the review found that a large proportion of the variance in effects (73% to 78%) was explained by the number of sessions or its square root. A clear dose‐effect relationship strengthens the knowledge about the effects of music therapy (Higgins 2011), and might contribute to a better use of mental health resources. In contrast to that other review which drew on a broader basis and larger number of studies, meta‐regression was not considered appropriate for the present review due to the small number of studies included (Higgins 2011).

Study flow diagram (all searches)

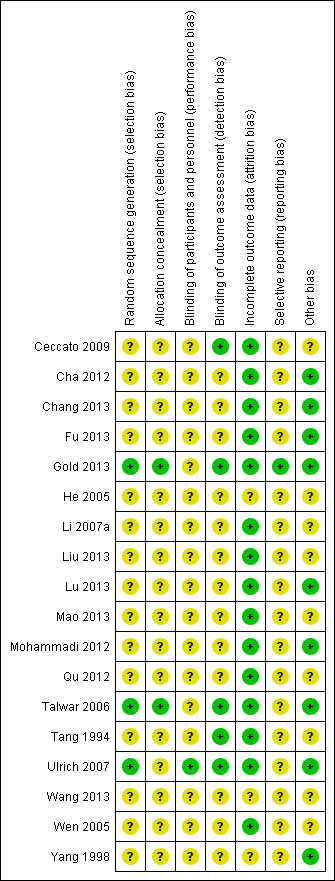

Comparison 1 Music therapy + standard care versus standard care alone, Outcome 1 Global state: No clinically important overall improvement (as rated by trialists).

Comparison 1 Music therapy + standard care versus standard care alone, Outcome 2 Mental state: General ‐ 1a. Average endpoint score (PANSS, high score = poor).

Comparison 1 Music therapy + standard care versus standard care alone, Outcome 3 Mental state: General ‐ 1b. Average endpoint score (BPRS, high score = poor).

Comparison 1 Music therapy + standard care versus standard care alone, Outcome 4 Mental state: Specific ‐ 2. Negative symptoms ‐ average endpoint score (SANS, high score = poor).
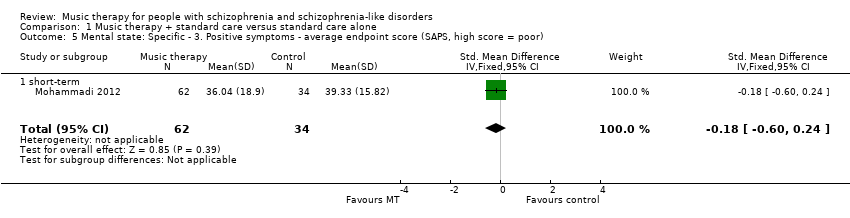
Comparison 1 Music therapy + standard care versus standard care alone, Outcome 5 Mental state: Specific ‐ 3. Positive symptoms ‐ average endpoint score (SAPS, high score = poor).

Comparison 1 Music therapy + standard care versus standard care alone, Outcome 6 Mental state: Specific ‐ 4a. Depression ‐ average endpoint score (SDS, high score = poor).
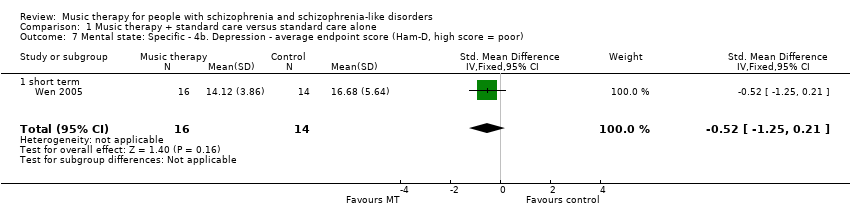
Comparison 1 Music therapy + standard care versus standard care alone, Outcome 7 Mental state: Specific ‐ 4b. Depression ‐ average endpoint score (Ham‐D, high score = poor).

Comparison 1 Music therapy + standard care versus standard care alone, Outcome 8 Mental state: Specific ‐ 4c. Depression ‐ average endpoint score (CDSS, high score = poor)).

Comparison 1 Music therapy + standard care versus standard care alone, Outcome 9 Mental state: Specific ‐ 5. Anxiety ‐ average endpoint score (SAS, high score = poor).
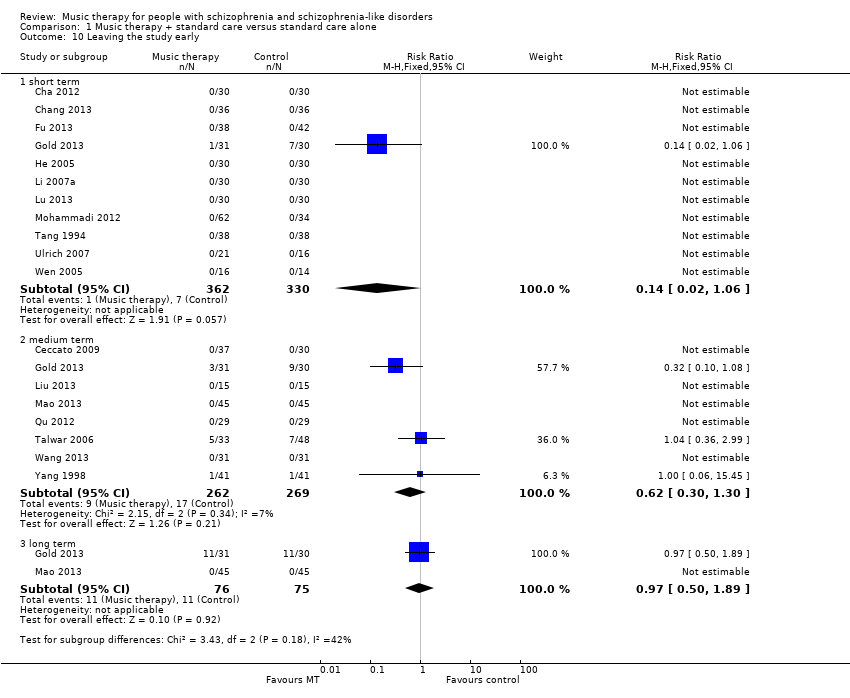
Comparison 1 Music therapy + standard care versus standard care alone, Outcome 10 Leaving the study early.
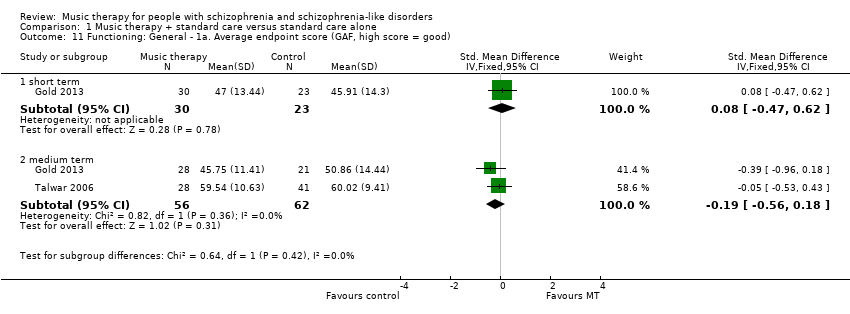
Comparison 1 Music therapy + standard care versus standard care alone, Outcome 11 Functioning: General ‐ 1a. Average endpoint score (GAF, high score = good).

Comparison 1 Music therapy + standard care versus standard care alone, Outcome 12 Functioning: General ‐1b. Average endpoint score (IADL, high score = poor).

Comparison 1 Music therapy + standard care versus standard care alone, Outcome 13 Functioning: Social 2a. Average endpoint score (SDSS, high score = poor).
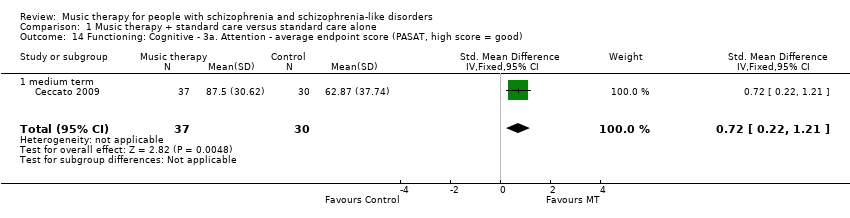
Comparison 1 Music therapy + standard care versus standard care alone, Outcome 14 Functioning: Cognitive ‐ 3a. Attention ‐ average endpoint score (PASAT, high score = good).

Comparison 1 Music therapy + standard care versus standard care alone, Outcome 15 Functioning: Cognitive ‐ 3b. Vigilance and attention ‐ average endpoint score (CCPT, high score = good).

Comparison 1 Music therapy + standard care versus standard care alone, Outcome 16 Functioning: Cognitive ‐ 3c. Memory ‐ average endpoint score (WMS, high score = good).

Comparison 1 Music therapy + standard care versus standard care alone, Outcome 17 Functioning: Cognitive ‐ 3d. Memory ‐ average endpoint score (CMT, high score = good).
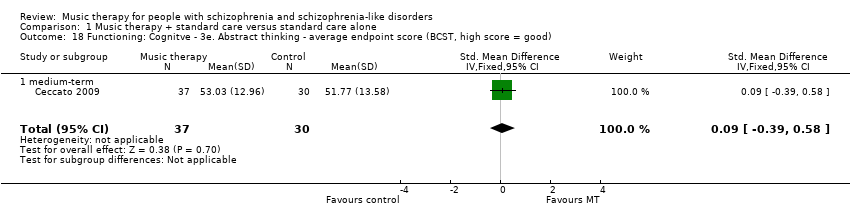
Comparison 1 Music therapy + standard care versus standard care alone, Outcome 18 Functioning: Cognitve ‐ 3e. Abstract thinking ‐ average endpoint score (BCST, high score = good).
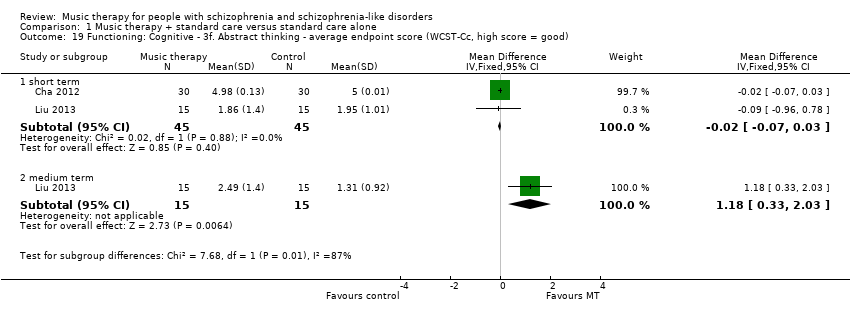
Comparison 1 Music therapy + standard care versus standard care alone, Outcome 19 Functioning: Cognitive ‐ 3f. Abstract thinking ‐ average endpoint score (WCST‐Cc, high score = good).

Comparison 1 Music therapy + standard care versus standard care alone, Outcome 20 Behaviour: 1. Average endpoint general behaviour score (NOSIE, high score = good).
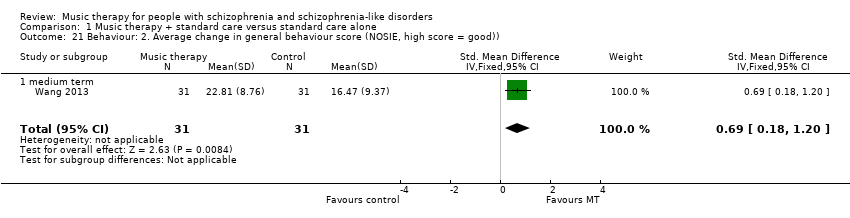
Comparison 1 Music therapy + standard care versus standard care alone, Outcome 21 Behaviour: 2. Average change in general behaviour score (NOSIE, high score = good)).
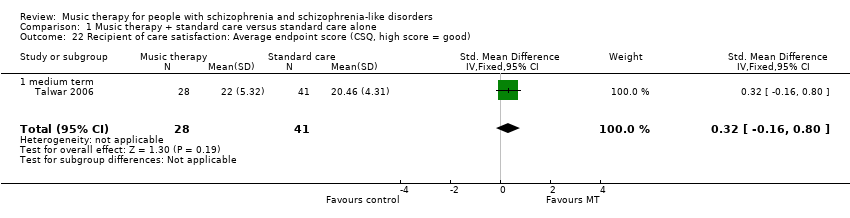
Comparison 1 Music therapy + standard care versus standard care alone, Outcome 22 Recipient of care satisfaction: Average endpoint score (CSQ, high score = good).

Comparison 1 Music therapy + standard care versus standard care alone, Outcome 23 Quality of life: General ‐ average endpoint score (GWB, high score = good).

Comparison 1 Music therapy + standard care versus standard care alone, Outcome 24 Quality of life: Specific 1. Mental health ‐ average endpoint score (SPG, high score = good).
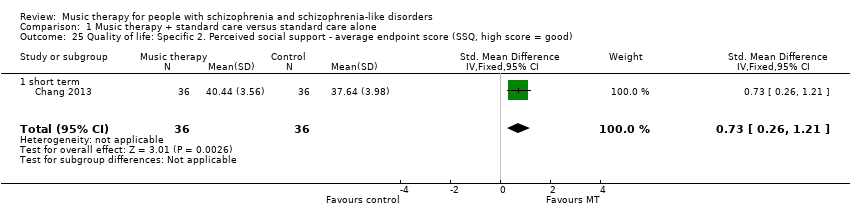
Comparison 1 Music therapy + standard care versus standard care alone, Outcome 25 Quality of life: Specific 2. Perceived social support ‐ average endpoint score (SSQ, high score = good).
| Intervention | Comparison | For people with | Relevant excluded study | Relevant existing Cochrane Reviews |
| Music medicine (music listening alone, without a music therapist) | Standard care | Schizophrenia | Chambliss 1996; Glicksohn 2000; Haimov 2012; Kong 2007; Li 2011; Lin 2003; Margo 1981; Muller 2014; Ni 2002; Vadas 2012; Wang 2002a; Wang 2002b; Zhang 2010; Zhang 2013; Zhou 2003; Zhou 2006; Zhu 2002 | ‐‐ |
| Other music interventions | Hannes 1974; Hu 2004; Leung 1998; Li 2005; Tang 2002; Wang 2006a; Wang 2007; Zhang 2003a; Zhang 2005; Zincir 2011 | ‐‐ | ||
| Other creative arts therapies (art therapy, dance/movement therapy) | Standard care or other therapy | |||
| Treatment packages including music interventions | Barrowclough 2001; Gaszner 2009; Ji 2013; Su 2005; Tan 2009; Xiao 2005; Yang 2005 | ‐‐ | ||
| Music therapy | Other interventions | ‐‐ | ||
| Olanzapine | Placebo | |||
| Ondansetron | Placebo | ‐‐ | ||
| Cognitive behaviour therapy/behaviour therapy | Standard care or other therapy | |||
| Family therapy | Standard care | |||
| Music therapy | Standard care or other therapy | People in mental health care | ‐‐ |
| Methods | Allocation: randomised (could be cluster‐randomised), with sequence generation and concealment of allocation clearly described. |
| Participants | People with schizophrenia.* |
| Interventions | 1. Music therapy delivered by qualified music therapist. N = 150. |
| Outcomes | General state: relapse. Service outcomes: length of hospitalisation, number of hospital admissions. General functioning (e.g. using GAF). Mental state (e.g. using PANSS). Well‐being. Quality of life (e.g. using EuroQol EQ‐5D). Economic evaluations: cost‐effectiveness, cost‐benefit. |
| Notes | * This could be diagnosed by clinical decision. If funds were permitting all participants could be screened using operational criteria, otherwise a random sample should suffice.** Size of study with sufficient power to highlight about a 10% difference between groups for primary outcome (depending on baseline risk).. |
| GAF ‐ General Assessment of Function | |
| Music therapy compared with standard care for schizophrenia and schizophrenia‐like disorders | ||||||
| Patient or population: People with schizophrenia and schizophrenia‐like disorders Settings: Individual and group setting Intervention: Music therapy (in addition to standard care) Comparison: Standard care alone | ||||||
| Outcomes | Illustrative comparative risks* (95% CI) | Relative effect | No of Participants | Quality of the evidence | Comments | |
| Assumed risk | Corresponding risk | |||||
| Risk with standard care | Risk difference with music therapy | |||||
| Global state: No clinically important overall improvement (as rated by individual trials) ‐ medium term (follow‐up: 3‐6 months) | Low risk population | RR 0.38 (0.24 to 0.59) | 133 | ⊕⊕⊝⊝ | ||
| 300 per 1000 | 114 per 1000 | |||||
| Moderate risk population | ||||||
| 655 per 1000 | 249 per 1000 | |||||
| High risk population | ||||||
| 800 per 1000 | 304 per 1000 | |||||
| Mental state: specific ‐ negative symptoms ‐ average endpoint score (SANS, high score = poor) medium term (follow‐up: 3‐6 months) | The mean mental state: specific ‐ 2. negative symptoms ‐ average endpoint score (SANS, high score = poor) in the intervention groups was 0.55 lower (0.87 lower to 0.24 lower) | 177 | ⊕⊕⊝⊝ | |||
| Mental state: general ‐ average endpoint score (PANSS, high score = poor) ‐ medium term, (follow‐up: 3‐6 months) | The mean mental state: general ‐ 1a. average endpoint score (PANSS, high score = poor) ‐ medium term in the intervention groups was 0.97 lower | 159 | ⊕⊕⊝⊝ | |||
| Mental state: General ‐ average endpoint score (BPRS, high score = poor) ‐ medium term (follow‐up: 3‐6 months) | The mean mental state: general ‐ 1b. average endpoint score (BPRS, high score=poor) in the intervention groups was 1.25 lower | 70 | ⊕⊕⊕⊝ | |||
| Functioning: general ‐ average endpoint score (GAF, high score = good) medium term (follow‐up: 3‐6 months) | The mean general functioning ‐ a. average endpoint score (GAF, high score = good) in the intervention groups was 0.19 lower | 118 | ⊕⊕⊕⊝ | |||
| Functioning: social ‐ average endpoint score (SDSS, high score = poor) medium term, (follow‐up: 3‐6 months) | The mean social functioning: average endpoint score (SDSS, high score = poor) ‐ medium term in the intervention groups was 0.72 lower | 160 | ⊕⊕⊕⊝ | |||
| Quality of life: general ‐ average endpoint score (GWB, high score = good) ‐ short term (follow‐up: less than 3 months) | The mean quality of life: general ‐ average endpoint score (GWB, high score = good) in the intervention groups was 1.82 higher | 72 | ⊕⊕⊕⊝ | |||
| *The basis for the assumed risk (e.g. the median control group risk across studies) is provided in footnotes. The corresponding risk (and its 95% confidence interval) is based on the assumed risk in the comparison group and the relative effect of the intervention (and its 95% CI). | ||||||
| GRADE Working Group grades of evidence | ||||||
| 1 Risk of bias ‐ limitations in study design such as poorly reported randomisation, allocation concealment, blinding or unclear outcome reporting. 2 Inconsistency ‐ heterogeneity between studies was high. 3 Imprecision ‐ the optimal information size is lower than 300 events. 4 Large effect ‐ RR < 0.5 5 Large effect ‐ the effect was in the large range according to Cohen 1988. | ||||||
| No. of | Adequate | Adequate | Modality | Form of therapy | Therapy | ||||||
| Improvisation | Playing and/or singing pre‐ | Songwriting | Listening | Verbal | Others | ||||||
| Max. 16 (1/week over 4 months) | Yes | Yes | Receptive | No | No | No | Central | No | No | Fixed structure | |
| Max. 12 (3/week over 4 weeks) | Yes | Unclear | Receptive | No | No | No | Yes | Yes | Music memory; Music imagery | Process‐oriented | |
| Max. 40 (5/week over 8 weeks) | Yes | Yes | Both | No | Yes | Yes | Yes | Yes | Music memory; improvisation; Musical psychodrama | Fixed structure | |
| Max. 12 (3/week over 4 weeks) | Yes | Unclear | Active | Yes | Yes | No | No | Yes | No | Fixed structure | |
| 18 sessions received | Yes | Yes | Both | Yes | Yes | Yes | Yes | Yes | No | Process‐oriented | |
| Max. 30 | Yes | Unclear | Receptive | No | No | No | Central | Yes | Dancing, reading poems with music background | Unclear | |
| Max. 30 | Yes | Unclear | Receptive | No | No | No | Central | Yes | No | Unclear | |
| Max. 32 (2/week over 16 weeks) | Yes | Limited | Both | No | Yes | No | Yes | Yes | Recreative music therapy, Orff music therapy | Unclear | |
| Max. 10 (2/week over 5 weeks) | Yes | Yes | Both | No | Yes | No | Yes | Yes | Playing percussion instruments, watching music videos | Unclear | |
| Max. 240 (2/day, 5 days/week, over 6 months) | Unclear | Limited | Both | No | Yes | No | Yes | Yes | Music theory class, instrument playing, music appreciation | Unclear | |
| Max. 5 (weekly sessions/one month) | Yes | Unclear | Both | Yes | Yes | No | Yes | No | Making bodily movements according to the rhythm of the music | Unclear | |
| Max. 224 (2/day, over 16 weeks) | Unclear | Limited | Both | No | Yes | No | Yes | Yes | Music appreciation | Unclear | |
| Max. 12 sessions (1/week over 3 months) | Yes | Yes | Active | Central | Yes | No | No | Central | No | Process‐ | |
| 19 sessions received | Yes | Unclear | Both | Yes | Yes | No | Central | Yes | No | Fixed structure | |
| 7.5 sessions received | Yes | Yes | Active | Yes | Yes | No | No | Yes | No | Process‐ | |
| Max. 36 (3/week, over 3 months) | Unclear | Limited | Both | Yes | Yes | No | Yes | Yes | Musical appreciation, rhythm training | Unclear | |
| Max. 30 | Yes | Unclear | Receptive | No | No | No | Central | Yes | Dancing | Unclear | |
| Max. 78 (6/week over 3 months) | Yes | Yes | Both | Yes | Yes | No | Yes | Yes | Learning musicology | Unclear | |
| Adequate music therapeutic method: A "yes" indicates that the method applied considered both musical experiences and relational aspects as dynamic forces of change in music therapy. A "no" indicates that relational aspects are missing. | |||||||||||
| Outcome or subgroup title | No. of studies | No. of participants | Statistical method | Effect size |
| 1 Global state: No clinically important overall improvement (as rated by trialists) Show forest plot | 2 | Risk Ratio (M‐H, Fixed, 95% CI) | Subtotals only | |
| 1.1 short term | 1 | 61 | Risk Ratio (M‐H, Fixed, 95% CI) | 0.82 [0.55, 1.24] |
| 1.2 medium term | 2 | 133 | Risk Ratio (M‐H, Fixed, 95% CI) | 0.38 [0.24, 0.59] |
| 2 Mental state: General ‐ 1a. Average endpoint score (PANSS, high score = poor) Show forest plot | 3 | Std. Mean Difference (IV, Fixed, 95% CI) | Subtotals only | |
| 2.1 short term | 1 | 75 | Std. Mean Difference (IV, Fixed, 95% CI) | ‐0.69 [‐1.16, ‐0.23] |
| 2.2 medium term | 2 | 159 | Std. Mean Difference (IV, Fixed, 95% CI) | ‐0.97 [‐1.31, ‐0.63] |
| 2.3 long term | 1 | 90 | Std. Mean Difference (IV, Fixed, 95% CI) | ‐3.41 [‐4.07, ‐2.76] |
| 3 Mental state: General ‐ 1b. Average endpoint score (BPRS, high score = poor) Show forest plot | 2 | Std. Mean Difference (IV, Fixed, 95% CI) | Subtotals only | |
| 3.1 short term | 1 | 30 | Std. Mean Difference (IV, Fixed, 95% CI) | 0.27 [‐0.45, 0.99] |
| 3.2 medium term | 1 | 70 | Std. Mean Difference (IV, Fixed, 95% CI) | ‐1.25 [‐1.77, ‐0.73] |
| 4 Mental state: Specific ‐ 2. Negative symptoms ‐ average endpoint score (SANS, high score = poor) Show forest plot | 7 | Std. Mean Difference (IV, Fixed, 95% CI) | Subtotals only | |
| 4.1 short term | 5 | 319 | Std. Mean Difference (IV, Fixed, 95% CI) | ‐0.50 [‐0.73, ‐0.27] |
| 4.2 medium term | 3 | 177 | Std. Mean Difference (IV, Fixed, 95% CI) | ‐0.55 [‐0.87, ‐0.24] |
| 5 Mental state: Specific ‐ 3. Positive symptoms ‐ average endpoint score (SAPS, high score = poor) Show forest plot | 1 | 96 | Std. Mean Difference (IV, Fixed, 95% CI) | ‐0.18 [‐0.60, 0.24] |
| 5.1 short‐term | 1 | 96 | Std. Mean Difference (IV, Fixed, 95% CI) | ‐0.18 [‐0.60, 0.24] |
| 6 Mental state: Specific ‐ 4a. Depression ‐ average endpoint score (SDS, high score = poor) Show forest plot | 2 | 90 | Std. Mean Difference (IV, Fixed, 95% CI) | ‐0.63 [‐1.06, ‐0.21] |
| 6.1 short term | 2 | 90 | Std. Mean Difference (IV, Fixed, 95% CI) | ‐0.63 [‐1.06, ‐0.21] |
| 7 Mental state: Specific ‐ 4b. Depression ‐ average endpoint score (Ham‐D, high score = poor) Show forest plot | 1 | 30 | Std. Mean Difference (IV, Fixed, 95% CI) | ‐0.52 [‐1.25, 0.21] |
| 7.1 short term | 1 | 30 | Std. Mean Difference (IV, Fixed, 95% CI) | ‐0.52 [‐1.25, 0.21] |
| 8 Mental state: Specific ‐ 4c. Depression ‐ average endpoint score (CDSS, high score = poor)) Show forest plot | 1 | 75 | Std. Mean Difference (IV, Fixed, 95% CI) | ‐0.73 [‐1.20, ‐0.26] |
| 8.1 short term | 1 | 75 | Std. Mean Difference (IV, Fixed, 95% CI) | ‐0.73 [‐1.20, ‐0.26] |
| 9 Mental state: Specific ‐ 5. Anxiety ‐ average endpoint score (SAS, high score = poor) Show forest plot | 1 | 60 | Std. Mean Difference (IV, Fixed, 95% CI) | ‐0.61 [‐1.13, ‐0.09] |
| 9.1 short term | 1 | 60 | Std. Mean Difference (IV, Fixed, 95% CI) | ‐0.61 [‐1.13, ‐0.09] |
| 10 Leaving the study early Show forest plot | 18 | Risk Ratio (M‐H, Fixed, 95% CI) | Subtotals only | |
| 10.1 short term | 11 | 692 | Risk Ratio (M‐H, Fixed, 95% CI) | 0.14 [0.02, 1.06] |
| 10.2 medium term | 8 | 531 | Risk Ratio (M‐H, Fixed, 95% CI) | 0.62 [0.30, 1.30] |
| 10.3 long term | 2 | 151 | Risk Ratio (M‐H, Fixed, 95% CI) | 0.97 [0.50, 1.89] |
| 11 Functioning: General ‐ 1a. Average endpoint score (GAF, high score = good) Show forest plot | 2 | Std. Mean Difference (IV, Fixed, 95% CI) | Subtotals only | |
| 11.1 short term | 1 | 53 | Std. Mean Difference (IV, Fixed, 95% CI) | 0.08 [‐0.47, 0.62] |
| 11.2 medium term | 2 | 118 | Std. Mean Difference (IV, Fixed, 95% CI) | ‐0.19 [‐0.56, 0.18] |
| 12 Functioning: General ‐1b. Average endpoint score (IADL, high score = poor) Show forest plot | 1 | Std. Mean Difference (IV, Fixed, 95% CI) | Subtotals only | |
| 12.1 medium term | 1 | 90 | Std. Mean Difference (IV, Fixed, 95% CI) | ‐1.20 [‐1.65, ‐0.75] |
| 12.2 long term | 1 | 90 | Std. Mean Difference (IV, Fixed, 95% CI) | ‐1.80 [‐2.29, ‐1.30] |
| 13 Functioning: Social 2a. Average endpoint score (SDSS, high score = poor) Show forest plot | 3 | Std. Mean Difference (IV, Fixed, 95% CI) | Subtotals only | |
| 13.1 short term | 1 | 40 | Std. Mean Difference (IV, Fixed, 95% CI) | ‐1.25 [‐1.94, ‐0.57] |
| 13.2 medium term | 2 | 160 | Std. Mean Difference (IV, Fixed, 95% CI) | ‐0.72 [‐1.04, ‐0.40] |
| 13.3 long term | 1 | 90 | Std. Mean Difference (IV, Fixed, 95% CI) | ‐0.56 [‐0.98, ‐0.14] |
| 14 Functioning: Cognitive ‐ 3a. Attention ‐ average endpoint score (PASAT, high score = good) Show forest plot | 1 | 67 | Std. Mean Difference (IV, Fixed, 95% CI) | 0.72 [0.22, 1.21] |
| 14.1 medium term | 1 | 67 | Std. Mean Difference (IV, Fixed, 95% CI) | 0.72 [0.22, 1.21] |
| 15 Functioning: Cognitive ‐ 3b. Vigilance and attention ‐ average endpoint score (CCPT, high score = good) Show forest plot | 1 | 67 | Std. Mean Difference (IV, Fixed, 95% CI) | 0.25 [‐0.23, 0.74] |
| 15.1 medium term | 1 | 67 | Std. Mean Difference (IV, Fixed, 95% CI) | 0.25 [‐0.23, 0.74] |
| 16 Functioning: Cognitive ‐ 3c. Memory ‐ average endpoint score (WMS, high score = good) Show forest plot | 1 | 67 | Std. Mean Difference (IV, Fixed, 95% CI) | 0.43 [‐0.06, 0.92] |
| 16.1 medium term | 1 | 67 | Std. Mean Difference (IV, Fixed, 95% CI) | 0.43 [‐0.06, 0.92] |
| 17 Functioning: Cognitive ‐ 3d. Memory ‐ average endpoint score (CMT, high score = good) Show forest plot | 1 | 60 | Std. Mean Difference (IV, Fixed, 95% CI) | 0.58 [0.06, 1.09] |
| 17.1 short term | 1 | 60 | Std. Mean Difference (IV, Fixed, 95% CI) | 0.58 [0.06, 1.09] |
| 18 Functioning: Cognitve ‐ 3e. Abstract thinking ‐ average endpoint score (BCST, high score = good) Show forest plot | 1 | 67 | Std. Mean Difference (IV, Fixed, 95% CI) | 0.09 [‐0.39, 0.58] |
| 18.1 medium‐term | 1 | 67 | Std. Mean Difference (IV, Fixed, 95% CI) | 0.09 [‐0.39, 0.58] |
| 19 Functioning: Cognitive ‐ 3f. Abstract thinking ‐ average endpoint score (WCST‐Cc, high score = good) Show forest plot | 2 | Mean Difference (IV, Fixed, 95% CI) | Subtotals only | |
| 19.1 short term | 2 | 90 | Mean Difference (IV, Fixed, 95% CI) | ‐0.02 [‐0.07, 0.03] |
| 19.2 medium term | 1 | 30 | Mean Difference (IV, Fixed, 95% CI) | 1.18 [0.33, 2.03] |
| 20 Behaviour: 1. Average endpoint general behaviour score (NOSIE, high score = good) Show forest plot | 2 | 100 | Std. Mean Difference (IV, Fixed, 95% CI) | 1.38 [0.93, 1.84] |
| 20.1 short term | 2 | 100 | Std. Mean Difference (IV, Fixed, 95% CI) | 1.38 [0.93, 1.84] |
| 21 Behaviour: 2. Average change in general behaviour score (NOSIE, high score = good)) Show forest plot | 1 | 62 | Std. Mean Difference (IV, Fixed, 95% CI) | 0.69 [0.18, 1.20] |
| 21.1 medium term | 1 | 62 | Std. Mean Difference (IV, Fixed, 95% CI) | 0.69 [0.18, 1.20] |
| 22 Recipient of care satisfaction: Average endpoint score (CSQ, high score = good) Show forest plot | 1 | 69 | Std. Mean Difference (IV, Fixed, 95% CI) | 0.32 [‐0.16, 0.80] |
| 22.1 medium term | 1 | 69 | Std. Mean Difference (IV, Fixed, 95% CI) | 0.32 [‐0.16, 0.80] |
| 23 Quality of life: General ‐ average endpoint score (GWB, high score = good) Show forest plot | 1 | 72 | Std. Mean Difference (IV, Fixed, 95% CI) | 1.82 [1.27, 2.38] |
| 23.1 short term | 1 | 72 | Std. Mean Difference (IV, Fixed, 95% CI) | 1.82 [1.27, 2.38] |
| 24 Quality of life: Specific 1. Mental health ‐ average endpoint score (SPG, high score = good) Show forest plot | 1 | 31 | Std. Mean Difference (IV, Fixed, 95% CI) | 0.05 [‐0.66, 0.75] |
| 24.1 short term | 1 | 31 | Std. Mean Difference (IV, Fixed, 95% CI) | 0.05 [‐0.66, 0.75] |
| 25 Quality of life: Specific 2. Perceived social support ‐ average endpoint score (SSQ, high score = good) Show forest plot | 1 | 72 | Std. Mean Difference (IV, Fixed, 95% CI) | 0.73 [0.26, 1.21] |
| 25.1 short term | 1 | 72 | Std. Mean Difference (IV, Fixed, 95% CI) | 0.73 [0.26, 1.21] |