| 1 Survival Show forest plot | 1 | | Odds Ratio (M‐H, Fixed, 95% CI) | Totals not selected |
|
| 1.1 Deaths at 36 months | 1 | | Odds Ratio (M‐H, Fixed, 95% CI) | 0.0 [0.0, 0.0] |
| 2 Change in FEV1 Show forest plot | 1 | | Mean Difference (IV, Fixed, 95% CI) | Totals not selected |
|
| 2.1 At 6 months | 1 | | Mean Difference (IV, Fixed, 95% CI) | 0.0 [0.0, 0.0] |
| 2.2 At 12 months | 1 | | Mean Difference (IV, Fixed, 95% CI) | 0.0 [0.0, 0.0] |
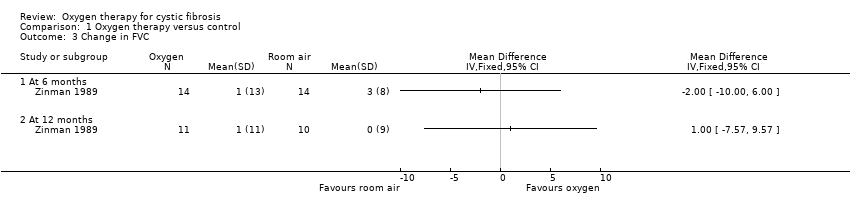
| 3 Change in FVC Show forest plot | 1 | | Mean Difference (IV, Fixed, 95% CI) | Totals not selected |
|
| 3.1 At 6 months | 1 | | Mean Difference (IV, Fixed, 95% CI) | 0.0 [0.0, 0.0] |
| 3.2 At 12 months | 1 | | Mean Difference (IV, Fixed, 95% CI) | 0.0 [0.0, 0.0] |
| 4 Change in gas exchange during exercise Show forest plot | 5 | | Mean Difference (IV, Fixed, 95% CI) | Subtotals only |
|
| 4.1 Post exercise SaO2 (%) | 3 | 84 | Mean Difference (IV, Fixed, 95% CI) | 2.11 [1.54, 2.68] |
| 4.2 Post exercise PETCO2 (mm Hg) | 2 | 62 | Mean Difference (IV, Fixed, 95% CI) | 0.11 [‐2.14, 2.36] |
| 4.3 Change in SaO2 during maximal exercise (%) | 1 | 44 | Mean Difference (IV, Fixed, 95% CI) | 7.0 [2.61, 11.39] |
| 4.4 Change in PETCO2 during maximal exercise (mm Hg) | 2 | 112 | Mean Difference (IV, Fixed, 95% CI) | 3.71 [1.28, 6.14] |
| 4.5 Change in tPCO2 during maximal exercise (mm Hg) | 1 | 44 | Mean Difference (IV, Fixed, 95% CI) | 4.0 [1.23, 6.77] |
| 4.6 SaO2 during maximal exercise (%) | 3 | 108 | Mean Difference (IV, Fixed, 95% CI) | 2.01 [1.16, 2.85] |
| 5 Change in gas exchange during sleep Show forest plot | 3 | | Mean Difference (IV, Fixed, 95% CI) | Subtotals only |
|
| 5.1 SaO2 in REM sleep (%) | 2 | 34 | Mean Difference (IV, Fixed, 95% CI) | 7.54 [4.31, 10.77] |
| 5.2 tPCO2 in REM sleep (kPa) | 1 | 12 | Mean Difference (IV, Fixed, 95% CI) | 1.0 [0.15, 1.85] |
| 5.3 TcPCO2 in REM sleep (mm Hg) | 1 | 20 | Mean Difference (IV, Fixed, 95% CI) | 0.30 [‐6.69, 7.29] |
| 5.4 SaO2 in non‐REM sleep (%) | 1 | 12 | Mean Difference (IV, Fixed, 95% CI) | 6.0 [1.92, 10.08] |
| 5.5 tPCO2 in non‐REM sleep (kPa) | 1 | 12 | Mean Difference (IV, Fixed, 95% CI) | 0.70 [‐0.09, 1.49] |
| 5.6 TcPCO2 in non‐REM sleep (mm Hg) | 1 | 20 | Mean Difference (IV, Fixed, 95% CI) | ‐1.0 [‐6.51, 4.51] |
| 5.7 Maximum TcCO2 with total sleep (mm Hg) | 1 | 22 | Mean Difference (IV, Fixed, 95% CI) | 5.0 [‐2.07, 12.07] |
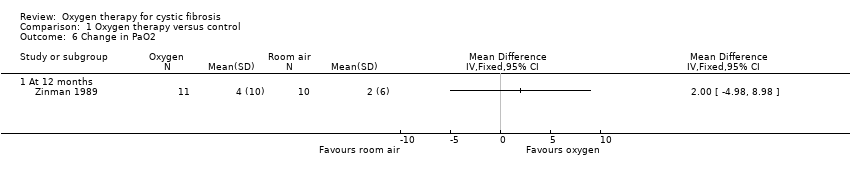
| 6 Change in PaO2 Show forest plot | 1 | | Mean Difference (IV, Fixed, 95% CI) | Totals not selected |
|
| 6.1 At 12 months | 1 | | Mean Difference (IV, Fixed, 95% CI) | 0.0 [0.0, 0.0] |
| 7 Change in PaCO2 Show forest plot | 1 | | Mean Difference (IV, Fixed, 95% CI) | Totals not selected |
|
| 7.1 At 12 months | 1 | | Mean Difference (IV, Fixed, 95% CI) | 0.0 [0.0, 0.0] |
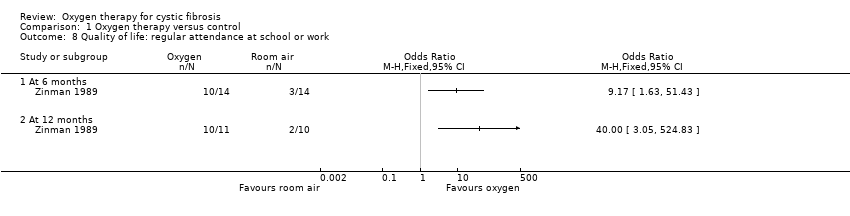
| 8 Quality of life: regular attendance at school or work Show forest plot | 1 | | Odds Ratio (M‐H, Fixed, 95% CI) | Totals not selected |
|
| 8.1 At 6 months | 1 | | Odds Ratio (M‐H, Fixed, 95% CI) | 0.0 [0.0, 0.0] |
| 8.2 At 12 months | 1 | | Odds Ratio (M‐H, Fixed, 95% CI) | 0.0 [0.0, 0.0] |
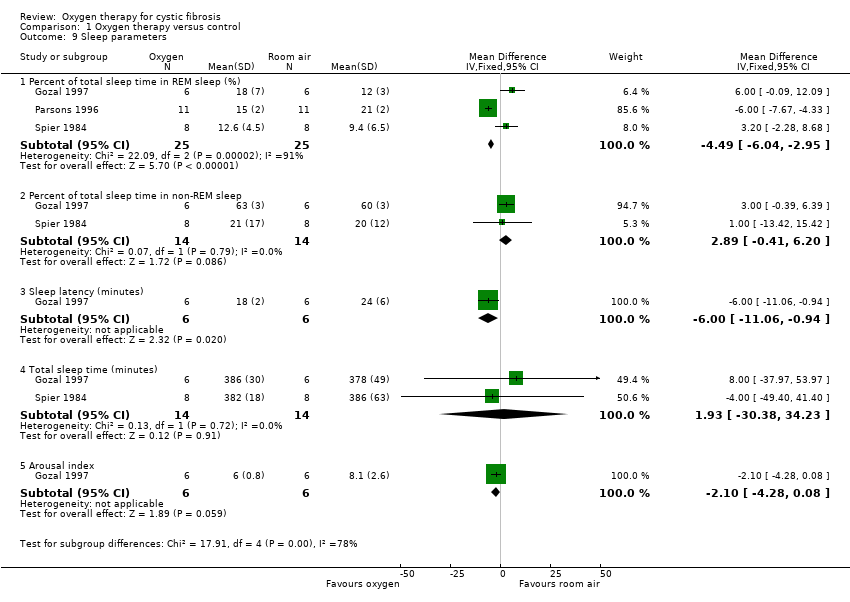
| 9 Sleep parameters Show forest plot | 3 | | Mean Difference (IV, Fixed, 95% CI) | Subtotals only |
|
| 9.1 Percent of total sleep time in REM sleep (%) | 3 | 50 | Mean Difference (IV, Fixed, 95% CI) | ‐4.49 [‐6.04, ‐2.95] |
| 9.2 Percent of total sleep time in non‐REM sleep | 2 | 28 | Mean Difference (IV, Fixed, 95% CI) | 2.89 [‐0.41, 6.20] |
| 9.3 Sleep latency (minutes) | 1 | 12 | Mean Difference (IV, Fixed, 95% CI) | ‐6.0 [‐11.06, ‐0.94] |
| 9.4 Total sleep time (minutes) | 2 | 28 | Mean Difference (IV, Fixed, 95% CI) | 1.93 [‐30.38, 34.23] |
| 9.5 Arousal index | 1 | 12 | Mean Difference (IV, Fixed, 95% CI) | ‐2.10 [‐4.28, 0.08] |
| 10 Exercise parameters after submaximal exercise Show forest plot | 3 | | Mean Difference (IV, Fixed, 95% CI) | Subtotals only |
|
| 10.1 Exercise duration (s) | 1 | 16 | Mean Difference (IV, Fixed, 95% CI) | 163.0 [‐66.91, 392.91] |
| 10.2 Oxygen consumption (ml/kg/min) | 2 | 62 | Mean Difference (IV, Fixed, 95% CI) | ‐0.43 [‐2.06, 1.20] |
| 10.3 CO2 production (l/min) | 3 | 84 | Mean Difference (IV, Fixed, 95% CI) | ‐0.01 [‐0.11, 0.09] |
| 10.4 Minute ventilation (l/min) | 3 | 84 | Mean Difference (IV, Fixed, 95% CI) | ‐0.92 [‐3.36, 1.53] |
| 10.5 Heart rate (beats / min) | 3 | 84 | Mean Difference (IV, Fixed, 95% CI) | ‐3.96 [‐8.84, 0.92] |
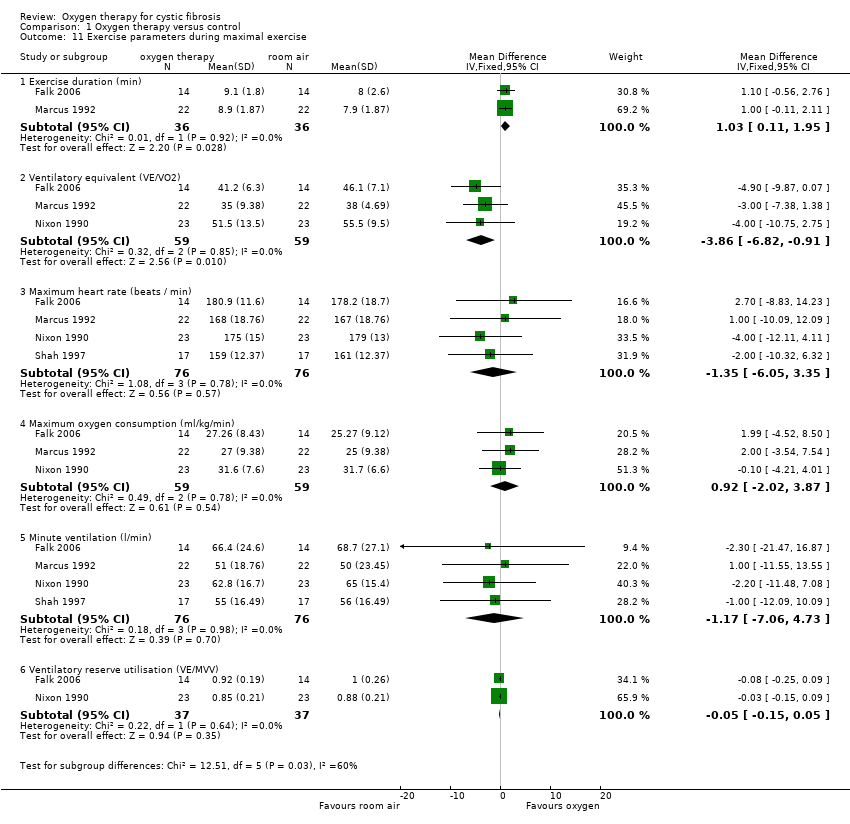
| 11 Exercise parameters during maximal exercise Show forest plot | 4 | | Mean Difference (IV, Fixed, 95% CI) | Subtotals only |
|
| 11.1 Exercise duration (min) | 2 | 72 | Mean Difference (IV, Fixed, 95% CI) | 1.03 [0.11, 1.95] |
| 11.2 Ventilatory equivalent (VE/VO2) | 3 | 118 | Mean Difference (IV, Fixed, 95% CI) | ‐3.86 [‐6.82, ‐0.91] |
| 11.3 Maximum heart rate (beats / min) | 4 | 152 | Mean Difference (IV, Fixed, 95% CI) | ‐1.35 [‐6.05, 3.35] |
| 11.4 Maximum oxygen consumption (ml/kg/min) | 3 | 118 | Mean Difference (IV, Fixed, 95% CI) | 0.92 [‐2.02, 3.87] |
| 11.5 Minute ventilation (l/min) | 4 | 152 | Mean Difference (IV, Fixed, 95% CI) | ‐1.17 [‐7.06, 4.73] |
| 11.6 Ventilatory reserve utilisation (VE/MVV) | 2 | 74 | Mean Difference (IV, Fixed, 95% CI) | ‐0.05 [‐0.15, 0.05] |
| 12 Nutritional status: change in % ideal body weight for height Show forest plot | 1 | | Mean Difference (IV, Fixed, 95% CI) | Totals not selected |
|
| 12.1 At 6 months | 1 | | Mean Difference (IV, Fixed, 95% CI) | 0.0 [0.0, 0.0] |
| 12.2 At 12 months | 1 | | Mean Difference (IV, Fixed, 95% CI) | 0.0 [0.0, 0.0] |
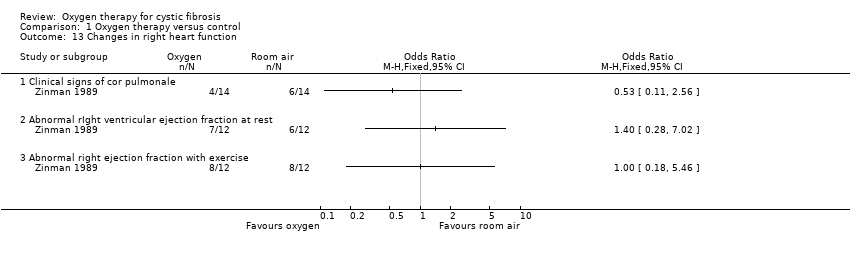
| 13 Changes in right heart function Show forest plot | 1 | | Odds Ratio (M‐H, Fixed, 95% CI) | Totals not selected |
|
| 13.1 Clinical signs of cor pulmonale | 1 | | Odds Ratio (M‐H, Fixed, 95% CI) | 0.0 [0.0, 0.0] |
| 13.2 Abnormal rIght ventricular ejection fraction at rest | 1 | | Odds Ratio (M‐H, Fixed, 95% CI) | 0.0 [0.0, 0.0] |
| 13.3 Abnormal right ejection fraction with exercise | 1 | | Odds Ratio (M‐H, Fixed, 95% CI) | 0.0 [0.0, 0.0] |