Urethral injection therapy for urinary incontinence in women
Abstract
Background
Urinary incontinence imposes a significant health and economic burden to society. Periurethral or transurethral injection of bulking agents is a minimally invasive surgical procedure used as one the surgical treatments of stress urinary incontinence (SUI) in adult women.
Objectives
To assess the effects of periurethral or transurethral injection therapy on the cure or improvement of urinary incontinence in women.
Search methods
We searched the Cochrane Incontinence Group Specialised Trials Register (searched 8 November 2010) and the reference lists of relevant articles.
Selection criteria
All randomised or quasi‐randomised controlled trials of treatment for urinary incontinence in which at least one management arm involved periurethral or transurethral injection therapy.
Data collection and analysis
Two review authors independently assessed methodological quality of each study using explicit criteria. Data extraction was undertaken independently and clarification concerning possible unreported data sought directly from the investigators.
Main results
Excluding duplicate reports, we identified 14 trials (excluding one that was subsequently withdrawn from publication and not included in this analysis) including 2004 women that met the inclusion criteria. The limited data available were not suitable for meta‐analysis because they all came from separate trials. Trials were small and generally of moderate quality.
One trial of 45 women that compared injection therapy with conservative treatment showed early benefit for the injectable therapy with respect to continence grade (risk ratio (RR) 0.70, 95% confidence interval (CI) 0.52 to 0.94) and quality of life (mean difference (MD) 0.54, 95% CI 0.16 to 0.92). Another trial, comparing Injection of autologous fat with placebo, terminated early because of safety concerns. Two trials that compared injection with surgical management found significantly better objective cure in the surgical group (RR 4.77, 95% CI 1.96 to 11.64; and RR 1.69, 95% CI 1.02 to 2.79), although the latter trial data did not reach statistical significance if an intention‐to‐treat analysis was used.
Eight trials compared different agents and all results had wide confidence intervals. Silicone particles, calcium hydroxylapatite, ethylene vinyl alcohol, carbon spheres and dextranomer hyaluronic acid combination gave improvements which were not shown to be more or less efficacious than collagen. Dextranomer hyaluronic acid compound treated patients appeared to have significantly higher rates of injection site complications (16% with the hyaluronic acid compound versus none with collagen; RR 37.78, 95% CI 2.34 to 610.12) and this product has now been withdrawn from the market.
A comparison of periurethral and transurethral methods of injection found similar outcomes but a higher (though not statistically significant) rate of early complications in the periurethral group. One trial of 30 women showed a weak (but not clinically significant) advantage for patient satisfaction (data not suitable for analysis in RevMan) after mid‐urethral injection in comparison to bladder neck injection but with no demonstrable difference in continence levels.
Authors' conclusions
The available evidence base remains insufficient to guide practice. In addition, the finding that placebo saline injection was followed by a similar symptomatic improvement to bulking agent injection raises questions about the mechanism of any beneficial effects. One small trial comparing silicone particles with pelvic floor muscle training was suggestive of benefit at three months but it is not known if this was sustained, and the treatment was associated with high levels of postoperative retention and dysuria. Greater symptomatic improvement was observed with surgical treatments, though the advantages need to be set against likely higher risks. No clear‐cut conclusions could be drawn from trials comparing alternative agents, although dextranomer hyaluronic acid was associated with more local side effects and is no longer commercially available for this indication. There is insufficient evidence to show superiority of mid‐urethral or bladder neck injection. The single trial of autologous fat provides a reminder that periurethral injections can occasionally cause serious side effects. Also, a Brief Economic Commentary (BEC) identified three studies suggesting that urethral bulking agent might be more cost‐effective compared with retropubic mid‐urethral slings, transobturator or traditional sling procedure when used as an initial treatment in women without hypermobility or as a follow‐up to surgery failure provided injection is kept minimal. However, urethral bulking agent might not be cost‐effective when compared with traditional sling as an initial treatment of SUI when a patient is followed up for a longer period (15 months post‐surgery).
PICO
Plain language summary
Injections of bulking agents for urinary incontinence in women
Stress incontinence is losing urine when coughing, laughing, sneezing or exercising. A significant amount of a woman's and their family's income can be spent on managing the symptoms. Usually muscles and tissue form a cushion supporting the base of the bladder and closing the urethra (the passage through which urine leaves the body). If they do not, artificial cushioning can be created by injecting bulking agents into the area around the urethra. The review of 14 trials, which included 2004 women, found some limited evidence that this can relieve stress incontinence in women. Other treatments such as surgery might be better. Using the women's own fat tissue as the agent injected can cause serious complications. In terms of costs, a brief review of economic studies suggested that collagen injection was less costly than surgery when used as first treatment or after initial surgery failure.
Authors' conclusions
Background
This review is part of a series of Cochrane reviews on the effects of surgical treatment for urinary incontinence. This is an update of a review on periurethral injection therapy previously published by the Cochrane Incontinence Group in 2007. The reader is referred to another review in the series by Glazener (Glazener 2004) for background information regarding the description of urinary incontinence, the principal categories of incontinence, and the broad options for management.
Stress Urinary Incontinence (SUI) constitutes a huge financial economic burden to the society. In the USA, the annual total direct costs of urinary incontinence in both men and women is over USD 16 billion (1995 USD) (Chong 2011) with a societal cost of USD 26.2 billion (1995 USD) (Wagner 1998). Approximately, USD 13.12 billion (1995 USD) of the total direct costs of urinary incontinence is spent on SUI (Chong 2011; Kunkle 2015). About 70% of this USD 13.12 billion is borne by the patients mainly through routine care (purchasing pads, disposable underwear (diapers), laundry and dry cleaning). This constitutes a significant individual financial burden. Of the remaining 30%, 14% is spent on nursing home admission, 9% on treatment, 6% on addressing complications and 1% on diagnosis (Chong 2011). A study reported that about 1% of the median annual household income ( USD 50,000 to USD 59,999 in 2006) was spent by women on incontinence management. This study estimated that women spent an annual mean cost of USD 751 to USD 1277(2006 USD) on incontinence. This cost increases based on the severity of the symptoms (Subak 2008).The indirect cost associated exerts a social and psychological burden which is unquantifiable. (Chong 2011; Kilonzo 2004). Nevertheless, Birnbaum 2004 estimated that the annual average direct medical costs of SUI for one year (1998 USD) was USD 5,642 and USD 4,208 for indirect workplace costs. The cost of management and treatment of SUI appears to have increased over time due to increasing prevalence and increased desire for improved quality of life. This in turn has resulted from improved recognition of the condition, as well as increased use of surgical and non‐surgical management procedures.
Surgical procedures designed to treat urinary incontinence generally aim to improve support to the vesico‐urethral junction and correct deficient urethral closure. The precise mechanism whereby differing procedures improve continence continues to be a matter of debate, making selection of the most appropriate option for an individual difficult. The surgeon's preference, co‐existing urogenital problems, anatomical features of the bladder outlet and co‐morbidity suffered by the patient can all influence the choice of procedure. Numerous surgical methods have been described which can be subdivided into seven main categories:
-
open abdominal retropubic colposuspension (Lapitan 2005);
-
anterior vaginal repair (anterior colporrhaphy) (Glazener 2001);
-
suburethral sling procedure (Bezerra 2001);
-
bladder neck needle suspension (Glazener 2004);
-
periurethral or transurethral injection of bulking agents (current review);
-
artificial urinary sphincter (Silva 2011 ‐ male study);
-
laparoscopic colposuspension (Dean 2006).
This review focused on the effectiveness of periurethral or transurethral injection therapy. The alternative surgical approaches are considered in other reviews as referenced.
Urethral mucosal coaptation (that is the urethral lining lying in such a way that there is closure of the urethral lumen at rest) is encouraged by properties of the mucosa itself, the presence of submucosal vascular cushions and activity of smooth muscle elements. It is considered to be an important component of the mechanism of urinary continence in women. The injection of bulking agents into the urethral submucosa is designed to create artificial urethral cushions that can improve urethral coaptation and hence restore continence.
Due to the short length and relative accessibility of the female urethra, the technique for administering urethral bulking agents by injection for treatment of stress incontinence is relatively simple and can be achieved under local anaesthesia. The agent is injected into the submucosa at two or more sites at the same level of the proximal urethra under endoscopic control. Traditionally this has been at a level just distal to the bladder neck but more recently, as a consequence of surgical experience with minimally invasive mid‐urethral tapes, the latter site has also been used. The needle for injection can either be advanced transurethrally through the urethroscope or periurethrally via small perineal incisions. The viscous nature of the agents currently used requires a high pressure injection device. Endoscopic control is essential to ensure accurate placement of the substance into the submucosal layer and to demonstrate adequate expansion. The use of local anaesthesia allows an immediate check on the adequacy of coaptation by asking the patient to cough or perform a Valsalva manoeuvre (Walsh 1998).
The nature of the bulking agent utilised may also vary the effect. Ideally, a urethral bulking agent should be non‐immunogenic and biocompatible, leading to minimal inflammatory and fibrotic response. The particles that make up the agent should be of sufficient size to prevent migration away from the site of injection (diameter greater than 80 µm) and of sufficient durability to maintain their effect over time. Potential local side effects include urinary tract infection, urinary retention, local pain, pseudo‐abscess formation and urethral erosion. Distant effects as a result of particle migration are generally site specific and include pulmonary embolism. In the case of an immunogenic agent there remains the possibility of a non‐specific systemic response. Generally, the agents currently available consist of particles suspended in a bio‐degradable carrier gel. They include the following.
Autologous fat
Use of an agent harvested from the patient would be attractive in terms of the reduction in immunogenicity. Fat cells harvested from the abdominal wall by suction are washed and re‐suspended in saline prior to injection. Rapid digestion and potential migration of this material has halted further development of this option (Lee 2001).
Carbon beads (Durasphere™)
This agent consists of carbon‐coated zirconium beads suspended in a polysaccharide carrier gel and was designed to have minimal risk of migration and to be durable (Lightner 2002).
Calcium hydroxylapatite (CaHA) (Coaptite™)
Coaptite™ consists of calcium hydroxylapatite (CaHA) spherical particles and an aqueous gel carrier (Mayer 2007). As a normal constituent of bone it is non‐immunogenic and was approved by the US Food and Drug Administration (FDA) for the treatment of intrinsic sphincter deficiency in 2005.
Ethylene vinyl alcohol copolymer (EVOH) (Uryx™)
Uryx™ consists of ethylene vinyl alcohol copolymer (EVOH) in a dimethyl sulphoxide carrier (Dmochowski 2004). It was voluntarily withdrawn from the market by Bard in 2006, two years after its introduction, possibly as a result of reported high rates of urethral erosion (Hurtado 2009).
Glutaraldehyde cross‐linked bovine collagen (Contigen™)
Glutaraldehyde cross‐linked bovine collagen (GAX‐collagen) is formed by cross‐linking bovine dermal collagen with glutaraldehyde and dispersing it in phosphate‐buffered physiological saline (Chaliha 1995). GAX‐collagen contains at least 95% of type I collagen and 1% to 5% of type III collagen. A skin test must be performed prior to injecting GAX‐collagen to detect a hypersensitivity reaction. Late complications have included delayed skin reactions and arthralgia as well as more serious complications such as pulmonary embolism and osteitis pubis. It remains the most widely used injectable, worldwide, and was used as the control arm in the majority of trials included in this review.
Hyaluronic acid with dextranomer (Zuidex™)
This combination of a hydrophilic dextran polymer in a non‐animal stabilised hyaluronic acid base has been used extensively in the treatment of paediatric reflux with an excellent safety profile. It has been marketed as Zuidex™ for injection via a novel Implacer™ device designed to deliver four injections of the bulking agent at mid‐urethral level without the need for cystoscopic guidance. Concerns about high levels of pseudo‐abscess formation have led to its withdrawal from the market (Lightner 2009).
Porcine dermal implant (Permacol™)
Permacol™ consists of non‐reconstituted porcine dermal collagen. Non‐collagenous material, except elastin, is removed from porcine dermis and a cross‐linking process performed. The implanted collagen retains its original three‐dimensional structural architecture. This can provide a permanent support for the in‐growth of new tissue. In contrast to GAX‐collagen, this product is non‐allergenic (Tissue Science Laboratories plc).
Polytetrafluoroethylene (Polytef™)
Polytetrafluoroethylene (Polytef™) is produced by the pyrolysis of Teflon™. The bulking agent that is used for injection therapy is a paste comprising polytetrafluoroethylene, glycerine and polysorbate (Chaliha 1995). Evidence of particle migration has now stopped the clinical use of this product.
Silicon particles (Macroplastique™)
Macroplastique™, a silicone polymer, is one of the more recent injectable treatments to be studied (Chaliha 1995). It is made from highly textured poly‐dimethyl‐siloxane macro particles suspended within a bio‐excretable carrier hydrogel of polyvinylpyrrolidone (povidone or PVP). The majority of the solid particles are greater than 100 µm in diameter, reducing the risk of migration. It has recently been approved by the FDA for use as an intra‐urethral bulking agent.
Experimental agents
The search for bulking agents that fulfil the ideal criteria continues. The synthetic agents silicone micro balloons and alginate gels together with autologous chondrocytes and autologous myoblasts have been the subject of phase I and phase II studies (Lightner 2002). More recently, Strasser has published two papers on clinical studies of the latter (Strasser 2007), but one of these (which would have been eligible for inclusion in this review) has subsequently been withdrawn by the publishers, putting into question the validity of the results of both. Carr and colleagues (Carr 2009) also used autologous muscle‐derived cells in 29 women with stress incontinence, with a good safety profile, but did not include a non‐treatment arm in the study. A further study has recently been published of 12 women with previous failed surgical management of stress incontinence, which suggests that autologous myoblast injection is a safe and promising second‐line therapy (Sèbe 2011). It is to be hoped that further well‐designed randomised controlled trials will be set up in the future.
Objectives
To determine the effects of periurethral and transurethral bulking agents on cure or improvement of urinary incontinence in women.
The following comparisons will be made:
-
urethral injection therapy versus no treatment;
-
urethral injection therapy versus non‐surgical management;
-
urethral injection therapy versus other surgical managements;
-
one material for injectable treatment versus another;
-
one route of injection versus another route.
Methods
Criteria for considering studies for this review
Types of studies
All randomised or quasi‐randomised controlled trials in the treatment of urinary incontinence in women, in which at least one management arm involved urethral injection therapy.
Types of participants
Women with urinary incontinence. Classification of diagnoses was as defined by the trialists.
Types of interventions
Eligible trials were those in which at least one arm of a trial involved injection therapy for treating urinary incontinence.
Types of outcome measures
1. Participant observations (subjective)
Number cured (full continence achieved) within the first year of treatment
Number improved but not fully continent within the first year of treatment
Number cured (full continence achieved) after the first year of treatment
Number improved but not fully continent after the first year of treatment
Presence of urinary urgency and urge incontinence (new or persistent)
Restriction of activities
Satisfaction with treatment
2. Quantification of symptoms (objective)
Number of pads used in 24 hours
Number of incontinent episodes in 24 hours
Change following treatment as measured by defined pad test
3. Quality of life score
General health status measures (physical, psychological, other) e.g. Short Form 36 (Ware 1992)
Disease‐specific measures, specific instruments designed to assess the impact of incontinence e.g. the Incontinence Impact Questionnaire (IIQ) (Wyman 1987)
Psychological measures e.g. the Hospital Anxiety and Depression Scale (Zigmond 1983)
4. Clinical outcomes
Time to return to normal activities
Length of time taken to perform procedure
Length of hospital stay (if required)
Number of treatments required to achieve maximum benefit
Number of patients requiring more than one treatment to achieve maximum benefit
5. Adverse effects
Peri‐ and postoperative complications (infection at injection site, urinary tract infection, haemorrhage, persistent pain)
Complications due to particle migration
Voiding difficulties postoperatively and long term (hyper continence)
Presence of urgency
Presence of urgency and urge incontinence
Recurrence of incontinence (need for more treatment)
New urinary symptoms
Serious morbidity or mortality
Dyspareunia
6. Physiological measures
Degree of stress incontinence on urodynamic testing or provocation
New or persistent detrusor overactivity
Urethral closure pressure
7. Other outcomes
No prespecified outcomes judged important when performing the review
Search methods for identification of studies
We did not impose any language or other restrictions on the searches.
Electronic searches
This review has drawn on the search strategy developed for the Incontinence Review Group. Relevant trials were identified from the Group's Specialised Register of controlled trials, which is described under the Incontinence Group's details in The Cochrane Library. (For more details please see the ‘Specialized Register’ section of the Group’s module in The Cochrane Library.) The register contains trials identified from the Cochrane Central Register of Controlled Trials (CENTRAL), MEDLINE, CINAHL and handsearching of journals and conference proceedings. There are no language or other restrictions imposed on inclusion in the Specialised Register. The date of the most recent search of the register for this review was 8 November 2010.
The trials in the Incontinence Group Specialised Register are also contained in CENTRAL. The terms used to search the Incontinence Group Trials Register are given below:
({TOPIC.URINE.INCON*}) AND ({DESIGN.CCT*} OR {DESIGN.RCT*}) AND (INTVENT.SURG.INJECTIONS*)
(All searches were of the keyword field of Reference Manager 12, Thomson Reuters).
For a previous version of this review the review authors also performed additional specific searches. These are detailed in Appendix 1.
We performed additional searches for the Brief Economic Commentary (BECs). These were conducted in MEDLINE(1 January 1946 to March 2017), Embase (1 January 1980 to 2017 Week 12) and NHS EED (1st Quarter 2016). All searches were conducted on 6 April 2017. Details of the searches run and the search terms used can be found in Appendix 2.
Searching other resources
The review authors searched the reference lists of relevant articles for other possible trials. Direct contact was also made with investigators to ask for other relevant trials, published or unpublished.
Data collection and analysis
The titles, and where possible the abstracts, of all studies identified by the searches were appraised by two review authors (VK,TP in this update; see contributions of authors section for details for the original review and first update) to ascertain those likely to contain data concerning the effectiveness of injection therapy. The review authors, without prior consideration of the results, evaluated the full reports of all possibly eligible studies for methodological quality and appropriateness for inclusion. The assessment of risk of bias was undertaken by each review author using explicit criteria set by Cochrane. These include quality of random allocation and concealment, description of dropouts and withdrawals, analysis by intention‐to‐treat, and 'blinding' during treatment and at outcome assessment. Data extraction was undertaken independently by at least two review authors. Where data may have been collected but not reported, clarification was sought directly from the investigators.
Trial data were analysed as described in the Cochrane Handbook for Systematic Reviews of Interventions (Higgins 2005). For binary outcomes, the number of participants reporting an outcome was related to the number at risk in each group to derive the risk ratio (RR). For continuous variables, we used the mean and standard deviation to derive a mean difference (MD). When appropriate, meta‐analysis was planned using a fixed‐effect model with the 95% confidence interval (CI) calculated. Differences between trials was to be further investigated when significant heterogeneity (test of heterogeneity at 10% significance level) was found or appeared obvious from visual inspection of the results.
If data were available, we planned to group trial data by type of incontinence (urodynamic stress incontinence due to hypermobility or intrinsic sphincter deficiency based on urodynamic diagnosis, or stress urinary incontinence (SUI) based on symptom classification).
Any differences of opinion related to study inclusion, methodological quality or data extraction were resolved by discussion amongst the review authors, and, when necessary, referred to a third party for arbitration.
Studies were excluded from the review if they were not randomised or quasi‐randomised controlled trials of treatment for urinary incontinence, or if they made comparisons other than those prespecified. Excluded studies are listed with reasons given for their exclusion.
Results
Description of studies
Included and excluded studies
Fifty‐nine potentially eligible reports were identified. Thirty‐five reports met the inclusion criteria. Allowing for duplicate and triplicate reports of the same trials, 14 trials were included in this review (Anders 2002; Andersen 2002; Bano 2005; Corcos 2005; Dmochowski 2004; Ghoniem 2009; Kuhn 2008; Lee 2001; Lightner 2001; Lightner 2009; Maher 2005; Mayer 2007; Schulz 2004; ter Meulen 2009). Eighteen reports of 11 trials were excluded, including one study that would have been eligible for inclusion (Strasser 2007) but which had been retracted by the journal. Reasons for exclusions are given in the Characteristics of excluded studies table. A further six reports of four trials are ongoing: details are provided in the Characteristics of ongoing studies table. The flow of literature through the review process is shown in the PRISMA flow diagram (Figure 1).

PRISMA Study flow diagram ‐ showing the flow of literature through the review process
Publication type
Two of the trials were reported as abstracts only (Anders 2002; Dmochowski 2004) whilst the other 12 were full papers (Andersen 2002; Bano 2005; Corcos 2005; Ghoniem 2009; Kuhn 2008; Lee 2001; Lightner 2001; Lightner 2009; Maher 2005; Mayer 2007; Schulz 2004; ter Meulen 2009).
Sample characteristics
The sample sizes of the included trials ranged from 30 to 355. In all trials it was stated that participants had a urodynamic diagnosis of stress incontinence. Seven trials (Anders 2002; Andersen 2002; Ghoniem 2009; Lightner 2001; Lightner 2009; Maher 2005; Mayer 2007) only included women with stress urinary incontinence (SUI) due to intrinsic sphincter deficiency although the diagnostic criteria varied. Three trials included participants who had urethral hypermobility in addition to intrinsic sphincter deficiency (Corcos 2005; Lee 2001; ter Meulen 2009). One trial (Schulz 2004) included four women with a minor degree of symptomatic urge incontinence in addition to stress incontinence. Another trial (Anders 2002) included only women who were unfit for surgery and those for whom surgery had previously failed.
Comparison of interventions
-
One trial (Lee 2001) compared autologous fat with a placebo.
-
One trial (ter Meulen 2009) compared silicon particle (Macroplastique™) injection with pelvic floor exercises.
-
Two trials compared urethral bulking with other surgical techniques. Corcos (Corcos 2005) compared collagen injection with open surgery, which consisted of bladder neck suspension, sling procedure or Burch colposuspension. Maher (Maher 2005) compared silicon particle (Macroplastique™) injection with an open surgical pubovaginal sling procedure.
-
Eight trials (Anders 2002; Andersen 2002; Bano 2005; Dmochowski 2004; Ghoniem 2009; Lightner 2001; Lightner 2009; Mayer 2007) compared two different bulking agents. Two trials (Anders 2002; Ghoniem 2009) compared GAX‐collagen with silicon particles (Macroplastique™). Two trials (Andersen 2002; Lightner 2001) compared GAX‐collagen with carbon particles (Durasphere™). One trial compared Coaptite™ with collagen (Mayer 2007). Another trial compared Uryx™ with collagen (Dmochowski 2004) and a further trial compared porcine dermal implant (Permacol) with silicone injection (Macroplastique™) (Bano 2005). A single trial compared mid‐urethral hyaluronic acid with bladder neck collagen (Lightner 2009).
-
Two further trials (Kuhn 2008; Schulz 2004) compared different injection sites: periurethral versus transurethral injection in the former and mid‐urethral versus bladder neck in the latter.
Outcome measures
1. Subjective
Subjective measures of success were reported in all 14 trials with participants asked if they felt there was an improvement or cure of their symptoms.
2. Objective
An objective outcome measure in the form of a repeated standard pad test was reported for 14 trials; eight trials (Anders 2002; Andersen 2002; Bano 2005; Ghoniem 2009; Lee 2001; Lightner 2001; Maher 2005; ter Meulen 2009) used a one‐hour pad test and three trials used 24‐hour tests (Corcos 2005; Lightner 2009; Mayer 2007). Dmochowski reported pad weight reduction but details of the test used were not specified (Dmochowski 2004). Schulz used an unspecified quantitative pad test for preoperative comparison but did not report postoperative pad weights (Schulz 2004). Kuhn (Kuhn 2008) used a cough test.
3. Quality of life
Quality of life questionnaires were used in 11 trials:
-
four trials (Anders 2002; Lee 2001; Lightner 2009; Mayer 2007) used an unspecified disease‐specific questionnaire without details of validation;
-
three trials (Dmochowski 2004; Ghoniem 2009; ter Meulen 2009) used I‐QoL score;
-
Corcos (Corcos 2005) used the previously validated Short Form 36 and Incontinence Impact Questionnaire (IIQ) questionnaires;
-
Maher (Maher 2005) used the Short Urinary Distress Inventory (SUDI) and IIQ;
-
Schulz (Schulz 2004) used the SEAPI quality of life questionnaire;
-
Bano (Bano 2005) used the Kings College Hospital Quality of Health Questionnaire.
4. Clinical end points
One trial (Lightner 2001) assessed carbon bead stability by pelvic X‐ray film at one and two years following injection.
Complete follow‐up ranged from one month (Schulz 2004) to 18 months (Andersen 2002).
5. Adverse effects
One trial (Lee 2001) asked participants about new urinary symptoms such as urgency and urge incontinence. Six trials (Bano 2005; Corcos 2005; Lee 2001; Lightner 2001; Kuhn 2008; ter Meulen 2009) reported the number of patients who suffered acute retention of urine following the procedure. Adverse events were reported in five trials (Ghoniem 2009; Lee 2001; Lightner 2009; Mayer 2007; ter Meulen 2009).
6. Physiological
Post‐void residual urine was reported in two trials (Kuhn 2008; Schulz 2004) and maximum urethral closing pressure in three (Kuhn 2008; Lee 2001; Maher 2005). Abdominal leak point pressure was reported in two of these (Lee 2001; Maher 2005). Maximum flow rate was reported in one trial (Kuhn 2008).
Risk of bias in included studies
Allocation concealment
Two trials used an adequately concealed group allocation (Lee 2001; Schulz 2004). In the other 12 trials (Anders 2002; Andersen 2002; Bano 2005; Corcos 2005; Dmochowski 2004; Ghoniem 2009; Kuhn 2008; Lightner 2001; Lightner 2009; Maher 2005; Mayer 2007; ter Meulen 2009), no description of concealment was given.
Blinding
Participants were reported to have been 'blinded' to treatment allocation in four trials (Andersen 2002; Ghoniem 2009; Kuhn 2008; Lee 2001), although the precise method of concealment was not described for any of these trials. One reported 'single blinding' of assessors only (Mayer 2007). Six trials did not state whether patients had been blinded (Anders 2002; Bano 2005; Dmochowski 2004; Lightner 2001; Lightner 2009; Schulz 2004). In another three trials (Corcos 2005; Maher 2005; ter Meulen 2009), it was not possible to blind the participants to treatment allocation because of the nature of the comparative arm.
In eight trials (Andersen 2002; Corcos 2005; Kuhn 2008; Lee 2001; Lightner 2001; Lightner 2009; Maher 2005; Mayer 2007), the treatment provider was not blinded, whilst this aspect of trial design was not reported in six trials (Anders 2002; Bano 2005; Dmochowski 2004; Ghoniem 2009; Schulz 2004; ter Meulen 2009).
Five trials (Andersen 2002; Lee 2001; Lightner 2001; Lightner 2009; Mayer 2007) stated that blinding of the assessors to treatment allocation was undertaken but gave no description as to how this was achieved. The other nine trials (Anders 2002; Bano 2005; Corcos 2005; Dmochowski 2004; Ghoniem 2009; Kuhn 2008; Maher 2005; Schulz 2004; ter Meulen 2009) did not mention whether any attempt had been made to blind the assessors.
Data dependent stopping
One trial (Lee 2001) was terminated prior to reaching predetermined sample size due to safety concerns. Their report only included complete data at three months of follow‐up.
Dropouts and losses to follow‐up
In one trial (Anders 2002), all patients were followed up. Appropriate intention‐to‐treat analysis and reporting of dropouts was performed in a further six trials (Ghoniem 2009; Lightner 2009; Maher 2005; Mayer 2007; Schulz 2004; ter Meulen 2009). One report (Lightner 2001) concerned 12‐month outcome results in the initial 235 women from a total sample size of 355 women recruited to the trial. In one trial (Corcos 2005), 15 of 133 women refused the treatment to which they had been allocated and were not included in the analysis of the reported data, which was therefore not conducted on an intention‐to‐treat basis. In another trial (Andersen 2002), six out of 52 patients were lost to follow‐up. A further investigator reported one death and one withdrawal (Bano 2005). Another trial (Lee 2001) also described how many patients were lost to follow‐up and how many withdrew. One trial (Lightner 2001) did not report dropouts or losses to follow‐up and reported outcomes only from the initial 235 women from a total trial population of 355 women. Two trials (Dmochowski 2004; Kuhn 2008) did not report dropouts or losses to follow‐up.
Effects of interventions
The 14 eligible trials addressed three of the original four hypotheses and also generated an additional hypothesis which had not been defined prior to commencing the review (one route is better than another).
Comparison 01: injection versus no treatment
One eligible trial was found (Lee 2001) which compared periurethral injection of autologous fat with placebo injection of saline in 68 women and assessed the outcome at three months.
Participant observations
In the Lee trial (Lee 2001), amongst the group who received fat injections 22% (six out of 27) reported a cure or an improvement in their symptoms. The remaining 78% (21 out of 27) of participants did not feel their symptoms had changed. No participants experienced deterioration in their condition. The results were similar for the participants who were given a placebo injection of saline: 21% (six out of 29) of patients felt they were either cured or improved and 79% (23 out of 29) noticed no change in their condition, with none reporting worsening of symptoms (risk ratio (RR) 0.98, 95% confidence interval (CI) 0.75 to 1.29; Analysis 1.1).
Quantification of symptoms
A one‐hour pad test was performed. The mean post‐treatment pad weights were similar (14.8 g versus 18.5 g) with evidence of a skewed distribution (Analysis 1.2). The mean reduction in pad weight found in the autologous fat group was 5.5 g (27% reduction) compared with 5.5 g (23% reduction) for the placebo group.
Quality of life
This trial (Lee 2001), used a continence questionnaire to assess quality of life without reference to validity testing. For the treatment group, the mean continence questionnaire score fell from 13.2 pretreatment to 10.9 (17% reduction) after treatment. The mean score for the placebo group was 12.9 before intervention and 12.2 after injection (5% reduction); this result was not statistically significant (Analysis 1.3).
Clinical end points
A total of 91 injections (mean of 2.6 injections) were carried out in the treatment group compared to 98 (mean of 3.0 injections) in the placebo group. There was no significant difference between the groups in the number of patients receiving more than one injection (Analysis 1.4). All patients required more than one treatment to achieve improvement.
Adverse effects
The complication rate was 32% (29 out of 91) for the treatment injections and 11% (11 out of 98) for the placebo injections (RR 2.84, 95% CI 1.51 to 5.35; Analysis 1.5); this was statistically significant favouring the control. Six patients developed urinary retention after injection of fat in contrast with none from the placebo group. Nine individuals had urinary tract infections; six of these patients were treated with autologous fat and three received placebo injection. Two individuals in the placebo group developed an infection at the liposuction site. Of the 91 injections of fat performed, 17 (19%) were injected into the wrong site (eight were intra‐urethral, four intravaginal, and five intravesical). Six of the 98 (6%) saline injections were incorrectly placed (two were intra‐urethral and four intravaginal). There was one death in the treatment group due to particle migration and subsequent fat embolism in the lung and one other death, whilst no deaths were reported in the placebo group (Analysis 1.6).
Physiological measures
No significant changes in maximum urethral closing pressure or abdominal leak point pressure were seen in either group.
Comparison 02: injection versus conservative management
One trial was identified (ter Meulen 2009) which compared Macroplastique™ injection (n = 24) with a home pelvic floor exercise programme (n = 21).
Participant observations
At three months, treatment failure was less marked for Macroplastique™ when considering both complete cure (Stamey grade 0) and cure or marked improvement (Stamey grade 0 or 1) (RR for non‐cure 0.70, 95% CI 0.52 to 0.94 (Analysis 2.1) and RR for non‐improvement 0.22, 95% CI 0.03 to 1.81 (Analysis 2.2), respectively).
Quantification of symptoms
The mean number of pads used at three months in the Macroplastique™ group fell from 3.4 to 1.9 and the number in the control group fell from 2.7 to 2.5. The SD was not reported so the data could not be analysed in RevMan.
Quality of life
The Dutch validated I‐QoL questionnaire was used. The mean score at baseline was 2.59 for Macroplastique™ and 2.96 for the control group. At three months these values were 3.03 and 3.2 respectively. There was a significant difference between the two groups in terms of change from baseline (mean difference (MD) 0.54, 95% CI 0.16 to 0.92; Analysis 2.3).
Clinical end points
An additional Macroplastique™ injection was performed in three of the 24 women after the three‐month follow up. A further five received other continence treatment because of treatment failure. No figures were given for the control group for comparison.
Adverse effects
There were 37 episodes of urinary retention in the Macroplastique™ group and none in the pelvic floor exercise group (Analysis 2.4). Other side effects in the Macroplastique™ group included mild pain (8%), haematuria (8%), dysuria (47%), de novo urgency (21%) and implant leakage (8%). Dysuria and retention were transient in all but one, who had a new onset of anterior vaginal wall prolapse and persistent retention.
Physiological measures
No data were reported.
Comparison 03: injection versus other surgical managements
Two trials compared injection therapy with open surgery (Corcos 2005; Maher 2005). Corcos and colleagues compared collagen injection with one of three possible surgical interventions in 133 women. Maher compared Macroplastique™ injection with pubovaginal sling in 45 women.
(i) Collagen injection with one of three possible surgical interventions
In the Corcos 2005 trial, the surgery consisted of open Burch colposuspension (n = 24), an open sling procedure (n = 24) or open bladder neck suspension (n = 6). The method of injection was not stated. The method of decision‐making regarding the surgical option was not stated. The outcome was assessed at 12 months.
Participant observations
Corcos reported data on those who were not satisfied (32.8% with injection therapy and 20.4% following open surgery). This result was said not to be statistically significant but the data reported were not suitable for further analysis within RevMan as the denominator was unknown and it was not clear whether this referred to an intention‐to‐treat or per protocol analysis.
Quantification of symptoms
A 24‐hour pad test was performed with cure defined as an increase in pad weight when tested following treatment of less than 2.5 g in combination with no additional interventions being required. Using these criteria and a per protocol with verbal update analysis, 53% (34 out of 64) of the collagen group were cured compared with 72% (39 out of 54) of the open surgery group. The number of participants not cured after treatment was statistically significant favouring open surgery, that is more people were cured after open surgery (RR 1.69, 95% CI 1.02 to 2.79; Analysis 3.2.1), but statistical significance was not reached if an intention‐to‐treat analysis was performed (Corcos 2005).
Quality of life
In the Corcos trial (Corcos 2005) the Short Form 36 questionnaire and a disease‐specific questionnaire (IIQ) were used. No statistically significant differences were reported between the two groups following treatment for seven of the eight domains of the Short Form 36 and for the IIQ questionnaire (Analysis 3.4.1).
Adverse effects
Overall, 36 complications occurred in the 64 patients (56%) who were given collagen injections whilst the 54 patients who underwent surgery suffered a total of 84 complications (64%). It was stated that complications were significantly more frequent and severe in the open surgery group but the nature of these complications was not described or discussed.
Physiological measures
No data were reported.
ii) Macroplastique™ injections compared with the pubovaginal sling
In another trial, Maher 2005 compared Macroplastique™ injections in 23 women with the pubovaginal sling in 22 women. Outcomes were assessed at six weeks and six‐monthly intervals thereafter. Data from the first six months were analysed using RevMan for the purpose of this review.
Participant observations
Nine out of 22 Macroplastique™ patients self‐reported that they were not satisfied compared to four out of 21 who had a pubovaginal sling. This difference was not statistically significant (RR 2.15, 95% CI 0.78 to 5.92; Analysis 3.5.2). Similarly, there was no statistically significant difference in numbers subjectively cured, which was defined as women with incontinence occurring once or more a week: five out of 22 with Macroplastique™ compared to two out of 21 with surgery (RR 2.39, 95% CI 0.52 to 10.99; Analysis 3.1.1) (Maher 2005).
Quantification of symptoms
Repeat urodynamic studies were used to determine objective cure, which was defined as no urinary leakage due to stress urinary incontinence (SUI) on repeat urodynamic studies. At six months 20 out of 22 (91%) Macroplastique™ patients were not cured compared to four out of 21 (19%) pubovaginal sling patients (RR 4.77, 95% CI 1.96 to 11.64; Analysis 3.2.2). The result was statistically significant. A one‐hour pad test was carried out as well. Data provided could not be analysed using RevMan but a median pad weight of 5 g (range 0 g to 57 g) was reported for those who had Macroplastique™ compared to a median of two g (range 0 g to 20 g) in those who had surgery. This was not statistically significant (P = 0.57).
Quality of life
There were no data suitable for analysis. However, the trial reported no statistical differences in median Short Urinary Distress Inventory (SUDI) scores and Incontinence Impact questionnaire (IIQ) scores between the two groups at six months.
Clinical end points
Seven out of 22 women in the injection therapy group underwent additional injections or surgery. One woman who had a sling had further surgery.
Adverse effects
There were two urinary tract infections (UTIs) in the injection group and three in the sling group. One incisional hernia was reported in the sling group.
Physiological measures
There was no significant difference in the pre‐ and postoperative change in maximal urethral closure pressure (MUCP) between groups. Data available were not analysable using RevMan.
Comparison 04: one material for injection versus another
Eight trials compared one type of injectable material versus another (Anders 2002; Andersen 2002; Bano 2005; Dmochowski 2004; Ghoniem 2009; Lightner 2001; Lightner 2009; Mayer 2007).
Another paper comparing autologous myoblasts and fibroblasts versus collagen Strasser 2007, which would have been eligible for this review, was withdrawn by the Lancet following publication. An Austrian Ministry of Health report commissioned to investigate allegations of misconduct, found that the trial was not conducted according to the standards of Austrian law or to the standards of the International Conference on Harmonisation of Good Clinical Practice. The Lancet felt that so many irregularities had been identified in the conduct of the work that it should be retracted from the published record. The trial had reported complete continence in 38/42 women treated with autologous cells as compared to 2/21 treated with collagen. The only side effects noted in either group were three autologous cell and two collagen patients requiring transient catheterisation.
(i) Carbon particles versus collagen
Lightner 2001 assessed patients one year from the start of the trial whilst (Andersen 2002) assessed patients at a mean of 32.2 months follow‐up.
Patient observations
Lightner 2001 reported that of the group who received carbon particle injections, 66% (76 out of 115) reported cure or improvement whilst 34% (39 out of 115) noticed no improvement in their symptoms within one year of treatment. Of the collagen group 66% (79 out of 120) of individuals experienced cure or an improvement in their symptoms whereas 34% (41 out of 120) felt their condition was not improved by the treatment. There was no statistically significant difference in subjective outcome (RR 0.99, 95% CI 0.70 to 1.42; Analysis 4.1.1). Andersen 2002 reported a trend towards a better outcome after one year of treatment with carbon particles with regard to cure (40%, 10 out of 25 versus 14.3%, three out of 21) and improvement of symptoms (80%, 20 out of 25 versus 61.9%, 13 out of 21), but the results were not statistically significant (RR 0.70, 95% CI 0.49 to 1.01 (Analysis 4.2.1) and RR 0.53, 95% CI 0.20 to 1.36 (Analysis 4.4.1), respectively).
Quantification of symptoms
A one‐hour pad test was used by Lightner 2001 to quantify the amount of urine lost. The results were reported as mean pad weights post‐treatment and as the change in pad weight at 12 months following treatment compared with prior to treatment; however, standard deviations were not provided. The mean decrease in pad weight was 27.9 g (59%) for the carbon particle group compared with 26.4 g (63%) for those in the collagen group. There was no significant difference in objective urine loss between the two groups. Andersen 2002 did not provide data on quantification of symptoms.
Quality of life
No data were reported.
Clinical end points
The mean number of injections was similar in both groups: 1.7 for carbon particles compared with 1.6 for collagen. Andersen 2002 did not provide these data.
Adverse effects
Urinary urgency was significantly more common following carbon particle injection in one trial (Lightner 2001), occurring in 25% of participants, but had resolved in most (90%) by the end of the trial. The risk of urgency was lower in the collagen group (12%) but resolved in fewer at 12 months (64%). Urinary retention was significantly more common in the carbon particle group (30 out of 177, 17%) compared to those who received collagen (six out of 178, 3%) but resolved in all those affected within seven days of the procedure. Andersen 2002 did not provide these data.
Physiological measures
No data were reported.
(ii) Silicone particles versus collagen
Two trials addressed these interventions (Anders 2002; Ghoniem 2009).
Participant observations
Using an intention‐to‐treat analysis of Ghoneim's data (Ghoniem 2009), Macroplastique™ showed an advantage in terms of Stamey grade cure (dry) at 12 months (RR 0.84, 95% CI 0.71 to 0.99; Analysis 4.1.2); 77 out of 122 (63%) remained incontinent following injection of silicone particles compared to 94 out of 125 (75%) for GAX‐collagen. With regard to patient‐reported improvement of symptoms, 23 out of 102 had no or only slight improvement following injection of silicone compared to 30 out of 94 who received collagen, no statistically significant advantage was seen.(RR for non‐improvement 0.71, 95% CI 0.44 to 1.13; Analysis 4.3.1).
Quantification of symptoms
A one‐hour pad test was used to quantify urinary loss in both trial groups but the reported data were not suitable for meta‐analysis. In Anders 2002, mean urinary loss was significantly lower in the silicone group prior to treatment at 22 mL compared with 55 mL in the collagen group. Urinary loss decreased in both groups following treatment and there were no significant differences found between the two groups at one, six or 12 months. The trial groups in Ghoniem 2009 showed no significant differences in pad weight loss at baseline (27.8 mL (SD 40.2) for Macroplastique™ and 29.0 mL (38.4) for collagen; P = 0.82) nor in the average decrease in urine loss from baseline (25.4 mL (39.4) for Macroplastique™ compared to 22.8 mL (35.0) for collagen) (MD 2.60, 95% CI ‐7.82 to 13.02; Analysis 4.6.3).
Quality of life
Anders (Anders 2002) used a disease‐specific quality of life questionnaire in 40 of the original 60 women, who remained available for longer‐term follow‐up (36 to 80 months). It was stated that quality of life improved significantly after treatment in both groups without significant differences between the two groups before or after treatment. These data could not be analysed in RevMan as no standard deviations were reported. Similarly, Ghoniem 2009 did not provide analysable data but reported a significant improvement from baseline in both groups, with similar improvements in the I‐QOL subscales.
Clinical end points
In one trial (Anders 2002), fewer participants in the collagen group required repeat injections (eight out of 26 patients in the collagen group compared with 15 out of 34 in the silicone group) but this result was not statistically significant (RR 1.43, 95% CI 0.72 to 2.86; Analysis 4.8.1). In the other trial (Ghoniem 2009) there was no difference in total injected implant volume between the groups (Macroplastique™ compared to collagen MD ‐0.40, 95% CI ‐1.17 to 0.37; Analysis 4.9.1).
Adverse effects
Ghoneim reported no significant difference between the two groups in terms of overall adverse events (Ghoniem 2009). Individual adverse events were tabulated in the paper and neither treatment showed an advantage in any category.
Physiological measures
No data were reported.
iii) Calcium hydroxylapatite (CaHA) versus collagen
Patient observations
In one small trial (Mayer 2007) CaHa looked marginally superior with regard to improvement of one or more Stamey grades at 12 months: 37% versus 43% who improved with collagen (RR 0.85, 95% CI 0.62 to 1.17; Analysis 4.4.2). Neither that result nor the results for substantial improvement (two or more grades, Analysis 4.4.3) reached statistical significance. Nor was there a difference in the failure rate at 12 months: 61% versus 63% (RR 0.97, 95% CI 0.79 to 1.19; Analysis 4.2.2) but the confidence intervals were wide.
Quantification of symptoms
No data were reported.
Quality of life
Both groups demonstrated an improvement in mean IQOL score at 12 months (CaHa: 31; collagen: 26). The difference between the two treatment arms was reported as non‐significant but insufficient information was given to analyse the data within Revman.
Clinical end points
38% of CaHa patients had only one injection compared with 26% of collagen patients. A P value of 0.03 was reported but insufficient detail was provided to allow analysis using Revman.
Adverse effects
Transient retention was reported in 41% of 158 women in the CaHa group and 33% of 138 women in the collagen group. This did not reach statistical significance. De novo urge incontinence was significantly higher in the collagen group: 12.3% compared to 5.7% of the CaHa group (Analysis 4.12.1). Eleven CaHa patients and 12 collagen patients were reported to have experienced serious adverse events although only two of these (both in the CaHa group) were felt to have been treatment related (vaginal erosion and tracking of injectable under trigone obscuring the ureteric orifice). The difference was not statistically significant (Analysis 4.10.1).
Physiological measures
No data were reported.
iv) Ethylene vinyl alcohol copolymer (EVOH) versus collagen
One trial compared these two types of injectable material (Dmochowski 2004).
Participant observations
In an earlier report of what is presumed to be the same trial (Dmochowski 2002) there was no statistically significant difference in cure rates with EVOH compared with collagen: 14 out of 38 not cured versus 11 out of 20 (RR 0.67, 95% CI 0.38 to 1.19; Analysis 4.1.3). The more recent publication with larger numbers was in abstract form only and no comment was made as to any of the outcomes reaching statistical significance. Insufficient information was given to allow analysis in RevMan.
Quantification of symptoms
No analysable data.
Quantification of symptoms
No analysable data.
Quality of life
No data were reported.
Clinical end points
No data were reported.
Physiological measures
No data were reported.
v) Porcine dermal implant injection (Permacol™) versus silicone particles (Macroplastique™)
Participants were assessed at six weeks and six months in one small trial (Bano 2005). Data from the six month assessment were analysed using RevMan.
Patient observations
Ten out of 24 had no improvement in Stamey grade following injection with PermacolTM while 14 out of 24 had no improvement following Macroplastique™. This difference was not statistically significant (RR 0.71, 95% CI 0.40 to 1.28; Analysis 4.3.3). Nor was a difference found using the Kings College Hospital Quality of Health questionnaire: 10 out of 24 who received Permacol™ had no improvement in symptoms compared to 17 out of 24 of those that received Macroplastique™ (RR 0.59, 95% CI 0.34 to 1.01; Analysis 4.3.4).
Quantification of symptoms
Pad weights were not reported. However, an improvement in an objective pad test was seen in 15 out of 24 who were dry following Permacol™ compared to 9 out of 24 of those in whom Macroplastique™ was used (RR 0.60, 95% CI 0.33 to 1.10) (Analysis 4.1.4).
Quality of life
The Kings College Quality of Health questionnaire was used to assess improvements in symptoms. The results are already reported above under 'Patient observations'.
Clinical end points
No data were reported.
Adverse effects
Urinary retention occurred in two out of 25 in the porcine dermis implant group and three out of 25 in the silicone group (RR 0.67, 95% CI 0.12 to 3.65; Analysis 4.11.2). Urgency urinary incontinence occurred in one patient in each group.
Physiological measures
No data were reported.
vi) Dextranomer and hyaluronic acid (Zuidex™) versus collagen
A total of 344 women were included in this 2:1 randomisation trial of Zuidex™ via the Implacer device versus transurethral bladder neck collagen (Lightner 2009).
Patient observations
An improvement of at least one grade in Stamey score at 12 months was reported in 51.2% of women who received Zuidex™ compared to 54.5% with Contigen™ (RR for non‐improvement 1.08, 95% CI 0.85 to 1.37; Analysis 4.3.6). This difference was not statistically significant.
Quantification of symptoms
Zuidex™ was associated with a lower cure rate, defined as < 2 g leakage, on a provocation test (RR for non‐cure 1.14, 95% CI 0.94 to 1.39; Analysis 4.1.5) and was shown to be less effective in reducing leakage from baseline by 50% or more (RR for non‐improvement 2.14, 95% CI 1.37 to 3.36; Analysis 4.3.5). Mean loss on provocation also showed an inferior outcome for Zuidex™. The urine loss on the pad test was higher with Zuidex™ (43.7 g, SD 5.1) than with Contigen™ (18.3 g, SD 3.5) (MD 25.40, 95% CI 24.27 to 26.53; Analysis 4.6.4); 53.7% of Zuidex™ patients had a reduction in incontinence episodes as compared to 66.5% of collagen‐treated patients. This was not reported as a statistically significant difference and could not be analysed further from the data available.
Quality of life
No data were reported.
Clinical end points
The number of injections given ranged from zero to three and was similar in both groups. There was no significant difference between the groups in the number of patients requiring more than one treatment (RR 1.07, 95% CI 0.91 to 1.25; Analysis 4.8.2). The mean total volume injected was greater in the collagen group (9.1 mL versus 5.5 mL) and this difference was statistically significant (MD ‐3.50, 95% CI ‐4.60 to ‐2.40; Analysis 4.9.2).
Adverse effects
Adverse events were more frequent in the Zuidex™ group: 68% versus 50% in the collagen‐treated patients (RR 1.35, 95% CI 1.10 to 1.64; Analysis 4.10.2). Retention, dysuria and urinary tract infection rates were similar for the two groups but micturition urgency (11% Zuidex™, 4.3% collagen) and injection site pain (8.4% Zuidex™, 2.6% collagen) were more frequently reported in the Zuidex™ group. Injection site sterile abscess (8.4%), injection site mass (4.4%) and pseudo‐cyst formation (2.2%) were only seen in the Zuidex™ group (RR for injection site complications 37.78, 95% CI 2.34 to 610.12; Analysis 4.13.1); 28 of the 36 patients with periurethral collections required secondary outpatient drainage procedures.
Physiological measures
No data were reported.
Comparison 05: one route of injection versus another
This hypothesis was not included in the original protocol.
In the last update, a comparison of paraurethral versus transurethral dextran co‐polymer and hyaluronic acid was included (Schulz 2004). This involved 40 women and follow‐up was carried out at 12 months.
Two further trials have subsequently been published. Kuhn 2008 compared transurethral injection of collagen placed at two different sites (mid‐urethral versus bladder neck) in 30 women.
Another trial (Lightner 2009) looked at mid‐urethral versus proximal urethral injection but used different agents at each site (dextranomer and hyaluronic acid for the former and collagen for the latter). As a consequence it was not possible to determine with any certainty whether the observed differences in outcome were a consequence of the injection site or the bulking agent used. The latter is thought more likely and the paper has already been discussed in 'Comparison 4, subsection vi: Dextranomer and hyaluronic acid (Zuidex™) versus collagen' above. This trial is not reported again in this section.
(i) Periurethral versus transurethral injection (Schulz 2004)
Participant observations
In one small trial (Schulz 2004), cure or improvement sustained to 12‐month follow‐up was noted in only one out of 17 (6%) who had periurethral injection compared with three out of 17 (18%) who underwent transurethral injection. The difference between periurethral and transurethral injection was not statistically significant (RR 1.14, 95% CI 0.89 to 1.47; Analysis 5.1.1).
Quantification of symptoms
No analysable data were provided.
Quality of life
Quality of life was assessed using the SEAPI questionnaire, but again no details of this outcome were reported.
Clinical end points
The injected volume was higher in the six periurethral patients who developed retention (in comparison to the single transurethral retention patient) but was not significantly different for the groups as a whole. Standard deviations were not supplied to allow analysis within RevMan. One patient from each group required a general anaesthetic for the procedure. There was no significant difference in the volume of bulking agent injected in each group (3.9 mL and 3.5 mL, respectively) or the observed bulking effect.
Adverse effects
Overall, the numbers were too few to assess differences in adverse effects: 30% (six out of 20) of patients developed retention of urine following periurethral injection compared with 5% (one out of 20) with transurethral injection (RR 6.00, 95% CI 0.79 to 45.42; Analysis 5.2.1). They reported no significant difference in the number of urinary tract infections between the two groups though no data were provided for analysis. Twenty patients did not complete follow‐up due to recurrent or persistent incontinence. It was not stated precisely to which groups these patients were allocated.
Physiological measures
Valsalva leak point pressure (VLPP) and maximum urethral closure pressure (MUCP) were performed in 14 of the 20 patients at 12‐month follow‐up but the results were not reported.
ii) Bladder neck versus mid‐urethral injection (Kuhn 2008)
Participant observations
In another small trial (Kuhn 2008), median patient satisfaction was 8 (95% CI 5 to 9) in the mid‐urethral group and 8 (95% CI 7 to 10) in the bladder neck group. This was reported in the trial as a significant difference in favour of mid‐urethral injection but further analysis of the data, as part of this review, could not be carried out.
Quantification of symptoms
A total of 5/15 of the mid‐urethral group and 6/15 of the bladder neck group continued to have a positive cough test (persistent SUI) postoperatively. This difference did not reach statistical significance (RR 0.83, 95% CI 0.32 to 2.15; Analysis 5.1.2).
Quality of life
No data were reported.
Clinical end points
No data were reported.
Adverse effects
There was no statistically significant difference in the number of women who experienced postoperative retention lasting less than 48 hours: four women in the mid‐urethral group and none in the bladder neck group (RR 9.0, 95% CI 0.53 to 153.79; Analysis 5.2).
Physiological measures
Maximum urethral closure pressure increased and maximum flow rate decreased postoperatively in both groups but no significant difference was reported between the two groups. The available data were not suitable for further analysis.
Other outcomes
No analysable data.
Discussion
This systematic review identified 14 eligible trials that addressed all of the pre stated hypotheses, and also identified an additional trial that addressed a hypothesis that had not been pre stated concerning the route of injection. Two of the trials identified have, as yet, only been published in abstract form with limited original data. These authors have been contacted to ascertain their intentions for full publication or personal communication of complete data. Of the nine remaining trials, one was closed before full recruitment. The small number of trials identified, together with the paucity of published data meant that few data could be tabulated. All analyses had wide confidence intervals indicating considerable uncertainty.
To supplement the main systematic review of effects, we sought to identify economic evaluations which have compared periurethral or transurethral injection with each of the comparators listed in the Background. Details of the search strategies are given in Appendix 2.The supplementary search in NHS EED, MEDLINE and Embase identified three such economic evaluations (Berman 1997; Kunkle 2015; Oremus 2003) that compared urethral injection with other surgical managements. No study was found for the other comparators.
Comparison 01: urethral injection therapy is better than no treatment
No further publications have been identified since the last update. One trial (Lee 2001) compared periurethral injection of autologous fat with placebo injection of saline. The trial was complicated by the death of a participant from fat embolism three days following her second injection. The investigators subsequently elected to terminate the trial with 56 participants rather than recruit the originally planned sample of 90 women. The methodology of the trial appeared sound but early termination meant that it had less power than intended. The trial found no difference in subjective or objective outcome measures between the two groups suggesting that periurethral injection of autologous fat is no more effective than saline injection for the treatment of urodynamically defined stress incontinence. The poor efficacy and unsatisfactory safety profile of autologous fat injection demonstrated by this trial has resulted in this agent being no longer used for urethral bulking. The lack of change in urodynamic parameters suggests that the technique did not achieve an increase in urethral opening pressure. The improvement in pad weight following saline injection that was found in this trial does suggest that a placebo arm should be present in future trials of urethral bulking agents.
Comparison 02: urethral injection therapy is better than conservative management
Since this review was last updated in 2007, a comparative trial of urethral bulking agent injection with the present standard of conservative treatment, pelvic floor muscle training, has now been published (ter Meulen 2009). Macroplastique™ appears to show an advantage over home pelvic floor exercises at three months but it is not known if this benefit is sustained in the medium to long term. This needs to be balanced against the relatively high incidence of adverse events (retention in 73% and dysuria in 47%). No relevant economic evidence was identified for the Brief Economic Commentary (BEC).
Comparison 03: urethral injection therapy is better than other surgical managements
No further publications have been identified since the last update. Two trials tested this hypothesis (Corcos 2005; Maher 2005).
In the paper by Corcos (Corcos 2005), there was a relatively high number of post randomisation dropouts in the open surgery group who were not included in the data analysis (19%) and this could have introduced bias. Overall, surgery was more effective than collagen injection although 50% of women in the latter group were satisfied at 12 months following injection. The investigators felt that urethral bulking with collagen may represent a worthwhile first‐line treatment for stress urinary incontinence (SUI) because it is associated with a lower complication rate. This trial did not report longer‐term follow‐up although experimental trials suggest that injected collagen is degraded over a two‐year period.
In the trial by Maher 2005, a clear advantage in objective cure (defined as no urinary leakage due to stress urinary incontinence on repeat urodynamics) was demonstrated at six months for pubovaginal sling (81%, 17 out of 21) versus transurethral Macroplastique™ (9%, two out of 22). Injection therapy was also noted to be more expensive than surgery in this trial. Advantages for injection therapy were lower morbidity with equivalent symptomatic and patient satisfaction rates at six‐month follow‐up. At five years, 69% (nine out of 13) of patients were satisfied with sling surgery versus 29% (four out of 14) of those who received Macroplastique™. There was, however, only a 60% long‐term follow‐up rate in this trial so this finding must be interpreted with caution.
Economic evidence
The surgical managements compared with urethral injection therapy were traditional suburethral sling, retropubic mid‐urethral slings and transobturator mid‐urethral slings, In a comparative cost‐analysis of a retrospective observational study conducted by Berman 1997 in the USA, traditional suburethral sling procedure was compared with transurethral collagen injection in women with SUI. Women were followed up for 15 months post‐surgery and 71% of the traditional slings arm were symptom‐free compared with 27% in the collagen injection arm (P = 0.05). The average cost per woman treated with the traditional sling procedure was USD 10,382 (1995 USD) while the collagen injection was USD 4996 (1995 USD) (P < 0.001). Although the cost of the traditional sling is double that of the collagen injection, the study authors argued that traditional suburethral retropubic sling procedure is more cost‐effective than collagen injection due to its higher effectiveness. A cost‐utility analysis by Kunkle 2015 (decision model) compared urethral bulking agent with retropubic mid‐urethral slings and transobturator mid‐urethral slings in patient with SUI without urethral hypermobility (Kunkle 2015). The study utilised data from different randomised controlled trials (RCTs) obtained from PubMed search of women with SUI and treatment with urethral bulking agent and adopted the perspective of the healthcare in the USA. The study time horizon was one year and assumed that transobturator and retropubic are equivalent in treatment based upon the study reports identified. The treatment cost for urethral bulking agent was USD 1237 to USD 1512 while mid‐urethral sling (transobturator or retropubic) cost USD 5757 to USD 7036(2013 USD). Mid‐urethral sling was USD 436,465 (2013 USD) more expensive than urethral bulking agent for every 100 women treated. The study reported that the probability of recurrent SUI was 18% with mid‐urethral sling (transobturator or retropubic), while the probability of re‐injection was 48%, with 34% of those initially receiving treatment with a urethral bulking agent needing another form of treatment. The incremental cost‐effectiveness ratio (ICER) of mid‐urethral slings compared with bulking agent was USD 70,400 (2013 USD) per utility (health quality) gained. The study assumed a willingness to pay of USD 50, 000 (2013 USD) per utility gained, leading to the authors conclusion that mid‐urethral sling was not cost‐effective as a first‐line treatment. However, further analysis estimated that the urethral bulking agent had only a 48% chance of being cost‐effective and a 52% chance of being cost‐saving compared to mid‐urethral slings women with SUI without urethral hypermobility. Oremus 2003 reported a cost‐effectiveness analysis based on a decision tree model from the health care system perspective of Ontario and Quebec. Three different surgeries (retropubic suspension, transobturator suspension, and traditional sling procedure) were compared with collagen injection in women with SUI after failure of initial surgical treatment. The time horizon of the model (equivalent to the follow‐up in a trial) was one year. The study used clinical data from a systematic review and a physician survey and concluded that all surgeries were more successful than collagen injection but were more expensive. Collagen injection had the lowest average cost per patient. The average cost of two collagen injections was CAD 2695 in Ontario and CAD 2718 in Quebec (1998 Canadian dollars). In Ontario, retropubic suspension, transobturator suspension and traditional sling cost CAD 3257, CAD 4024 and CAD 4657 (1998 Canadian dollars), respectively while in Quebec, retropubic suspension, transobturator suspension and traditional sling cost CAD 3490, CAD 3494 and CAD 3118 (1998 Canadian dollars), respectively. The authors argued that any of the surgeries would be cost‐effective only when hospital stay was short. The study thus concluded that collagen injection may be more cost‐effective as a follow‐up treatment to initial surgical failure in both Ontario and Quebec, when injection is kept minimal, otherwise, surgery may be cost‐effective.
Comparison 04: one material for injection therapy is better than another
Eight trials were identified that addressed this hypothesis. Seven trials tested a newer agent against the established agent, cross‐linked bovine collagen.
One trial (Lightner 2001) suggested that carbon particles were as effective as collagen at 12 months with approximately 66% of participants gaining symptomatic benefit. Carbon injection did however cause a higher frequency of transient side effects. The report was based on an interim analysis and a full report is still awaited. The methodology did, however, appear sound. Andersen 2002 also compared carbon particles with collagen and assessed patients more than a year from treatment (32.3 months). It showed a trend towards a better outcome in favour of carbon particles however, again this was not found to be statistically significant.
The two trials comparing silicone particles and collagen were not suitable for combination in a meta‐analysis but Ghoniem 2009 showed a significantly better outcome with regard to cure and symptom improvement for silicone particles, with no increase in adverse events. Data from Anders 2002 was obtained from a conference abstract and these data have not subsequently been published in full. Methodological details were therefore incomplete, with no power calculation or details of the method of allocation.
Mayer's trial (Mayer 2007) was assumed to include the same trial participants as in the earlier publications in the abstract form of Domchowski (2002) and Appell (2003). These trials were not, therefore, combined in a meta‐analysis. There was a suggestion of superiority for Coaptite™ in terms of improvements in Stamey grade and quality of life at 12 months, with the latter reaching statistical significance. De novo urge incontinence was also less commonly reported in the Coaptite™ group.
The trials comparing ethylene vinyl alcohol copolymer (EVOH) and collagen have been published in abstract form only and are not reported as showing any difference in cure rates (Dmochowski 2004).
Twelve‐month follow‐up of 344 women showed a lower cure rate and increased loss on provocation for hyaluronic acid dextranomer combination than collagen (Lightner 2009). It should be noted that the collagen was administered at the bladder neck under endoscopic control while the hyaluronic acid dextranomer combination was injected blindly via a purpose‐designed transurethral device at mid‐urethral level.
A final trial compared porcine dermal implant injection (Permacol™) and silicone particles (Macroplastique™) (Bano 2005) in 50 patients. Whilst objective tests of improvement in symptoms showed no significant difference, subjective tests tended to favour Permacol™ over Macroplastique™. When the Kings College Hospital Quality of Health questionnaire was used a significant difference was demonstrated.
Taken at face value, these trials suggest that silicone particles may be a more efficacious injectable than a collagen and hyaluronic acid dextranomer combination. The latter is also associated with a higher risk of local side effects that include pseudocyst and sterile abscess formation. Whilst the other trials have not demonstrated any significant differences between these agents, it should be noted that confidence intervals were wide and not all trials were adequately powered, so it remains possible that clinically relevant differences do exist. More long‐term data are needed to assess relative durability of the agents (although please note that both dextranomer‐hyaluronic acid (Zuidex™) and ethylene vinyl alcohol copolymer (EVOH) has now been withdrawn from the market for the treatment of female stress incontinence.).
No relevant economic evidence were identified for the BEC.
Comaprison 05: one route of injection is better than another
This hypothesis was not included originally but was subsequently considered to be relevant. One trial (Schulz 2004) compared the transurethral injection route with periurethral injection. The brief methodological details available suggest a well performed trial but no power calculation was given. The findings suggested that, with regard to subjective and objective outcomes, both periurethral and transurethral injections were equally efficacious. Periurethral injections may however be associated with more complications, particularly urinary retention. Clarifying whether these differences between transurethral injections and periurethral injections are real or due to chance requires more evidence.
Kuhn (Kuhn 2008) compared traditional bladder neck collagen injection with a mid‐urethral injection site and reported increased patient satisfaction with the mid‐urethral route (although median satisfaction levels were the same for both groups), but a higher rate of postoperative retention. Only 30 women were recruited to the trial in line with the pre‐trial power calculation.
A further trial has subsequently been published comparing mid‐urethral dextranomer‐hyaluronic acid (Zuidex™) and bladder neck collagen (Lightner 2009). Unfortunately the trial design did not allow for any meaningful comparison of the effect of injection site location and further trials addressing this issue are awaited although they would need to use different bulking agents because, as noted earlier, dextranomer‐hyaluronic acid (Zuidex™) and ethylene vinyl alcohol copolymer (EVOH) have both been withdrawn from the market for the treatment of female stress incontinence.
No relevant economic evidence were identified for the Brief economic commentary.

PRISMA Study flow diagram ‐ showing the flow of literature through the review process
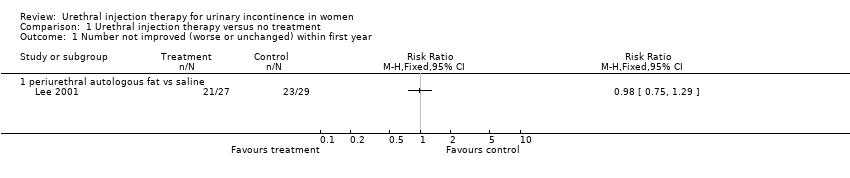
Comparison 1 Urethral injection therapy versus no treatment, Outcome 1 Number not improved (worse or unchanged) within first year.

Comparison 1 Urethral injection therapy versus no treatment, Outcome 2 Pad weight test.

Comparison 1 Urethral injection therapy versus no treatment, Outcome 3 Disease‐specific measures.

Comparison 1 Urethral injection therapy versus no treatment, Outcome 4 Number of patients requiring more than 1 treatment to achieve maximum benefit.

Comparison 1 Urethral injection therapy versus no treatment, Outcome 5 Peri‐ and postoperative complication.
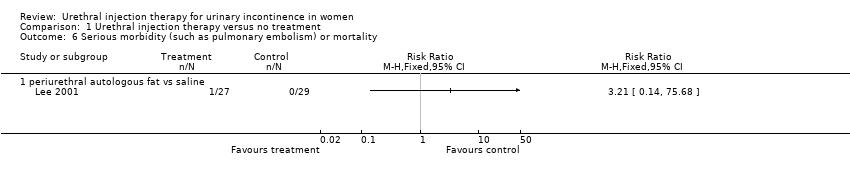
Comparison 1 Urethral injection therapy versus no treatment, Outcome 6 Serious morbidity (such as pulmonary embolism) or mortality.

Comparison 2 Urethral injection therapy versus conservative management, Outcome 1 Number not cured (worse, unchanged or improved) at 3 months.

Comparison 2 Urethral injection therapy versus conservative management, Outcome 2 Number not improved (worse or unchanged) at 3 months.
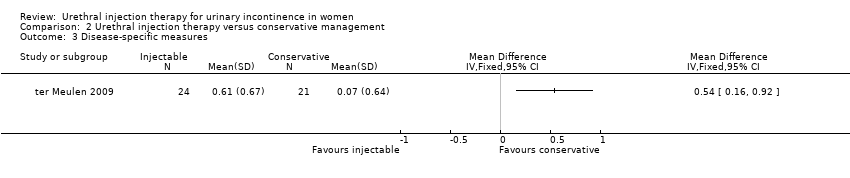
Comparison 2 Urethral injection therapy versus conservative management, Outcome 3 Disease‐specific measures.

Comparison 2 Urethral injection therapy versus conservative management, Outcome 4 Peri‐ and postoperative complication.
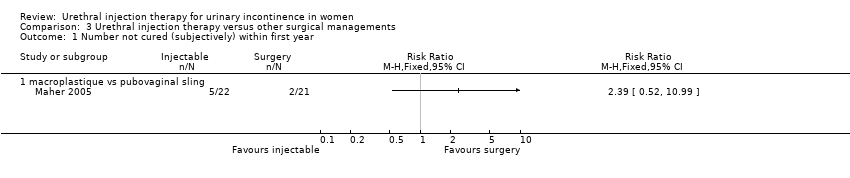
Comparison 3 Urethral injection therapy versus other surgical managements, Outcome 1 Number not cured (subjectively) within first year.
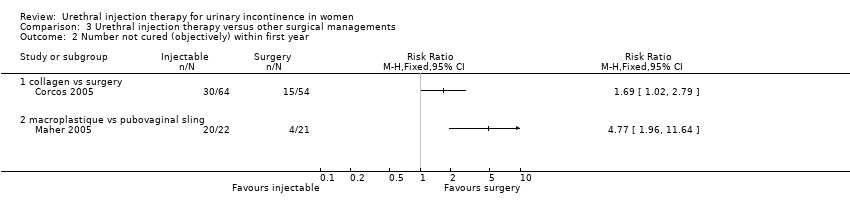
Comparison 3 Urethral injection therapy versus other surgical managements, Outcome 2 Number not cured (objectively) within first year.

Comparison 3 Urethral injection therapy versus other surgical managements, Outcome 3 Presence of urinary urgency and urge incontinence.

Comparison 3 Urethral injection therapy versus other surgical managements, Outcome 4 Disease‐specific measures.
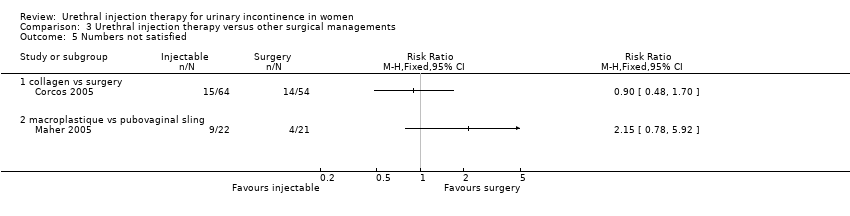
Comparison 3 Urethral injection therapy versus other surgical managements, Outcome 5 Numbers not satisfied.

Comparison 4 One material for injectable treatment versus another material for injectable treatment, Outcome 1 Number not cured (worse, unchanged ) within first year.
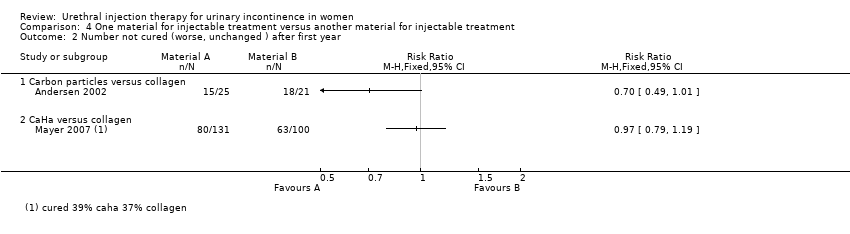
Comparison 4 One material for injectable treatment versus another material for injectable treatment, Outcome 2 Number not cured (worse, unchanged ) after first year.
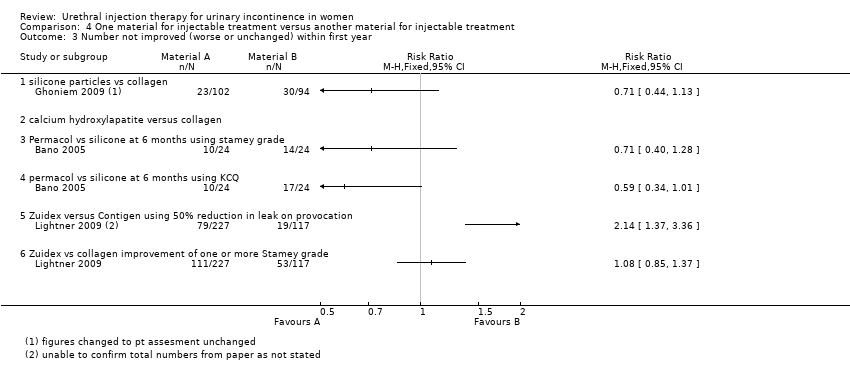
Comparison 4 One material for injectable treatment versus another material for injectable treatment, Outcome 3 Number not improved (worse or unchanged) within first year.
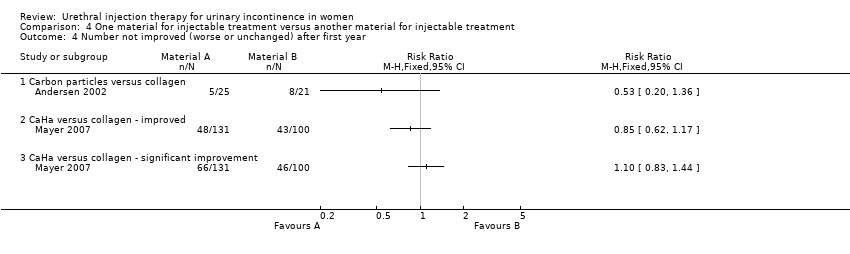
Comparison 4 One material for injectable treatment versus another material for injectable treatment, Outcome 4 Number not improved (worse or unchanged) after first year.

Comparison 4 One material for injectable treatment versus another material for injectable treatment, Outcome 5 Presence of urge incontinence.

Comparison 4 One material for injectable treatment versus another material for injectable treatment, Outcome 6 Pad weight test.

Comparison 4 One material for injectable treatment versus another material for injectable treatment, Outcome 7 Number of treatment required to achieve maximum benefit.

Comparison 4 One material for injectable treatment versus another material for injectable treatment, Outcome 8 Number of patients requiring more than 1 treatment to achieve maximum benefit.
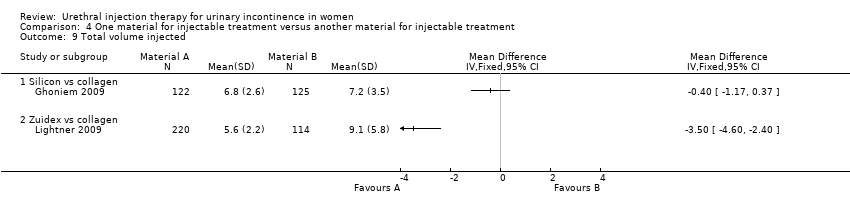
Comparison 4 One material for injectable treatment versus another material for injectable treatment, Outcome 9 Total volume injected.
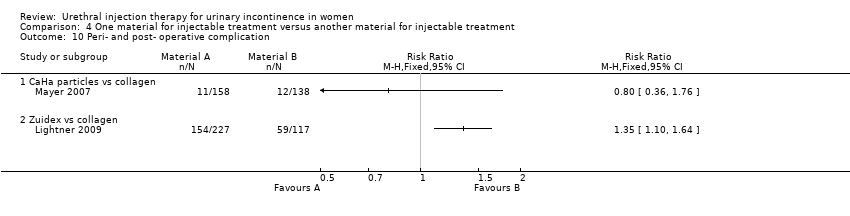
Comparison 4 One material for injectable treatment versus another material for injectable treatment, Outcome 10 Peri‐ and post‐ operative complication.

Comparison 4 One material for injectable treatment versus another material for injectable treatment, Outcome 11 Voiding difficulties postoperatively and long‐term (hypercontinence).
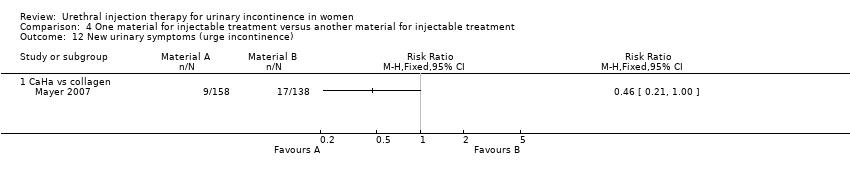
Comparison 4 One material for injectable treatment versus another material for injectable treatment, Outcome 12 New urinary symptoms (urge incontinence).

Comparison 4 One material for injectable treatment versus another material for injectable treatment, Outcome 13 Injection site complications.

Comparison 5 One route of injection versus another route of injection, Outcome 1 Number not cured (worse, unchanged or improved) within first year.

Comparison 5 One route of injection versus another route of injection, Outcome 2 Urinary retention.
| Outcome or subgroup title | No. of studies | No. of participants | Statistical method | Effect size |
| 1 Number not improved (worse or unchanged) within first year Show forest plot | 1 | Risk Ratio (M‐H, Fixed, 95% CI) | Totals not selected | |
| 1.1 periurethral autologous fat vs saline | 1 | Risk Ratio (M‐H, Fixed, 95% CI) | 0.0 [0.0, 0.0] | |
| 2 Pad weight test Show forest plot | 1 | Mean Difference (IV, Fixed, 95% CI) | Totals not selected | |
| 2.1 periurethral autologous fat vs saline | 1 | Mean Difference (IV, Fixed, 95% CI) | 0.0 [0.0, 0.0] | |
| 3 Disease‐specific measures Show forest plot | 1 | Mean Difference (IV, Fixed, 95% CI) | Totals not selected | |
| 3.1 periurethral autologous fat vs saline | 1 | Mean Difference (IV, Fixed, 95% CI) | 0.0 [0.0, 0.0] | |
| 4 Number of patients requiring more than 1 treatment to achieve maximum benefit Show forest plot | 1 | Risk Ratio (M‐H, Fixed, 95% CI) | Totals not selected | |
| 4.1 periurethral autologous fat vs saline | 1 | Risk Ratio (M‐H, Fixed, 95% CI) | 0.0 [0.0, 0.0] | |
| 5 Peri‐ and postoperative complication Show forest plot | 1 | Risk Ratio (M‐H, Fixed, 95% CI) | Totals not selected | |
| 5.1 periurethral autologous fat vs saline | 1 | Risk Ratio (M‐H, Fixed, 95% CI) | 0.0 [0.0, 0.0] | |
| 6 Serious morbidity (such as pulmonary embolism) or mortality Show forest plot | 1 | Risk Ratio (M‐H, Fixed, 95% CI) | Totals not selected | |
| 6.1 periurethral autologous fat vs saline | 1 | Risk Ratio (M‐H, Fixed, 95% CI) | 0.0 [0.0, 0.0] | |
| Outcome or subgroup title | No. of studies | No. of participants | Statistical method | Effect size |
| 1 Number not cured (worse, unchanged or improved) at 3 months Show forest plot | 1 | Risk Ratio (M‐H, Fixed, 95% CI) | Totals not selected | |
| 2 Number not improved (worse or unchanged) at 3 months Show forest plot | 1 | Risk Ratio (M‐H, Fixed, 95% CI) | Totals not selected | |
| 3 Disease‐specific measures Show forest plot | 1 | Mean Difference (IV, Fixed, 95% CI) | Totals not selected | |
| 4 Peri‐ and postoperative complication Show forest plot | 1 | Risk Ratio (M‐H, Fixed, 95% CI) | Totals not selected | |
| 4.1 retention | 1 | Risk Ratio (M‐H, Fixed, 95% CI) | 0.0 [0.0, 0.0] | |
| Outcome or subgroup title | No. of studies | No. of participants | Statistical method | Effect size |
| 1 Number not cured (subjectively) within first year Show forest plot | 1 | Risk Ratio (M‐H, Fixed, 95% CI) | Totals not selected | |
| 1.1 macroplastique vs pubovaginal sling | 1 | Risk Ratio (M‐H, Fixed, 95% CI) | 0.0 [0.0, 0.0] | |
| 2 Number not cured (objectively) within first year Show forest plot | 2 | Risk Ratio (M‐H, Fixed, 95% CI) | Totals not selected | |
| 2.1 collagen vs surgery | 1 | Risk Ratio (M‐H, Fixed, 95% CI) | 0.0 [0.0, 0.0] | |
| 2.2 macroplastique vs pubovaginal sling | 1 | Risk Ratio (M‐H, Fixed, 95% CI) | 0.0 [0.0, 0.0] | |
| 3 Presence of urinary urgency and urge incontinence Show forest plot | 1 | Risk Ratio (M‐H, Fixed, 95% CI) | Totals not selected | |
| 3.1 collagen vs surgery | 1 | Risk Ratio (M‐H, Fixed, 95% CI) | 0.0 [0.0, 0.0] | |
| 4 Disease‐specific measures Show forest plot | 1 | Mean Difference (IV, Fixed, 95% CI) | Totals not selected | |
| 4.1 collagen vs surgery | 1 | Mean Difference (IV, Fixed, 95% CI) | 0.0 [0.0, 0.0] | |
| 5 Numbers not satisfied Show forest plot | 2 | Risk Ratio (M‐H, Fixed, 95% CI) | Totals not selected | |
| 5.1 collagen vs surgery | 1 | Risk Ratio (M‐H, Fixed, 95% CI) | 0.0 [0.0, 0.0] | |
| 5.2 macroplastique vs pubovaginal sling | 1 | Risk Ratio (M‐H, Fixed, 95% CI) | 0.0 [0.0, 0.0] | |
| Outcome or subgroup title | No. of studies | No. of participants | Statistical method | Effect size |
| 1 Number not cured (worse, unchanged ) within first year Show forest plot | 5 | Risk Ratio (M‐H, Fixed, 95% CI) | Totals not selected | |
| 1.1 carbon particles vs collagen | 1 | Risk Ratio (M‐H, Fixed, 95% CI) | 0.0 [0.0, 0.0] | |
| 1.2 Silicone particles vs collagen | 1 | Risk Ratio (M‐H, Fixed, 95% CI) | 0.0 [0.0, 0.0] | |
| 1.3 Ethylene vinyl alcohol copolymer vs collagen | 1 | Risk Ratio (M‐H, Fixed, 95% CI) | 0.0 [0.0, 0.0] | |
| 1.4 Permacol vs silicone particles | 1 | Risk Ratio (M‐H, Fixed, 95% CI) | 0.0 [0.0, 0.0] | |
| 1.5 Dextranomer/hyaluronic acid versus collagen <2g leakage on pad test | 1 | Risk Ratio (M‐H, Fixed, 95% CI) | 0.0 [0.0, 0.0] | |
| 2 Number not cured (worse, unchanged ) after first year Show forest plot | 2 | Risk Ratio (M‐H, Fixed, 95% CI) | Totals not selected | |
| 2.1 Carbon particles versus collagen | 1 | Risk Ratio (M‐H, Fixed, 95% CI) | 0.0 [0.0, 0.0] | |
| 2.2 CaHa versus collagen | 1 | Risk Ratio (M‐H, Fixed, 95% CI) | 0.0 [0.0, 0.0] | |
| 3 Number not improved (worse or unchanged) within first year Show forest plot | 3 | Risk Ratio (M‐H, Fixed, 95% CI) | Totals not selected | |
| 3.1 silicone particles vs collagen | 1 | Risk Ratio (M‐H, Fixed, 95% CI) | 0.0 [0.0, 0.0] | |
| 3.2 calcium hydroxylapatite versus collagen | 0 | Risk Ratio (M‐H, Fixed, 95% CI) | 0.0 [0.0, 0.0] | |
| 3.3 Permacol vs silicone at 6 months using stamey grade | 1 | Risk Ratio (M‐H, Fixed, 95% CI) | 0.0 [0.0, 0.0] | |
| 3.4 permacol vs silicone at 6 months using KCQ | 1 | Risk Ratio (M‐H, Fixed, 95% CI) | 0.0 [0.0, 0.0] | |
| 3.5 Zuidex versus Contigen using 50% reduction in leak on provocation | 1 | Risk Ratio (M‐H, Fixed, 95% CI) | 0.0 [0.0, 0.0] | |
| 3.6 Zuidex vs collagen improvement of one or more Stamey grade | 1 | Risk Ratio (M‐H, Fixed, 95% CI) | 0.0 [0.0, 0.0] | |
| 4 Number not improved (worse or unchanged) after first year Show forest plot | 2 | Risk Ratio (M‐H, Fixed, 95% CI) | Totals not selected | |
| 4.1 Carbon particles versus collagen | 1 | Risk Ratio (M‐H, Fixed, 95% CI) | 0.0 [0.0, 0.0] | |
| 4.2 CaHa versus collagen ‐ improved | 1 | Risk Ratio (M‐H, Fixed, 95% CI) | 0.0 [0.0, 0.0] | |
| 4.3 CaHa versus collagen ‐ significant improvement | 1 | Risk Ratio (M‐H, Fixed, 95% CI) | 0.0 [0.0, 0.0] | |
| 5 Presence of urge incontinence Show forest plot | 1 | Risk Ratio (M‐H, Fixed, 95% CI) | Totals not selected | |
| 5.1 Permacol vs silicone particles | 1 | Risk Ratio (M‐H, Fixed, 95% CI) | 0.0 [0.0, 0.0] | |
| 6 Pad weight test Show forest plot | 4 | Mean Difference (IV, Fixed, 95% CI) | Totals not selected | |
| 6.1 carbon particles vs collagen | 1 | Mean Difference (IV, Fixed, 95% CI) | 0.0 [0.0, 0.0] | |
| 6.2 CaHa versus collagen | 1 | Mean Difference (IV, Fixed, 95% CI) | 0.0 [0.0, 0.0] | |
| 6.3 Silicone particles vs collagen | 1 | Mean Difference (IV, Fixed, 95% CI) | 0.0 [0.0, 0.0] | |
| 6.4 Dexranomer/hyaluronic acid versus collagen | 1 | Mean Difference (IV, Fixed, 95% CI) | 0.0 [0.0, 0.0] | |
| 7 Number of treatment required to achieve maximum benefit Show forest plot | 2 | 699 | Mean Difference (IV, Fixed, 95% CI) | 0.0 [0.0, 0.0] |
| 7.1 carbon particles vs collagen | 1 | 355 | Mean Difference (IV, Fixed, 95% CI) | 0.0 [0.0, 0.0] |
| 7.2 Zuidex vs collagen | 1 | 344 | Mean Difference (IV, Fixed, 95% CI) | 0.0 [0.0, 0.0] |
| 8 Number of patients requiring more than 1 treatment to achieve maximum benefit Show forest plot | 2 | Risk Ratio (M‐H, Fixed, 95% CI) | Totals not selected | |
| 8.1 silicone particles vs collagen | 1 | Risk Ratio (M‐H, Fixed, 95% CI) | 0.0 [0.0, 0.0] | |
| 8.2 Zuidex versus collagen | 1 | Risk Ratio (M‐H, Fixed, 95% CI) | 0.0 [0.0, 0.0] | |
| 9 Total volume injected Show forest plot | 2 | Mean Difference (IV, Fixed, 95% CI) | Totals not selected | |
| 9.1 Silicon vs collagen | 1 | Mean Difference (IV, Fixed, 95% CI) | 0.0 [0.0, 0.0] | |
| 9.2 Zuidex vs collagen | 1 | Mean Difference (IV, Fixed, 95% CI) | 0.0 [0.0, 0.0] | |
| 10 Peri‐ and post‐ operative complication Show forest plot | 2 | Risk Ratio (M‐H, Fixed, 95% CI) | Totals not selected | |
| 10.1 CaHa particles vs collagen | 1 | Risk Ratio (M‐H, Fixed, 95% CI) | 0.0 [0.0, 0.0] | |
| 10.2 Zuidex vs collagen | 1 | Risk Ratio (M‐H, Fixed, 95% CI) | 0.0 [0.0, 0.0] | |
| 11 Voiding difficulties postoperatively and long‐term (hypercontinence) Show forest plot | 2 | Risk Ratio (M‐H, Fixed, 95% CI) | Totals not selected | |
| 11.1 CaHa versus collagen | 1 | Risk Ratio (M‐H, Fixed, 95% CI) | 0.0 [0.0, 0.0] | |
| 11.2 permacol vs silicone particles | 1 | Risk Ratio (M‐H, Fixed, 95% CI) | 0.0 [0.0, 0.0] | |
| 12 New urinary symptoms (urge incontinence) Show forest plot | 1 | Risk Ratio (M‐H, Fixed, 95% CI) | Totals not selected | |
| 12.1 CaHa vs collagen | 1 | Risk Ratio (M‐H, Fixed, 95% CI) | 0.0 [0.0, 0.0] | |
| 13 Injection site complications Show forest plot | 1 | Risk Ratio (M‐H, Fixed, 95% CI) | Totals not selected | |
| 13.1 Zuidex versus collagen | 1 | Risk Ratio (M‐H, Fixed, 95% CI) | 0.0 [0.0, 0.0] | |
| Outcome or subgroup title | No. of studies | No. of participants | Statistical method | Effect size |
| 1 Number not cured (worse, unchanged or improved) within first year Show forest plot | 2 | Risk Ratio (M‐H, Fixed, 95% CI) | Totals not selected | |
| 1.1 periurethral injection vs transurethral injection | 1 | Risk Ratio (M‐H, Fixed, 95% CI) | 0.0 [0.0, 0.0] | |
| 1.2 bladder neck versus mid‐urethral | 1 | Risk Ratio (M‐H, Fixed, 95% CI) | 0.0 [0.0, 0.0] | |
| 2 Urinary retention Show forest plot | 2 | Risk Ratio (M‐H, Random, 95% CI) | Totals not selected | |
| 2.1 periurethral vs transurethral injection | 1 | Risk Ratio (M‐H, Random, 95% CI) | 0.0 [0.0, 0.0] | |
| 2.2 bladder neck vs mid‐urethral | 1 | Risk Ratio (M‐H, Random, 95% CI) | 0.0 [0.0, 0.0] | |