Albendazol solo o en combinación con fármacos microfilaricidas para la filariasis linfática
Resumen
Antecedentes
El Global Programme to Eliminate Lymphatic Filariasis recomienda el tratamiento masivo con albendazol coadministrado con los fármacos microfilaricidas (antifiláricos) dietilcarbamazina (DEC) o ivermectina; y recomienda el albendazol solo en las áreas en las que la loiasis es endémica.
Objetivos
Evaluar los efectos del albendazol solo, y los efectos del agregado de albendazol a la DEC o la ivermectina, en los pacientes y las comunidades con filariasis linfática.
Métodos de búsqueda
Se realizaron búsquedas en el registro especializado del Grupo Cochrane de Enfermedades Infecciosas (Cochrane Infectious Diseases Group), en el Registro Cochrane Central de Ensayos Controlados (Cochrane Central Register of Controlled Trials), MEDLINE (PubMed), Embase (OVID), LILACS (BIREME) y en las listas de referencias de los ensayos incluidos. También se hicieron búsquedas en la World Health Organization (WHO) International Clinical Trials Registry Platform y en ClinicalTrials.gov para identificar ensayos en curso. Se realizaron todas las búsquedas hasta el 15 de enero de 2018.
Criterios de selección
Se incluyeron ensayos controlados aleatorios (ECA) y ECA con asignación al azar grupal que comparaban albendazol con placebo o ningún placebo, o que comparaban albendazol combinado con un fármaco microfilaricida versus un fármaco microfilaricida solo, administrado a los pacientes que se sabe que presentan filariasis linfática o las comunidades donde se sabía que la filariasis linfática era endémica. Se buscaron datos sobre las medidas de transmisión potencial (prevalencia y densidad de microfilarias [mf]); los marcadores de la infección por nematodos adultos (prevalencia y densidad de antigenemia y prevalencia de nematodos adultos detectados con ecografía); y datos sobre las enfermedades clínicas y los eventos adversos.
Obtención y análisis de los datos
Al menos dos autores de la revisión evaluaron de forma independiente los ensayos y los riesgos de sesgo, y extrajeron los datos. El análisis principal examinó el albendazol en general, ya sea administrado solo o agregado a un fármaco microfilaricida. Se usaron los datos recopilados de todos los individuos asignados al azar en el momento del seguimiento a más largo plazo (hasta los 12 meses) para el metanálisis de los resultados. Se evaluaron los datos de la densidad de mf hasta los seis meses y a los 12 meses de seguimiento para asegurar que no se hubiese pasado por alto ningún efecto temporal sutil. Se realizaron análisis adicionales durante diferentes períodos de seguimiento y sobre si los ensayos informaban sobre los individuos infectados o tanto infectados como no infectados. Se analizaron los datos dicotómicos mediante el cociente de riesgo (CR) con un intervalo de confianza (IC) del 95%. No se pudo realizar un metanálisis de los datos sobre los resultados de densidad de parásitos y se resumió en tablas. Cuando faltaban los datos, se estableció contacto con los autores de los ensayos. Para evaluar la certeza de la evidencia se utilizaron los criterios GRADE.
Resultados principales
Se incluyeron 13 ensayos (12 con asignación al azar individual y un ensayo pequeño con asignación al azar grupal) con 8713 participantes en total. Ningún ensayo evaluó los efectos del albendazol a nivel de la población en los programas de administración de fármacos masivos. Siete ensayos seleccionaron a pacientes con diversos criterios de inclusión relacionados con la filariasis, y seis ensayos incluyeron a individuos de zonas endémicas. Los resultados se informaron como valores finales o del cambio. Los datos de la densidad de mf y de antígenos se informaron mediante la media geométrica, la media del logaritmo y la media aritmética, y las reducciones en la densidad se calcularon de varias maneras. Dos ensayos descontaron cualquier aumento de la densidad de mf en los individuos al momento del seguimiento fijando cualquier aumento de la densidad en cero.
Para la prevalencia de mf en el plazo de las dos semanas a los 12 meses, el albendazol solo o el agregado a otros fármacos microfilaricidas logra poco o ningún cambio (CR 0,95; IC del 95%: 0,85 a 1,07; 5027 participantes, 12 ensayos, evidencia de certeza alta). Para la densidad de mf no hay ninguna tendencia, algunos ensayos informan de una mayor reducción de la densidad de mf con albendazol y otros una mayor reducción con el grupo de control. Para la densidad de mf hasta seis meses y a los 12 meses, no se conoce si el albendazol tiene un efecto (uno a seis meses: 1216 participantes, diez ensayos, evidencia de muy baja certeza; a los 12 meses: 1052 participantes, nueve ensayos, evidencia de muy baja certeza).
Para la prevalencia de antigenemia entre seis a 12 meses, el albendazol solo o agregado a otro fármaco microfilaricida logra poco o ningún cambio (CR 1,04; IC del 95%: 0,97 a 1,12; 3774 participantes, siete ensayos, evidencia de certeza alta). Para la densidad del antígeno en el plazo de seis a 12 meses, la tendencia muestra poco o ningún efecto del albendazol; aunque no se conoce si el albendazol tiene un efecto sobre la densidad de antígenos (1374 participantes, cinco ensayos, evidencia de muy baja certeza). Para la prevalencia de nematodos adultos detectados con ecografía a los 12 meses, el albendazol agregado a un fármaco microfilaricida puede lograr poco o ningún cambio (CR 1,16; IC del 95%: 0,72 a 1,86; 165 participantes, tres ensayos, evidencia de certeza baja).
Para los pacientes que informan eventos adversos, el albendazol logra poco o ningún cambio (CR 0,97; IC del 95%: 0,84 a 1,13; 2894 participantes, seis ensayos, evidencia de certeza alta).
También se presentan metanálisis y tablas de GRADE por fármaco, ya que puede ser de interés desde el punto de vista operativo: para albendazol versus placebo (cuatro ensayos, 1870 participantes); para albendazol con DEC en comparación con DEC sola (ocho ensayos, 3405 participantes); y para albendazol con ivermectina en comparación con ivermectina sola (cuatro ensayos, 3438 participantes).
Conclusiones de los autores
Hay evidencia convincente de que el albendazol logra poco cambio en la eliminación de la microfilaremia o las filarias adultas en los 12 meses después del tratamiento. Este resultado es consistente en los ensayos que evalúan el albendazol solo, o agregado a la DEC o a la ivermectina. Los ensayos que informan la densidad de mf incluyeron a números pequeños de participantes, calcularon los datos de la densidad de varias maneras y proporcionaron resultados inconsistentes.
La revisión plantea preguntas sobre si el albendazol presenta una contribución importante a la eliminación de la filariasis linfática. Para informar la política para las áreas con loiasis en las que sólo puede usarse albendazol, puede valer la pena realizar ensayos controlados con placebo del albendazol solo.
PICO
Resumen en términos sencillos
Albendazol solo o en combinación con fármacos microfilaricidas para la filariasis linfática
En esta revisión Cochrane, los investigadores Cochrane examinaron los efectos de la administración de albendazol solo y de albendazol agregado a los fármacos antifiláricos para tratar a los pacientes infectados y a los pacientes que viven en áreas de filariasis linfática. Después de buscar los ensayos relevantes hasta enero de 2018 se incluyeron 13 ensayos controlados aleatorios (ECA), incluido un ECA con asignación al azar grupal, con un total de 8713 participantes.
Filariasis linfática
La filariasis linfática, una enfermedad común en las zonas tropicales y subtropicales, es transmitida por los mosquitos y causada por la infección con filarias parasitarias. Después que una persona es infectada a partir de una picadura de mosquito, los nematodos se convierten en adultos y se aparean para producir microfilarias (mf). La mf circula en la sangre por lo cual puede ser recolectada por los mosquitos y la infección puede ser transmitida a otra persona. La infección puede diagnosticarse mediante la verificación de la presencia de mf circulante (microfilaremia) o antígenos de los parásitos (antigenemia), o mediante imagenología de ecografía para detectar los nematodos adultos vivos.
La Organización Mundial de la Salud (OMS) recomienda el tratamiento masivo de las poblaciones completas una vez al año durante muchos años. El tratamiento es una combinación de dos fármacos, albendazol y un microfilaricida (antifilárico), dietilcarbamazina (DEC) o ivermectina. El albendazol solo se recomienda para los pacientes cuando no puede usarse DEC ni ivermectina.
Lo que dice la investigación
El albendazol solo o agregado a un fármaco microfilaricida logra poco o ningún cambio en la prevalencia de mf durante dos semanas a 12 meses después del tratamiento (evidencia de certeza alta), aunque no se conoce si el albendazol solo o en combinación reduce la densidad de mf entre uno a seis meses (evidencia de muy baja certeza) o a los 12 meses (evidencia de muy baja certeza).
El tratamiento con albendazol solo o agregado a un fármaco microfilaricida logra poco o ningún cambio en la prevalencia de la antigenemia entre los seis y 12 meses (evidencia de certeza alta). No se conoce si el albendazol solo o en combinación reduce la densidad del antígeno durante el plazo de seis a 12 meses (evidencia de muy baja certeza). El albendazol agregado a un fármaco microfilaricida puede lograr poco o ningún cambio en la prevalencia de nematodos adultos detectados con ecografía a los 12 meses (evidencia de certeza baja).
Cuando se administra solo o se agrega a un fármaco microfilaricida, el albendazol logra poco o ningún cambio en el número de pacientes que informan un evento adverso (evidencia de certeza alta).
Conclusiones de los autores
Hay evidencia convincente de que el albendazol, solo o agregado a la DEC o la ivermectina, proporciona poco o ningún beneficio para la eliminación total de las mf o los nematodos adultos hasta los 12 meses después del tratamiento. La evidencia de un efecto del albendazol para reducir los números de mf y nematodos adultos es inconsistente. Para informar la política para las áreas en las que no puede administrarse ivermectina y DEC, la investigación adicional podría ayudar a determinar si hay un efecto del albendazol solo.
Conclusiones de los autores
Summary of findings
| Albendazole alone or added to a microfilaricidal drug for lymphatic filariasis | ||||||
| Patient or population: people with lymphatic filariasis or communities where lymphatic filariasis is endemic Intervention: albendazole alone or in combination with a microfilaricidal drug | ||||||
| Outcomes | Anticipated absolute effects* (95% CI) | Relative effect | Number of participants | Certainty of the evidence | Comments | |
| Risk with no treatment or a single microfilaricidal drug | Risk with albendazole alone or in combination with a microfilaricidal drug | |||||
| Microfilaraemia (mf) prevalence | 179 per 1000 | 174 per 1000 | RR 0.95 | 5027 | ⊕⊕⊕⊕ | Albendazole makes little or no difference to mf prevalence. |
| Mf density | In the included studies the effects of treatment with albendazole varied. The difference between treatment groups ranged from a 81.7% greater reduction with albendazole to 13.6% greater reduction with a single microfilaricidal drug.a | ‐ | 1216 | ⊕⊝⊝⊝ Due to risk of bias, inconsistency, and imprecision | We do not know if albendazole has an effect on mf density. | |
| Mf density | In the included studies the effects of treatment with albendazole varied. The difference between treatment groups ranged from a 55.5% greater reduction with albendazole to a 15.8% greater reduction with a single microfilaricidal drug.e | ‐ | 1052 | ⊕⊝⊝⊝ Due to inconsistency and imprecision | We do not know if albendazole has an effect on mf density. | |
| Antigenaemia prevalence | 435 per 1000 | 452 per 1000 | RR 1.04 | 3774 | ⊕⊕⊕⊕ | Albendazole makes little or no difference to antigenaemia prevalence. |
| Antigen density | In the included studies treatment with albendazole had little or no effect on antigen density. There was a 1.5% to 17.1% greater reduction with albendazole in all studies except one; this study reported a 64.4% greater reduction in antigen density due to a small reduction with albendazole (16.9%) but a large increase in the placebo group.h | ‐ | 1374 | ⊕⊝⊝⊝ Due to risk of bias and imprecision | We do not know if albendazole has an effect on antigen density. | |
| Adult worm prevalence detected by ultrasound | 268 per 1000 | 311 per 1000 | RR 1.16 | 165 | ⊕⊕⊝⊝ Due to indirectness and imprecision | Albendazole may make little or no difference to adult worm prevalence detected by ultrasound. |
| Adverse events | 184 per 1000 | 178 per 1000 | RR 0.97 | 2894 | ⊕⊕⊕⊕ | Albendazole makes little or no difference to adverse events. |
| *The risk in the intervention group (and its 95% CI) is based on the assumed risk in the comparison group and the relative effect of the intervention (and its 95% CI). | ||||||
| GRADE Working Group grades of evidence | ||||||
| aEight studies reported geometric means, one study reported log mean, and one study reported the arithmetic mean. An effect of albendazole (P < 0.05) on the geometric mean mf density was reported in three analyses in two studies. No effect of albendazole (P > 0.05) was reported in six studies that used the geometric mean. | ||||||
| Albendazole alone for lymphatic filariasis | ||||||
| Patient or population: people with lymphatic filariasis or communities where lymphatic filariasis is endemic | ||||||
| Outcomes | Anticipated absolute effects* (95% CI) | Relative effect | Number of participants | Certainty of the evidence | Comments | |
| Risk with placebo | Risk with albendazole | |||||
| Microfilaraemia (mf) prevalence | 207 per 1000 | 203 per 1000 | RR 0.98 | 1406 | ⊕⊕⊕⊕ | Albendazole makes little or no difference to mf prevalence. |
| Mf density | Trend favoured albendazole to a variable extent. Albendazole reduced the geometric mean mf density by 28.7% to 61.1%. Placebo reduced the geometric mean mf density up to 17.2%, but the density also increased by 20.6%.c | ‐ | 285 | ⊕⊝⊝⊝ Due to risk of bias, inconsistency, and imprecision | We do not know if albendazole has an effect on mf density. | |
| Mf density | No trend. In one study that reported the geometric mean, albendazole reduced mf density by 68.5% and in the placebo group the reduction was 13%; however, the authors reported no significant difference with albendazole (P > 0.05).g | ‐ | 169 | ⊕⊝⊝⊝ Due to inconsistency and imprecision | We do not know if albendazole has an effect on mf density. | |
| Antigenaemia prevalence | 355 per 1000 | 380 per 1000 | RR 1.07 | 1054 | ⊕⊕⊕⊕ | Albendazole makes little or no difference to antigenaemia prevalence. |
| Antigen density | Trend showed little or no effect of albendazole. Albendazole reduced the geometric mean antigen density by 3.2% to 16.9%, and the placebo group antigen density was reduced by 1.7% and also increased by 47.5%.j | ‐ | 371 | ⊕⊝⊝⊝ Due to risk of bias and imprecision | We do not know if albendazole has an effect on antigen density. | |
| Adult worm prevalence detected by ultrasound ‐ not measured | ‐ | ‐ | ‐ | ‐ | ‐ | Adult worm prevalence detected by ultrasound was not measured for this comparison. |
| Adverse events | 106 per 1000 | 101 per 1000 | RR 0.95 | 678 | ⊕⊕⊕⊝ Due to imprecision | Albendazole probably makes little or no difference to adverse events. |
| *The risk in the intervention group (and its 95% CI) is based on the assumed risk in the comparison group and the relative effect of the intervention (and its 95% CI). | ||||||
| GRADE Working Group grades of evidence | ||||||
| aNot downgraded for risk of bias: most information is from studies at low or unclear risk of bias. Three studies had unclear or high risk of bias for attrition, but numbers of participants followed up were comparable between groups in each study. We judged plausible bias unlikely to seriously alter the results. | ||||||
| Albendazole added to DEC for lymphatic filariasis | ||||||
| Patient or population: people with lymphatic filariasis or communities where lymphatic filariasis is endemic | ||||||
| Outcomes | Anticipated absolute effects* (95% CI) | Relative effect | Number of participants | Certainty of the evidence | Comments | |
| Risk with DEC | Risk with albendazole plus DEC | |||||
| Microfilaraemia (mf) prevalence | 262 per 1000 | 236 per 1000 | RR 0.90 | 1102 | ⊕⊕⊕⊝ Due to imprecision | Albendazole probably makes little or no difference to mf prevalence. |
| Mf density | No trend. The difference between the albendazole plus DEC and the DEC groups percentage reductions from baseline ranged from a 30% greater reduction with albendazole plus DEC to a 13.6% greater reduction with DEC alone.c | ‐ | 559 | ⊕⊝⊝⊝ Due to risk of bias, inconsistency, and imprecision | We do not know if albendazole has an effect on mf density. | |
| Mf density | Trend showed little or no effect of albendazole. The difference between the albendazole plus DEC and the DEC groups percentage reductions from baseline ranged from a 5.6% greater reduction with albendazole plus DEC to a 15.8% greater reduction with DEC alone.g | ‐ | 535 | ⊕⊕⊝⊝ Due to imprecision | Albendazole may make little or no difference to mf density. | |
| Antigenaemia prevalence | 503 per 1000 | 518 per 1000 | RR 1.03 | 954 | ⊕⊕⊕⊕ | Albendazole makes little or no difference to antigenaemia prevalence. |
| Antigen density | Trend showed little or no effect of albendazole. The difference between the albendazole plus DEC and the DEC groups percentage reductions from baseline ranged from a 9.7% greater reduction in the geometric mean to a 10.7% greater reduction in the log mean with albendazole plus DEC.k | ‐ | 270 | ⊕⊝⊝⊝ Due to risk of bias and imprecision | We do not know if albendazole has an effect on antigen density. | |
| Adult worm prevalence detected by ultrasound | 268 per 1000 | 311 per 1000 | RR 1.16 | 165 | ⊕⊕⊝⊝ Due to indirectness and imprecision | Albendazole may make little or no difference to adult worm prevalence detected by ultrasound. |
| Adverse events | 240 per 1000 | 225 per 1000 | RR 0.94 | 1589 | ⊕⊕⊕⊕ | Albendazole makes little or no difference to adverse events. |
| *The risk in the intervention group (and its 95% CI) is based on the assumed risk in the comparison group and the relative effect of the intervention (and its 95% CI). | ||||||
| GRADE Working Group grades of evidence | ||||||
| aNot downgraded for inconsistency: I2 of 40% was explained through subgroup analysis. The heterogeneity was a result of one study which used a more intensive treatment regimen (daily dose for 12 days) compared to the other six studies (single dose). We therefore judged inconsistency does not seem to be a serious issue. | ||||||
| Albendazole added to ivermectin for lymphatic filariasis | ||||||
| Patient or population: people with lymphatic filariasis or communities where lymphatic filariasis is endemic | ||||||
| Outcomes | Anticipated absolute effects* (95% CI) | Relative effect | Number of participants | Certainty of the evidence | Comments | |
| Risk with ivermectin | Risk with albendazole plus ivermectin | |||||
| Microfilaraemia (mf) prevalence | 129 per 1000 | 108 per 1000 | RR 0.84 | 2519 | ⊕⊕⊕⊝ Due to imprecision | Albendazole probably makes little or no difference to mf prevalence. |
| Mf density | No trend. The difference between the albendazole plus ivermectin and the ivermectin groups percentage reductions from baseline ranged from a 3% to 22.8% greater reduction with albendazole plus ivermectin.d | ‐ | 372 | ⊕⊝⊝⊝ Due to risk of bias, inconsistency, and imprecision | We do not know if albendazole has an effect on mf density. | |
| Mf density | Trend showed little or no effect of albendazole. The difference between the albendazole plus ivermectin and the ivermectin groups percentage reductions from baseline ranged from a 6.7% to 9.1% greater reduction with albendazole plus ivermectin.h | ‐ | 348 | ⊕⊕⊝⊝ Due to imprecision | Albendazole may make little or no difference to mf density. | |
| Antigenaemia prevalence | 444 per 1000 | 462 per 1000 | RR 1.04 | 1766 | ⊕⊕⊕⊕ | Albendazole makes little or no difference to antigenaemia prevalence. |
| Antigen density | Trend showed little or no effect of albendazole. The difference between the albendazole plus ivermectin and the ivermectin groups percentage reductions from baseline ranged from a 10.9% to 17.1% greater reduction with albendazole plus ivermectin.h | ‐ | 733 | ⊕⊕⊝⊝ Due to imprecision | Albendazole may make little or no difference to antigen density. | |
| Adult worm prevalence detected by ultrasound ‐ not measured | ‐ | ‐ | ‐ | ‐ | ‐ | Adult prevalence detected by ultrasound was not measured for this comparison. |
| Adverse events | 122 per 1000 | 142 per 1000 | RR 1.16 | 627 | ⊕⊕⊕⊝ Due to imprecision | Albendazole probably makes little or no difference to adverse events. |
| *The risk in the intervention group (and its 95% CI) is based on the assumed risk in the comparison group and the relative effect of the intervention (and its 95% CI). | ||||||
| GRADE Working Group grades of evidence | ||||||
| aNot downgraded for risk of bias: most information is from studies at low or unclear risk of bias. Two studies had high risk and one had unclear risk of bias for attrition, but the number of participants followed up were comparable between groups in most of the studies. We judged plausible bias unlikely to seriously alter the results. | ||||||
Antecedentes
Epidemiología
La filariasis linfática es una infección parasitaria con filarias filiformes y es endémica en 72 países. A nivel global, 856 000 000 de personas en 52 países requieren quimioterapia preventiva para detener la propagación de la infección (WHO 2018a). La filariasis de Bancroft, causada por Wuchereria bancrofti, causa más del 90% de las infecciones y ocurre en las regiones tropicales de Asia, África, las islas del Pacífico y en partes del Caribe y América del Sur (WHO 2016). La filariasis brugiana es menos frecuente, la Brugia malayi se manifiesta en lugares de Asia y la Brugia timori en Indonesia (Taylor 2010) Las implicaciones de la filariasis linfática para los individuos y las sociedades son múltiples. La gravedad y la evolución clínica de la enfermedad pueden dar lugar a complicaciones de salud crónica y discapacidad, que pueden ir acompañadas de cuestiones de salud mental y estigma social, mientras que la productividad reducida resultante causa casi USD 1 300 000 000 por año en pérdidas económicas (Conteh 2010).
La filariasis es transmitida por los mosquitos hembras de varios géneros, que incluyen Culex, Anopheles, Mansonia, y Aedes (Bockarie 2009). Los mosquitos portadores contraen la infección cuando ingieren sangre de los pacientes con larvas en estadio inicial, que son denominadas microfilarias (mf). Las larvas se desarrollan durante alrededor de 12 a 15 días en el mosquito y se convierten en larvas infectivas de tercer estadio (larvas L3)(Scott 2000). Cuando el mosquito vuelve a alimentarse de la sangre, las larvas ingresan por la piel, migran hacia los vasos linfáticos y se convierten en nematodos adultos (macrofilarias) en los ganglios, donde los gusanos macho y hembra se aparean. Los gusanos hembra posteriormente producen mf, que migran hacia la sangre y causan microfilaremia. Se estima que el tiempo que transcurre entre el momento en que se produce la infección y el momento en que los nematodos adultos producen la microfilaremia es de aproximadamente 12 meses (Mahoney 1971).
Las microfilarias se desplazan dentro y fuera de la sangre periférica circulante siguiendo un ciclo diario. En la mayoría de las especies, los niveles microfiláricos llegan a un pico máximo durante la noche entre las 10 p.m. y las 4 a.m. (Simonsen 1997), momento en el cual los mosquitos portadores se alimentan activamente. En la cepa subperiódica diurna de W bancrofti, encontrada sólo en la región del Pacífico sur, las mf están circulando continuamente aunque el punto máximo se observa durante el día (Bockarie 2009).
Diagnóstico y características clínicas
Históricamente, la filariasis se ha diagnosticado mediante el examen de un frotis sanguíneo para las mf utilizando microscopía. Sin embargo, aunque la sangre se toma de noche cuando las mf están en la sangre periférica, no todas las infecciones se detectan debido a que los niveles de mf son muy bajos en muchos pacientes. Los nematodos adultos también pueden estar presentes aunque todavía sin producir mf, o puede haber sólo un único nematodo no apareado en un ganglio linfático. Las valoraciones de la detección del antígeno para el antígeno filárico circulante (AFC) W bancrofti estuvieron disponibles para su uso en terreno durante los años noventa. Las valoraciones pueden usarse para el diagnóstico sensible de la infección en cualquier momento del día (Weil 1997), debido a que indican la presencia de nematodos adultos y no dependen de la presencia temporal de mf. El Global Programme to Eliminate Lymphatic Filariasis (GPELF) utiliza una prueba de diagnóstico rápido en el punto de atención para la filariasis de Bancroft, la Filariasis Test Strip (FTS), para detectar la presencia de antígenos filáricos (WHO 2015). Los niveles de antígeno de parásitos pueden medirse mediante el Og4C3 Filariasis Ag ELISA y se cree que la densidad de antígeno circulante está correlacionada con el número de gusanos W bancrofti adultos (Harnett 1990; Weil 1990). La ecografía puede demostrar la presencia de nematodos adultos vivos (Dreyer 1995).
Muchos pacientes con filariasis son asintomáticos, incluso cuando hay densidades altas de parásitos. Sin embargo, incluso las personas sin síntomas clínicos a menudo presentan cambios linfáticos, incluso linfangiectasia (dilatación de los vasos linfáticos) y engrosamiento del cordón espermático (Addiss 2000; Dreyer 2000), lo cual puede detectarse con ecografía.
Los pacientes pueden presentar episodios inflamatorios agudos, incluida la linfangitis filárica aguda (LFA), posiblemente desencadenados por la muerte del nematodo adulto, y la dermatolinfangioadenitis aguda (DLAA), vinculada con la infección bacteriana secundaria (Dreyer 1999). Un episodio de LFA se presenta con linfangitis que se propaga de forma distante o de una manera “retrógrada” a lo largo de los vasos linfáticos, creando un “cordón” palpable (Addiss 2007). Los episodios de DLAA supuestamente pueden durar hasta 16 días y causar malestar general, fiebre, escalofríos, dolor y edema, con una recurrencia habitual de los episodios varias veces al año(Addiss 2007). Los síntomas de DLAA son más graves y ocurren con mucha mayor frecuencia en comparación con la LFA (Dreyer 1999). Los ataques de DLAA recurrente son un factor principal en la evolución al linfedema crónico. Los síntomas y signos clínicos de la enfermedad crónica incluyen: hidrocele (exceso de líquido dentro de la bolsa escrotal), linfedema (edema y aumento del volumen de las áreas del cuerpo afectadas) y elefantiasis (aumento de volumen de larga duración y edema de los miembros, los escrotos o las mamas, asociado con engrosamiento de la piel).
No se comprende bien de qué modo la filaria causa la enfermedad. Se ha propuesto lo siguiente: nematodos adultos que viven y dañan los vasos linfáticos; reacciones inmunológicas a la presencia y a la muerte de las filarias; infecciones secundarias de las zonas afectadas, que contribuyen de manera significativa a la manifestación de enfermedades agudas y crónicas; y la genética del huésped (Dreyer 2000; Cuenco 2009). Un contribuyente principal a la inflamación es la liberación de lipoproteínas de Wolbachia endosimbiótica obligada, que se encuentra dentro de las células de las filarias (Taylor 2001; Turner 2009). Algunos o todos estos procesos pueden ser importantes en la patogenia y la inmunopatogénesis (Babu 2012).
Control y eliminación
La estrategia principal usada por el GPELF consta de la administración masiva de fármacos (AMF) a nivel de la comunidad a todas las poblaciones en riesgo para interrumpir la transmisión de la enfermedad y prevenir la morbilidad debido a la infección. La quimioterapia preventiva se considera necesaria cuando la población completa en una unidad de implementación (provincia, distrito, o unidad más pequeña) de un país determinado tiene una prevalencia de infección de un 1% o mayor. La quimioterapia preventiva procura interrumpir la transmisión mediante la reducción sostenida de la microfilaremia de la comunidad por debajo de un umbral crítico o la eliminación completa de las mf (Ottesen 2006).
El GPELF recomienda regímenes anuales de dosis única con dos fármacos (albendazol más dietilcarbamazina [DEC] o albendazol más ivermectina) durante al menos cinco años (correspondiente a la duración de la vida reproductiva del nematodo adulto), con una cobertura de al menos 65% de la población en riesgo completa para prevenir la transmisión. Más recientemente, para los contextos especiales la OMS ha recomendado la administración de tratamiento anual con farmacoterapia triple que incluye ivermectina, DEC y albendazol (denominado IDA) en lugar del tratamiento con dos fármacos, albendazol y DEC (WHO 2017a). Se cree que las tasas de prevalencia de mf en general son relativamente estables con el transcurso del tiempo en las comunidades endémicas a falta de tratamiento debido a la reinfección y a los nuevos nematodos adultos que producen mf (Meyrowitsch 1995).
La encuesta de evaluación de la transmisión (EET) se usa para determinar cuándo la prevalencia de infección (calculada a partir de la cantidad de casos con pruebas positivas para el AFC o positivas para el anticuerpo en niños) está por debajo de los umbrales límite críticos y la AMF puede detenerse, y también como una herramienta de vigilancia para validar la eliminación (WHO 2011). Palau, Vietnam, Wallis y Futuna, la República de las Islas Marshall y Tonga eliminaron la filariasis linfática como un problema de salud pública en 2018 y 2017 (WHO 2017b; WHO 2017c; WHO 2018b), junto con Togo, el primer país de África subsahariana (WHO 2017d) y Egipto, el primer país en la Región del Mediterráneo Oriental (WHO 2018c). Se asocian a seis países validados como habiendo logrado la eliminación en 2016 (WHO 2016), y China y la República de Corea en 2007 y 2008, respectivamente.
La dinámica de la transmisión puede mostrar una eficiencia variable según las especies de portadores en la localidad; en los procesos denominados como limitación, facilitación y proporcionalidad (WHO 2013; Graves 2016). Es posible que sea necesaria una mayor cobertura de tratamiento durante períodos más prolongados u otras estrategias como el control de portadores, en las zonas donde estos portadores son responsables de una alta proporción de transmisión (Burkot 2002; Pichon 2002). El control de portadores para la filariasis linfática puede mejorar el impacto en la transmisión durante y después de la AMF (WHO 2013), y la eliminación también se ha logrado en algunas zonas como las Islas Salomón y Australia mediante los métodos de control de portadores (Burkot 2002; Pichon 2002).
Además de los fármacos “microfilaricidas” DEC e ivermectina, también se ha demostrado que los fármacos “macrofilaricidas” que eliminan los nematodos adultos son efectivos. Los antibióticos, como la doxiciclina, se dirigen a la Wolbachia endosimbiótica obligada en el parásito, lo cual da lugar a esterilidad a largo plazo y a una eliminación gradual y sostenida de los nematodos adultos (Taylor 2005; Debrah 2007). En la actualidad la doxiciclina no se usa en los programas de tratamiento comunitarios debido a la logística de los regímenes de tratamiento más prolongados y las contraindicaciones en las mujeres embarazadas y los niños.
DEC e ivermectina
Tanto la ivermectina como la DEC eliminan rápidamente las mf de la sangre y suprimen su reaparición (Stolk 2005; Geary 2010). Se observó una reducción de un 90% en los niveles de mf previos al tratamiento después de una dosis única de DEC o de ivermectina, incluso un año después del tratamiento (Ottesen 1999). Por lo tanto, la microfilaremia puede ser reducida de forma efectiva con DEC o ivermectina (Taylor 2010). Sin embargo, los efectos limitados sobre la viabilidad de los nematodos adultos causan nuevas infecciones por mf para reemplazar aquellas en las que cede la microfilaremia(Vanamail 1990; Weil 1999).
La DEC se ha utilizado para la filariasis durante más de 50 años. En los primeros años de control, el régimen recomendado para DEC era de 6 mg/kg diarios durante 12 días (WHO 1984). Más tarde, en ensayos clínicos y comunitarios se indicó que las dosis únicas administradas en diversos intervalos (semanal, mensual, bianual y anual) tuvieron la misma efectividad (Eberhard 1989; Mataika 1993; Andrade 1995; Simonsen 1995). Existe evidencia razonable de ecografías y observaciones clínicas que señalan que la DEC mata algunos gusanos adultos después de dosis únicas (Figueredo‐Silva 1996; Norões 1997; Addiss 2000).
La ivermectina se utiliza para el tratamiento y control de las comunidades de la oncocercosis (causada por otro nematodo filiforme, Onchocerca volvulus). También ha sido efectiva en los programas de control de las comunidades para la filariasis linfática (Cartel 1990; Coutinho 1994; Cao 1997). La ivermectina se usa en áreas en las que coexisten tanto la oncocercosis como la filariasis linfática, debido a que la DEC puede dar lugar a daños oculares si se administra a los individuos con oncocercosis. Se cree que la ivermectina no tiene actividad macrofilaricida, y los estudios de ecografía han revelado que los nematodos adultos no son eliminados con ivermectina incluso en dosis altas durante seis meses (Dreyer 1996; Addiss 2000).
En las áreas de África Central y Occidental donde la filariasis linfática y la Loa loa (filaria ocular que causa loiasis) son coendémicas, el tratamiento con ivermectina o DEC puede causar eventos adversos graves (EAG) cuando hay densidades altas de mf L loa (más de 30 000 mf/mL) (Boussinesq 1997; Gardon 1997). En estas áreas, se recomienda el albendazol solo administrado dos veces al año con control de portadores cuando la ivermectina ya no se ha distribuido para la oncocercosis o la filariasis linfática (WHO 2012; WHO 2017a). La ivermectina también puede causar EAG en pacientes con oncocercosis y densidades altas de L loa; sin embargo, el tratamiento con ivermectina se recomendó para las zonas mesoendémicas y altamente endémicas de oncocercosis después de una de tres estrategias para controlar las complicaciones, si ocurrieran (Mectizan Expert Committee 2004). ver Tabla 1.
Los efectos adversos de los fármacos antifiláricos pueden ser graves (aunque rara vez mortales) e impedir que los pacientes comiencen o finalicen el tratamiento. Los más graves parecen ser causados por una reacción inmunológica del huésped inducida por la eliminación rápida de las mf y asociados con la liberación de lipoproteínas inflamatorias de Wolbachia (Cross 2001; Turner 2009). Los efectos adversos incluyen: fiebre, dolor de cabeza, malestar, dolor muscular y hematuria. Los efectos locales incluyen dolor localizado, ganglios dolorosos a la palpación, linfadenitis (inflamación de los ganglios linfáticos) y linfangitis (inflamación de los vasos linfáticos) (Addiss 2000).
Albendazole
El albendazol se ha utilizado ampliamente para tratar los parásitos intestinales desde fines de la década de los 80 y puede tener un papel potencial en el control de la filariasis linfática (Ottesen 1999). En un estudio temprano sobre el albendazol para la filariasis linfática, se consideró que una dosis alta (400 mg) administrada dos veces al día durante 21 días era macrofilaricida debido a las reacciones adversas graves que los autores atribuyeron a la muerte de los gusanos adultos (Jayakody 1993). Un informe de una consulta informal organizada por la OMS sugirió que el albendazol en altas dosis repetidas tiene un efecto destructivo o esterilizador sobre los nematodos adultos de W. bancrofti (CDS/FIL 1998). Sin embargo, no se conoce si el agregado de albendazol a la DEC o a la ivermectina mejora la curación, previene la transmisión adicional o influye en la ocurrencia de eventos adversos (Addiss 2005).
Una revisión narrativa de Horton 2000 de GlaxoSmithKline, que fabrica albendazol, no demostró que el agregado de albendazol a cualquiera de los fármacos produjera un aumento de la frecuencia o de la gravedad de los eventos adversos. GlaxoSmithKline señaló que el albendazol no cumple una función en el tratamiento de la morbilidad (no tratará los síntomas en pacientes ya afectados por la filariasis) (GlaxoSmithKline 2002). Un ensayo reciente informó que una proporción significativa de niños con infección por W bancrofti presentaron la reversión de la patología linfática al recibir la combinación de albendazol y DEC anualmente (Kar 2017). Por lo tanto, se incluyó la efectividad del albendazol para reducir la evolución de la enfermedad y la incidencia de nuevos síntomas como un resultado secundario.
Se considera que la administración de albendazol en los programas de AMF para la filariasis linfática tiene beneficios “más allá de la filariasis”, debido a que además se dirige el “poliparasitismo” a través del tratamiento de las infecciones por helmintos intestinales (Shenoy 2011). Sin embargo, una revisión narrativa de Horton 2009 declaró que "aunque no hay ninguna duda acerca de la eficacia del albendazol para el tratamiento de muchas enfermedades causadas por helmintos, nunca podría recomendarse como un agente único para la filariasis". En 2005 una revisión sistemática estableció la conclusión de que "el agregado de albendazol a la DEC o a la ivermectina no parece mejorar la efectividad de ninguno de los fármacos solos, y por lo tanto puede no beneficiar directamente el aspecto de eliminación de la transmisión del programa de control de la filariasis linfática" (Tisch 2005). Los autores también formularon observaciones sobre la insuficiencia de los datos existentes para comparar la eficacia de los regímenes farmacológicos contra la filariasis de Bancroft, y destacaron la necesidad de más evidencia de estudios controlados aleatorios comparativos. Por el contrario, una revisión de la opinión de expertos que incluyó metanálisis y datos de observación (también publicada en 2005) estableció la conclusión de que la administración concurrente de albendazol fue más efectiva para la reducción de la prevalencia de mf que un fármaco antifilárico solo (Gyapong 2005).
Por qué es importante realizar esta revisión
Desde el inicio del GPELF, las intervenciones para la filariasis linfática han prevenido o curado alrededor de 97 000 000 de casos y evitado más de USD 100 000 000 000 en pérdidas económicas durante las vidas de los beneficiarios (Ramaiah 2014; Turner 2016). El tratamiento combinado (albendazol con ivermectina o DEC) ha sido respaldado durante casi dos décadas por la OMS y el GPELF, así como la Global Alliance to Eliminate Lymphatic Filariasis (GAELF), que en la actualidad declara que "se ha demostrado que la combinación de albendazol con Mectizan® o DEC mejora la eficacia de los tratamientos farmacológicos individuales al reducir los números de parásitos en la sangre" (GAELF 2018). Más recientemente, los investigadores han estado investigando una dosificación mayor o más frecuente de albendazol (De Britto 2015; Kar 2015), así como la efectividad del tratamiento triple de dosis única con IDA (Thomsen 2016; King 2018).
Sin embargo, a pesar de la política que recomienda el agregado de albendazol a la ivermectina o a la DEC, o la monoterapia con albendazol en las zonas donde la L loa es coendémica, aún no se conoce si el agregado del mismo es beneficioso específicamente para la filariasis linfática.
La versión publicada anterior de esta revisión Cochrane concluyó que no había suficiente evidencia sobre la efectividad del fármaco albendazol, solo o en combinación con fármacos antifiláricos, para la eliminación o la interrupción de la transmisión de los gusanos que causan la filariasis linfática (Addiss 2005). En vista de esto, se procuró resumir la evidencia sobre los efectos del albendazol solo o combinado con un fármaco microfilaricida tanto para el tratamiento individual como para el control de la transmisión, actualizando la edición anterior con nuevos métodos e incluyendo nuevos ensayos.
Objetivos
Evaluar los efectos del albendazol solo, y los efectos del agregado de albendazol a la DEC o la ivermectina, en pacientes y comunidades con filariasis linfática.
Métodos
Criterios de inclusión de estudios para esta revisión
Tipos de estudios
Ensayos controlados aleatorios (ECA), incluidos los que realizaron una asignación al azar grupal.
Tipos de participantes
-
Adultos o niños con filariasis definida por la presencia de gusanos de mf en la sangre, antígenos filáricos en la sangre o detección por medio de ecografía de nematodos adultos en los vasos linfáticos.
-
Poblaciones normalmente residentes en las comunidades endémicas y que sean elegibles para el tratamiento independiente del estado de la microfilaremia.
Tipos de intervenciones
-
Albendazol solo versus placebo o ningún placebo.
-
Albendazol más DEC versus DEC sola (la misma dosis y el mismo régimen de DEC en ambos grupos).
-
Albendazol más ivermectina versus ivermectina sola (la misma dosis y el mismo régimen de ivermectina en ambos grupos).
Tipos de medida de resultado
Resultados primarios
Medidas de posibilidad de transmisión
-
Prevalencia de mf.
-
Densidad de mf (densidad individual o comunitaria promedio en los ensayos comunitarios).
Resultados secundarios
Marcadores de la infección por nematodos adultos
-
Prevalencia de la antigenemia.
-
Densidad de antígenos.
-
Prevalencia de nematodos adultos (viabilidad de las macrofilarias detectadas por ecografía).
Enfermedad clínica
-
Filariasis aguda (fiebre más pruebas clínicas de inflamación del sistema linfático, tal como la han definido los investigadores primarios).
-
Aparición o desaparición de hidrocele o linfedema.
-
Reducción del tamaño (o gravedad o grado) de hidrocele o linfedema.
Eventos adversos.
-
Cualquier evento adverso que afecte las actividades diarias o que necesite hospitalización.
-
Eventos adversos sistémicos (p.ej. fiebre, cefalea, malestar, mialgia o hematuria).
-
Eventos adversos locales (p.ej. dolor localizado e inflamación, ganglios dolorosos a la palpación, linfadenitis o linfangitis).
Métodos de búsqueda para la identificación de los estudios
Búsquedas electrónicas
We attempted to identify all relevant trials regardless of language or publication status (published, unpublished, in press, and in progress).
We searched the following databases using the search terms and strategy described in Appendix 1.
-
Cochrane Infectious Diseases Group Specialized Register (up to 15 January 2018).
-
MEDLINE (PubMed, 1966 to 15 January 2018).
-
Embase (OVID, 1974 to 15 January 2018).
-
Cochrane Central Register of Controlled Trials (CENTRAL) published in the Cochrane Library (Issue 1, 2018).
-
Latin American and Caribbean Health Sciences Literature (LILACS) (BIREME, 1982 to 15 January 2018).
We also searched the WHO International Clinical Trials Registry Platform (www.who.int/ictrp/search/en/) and ClinicalTrials.gov, to identify ongoing trials using the terms: filariasis; albendazole; benzimidazole.
Búsqueda de otros recursos
We checked the reference lists of all included trials to identify relevant studies.
Obtención y análisis de los datos
Selección de los estudios
Two review authors, Cara Macfarlane (CM) and Shyam Budhathoki (SB), screened titles and abstracts identified from the search strategy, obtained full‐text copies of all potentially relevant trials and checked each trial report for evidence of multiple publications from the same data set. CM and SB independently assessed each trial for inclusion using an eligibility form based on the inclusion criteria and resolved any disagreements through discussion or, where necessary, by consulting a third review author, Paul Garner (PG). We contacted trial authors when we required further information. We planned to contact authors of unpublished trials. We listed excluded studies and the reasons for their exclusion in the ‘Characteristics of excluded studies’ table, and studies awaiting classification in the ‘Studies awaiting classification’ table along with any known details. We illustrated the study selection process in a PRISMA diagram.
Extracción y manejo de los datos
Two review authors (CM and SB) independently extracted data on trial characteristics, including methods, participants, interventions (including dose and treatment frequency), and outcomes using a pretested data extraction form. We resolved any differences in data extraction through discussion or by consulting a third review author (PG). In the case of unclear or missing data, we attempted to contact the primary investigators for further information. We recorded the number of participants randomized in each treatment group and the number of participants that were analysed for each outcome of interest, and reported the loss to follow‐up in each group. When data were shown in figures but were not reported in the article text, we extracted data using WebPlotDigitizer software (Version 3.12) (Rohatgi 2017).
RCTs that randomized individuals
For dichotomous outcomes, we recorded the number of participants experiencing the event and the total number of participants in each treatment group. For continuous outcomes, we aimed to extract geometric means and confidence intervals (CIs), together with the numbers of participants in each group. Where these were not reported, we extracted the summary measure used (geometric mean, log mean, or arithmetic mean) and standard deviations (SDs) or CIs where possible, along with the numbers of participants in each group. Where change from baseline results were presented alongside results purely based on the end value, we only extracted the change from baseline results.
RCTs that randomized clusters
For cluster‐RCTs that met the inclusion criteria, we attempted to extract the cluster unit, the number of clusters in the trial, the average size of clusters, and the unit of randomization (such as household). We extracted the statistical methods used to analyse the trial along with details describing whether these methods adjusted for clustering or other covariates. We attempted to extract the intra‐cluster correlation coefficient (ICC) for the cluster‐RCT, as if this was reported we could adjust the analyses.
We aimed to extract the cluster‐adjusted results when a cluster‐RCT adjusted for clustering in their analysis. When the trial did not account for clustering in their analysis, we extracted the same data as for trials that randomize individuals.
Evaluación del riesgo de sesgo de los estudios incluidos
Two review authors (CM and SB) independently assessed the risks of bias for each included trial using the Cochrane ‘Risk of bias' tool (Higgins 2011), and resolved differences of opinion through discussion with Samuel Johnson (SJ) and PG. For RCTs that randomized individuals we assessed six components: sequence generation; allocation concealment; blinding (of participants, personnel, and outcome assessors); incomplete outcome data; selective outcome reporting; and other potential biases. For the cluster‐RCT, we addressed additional components: recruitment bias; baseline imbalance; loss of clusters; incorrect analysis; and compatibility with RCTs randomized by individual.
For sequence generation and allocation concealment, we reported the methods used. For blinding, we described who was blinded and the blinding method. For incomplete outcome data, we reported the percentage and proportion of participants lost to follow‐up. For selective outcome reporting, we stated any discrepancies between the methods used and the results in terms of the outcomes measured or the outcomes reported. For other biases, we described any other trial features that could have affected the trial result (for example, if the trial was stopped early).
We categorized our ‘Risk of bias' judgements as either ‘low’, ‘high’, or ‘unclear’. We displayed the results in ‘Risk of bias' tables, a ‘Risk of bias' summary, and a ‘Risk of bias' graph.
Medidas del efecto del tratamiento
We used the risk ratio (RR) to compare the treatment and control groups for dichotomous outcomes, and presented the treatment effects with 95% CIs.
For continuous data summarized using geometric means, we planned to report the geometric mean ratios. Due to the variability in the summary measures reported and the lack of reporting of CIs or measures of variance in the trials, we could not synthesize data to obtain pooled treatment effects. We report continuous outcomes in ‘Additional tables', and we compare the difference in the intervention and the control groups' percentage reductions in parasitaemia from baseline.
Cuestiones relativas a la unidad de análisis
For a particular cluster‐RCT when the analyses had not been adjusted for clustering, we planned to try and adjust the results for clustering by estimating the design effect calculated as 1+(m‐1)*ICC, where m is the average cluster size and ICC is the ICC. When the true ICC was unknown, we planned to estimate it from other included cluster‐RCTs. As we were unable to estimate the ICC due to the inclusion of a single cluster‐RCT, we presented the trial authors' unadjusted data in Appendix 2.
Manejo de los datos faltantes
We aimed to conduct a complete‐case analysis in this review, such that all participants with a recorded outcome were included in the analysis. When necessary, we made extensive efforts to obtain clarification over aspects of the parasite density data and to obtain the original data from the trial authors.
Evaluación de la heterogeneidad
We assessed statistical heterogeneity using Chi2 and I2 statistics (Higgins 2003), and judged any heterogeneity using values of I2 greater than 50% and a Chi2 P value of 0.10 or less to indicate moderate to substantial statistical heterogeneity (Deeks 2017).
Evaluación de los sesgos de notificación
We planned to assess the possibility of publication bias by examining funnel plots for asymmetry, but there were too few trials.
Síntesis de los datos
One review author (CM) analysed the data using Review Manager 5 (Review Manager 2014). The main analysis examined albendazole alone or added to a microfilaricidal drug. We sought to identify evidence of an overall effect of albendazole; in the presence of high heterogeneity of effects between albendazole alone or added to either of the microfilaricidal drugs, we would then proceed to analysis of individual comparisons to see if this explained the heterogeneity. However, no such inconsistency was apparent. Nevertheless, we included additional comparisons of albendazole alone or in combination versus the background drug, be that placebo, DEC, or ivermectin. We provide this to summarize the reliable evidence for policy‐makers interested in the effectiveness of albendazole regimens for global lymphatic filariasis programmes.
We directly compared treatments using pairwise comparisons. Some trials randomized infected and uninfected individuals, but only analysed subgroups of participants who were infected at baseline. The primary analysis for each outcome included the number of individuals randomized as the denominator, where possible. When a trial reported data at multiple time points we included data collected at the longest follow‐up time up to 12 months in the analysis. The exception to this was data for mf density, which we analysed by longest follow‐up time up to six months and at 12 months to seek evidence of any temporally‐dependent effects. Within the individual drug comparator groups (e.g. albendazole versus placebo), we also conducted meta‐analyses for different follow‐up time points, and included data from subgroups of individuals known to be infected or participants who were both infected and uninfected.
We planned to combine RCTs that randomized individuals and cluster‐RCTs that adjusted for clustering using meta‐analysis. When a cluster‐RCT did not adjust for clustering and could not be combined with RCTs, we reported the results of the cluster‐RCT in an appendix. We used a fixed‐effect meta‐analysis when the assessments of heterogeneity did not reveal heterogeneity. In the presence of statistical heterogeneity we used random‐effects meta‐analysis.
For continuous data, we presented data that could not be meta‐analysed in ‘Additional tables' and reported on these in each section under the relevant outcome heading. For the parasite density data, we examined the summary measure used (geometric, log, or arithmetic mean), the methods that were used to estimate this and the change in density post‐treatment, and whether the analysis included the whole population or only infected participants. We sought approaches to allow meta‐analysis of the density data, but this was not possible due to the variability in the summary measures reported and the lack of reporting of CIs or measures of variance. We were also unable to calculate measures of treatment effect for individual studies, due to the lack of reported measures of variances or CIs. We therefore reported on the trial authors' statistical tests of significance.
Where trial authors provided geometric or log estimates of percentage reduction for parasite density outcomes (as an average across participants), we took the estimated percentage reduction in the intervention and the estimated percentage reduction in the control and calculated the percentage difference in density reduction between intervention and control. Whilst we could not conduct meta‐analyses to assess the treatment effect, it gave a measure of the direction of the possible effect.
Certainty of the evidence
We assessed the certainty of the evidence for each important outcome using the GRADE approach (Schünemann 2013). All review authors participated in the GRADE assessment through several meetings. For the main outcomes in each comparison, we used GRADE profiler to assess five domains: risk of bias; inconsistency; indirectness; imprecision; and publication bias (GRADEpro 2015).
We assessed the overall certainty of the evidence using four categories (high, moderate, low, or very low). The baseline for each outcome was set as high‐certainty evidence, as all studies were RCTs. Each GRADE domain could be downgraded by one or two levels if we judged it to have serious or very serious concerns, and we detailed the justification for downgrading in footnotes.
We displayed the GRADE rating of the certainty of evidence and justification for downgrading in the ‘Summary of findings' tables.
‘Summary of findings' tables
We interpreted results using ‘Summary of findings' tables, which provide key information about the certainty of the evidence for the included trials in the comparison, the magnitude of effect of the interventions examined, and the sum of available data on the main outcomes. Using GRADE profiler (GRADEpro 2015), we imported data from Review Manager 5 (Review Manager 2014). We present the main outcomes for the review in the ‘Summary of findings' tables. When there was no pooled effect estimate for an outcome, we presented a narrative synthesis of quantitative data.
Análisis de subgrupos e investigación de la heterogeneidad
In the presence of statistically significant heterogeneity, we planned to explore the following potential sources of heterogeneity using subgroup analyses: drug dose (comparing regimens where there are significant variations in drug dose), participant age (children only, adults only, or whole populations), and length of follow‐up. We conducted subgroup analyses for drug dose and length of follow‐up only, as this appeared to explain the heterogeneity.
Análisis de sensibilidad
We carried out sensitivity analyses including only those trials with a low risk of bias for allocation concealment.
Results
Description of studies
Results of the search
See PRISMA flow diagram (Figure 1).
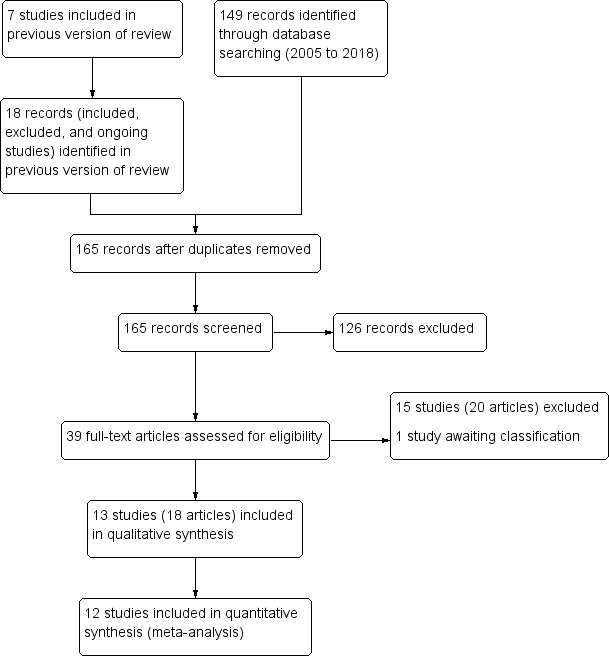
Study flow diagram.
We included 13 trials (8713 participants), reported in 18 articles (see Characteristics of included studies). In this Cochrane Review update, we dropped two comparisons (albendazole versus DEC and albendazole versus ivermectin), so we re‐screened all included, excluded, and ongoing studies from the last published version (Addiss 2005), in addition to 149 records identified from the update search. We were unable to locate one record cited in the previous version of this review, which was a two‐year follow‐up to Pani 2002.
We excluded 15 studies (reported in 20 records) at full‐text screening stage (see Characteristics of excluded studies). One study we excluded that was listed in a trial register (NCT01975441) published the full‐text article after we conducted the search in 15 January 2018 (King 2018). One trial, Purkait 2017, is awaiting classification (see Characteristics of studies awaiting classification). We excluded one trial included in the previous published review, as it no longer meets the inclusion criteria due to the removal of a comparison (albendazole versus DEC) (Jayakody 1993).
Included studies
Location
The included trials were undertaken in eight different countries: India (Pani 2002; Kshirsagar 2004; Gayen 2013; De Britto 2015), Haiti (Beach 1999; Fox 2005), Brazil (Dreyer 2006; Rizzo 2007), Papua New Guinea (Bockarie 2007), Zanzibar (Dahoma 2000), Ghana (Dunyo 2000), Tanzania (Simonsen 2004), and Kenya (Wamae 2011). All trials were conducted in endemic regions.
Participants
Three trials were school‐based and recruited children and adolescents (5 to 18 years old) from school populations (Beach 1999; Simonsen 2004; Fox 2005); five trials were conducted in community settings and recruited adults and children (Dahoma 2000; Dunyo 2000; Kshirsagar 2004; Bockarie 2007; Wamae 2011). Three studies were hospital‐based and recruited only children and adolescents (9 to 19 years of age) (Rizzo 2007), only adult men (Dreyer 2006), or adults and children (Pani 2002). Two trials recruited mf‐positive adults from endemic villages (Gayen 2013; De Britto 2015).
Seven trials enrolled people with a variety of inclusion criteria related to filarial infection; four only enrolled individuals who were mf‐positive (Pani 2002; Rizzo 2007;Gayen 2013;De Britto 2015); Dreyer 2006 enrolled individuals with detectable filaria dance sign (FDS); Dahoma 2000 enrolled individuals who had either microfilaraemia or who were amicrofilaraemic with clinical disease; and Wamae 2011 enrolled individuals if one or more members of a household were microfilaraemic.
Six trials enrolled individuals irrespective of their infection status at baseline (Beach 1999; Dunyo 2000; Kshirsagar 2004; Simonsen 2004; Fox 2005; Bockarie 2007). Kshirsagar 2004 enrolled 1403 participants for a safety study and included 103 men in a separate analysis of efficacy at 3, 6, and 12 months follow‐up. Forty‐three of the 103 participants in the smaller efficacy analysis were mf‐positive, 30 had clinical disease, and 30 were mf‐negative and asymptomatic. For subsequent assessments at 12, 24, and 36 months follow‐up, men and women from the safety study who were mf‐positive at baseline were also included (155 participants).
Intervention
Four trials assessed albendazole alone versus placebo (Beach 1999; Dunyo 2000; Fox 2005; Gayen 2013), eight trials assessed albendazole plus DEC versus DEC alone (Pani 2002; Kshirsagar 2004; Fox 2005; Dreyer 2006, Bockarie 2007; Rizzo 2007; Wamae 2011; De Britto 2015) and four trials assessed albendazole plus ivermectin versus ivermectin alone (Beach 1999; Dahoma 2000; Dunyo 2000; Simonsen 2004).
Twelve trials used the same albendazole dose (400 mg) (Beach 1999; Dunyo 2000; Pani 2002; Kshirsagar 2004; Simonsen 2004; Fox 2005; Dreyer 2006; Bockarie 2007; Rizzo 2007; Wamae 2011; Gayen 2013; De Britto 2015), and Dahoma 2000 did not report the dose. Drug dose information for Dahoma 2000 appeared to be reported in the appendices, which were not included in our copy of the thesis. We contacted the author of Dahoma 2000 and the library where the thesis was deposited to obtain the appendices, but received no response. As albendazole is usually given as a standard 400 mg single dose and there was no indication that a non‐standard dose was used, we included this trial. In the four placebo‐controlled trials, Dunyo 2000 and Gayen 2013 described tablets as identical or matching albendazole‐placebo, while Beach 1999 and Fox 2005 provided 250 mg vitamin C tablets.
All trials used a 6 mg/kg dose of DEC except for De Britto 2015, where 300 mg DEC was given. De Britto 2015 also provided a placebo for 12 days following treatment with DEC and with albendazole plus DEC.
Of the four trials that included ivermectin, three trials used doses varying from 200 to 400 μg/kg (Beach 1999) and 150 to 200 μg/kg (Dunyo 2000; Simonsen 2004). Dahoma 2000 did not report the ivermectin dose, but the thesis discussion indicated the dosage was similar to 200 μg/kg.
In nine trials the drugs were given as a single‐dose treatment (Beach 1999; Dahoma 2000; Dunyo 2000; Pani 2002; Simonsen 2004; Fox 2005; Dreyer 2006; Bockarie 2007; Rizzo 2007); Kshirsagar 2004 and Wamae 2011 provided three annual single doses. Two trials used more intensive treatment regimens; Gayen 2013 provided albendazole daily for seven days, and De Britto 2015 provided albendazole plus DEC or DEC daily for 12 days.
Study design
Twelve trials were individually‐RCTs, and Wamae 2011 was a cluster‐RCT. The cluster‐RCT used households as the unit of randomization, and included 64 households containing 205 adults and children.
The length of follow‐up varied between trials. Dahoma 2000 followed up participants for two weeks; Beach 1999 for four months; Fox 2005 for six months; Dunyo 2000, Simonsen 2004, Dreyer 2006, Rizzo 2007, Gayen 2013, and De Britto 2015 for 12 months; Bockarie 2007 and Wamae 2011 for 24 months; and Pani 2002 and Kshirsagar 2004 for 36 months.
Outcomes
Measures of transmission potential
All trials reported on mf prevalence and density, but the methods of measurement varied. Beach 1999 and Fox 2005 assessed 20 μL of blood with thick smear microscopy. Dunyo 2000, Simonsen 2004, and Wamae 2011 assessed 100 μL of blood using a counting chamber, and Dahoma 2000 assessed 200 μL of blood using a counting chamber. Seven trials assessed 1 mL blood using membrane filtration (Pani 2002; Kshirsagar 2004; Dreyer 2006; Bockarie 2007; Rizzo 2007; Gayen 2013; De Britto 2015). Kshirsagar 2004 also assessed prevalence in 60 μL of blood with thick smear microscopy.
Markers of adult worm infection
Eight trials reported antigenaemia prevalence (Dunyo 2000; Pani 2002; Kshirsagar 2004; Simonsen 2004; Fox 2005; Bockarie 2007; Wamae 2011; De Britto 2015), of which all except Kshirsagar 2004 also reported on antigen density. Five trials assessed antigenaemia using the TropBio Og4C3 ELISA (Dunyo 2000; Simonsen 2004; Fox 2005; Bockarie 2007; Wamae 2011); Kshirsagar 2004 used the BinaxNOW Filariasis ICT; and Pani 2002 and De Britto 2015 used both the ELISA and the immunochromatographic card test (ICT). Three trials also assessed the effect of treatment on adult worm FDS by ultrasound scan in male participants (Pani 2002; Kshirsagar 2004; Dreyer 2006).
Clinical disease
Dunyo 2000 reported on the effect of treatment on clinical disease (lymphoedema or hydrocoele), including the reduction in grade or disappearance of clinical disease, the increase in clinical disease grade, and the appearance of new clinical disease at 12 months follow‐up.
Adverse events
Twelve trials reported on adverse events, but the reporting varied between trials. Some trials reported the proportion of participants experiencing adverse events (Dunyo 2000; Pani 2002; Kshirsagar 2004; Rizzo 2007; Wamae 2011; Gayen 2013; De Britto 2015), while some also reported the incidence of specific systemic adverse events (Beach 1999;Dahoma 2000; Dunyo 2000;Pani 2002; Simonsen 2004; Fox 2005; Rizzo 2007), tolerability (Kshirsagar 2004), or calculated scores based on severity and intensity (Beach 1999;Pani 2002; Fox 2005). Dreyer 2006 reported appearance of intrascrotal nodules in adult worm nests of male participants as a ‘sensitive reaction' to treatment. Bockarie 2007 did not mention adverse events post‐treatment.
Reported statistical analysis
Individually‐randomized trials
The statistical analyses used in the trials for density data are reported in Table 2, and detailed further here. The methods used to calculate mf density and antigen density and the percentage reductions from baseline to follow‐up were inconsistently reported across trials, and SDs or CIs for density data were absent in all but one study reporting the geometric mean (Dunyo 2000), and two studies reporting the arithmetic mean (Pani 2002; Kshirsagar 2004). We obtained CIs from the investigators of Rizzo 2007, and CIs for density data reported in Fox 2005 were obtained by the authors of the last published version of this review (Addiss 2005). As so few trials reported any measure of variance or CIs, and the summary measures presented differed between and within trials (such as arithmetic means, geometric means, and log means), we could not pool results for changes in parasite density. Results quoted in this review are the original trial author's calculations.
| Study details | Reported statistical analysis | ||||||
| Trial | Type of people enrolled | Mf density outcome denominator | CFA density outcome denominator | Mean reported | Explicit about method used to accommodate people with zero counts | Explicit about method used to calculate % reduction in density | If density increased post‐ treatment, authors set change to zero |
| Infected and uninfected | All mf‐positive | NA | GM | No | Yes | Yes | |
| Infected and uninfected | All CFA‐positivea | All CFA‐positiveb | GM | Yes (“n+1”) | Noa | NRa | |
| All mf‐positive | All mf‐positive | All CFA‐positive | LM | No | NR | NA | |
| All FDS‐positive | All individuals | NA | GM | Noc | Noc | NRc | |
| Infected and uninfected | All mf‐positived | All CFA‐positived | GM | Yes Calculation provided | Noe | NRe | |
| Infected and uninfected | All mf‐positive | All CFA‐positive | GM | Yes (“n+1”) | Yes | Yes | |
| All mf‐positive | All mf‐positive | NA | AM | NA | Noe | NRe | |
| Infected and uninfected | All mf‐positive | NA | AM | NAf | Noe | NRe | |
| All mf‐positive | All mf‐positive | All individuals | GM and AM | Nog | No | NR | |
| All mf‐positive | All mf‐positive | NA | GM | Yes (“n+1”) | NR | NA | |
| Infected and uninfected | All mf‐positive | All CFA‐positive | GM | Yes Calculation provided | Noe | NRe | |
Abbreviations: AM: arithmetic mean; CFA: circulating filarial antigen; FDS: filarial dance sign; GM: geometric mean; LM: log mean; Mf: microfilariae; NA: not applicable; NR: not reported.
aMf density and percentage reduction in density were reported for all participants irrespective of their pre‐treatment infection status only at the 24‐month follow‐up. Details were not provided in the Methods, but the standard percentage change calculation was used.
bAntigen density was reported as number of antigenaemic participants with high antigenaemia decreasing to low or to negative, and number with low antigenaemia converting to negative only at 24‐month follow‐up.
cAuthors provided further details on request; for mf density the "n+1" formula before log transforming values was used, and % reduction was calculated using method reported in Addiss 1993.
dAuthors also reported mf and CFA unit geometric mean densities for individuals who were negative for the markers at baseline and positive at 12 months; however, the change or reduction in population mf or CFA densities for all enrolled individuals was not reported.
eDetails were not provided in the Methods, but the standard percentage change calculation was used.
fAuthors used the arithmetic mean and only assessed participants who remained mf‐positive at follow‐ups; participants who had previously been mf‐positive but converted to negative were excluded from density calculations.
gThe last version of this review, Addiss 2005, reported further details were provided by Pani 2002 on request; this trial calculated a William's mean (a modified geometric mean to take into account zero counts).
Six trials enrolled individuals irrespective of their infection status at baseline (Beach 1999; Dunyo 2000; Kshirsagar 2004; Simonsen 2004; Fox 2005; Bockarie 2007), and none reported the overall change in mf density or antigen density in the total population enrolled up to 12 months; only Bockarie 2007 provided a measure of the impact on community mf density at 24 months post‐treatment. Most trials reported geometric mean mf density (Beach 1999; Dunyo 2000; Pani 2002; Simonsen 2004; Fox 2005; Dreyer 2006; Bockarie 2007; Rizzo 2007), and geometric mean antigen density (Dunyo 2000; Simonsen 2004; Fox 2005); De Britto 2015 reported the log mean mf density and log mean antigen density; the arithmetic mean was also used for mf density (Pani 2002; Kshirsagar 2004; Gayen 2013), and for antigen density in Pani 2002. Dahoma 2000 reported mf density data by intensity categories ("1‐20mff, 21‐39 mff, 40‐59 mff, >60mff"), and Wamae 2011 reported that they calculated geometric mean mf intensity, but reported log mean mf densities that had not been adjusted for clustering. We did not include parasite density data from Dahoma 2000 and Wamae 2011 in our analyses.
Four studies were not explicit about the method used to accommodate zero counts (Beach 1999; Pani 2002; Dreyer 2006; De Britto 2015), but Pani 2002 and Dreyer 2006 provided further details on request; the authors calculated a William's mean (a modification of the geometric mean to accommodate zero values) (Willams 1937; Basáñez 1994). Five trials reported using the "n+1" formula before log transforming the data. Seven trials were not explicit about the method used to calculate the percentage reduction for density data (Dunyo 2000; Pani 2002; Kshirsagar 2004; Simonsen 2004; Dreyer 2006; Bockarie 2007; Gayen 2013), but five of these trials used the standard percentage change calculation (Dunyo 2000; Kshirsagar 2004; Simonsen 2004; Bockarie 2007; Gayen 2013). Dreyer 2006 provided further details on request; this trial used the method described by Addiss 1993. Beach 1999 and Fox 2005 calculated the geometric mean mf density and antigen density reduction by dividing the difference between densities before and after treatment by the pretreatment mf density and log transforming the results. If pretreatment mf density was less than the density after treatment, the reduction was deemed to be zero. The trialists performed this adjustment to eliminate the problem of log transforming a negative value, but this method may bias estimates of treatment effectiveness, as increases in mf density after treatment are set to zero.
Two trials reported inappropriate statistical methods for assessing differences in mf density or antigen density between treatment groups. Gayen 2013 reported use of a paired t‐test, which is an unsuitable test for comparing different groups. Simonsen 2004 estimated the combined effect on both mf density and antigen density over the one‐year follow‐up period using repeated measures ANOVA, and used pairwise contrast tests to examine differences between groups at specific time points; however, repeated measures ANOVA is unsuitable for comparing groups, and results of pairwise contrast tests were not reported.
Cluster‐randomized trials
One cluster‐RCT reported the use of a multilevel mixed‐effects regression model that adjusted for the cluster design (Wamae 2011); however, the primary and secondary outcomes of the review were not adjusted using this model and the authors reported on subgroups of microfilaraemic or antigenaemic individuals at follow‐up. It was not possible to adjust the results for clustering by estimating the design effect, as the average cluster size and ICC were not reported. We also could not estimate the ICC, as no other cluster‐RCTs were included. No outcomes from this trial were therefore suitable for meta‐analysis or comparative analysis, and we present the authors' unadjusted results in Appendix 2.
Dealing with missing data
We attempted to clarify aspects of the parasite density data and to obtain the original data from the authors, but we could not acquire most of the data that we required from the primary studies for our analysis. We contacted authors of Beach 1999, Fox 2005, Dreyer 2006, Bockarie 2007, Rizzo 2007, and De Britto 2015, and also attempted to contact Simonsen 2004, but the email addresses that we obtained from recently published articles were inactive. At our request, the authors of Rizzo 2007 provided us with CIs and SDs of log‐transformed density data and the number of participants reporting adverse events, and the authors of Dreyer 2006 gave us the raw data files. We contacted the authors of Beach 1999 and Fox 2005 to obtain the raw study data in order to recalculate the percentage reduction in density from baseline to follow‐up. We received no response from the authors of Fox 2005. The authors of Beach 1999 were unable to provide this at the time of preparing the review, due to issues with the file formats. We hope to incorporate new data analyses from Beach 1999 into any future updates of this Cochrane Review.
Excluded studies
We excluded 15 trials (reported in 20 records) at the full‐text screening stage, because they did not include the comparison groups or participant population sought for the review, the methods and results were not coherent or clearly expressed, the number of participants randomized for each group was very small with differential losses to follow‐up between treatment groups, or they were not an RCT. See Characteristics of excluded studies.
Risk of bias in included studies
See Figure 2 and Figure 3 for ‘Risk of bias' summaries, and Characteristics of included studies section for details of the risks of bias and methods used in each trial.

‘Risk of bias' summary: review authors' judgements about each risk of bias item for each included study.

‘Risk of bias' graph: review authors' judgements about each risk of bias item presented as percentages across all included studies.
Allocation
All trials described themselves as randomized. We judged the risk of bias to be low in six trials that described a method of randomization (Beach 1999; Dahoma 2000; Dunyo 2000; Simonsen 2004; Fox 2005; Rizzo 2007), and unclear in seven trials that did not provide further details (Pani 2002; Kshirsagar 2004; Dreyer 2006; Bockarie 2007; Wamae 2011; Gayen 2013; De Britto 2015).
We judged eight trials to be at low risk of bias for allocation concealment (Beach 1999; Dahoma 2000; Dunyo 2000; Pani 2002; Kshirsagar 2004; Simonsen 2004; Fox 2005; Gayen 2013). We judged Rizzo 2007 to be at high risk of bias, as allocation of participants was not concealed. We judged four trials to be at unclear risk, due to insufficient information (Dreyer 2006; Bockarie 2007; Wamae 2011; De Britto 2015).
Blinding
Nine trials described themselves as "double blind". For blinding of participants and personnel, five studies described blinding and we judged these to be at low risk of bias (Beach 1999; Pani 2002; Kshirsagar 2004; Fox 2005; Gayen 2013). We judged Rizzo 2007 to be at high risk of bias, as they did not use blinding. We judged details of blinding to be unclear in seven trials (Dahoma 2000; Dunyo 2000; Simonsen 2004; Dreyer 2006; Bockarie 2007; Wamae 2011; De Britto 2015).
For blinding of outcome assessors, seven trials described blinding of outcome assessment and we judged these to be at low risk of bias (Beach 1999; Dahoma 2000; Dunyo 2000; Pani 2002; Kshirsagar 2004; Fox 2005; Rizzo 2007). Six trials did not provide details of outcome assessor blinding and we judged risk of bias to be unclear (Simonsen 2004; Dreyer 2006; Bockarie 2007; Wamae 2011; Gayen 2013; De Britto 2015).
Incomplete outcome data
About half the included studies (6/13) reported that more than 85% of all randomized individuals had been followed up, and we judged these studies to be at low risk of bias (Dahoma 2000; Pani 2002; Dreyer 2006; Rizzo 2007; Gayen 2013; De Britto 2015). We judged six studies to be at high risk of bias due to attrition, as losses or exclusions of participants during the follow‐up period were considerable (Beach 1999; Kshirsagar 2004; Simonsen 2004; Fox 2005; Bockarie 2007; Wamae 2011). We judged Dunyo 2000 to be at unclear risk.
We judged Beach 1999, Simonsen 2004, Fox 2005, and Bockarie 2007 to be at high risk of bias, as they excluded randomized participants who did not have pre‐ and post‐treatment blood samples. We judged Kshirsagar 2004 to be at high risk of bias as the authors included a very small subset of randomized participants in a separate efficacy analysis. Wamae 2011 (cluster‐RCT) did not clearly report the number of individuals that were analysed among those randomized. Dunyo 2000 analysed 1181 of 1425 participants (17.1% lost) at 12 months, with losses attributed to participant absence during survey times and some being unwilling to have repeated finger pricks. Sixty‐seven of the 340 mf‐positive participants (20%) were also lost to follow‐up.
Selective reporting
Eight trials had no obvious evidence of selective reporting and we judged these to be at low risk of bias (Dahoma 2000; Dunyo 2000; Pani 2002; Simonsen 2004; Dreyer 2006; Rizzo 2007; Gayen 2013; De Britto 2015). Four trials had evidence of selective reporting and we judged them to be at high risk of bias (Kshirsagar 2004; Fox 2005; Bockarie 2007; Wamae 2011). We judged Beach 1999 to be at unclear risk, as not all the adverse events prespecified in the Methods were reported.
Other potential sources of bias
We judged three studies to be at high risk of bias due to other potential sources of bias (Simonsen 2004; Wamae 2011; Gayen 2013). Gayen 2013 reported an inappropriate statistical analysis (paired t‐test) for testing for differences between treatments, which could bias interpretation of the intervention effects. Simonsen 2004 did not report the findings of statistical tests for differences between groups at specific time points, but reported a significant effect for the intervention over time using repeated measures ANOVA. We rated one cluster‐RCT at high risk of bias due to incorrect analysis (some data were not adjusted for clustering) and the number of clusters and participants followed up or included in the analyses was not clearly reported (Wamae 2011).
We judged two studies to have unclear risk of bias (Beach 1999; Fox 2005). For parasite density data outcomes, the authors of Beach 1999 and Fox 2005 omitted increases in density prior to estimating the percentage reduction between baseline and follow‐up. This simply provides an assessment of the decrease in density only in people experiencing a decrease. Whilst this rule was applied to both intervention and control groups, we were uncertain of the effect of this on the estimate, or exactly what the estimate was measuring.
Effects of interventions
See: Summary of findings for the main comparison Albendazole alone or added to a microfilaricidal drug for lymphatic filariasis; Summary of findings 2 Albendazole alone for lymphatic filariasis; Summary of findings 3 Albendazole added to DEC for lymphatic filariasis; Summary of findings 4 Albendazole added to ivermectin for lymphatic filariasis
The first set of analyses examine albendazole given alone or added to a microfilaricidal drug; and the subsequent analyses are grouped by the different background drugs (placebo, DEC, ivermectin).
For each comparison, we present the results at the longest follow‐up (up to 12 months) from each study, and include all individuals enrolled as the denominator where possible.
Within each different background drug analysis, we also analysed different follow‐up time points and stratified by the following.
-
People known to be infected
-
People both infected and uninfected in community studies
The data on mf density and antigen density are presented in ‘Additional tables'; this was expressed differently across studies, often with no measure of variance, and we therefore summarized it narratively in the text.
Overall effect
Albendazole alone or added to a microfilaricidal drug
One cluster‐randomized trial randomized households, and then only reported on people found to be infected and who gave blood at baseline (Wamae 2011). The authors reported the mean log density in a graph but this was complicated by interaction, and a logistic regression analysis was not clear as to who was included, and so further interpretation was not possible (see Description of studies above). The results are in Appendix 2.
Mf prevalence
Treatment with albendazole had no effect on mf prevalence at the longest follow‐up up to 12 months (5027 participants, 12 trials; Analysis 1.1).
Mf density
Eleven trials reported the effects of albendazole on mf density. Pani 2002, Rizzo 2007, Gayen 2013, and De Britto 2015 only enrolled mf‐positive people at baseline; Dreyer 2006 only enrolled people with adult worms detected by ultrasound, irrespective of mf status; Beach 1999, Dunyo 2000, Kshirsagar 2004, Simonsen 2004, Fox 2005, and Bockarie 2007 recruited mf‐positive and ‐negative participants, but only reported density in people who were mf‐positive at baseline; none reported the overall change in mf density in the total population enrolled.
Overall, albendazole was associated with inconsistent reductions in mf density up to six months (1216 participants, 10 trials; Table 3) and at 12 months (1052 participants, 9 trials; Table 4).
| Background drug | Risk of bias: analysis used | Trial (follow‐up) | Intervention (albendazole) | Control | Difference between groups post‐treatment | ||||
| Participants | Baseline to follow‐up (% reduction) | Participants | Baseline to follow‐up (% reduction) | % reduction | Significance testing (% reduction) | Significance testing: mf density | |||
| Placebo | Low or unclear risk | Dunyo 2000a,b,c,d (6 months) | 62 | 1783 (95% CI 1215 to 2617) to 693 (95% CI 335 to 1431) (61.1%) | 57 | 2277 (95% CI 1576 to 3289) to 2745 (95% CI 1505 to 5007) (20.6% increase) | 81.7% | NR | NR |
| High risk | Beach 1999a,d,e (4 months) | 29 | 14.1 to 5.1 (28.7%) | 29 | 9.3 to 5.3 (17.2%) | 11.5% | NS (P > 0.05) | NS (P > 0.05) | |
| Fox 2005a,d,e (6 months) | 42 | 12.1 (95% CI 10.3 to 14.2) to 4.4 (95% CI 3.7 to 5.3) (34.7%) | 34 | 17.3 (95% CI 14.5 to 20.6) to 11.2 (95% CI 9.2 to 13.7) (10.3%) | 24.4% | * (P < 0.05) | * (P < 0.05) | ||
| Gayen 2013a,f,g (4 months) | 17 | 3942.32 to 821.88 (79%) | 15 | 4460.7 to 4390.7 (1.6%) | 77.4% | NRh | NR | ||
| DEC | Low or unclear risk | Pani 2002a,d,f (6 months) | 18 | 79.4, post‐treatment NR (81%) | 17 | 81.3, post‐treatment NR (74.7%) | 6.3% | NR | NS (P > 0.05) |
| Dreyer 2006d,f (1 month) | 21 | 55.9 to 12.7 (53.5%) | 23 | 129.5 to 18.8 (67.1%) | −13.6% | NS (P = 0.24) | NS (P = 0.83) | ||
| Rizzo 2007a,d,f (6 months) | 41 | 232.6 to 17.7 (92.4%) [2.36 (95% CI 2.16 to 2.57) to 1.27 (95% CI 0.94 to 1.60)]i | 43 | 182.6 to 10.5 (94.2%) [2.26 (95% CI 2.04 to 2.49) to 1.09 (95% CI 0.74 to 1.43)]i | −1.8% | NR | NS (P > 0.05) | ||
| (6 months) | 126 | 25.4 to 4.46 (82.4%) | 119 | 24.4 to 7.49 (69.3%) | 13.1% | NR | NS (P = 0.21) | ||
| De Britto 2015a,f,j (6 months) | 36 | 2.26 (± 0.57) to 0.15 (± NR) (99.2%) | 35 | 2.22 (± 0.52) to 0.83 (± NR) (96%) | 3.2% | NR | NR | ||
| High risk | Fox 2005a,d,e (6 months) | 41 | 13.4 (95% CI 11.4 to 15.8) to 0.76 (95% CI 0.7 to 0.9) (80.4%) | 39 | 12.9 (95% CI 11.0 to 15.2) to 2.8 (95% CI 2.3 to 3.4) (50.4%) | 30% | * (P = 0.02) | * (P <0.05) | |
| Ivermectin | Low or unclear risk | Dunyo 2000a,b,c,d (6 months) | 62 | 1585 (95% CI 1069 to 2350) to 110 (95% CI 50 to 239) (93.1%) | 55 | 2055 (95% CI 1389 to 3041) to 204 (95% CI 91 to 451) (90.1%) | 3% | NS (P = 0.71) | NR |
| Simonsen 2004a,b,d (6 months) | 105 | 812.6 to 29.8 (96.3%) | 98 | 763.5 to 150 (80.4%) | 15.9% | NRk | NRk | ||
| High risk | Beach 1999a,d,e (4 months) | 24 | 13.7 to 0.3 (98.9%) | 28 | 15.5 to 1.5 (76.1%) | 22.8% | *** (P < 0.001) | * (P < 0.05) | |
Microfilariae (mf) density data and significance testing for differences between groups at baseline and follow‐up, as reported by study authors. We calculated the percentage reduction when this was not reported by the authors (values are italicized), and also the difference between the percentage reductions in the intervention and control groups. We judged the risk of bias as high when studies used analytical methods that could affect the interpretation of the data, and low or unclear risk when there was no obvious analytical issues.
Abbreviations: CI: confidence interval; mf: microfilariae; NR: not reported; NS: not significant; * (P < 0.05): significant; *** (P < 0.001): significant; ±: standard deviation.
aOnly participants positive for mf at baseline.
bMeasured in 100 µL blood using counting chamber, and expressed as mf/mL.
cOnly in those individuals with over 100 mf/mL blood before treatment.
dReported as geometric mean.
eMeasured in 20 µL thick smear.
fMeasured in 1 mL blood by membrane filtration, and expressed as mf/mL.
gReported as arithmetic mean.
hAuthors reported "a significant difference between the control and the treated groups (P < 0.05)" using paired t‐test for analysis; however, this statistical test is inappropriate for comparing different groups.
iData within square brackets [ ] indicates log mean intensity data and CIs provided by authors of Rizzo 2007.
jReported as log mean.
kAuthors reported statistical analysis by paired t‐test and repeated‐measures ANOVA for correlated samples, and use of pairwise contrast tests to examine differences between groups at specific time points; results of pairwise tests for differences between groups do not appear to be reported.
| Background drug | Risk of bias: analysis used | Trial | Intervention (albendazole) | Control | Difference between groups post‐treatment | ||||
| Participants | Baseline to follow‐up (% reduction) | Participants | Baseline to follow‐up (% reduction) | % reduction | Significance testing: % reduction | Significance testing: mf density | |||
| Placebo | Low or unclear risk | Dunyo 2000a,b,c | 71 | 798 to 251 (68.5%) | 66 | 971 to 845 (13%) | 55.5% | NR | NS (P = 0.10) |
| High risk | Gayen 2013a,d,e | 17 | 3942.32 to 432.64 (89%) | 15 | 4460.7 to 4245 (4.8%) | 84.2% | NRf | NR | |
| DEC | Low or unclear risk | Pani 2002a,c,d | 18 | 79.4, post‐treatment NR (95.4%) | 17 | 81.3, post‐treatment NR (89.6%) | 5.8% | NR | NS (P > 0.05) |
| Dreyer 2006c,d | 22 | 55.9 to 6.1 (69.5%) | 25 | 129.5 to 4.8 (85.3%) | −15.8% | NS (P = 0.21) | NS (P = 0.87) | ||
| Rizzo 2007a,c,d | 41 | 232.6 to 5.2 (97.8%) [2.36 (95% CI 2.16 to 2.57) to 0.74 (95% CI 0.44 to 1.03)]g | 43 | 182.6 to 3.6 (98%) [2.26 (95% CI 2.04 to 2.49) to 0.65 (95% CI 0.35 to 0.95)]g | −0.2% | NR | NS (P > 0.05) | ||
| 126 | 25.4 to 3.47 (86.3%) | 119 | 24.4 to 4.27 (82.5%) | 3.8% | NR | NS (P = 0.6) | |||
| De Britto 2015a,d,h | 36 | 2.26 (± 0.57) to 0.07 (± NR) (99.4%) | 35 | 2.22 (± 0.52) to 0.52 (± NR) (98%) | 1.4% | NR | NR | ||
| High risk | Kshirsagar 2004a,d,e | 29 | NR to 249.2 (± 276.1) (NR) | 24 | NR to 245.9 (± 314.8) (NR) | NR | NR | NR | |
| Ivermectin | Low or unclear risk | Dunyo 2000a,b,c | 75 | 614 to 78 (87.3%) | 70 | 640 to 124 (80.6%) | 6.7% | NR | NS (P = 0.80) |
| Simonsen 2004a,b,c | 105 | 812.6 to 59.4 (92.7%) | 98 | 763.5 to 124.9 (83.6%) | 9.1% | NRi | NRi | ||
Microfilariae (mf) density data and significance testing for differences between groups at baseline and follow‐up, as reported by study authors. We calculated the percentage reduction when this was not reported by the authors (values are italicized), and also the difference between the percentage reductions in the intervention and control groups. We judged the risk of bias as high when studies used analytical methods that could affect the interpretation of the data, and low or unclear risk when there was no obvious analytical issues.
Abbreviations: mf: microfilariae; NR: not reported; NS: not significant; ±: standard deviation; CI: confidence interval.
aOnly participants positive for mf at baseline.
bMeasured in 100 µL blood using counting chamber, and expressed as mf/mL.
cReported as geometric mean.
dMeasured in 1 mL blood by membrane filtration, and expressed as mf/mL.
eReported as arithmetic mean.
fAuthors reported "a significant difference between the control and the treated groups (P < 0.05)" using paired t‐test for analysis; however, this statistical test is inappropriate for comparing different groups.
gData within square brackets [ ] indicates log mean intensity data and CIs provided by authors of Rizzo 2007.
hReported as log mean.
iAuthors reported statistical analysis by paired t‐test and repeated‐measures ANOVA for correlated samples, and use of pairwise contrast tests to examine differences between groups at specific time points; results of pairwise tests for differences between groups do not appear to be reported.
Up to six months, there were four studies that gave albendazole alone, and we assessed three of these as being at high risk of bias (Gayen 2013 used the arithmetic mean, Beach 1999 and Fox 2005 excluded increases in mf density post‐treatment). One study (119 participants), assessed as low or unclear risk of bias, suggested an effect on density although this was not evaluated statistically (Dunyo 2000); and the other studies are difficult to interpret, given the risks of bias. When albendazole was used with other drugs, the results were similarly inconsistent or problematic to interpret.
At 12 months, a similar pattern emerged with albendazole alone, where we rated one study at high risk of bias (Gayen 2013 used the arithmetic mean), and an effect on density was suggested in Dunyo 2000, although this was not statistically significant (P = 0.10). When used with other drugs, the results showed little or no effect of albendazole.
Antigenaemia prevalence
Treatment with albendazole had no effect on antigen prevalence at the longest follow‐up (3774 participants, 7 trials; Analysis 1.2).
Antigen density
Five trials reported the effects of albendazole on antigen density. Pani 2002 and De Britto 2015 only enrolled people mf‐positive at baseline; Dunyo 2000, Simonsen 2004, and Fox 2005 recruited infected and uninfected participants, but only reported density in people who were antigen‐positive at baseline; none reported the overall change in antigen density in the total population enrolled.
Overall, albendazole was not associated with greater reductions in antigen density between six and 12 months post‐treatment (1374 participants, 5 trials; Table 5).
| Background drug | Risk of bias: analysis used | Trial (follow‐up) | Intervention (albendazole) | Control | Difference between groups post‐treatment | ||||
| Participants | Baseline to follow‐up (% reduction) | Participants | Baseline to follow‐up (% reduction) | % reduction | Significance testing: % reduction | Significance testing: CFA density | |||
| Placebo | Low or unclear risk | Dunyo 2000a,b (12 months) | 105 | 1370 to 1139 (16.9%) | 103 | 1869 to 2757 (47.5% increase) | 64.4% | NR | NS (P = 0.11) |
| High risk | Fox 2005a,c (6 months) | 89 | 2640 (95% CI 2279 to 3058) to 2428 (95% CI 2071 to 2847) (3.2%) | 74 | 2298 (95% CI 1951 to 2706) to 2479 (95% CI 2105 to 2919) (1.7%) | 1.5% | NS (P > 0.05) | NS (P > 0.05) | |
| DEC | Low or unclear risk | (12 months) | 36 | 3.88 (± 0.48) to 2.89 (± NR) (89.8%) | 35 | 3.58 (± 0.69) to 2.9 (± NR) (79.1%) | 10.7% | NR | NS (P = 0.750) |
| High risk | Fox 2005a,c (6 months) | 85 | 2116 (95% CI 1798 to 2490) to 1350 (95% CI 1176 to 1549) (26.7%) | 79 | 2194 (95% CI 1842 to 2613) to 1597 (95% CI 1375 to 1855) (17%) | 9.7% | NS (P > 0.05) | NS (P > 0.05) | |
| (12 months) | 18 | 0.47 (± 0.18) to 0.08 (± 0.15) (83%) | 17 | 0.39 (± 0.21) to 0.07 (± 0.15) (82.1%) | 0.9% | NR | NR | ||
| Ivermectin | Low or unclear risk | Dunyo 2000a,b (12 months) | 121 | 1404 to 834 (40.6%) | 99 | 1689 to 1187 (29.7%) | 10.9% | NR | NS (P = 0.80) |
| (12 months) | 247 | 1338.4 to 986.6 (26.3%) | 266 | 1026.3 to 931.6 (9.2%) | 17.1% | NRf | NRf | ||
Circulating filarial antigen (CFA) density data and significance testing for differences between groups at baseline and follow‐up, as reported by study authors. We calculated the percentage reduction when this was not reported by the authors (values are italicized), and also the difference between the percentage reductions in the intervention and control groups. We judged the risk of bias as high when studies used analytical methods that could affect the interpretation of the data, and low or unclear risk when there was no obvious analytical issues.
Abbreviations: CFA: circulating filarial antigen; CI: confidence interval; DEC: diethylcarbamazine; mf: microfilariae; NR: not reported; NS: not significant; ±: standard deviation.
aOnly participants positive for CFA at baseline.
bMeasured in fingerprick blood, expressed as CFA unit geometric mean intensity.
cMeasured in fingerprick blood, expressed as geometric mean CFA units/mL.
dVolume of blood not reported, expressed as log mean CFA units.
eMeasured in 50 µL blood, expressed as arithmetic mean CFA optical density value.
fAuthors reported statistical analysis by paired t‐test and repeated‐measures ANOVA for correlated samples, and use of pairwise contrast tests to examine differences between groups at specific time points; results of pairwise tests for differences between groups do not appear to be reported.
Two studies gave albendazole alone; Fox 2005 was assessed at high risk of bias (the authors excluded increases in antigen density post‐treatment) and Dunyo 2000 at low or unclear risk of bias. Dunyo 2000 included 208 participants and suggested a large difference in the antigen density percentage reductions between albendazole and placebo; however, albendazole alone reduced density by 16.9% while the placebo group increased by 47.5%, and the difference was not statistically significant (P = 0.11). The results showed little or no effect of albendazole when used with other drugs.
Adult worm prevalence detected by ultrasound
There was no difference associated with adding albendazole to DEC for reducing adult worm prevalence in men examined for FDS by ultrasonography at the longest follow‐up up to 12 months (165 participants, 3 trials; Analysis 1.3). However, the individual trials were all small and underpowered.
Clinical disease: new and pre‐existing
Treatment with albendazole had no effect on new (535 participants, 1 trial; Analysis 1.4) or existing clinical disease (85 participants, 1 trial; Analysis 1.5); however, the trial was underpowered for clinical outcomes.
Adverse events
Treatment with albendazole had no effect on the number of participants experiencing adverse events (2894 participants, 6 trials; Analysis 1.6).
Sensitivity analysis
In the sensitivity analyses including only trials where the risk of bias for allocation concealment was low, no difference between intervention and control groups in mf prevalence, antigenaemia prevalence, adult worm prevalence detected by ultrasound, or adverse events was evident. We do not present the sensitivity analyses here, as the results did not differ from those in the primary analyses.
Effects stratified by background drug
In the absence of any substantive evidence for an overall effect of albendazole, this became our main finding. However, we provide comparisons of albendazole grouped by background drug, as countries and policy‐makers may want to scrutinize the effectiveness of individual treatment regimens.
Albendazole versus placebo
No trials assessed adult worm prevalence (FDS) using ultrasound.
Mf prevalence
Treatment with albendazole had no effect on mf prevalence at the longest follow‐up (1406 participants, 4 trials; Analysis 2.1).
Treatment with albendazole had no effect on mf prevalence up to six months (Analysis 2.2), or at 12 months (Analysis 2.3), irrespective of baseline infection status.
Mf density
Four trials reported the effects of albendazole on mf density. Gayen 2013 only enrolled people mf‐positive at baseline; Beach 1999, Dunyo 2000, and Fox 2005 recruited mf‐positive and ‐negative participants, but only reported density in people mf‐positive at baseline; none reported the overall change in mf density in the total population enrolled.
Albendazole was associated with greater reductions in mf density up to six months (285 participants, 4 trials; Table 3) and 12 months (169 participants, 2 trials; Table 4).
Up to six months, there were four studies that assessed albendazole against placebo, but the magnitude of the effect of albendazole varied. One study (119 participants) suggested an effect on density (Dunyo 2000), but this was not statistically evaluated. Three studies were at high risk of bias: Beach 1999 and Fox 2005 excluded increases in mf density post‐treatment, and Gayen 2013 used the arithmetic mean; and could not be meaningfully interpreted.
At 12 months, there were two studies that gave albendazole; Dunyo 2000 included 143 participants and reported an effect of albendazole on density but this was not statistically significant (P = 0.10); the results of Gayen 2013 were difficult to interpret, as this study included 33 participants and was at high risk of bias.
Antigenaemia prevalence
Treatment with albendazole had no effect on antigen prevalence at the longest follow‐up (1054 participants, 2 trials; Analysis 2.4).
Treatment with albendazole had no effect on antigen prevalence in people who were infected and uninfected at six months (Analysis 2.5) and 12 months (Analysis 2.6) post‐treatment; and no effect at 12 months follow‐up in participants who were antigenaemic at baseline (Analysis 2.6).
Antigen density
Two trials reported the effects of albendazole on antigen density (Dunyo 2000; Fox 2005). Both trials recruited antigen‐positive and ‐negative participants, but only reported density in people antigen‐positive at baseline; none reported the overall change in antigen density in the total population enrolled.
Albendazole was not associated with significantly greater reductions in antigen density between six and 12 months post‐treatment (371 participants, 2 trials; Table 5).
Dunyo 2000 included 208 participants and density was reduced by 16.9% with albendazole, while density increased by 47.5% with placebo, but the difference was not statistically significant (P = 0.11). Fox 2005 reported no difference with albendazole in a study including 163 participants (P > 0.05), but we judged it to be at high risk of bias (the authors excluded increases in mf density post‐treatment).
Clinical disease: new and pre‐existing
Treatment with albendazole had no effect on new (255 participants, 1 trial; Analysis 2.7: subgroup 1) or existing clinical disease (Analysis 2.7: subgroups 2 and 3); however, Dunyo 2000 was underpowered for clinical outcomes.
Adverse events
Treatment with albendazole had no effect on the number of participants experiencing adverse events (678 participants, 2 trials; Analysis 2.8).
Beach 1999 and Fox 2005 did not provide data in a form that we could use in the meta‐analysis. Beach 1999 reported adverse reactions as generally mild and well tolerated, with no significant difference between participants receiving placebo or albendazole. Fox 2005 reported statistically significant reductions (P < 0.05) in myalgias and cough for albendazole compared with placebo, but no statistically significant differences in headache, fever, or mean treatment impact score.
Beach 1999, Dunyo 2000, and Fox 2005 reported that no localized inflammatory reactions were detected following treatment, and Gayen 2013 did not report this. No serious adverse events were reported in any trials.
Sensitivity analysis
In the sensitivity analyses including only trials where the risk of bias for allocation concealment was low, no difference between albendazole and placebo groups in mf prevalence, antigenaemia prevalence, or adverse events was evident. We do not present the sensitivity analyses here, as the results did not differ from those in the primary analyses.
Albendazole plus DEC versus DEC
No trials assessed new or pre‐existing clinical manifestations post‐treatment.
One cluster‐randomized trial randomized households, and then only reported on people found to be infected and who gave blood at baseline (Wamae 2011). The trial authors reported the mean log density in a graph but a logistic regression analysis was not clear as to who was included, and was complicated by interaction, so further interpretation was not possible (see Description of studies above). The results are in Appendix 2.
Mf prevalence
Adding albendazole to DEC had no effect on mf prevalence at the longest follow‐up (1102 participants, 7 trials; Analysis 3.1).
There was no benefit of adding albendazole to DEC up to six months (Analysis 3.2) or at 12 months post‐treatment (Analysis 3.3), irrespective of baseline infection status. There was moderate to substantial heterogeneity detected up to six months (Analysis 3.2; I2 = 79%) and at 12 months (Analysis 3.3; I2 = 61%) in the microfilaraemic participant subgroups, but subgroup analysis for dose seemed to explain this. There were not enough trials to formally investigate the source of heterogeneity.
There was no difference in mf prevalence at 24 months follow‐up in participants who were all mf‐ or all antigen‐positive at baseline (Analysis 3.4). There was no benefit of adding albendazole to DEC for individuals infected and uninfected at baseline after a single dose or two annual doses; or at 36 months after three annual doses (Analysis 3.5).
Mf density
Seven trials reported the effects of adding albendazole to DEC on mf density. Pani 2002, Rizzo 2007, and De Britto 2015 only enrolled microfilaraemic individuals; Dreyer 2006 only enrolled individuals with FDS irrespective of mf status; and Kshirsagar 2004, Fox 2005, and Bockarie 2007 recruited mf‐positive and ‐negative participants, but only reported density in subsets of individuals enrolled at baseline; none reported the overall change in mf density in the total population enrolled up to 12 months follow‐up.
Overall, albendazole was associated with inconsistent effects on mf density up to six months (559 participants, 6 trials; Table 3), and was not associated with greater reductions in mf density at 12 months (535 participants, 6 trials; Table 4).
Up to six months, there were six studies that compared albendazole added to DEC to DEC alone. Five studies showed little or no effect with albendazole, and one study reported a slightly greater reduction with DEC alone (Dreyer 2006); there was no significant difference (P > 0.05) in the four trials that statistically evaluated this. One study assessed at high risk of bias (Fox 2005 excluded increases in mf density post‐treatment) reported a significant reduction (P = 0.02) with the addition of albendazole, but this is difficult to interpret given the risk of bias.
At 12 months, there were five studies at low or unclear risk of bias that showed no effect of adding albendazole, and Dreyer 2006 reported a slightly greater reduction with DEC alone; there was no statistically significant difference (P > 0.05) in four studies that tested this.
At 24 months, there was no effect of adding albendazole to DEC in two studies after one dose (Pani 2002; Bockarie 2007), and one study after two annual doses (Kshirsagar 2004); reported as not significant in two studies (P > 0.05) (795 participants, 3 trials; Table 6). At 36 months, two very small trials at high risk of bias reported no effect with albendazole after one annual dose (Pani 2002), or three annual doses (Kshirsagar 2004) (57 participants, 2 trials; Table 6).
| Background drug | Risk of bias: Analysis used | Trial (follow‐up) | Intervention (albendazole) | Control | Difference between groups post‐treatment | ||||
| Participants | Baseline to follow‐up (% reduction) | Participants | Baseline to follow‐up (% reduction) | % reduction | Significance testing: % reduction | Significance testing: mf density | |||
| DEC | Low or unclear risk | (24 months)c | 348 | NR to 0.5 (83.7%) | 381 | NR to 0.7 (87.5%) | −3.8% | NR | NS (P = 0.53) |
| High risk | Pani 2002d,e (24 months)c | 18 | 98 (± 57) to 0.52 (± NR) (99.5%) | 17 | 133 (± 157) to 0.94 (± NR) (99.3%) | 0.2% | NR | NS (P > 0.05) | |
| (24 months)f | 16 | NR to 109.5 (± 143.3) (NR) | 15 | NR to 99.5 (± 119.3) (NR) | NR | NR | NR | ||
| Pani 2002d,e (36 months)c | 18 | 98 (± 57) to 0 (100%) | 17 | 133 (± 157) to 0 (100%) | 0% | NR | NR | ||
| (36 months)g | 4 | NR to 57.6 (± 56.0) (NR) | 8 | NR to 60.3 (± 61.5) (NR) | NR | NR | NR | ||
Microfilariae (mf) density (mf/mL) data and significance testing for differences between groups at baseline and follow‐up, as reported by study authors. We calculated the percentage reduction when this was not reported by the authors (values are italicized), and also the difference between the percentage reductions in the intervention and control groups. We judged the risk of bias as high when studies used analytical methods that could affect the interpretation of the data, and low or unclear risk when there was no obvious analytical issues.
Abbreviations: DEC: diethylcarbamazine; mf: microfilariae; NR: not reported; NS: not significant; ±: standard deviation.
aAll evaluable participants irrespective of baseline mf status.
bReported as geometric mean.
cAfter one annual dose albendazole plus DEC and DEC provided.
dOnly participants positive for mf at baseline.
eReported as arithmetic mean.
fAfter two annual doses albendazole plus DEC and DEC provided.
gAfter three annual doses albendazole plus DEC and DEC provided.
Antigenaemia prevalence
There was no effect of adding albendazole to DEC in reducing antigen prevalence at the longest follow‐up (954 participants, 5 trials; Analysis 3.6).
There was no benefit of albendazole plus DEC at six months (Analysis 3.7) or at 12 months (Analysis 3.8) post‐treatment, irrespective of baseline infection status. Treatment with albendazole plus DEC had no additive effect at 24 months follow‐up (Analysis 3.9) after either one annual dose or two annual doses; and no effect at 36 months (Analysis 3.10) after either one annual dose or three annual doses.
Antigen density
Three trials reported the effects of adding albendazole to DEC on antigen density. Pani 2002 and De Britto 2015 only recruited mf‐positive participants; Fox 2005 recruited antigen‐positive and ‐negative participants and reported density in people antigenaemic at baseline, not the overall change in antigen density in the total population enrolled.
Adding albendazole to DEC was not associated with greater reductions in antigen density between six and 12 months (270 participants, 3 trials; Table 5).
One study was at low or unclear risk of bias (De Britto 2015), and two studies were at high risk of bias (Fox 2005 excluded increases in mf density post‐treatment; Pani 2002 used the arithmetic mean). All three studies reported little or no effect of adding albendazole to DEC, reported as not significant (P > 0.05) in two studies that statistically evaluated this.
At 24 and 36 months after a single treatment, one small study at high risk of bias reported density was near pre‐treatment levels in both groups after 24 months (Pani 2002), and at 36 months density had increased in the albendazole plus DEC group but remained at pre‐treatment levels with DEC alone (35 participants, 1 trial; Table 7). At 24 months after a single treatment, Bockarie 2007 reported antigen concentration decreased from high to low in 16 (18.8%) participants with albendazole plus DEC, and 9 (14.7%) participants with DEC alone.
| Background drug | Risk of bias: analysis used | Trial (follow‐up) | Intervention (albendazole) | Control | Difference between groups post‐treatment | ||||
| Participants | Baseline to follow‐up (% reduction) | Participants | Baseline to follow‐up (% reduction) | % reduction | Significance testing: % reduction | Significance testing: CFA density | |||
| DEC | High risk | Pani 2002a,b (24 months) | 18 | 0.5 to 0.48 (4%) | 17 | 0.39 to 0.44 (12.8% increase) | 16.8% | NR | NR |
| Pani 2002a,b (36 months) | 18 | 0.5 to 1.2 (140% increase) | 17 | 0.39 to 0.79 (102.6% increase) | −37.4% | NR | NR | ||
Circulating filarial antigen (CFA) density data and significance testing for differences between groups at baseline and follow‐up, as reported by study authors. Data was reported as the arithmetic mean and presented by the authors in graphs only; we extracted this information using WebPlotDigitizer software. We calculated the percentage reduction after treatment, and the difference between the percentage reductions in the intervention and control groups. We judged the risk of bias as high when studies used analytical methods that could affect the interpretation of the data, and low or unclear risk when there was no obvious analytical issues.
Abbreviations: CFA: circulating filarial antigen; DEC: diethylcarbamazine; mf: microfilariae; NR: not reported.
aOnly participants positive for mf at baseline.
bVolume of blood not reported, expressed as arithmetic mean CFA optical density value.
Adult worm prevalence detected by ultrasound
There was no difference with albendazole plus DEC for reducing adult worm prevalence in men examined for FDS by ultrasound at the longest follow‐up (165 participants, 3 trials; Analysis 3.11). However, the individual trials were all small and underpowered.
There was no benefit of adding albendazole to DEC at six months (Analysis 3.12) or at 12 months (Analysis 3.13) post‐treatment, or at 24 months (Analysis 3.14) after single dose or two annual doses, irrespective of baseline infection status.
Adverse events
Treatment with albendazole plus DEC had no effect on the number of participants experiencing adverse events (1589 participants, 4 trials; Analysis 3.15). Adverse events were systemic in three trials and De Britto 2015 did not provide details.
There was no difference in adverse events that interfered with daily activity when albendazole was added to DEC (Analysis 3.16: subgroup 2). One small trial reported localized inflammatory reactions following treatment, but no difference between treatment groups (Analysis 3.16: subgroup 3). One small trial that enrolled only men with FDS reported intrascrotal nodules (a "sensitive reaction" to antifilarial drugs) at seven days post‐treatment; nodules were detected at the site of 21 (46.7%) adult worm nests with DEC alone compared to 2 (6.1%) with albendazole plus DEC (P = 0.002) (Dreyer 2006).
Bockarie 2007 did not report adverse events, and Fox 2005 did not did not provide data in a form that we could use in meta‐analysis. Fox 2005 reported that adverse reactions were generally mild and well tolerated, with no statistically significant differences in specific symptoms or treatment impact scores between groups. Kshirsagar 2004 also assessed a smaller subset of individuals from the large safety study who were retreated at 12 months and 24 months, but differences between groups were not reported.
No life‐threatening adverse events or adverse events requiring hospitalization were reported in any trials.
Sensitivity analysis
In the sensitivity analyses including only trials where the risk of bias for allocation concealment was low, no difference between albendazole plus DEC and DEC groups in mf prevalence, antigenaemia prevalence, adult worm prevalence by ultrasound, or adverse events was evident. We do not present the sensitivity analyses here, as the results did not differ from those in the primary analyses.
Albendazole plus ivermectin versus ivermectin
No trials assessed adult worm prevalence (FDS) by ultrasound.
Mf prevalence
Treatment with albendazole plus ivermectin had no effect on mf prevalence at the longest follow‐up (2519 participants, 4 trials; Analysis 4.1). There was moderate heterogeneity detected (I2 = 65%) in this analysis, but subgroup analysis for length of follow‐up seemed to explain this. There were not enough trials to formally investigate the source of heterogeneity.
Treatment with albendazole plus ivermectin did not have a statistically significant effect on mf prevalence up to six months (Analysis 4.2) or at 12 months (Analysis 4.3), irrespective of baseline infection status. Moderate to substantial heterogeneity was also detected within the subgroups of microfilaraemic participants (I2 = 75%) and infected and uninfected participants (I2 = 63%) at six months (Analysis 4.2). This also appeared to be explained by length of follow‐up, but could not be formally investigated.
Mf density
Four trials reported the effects of adding albendazole to ivermectin on mf density. Beach 1999, Dunyo 2000, and Simonsen 2004 recruited mf‐positive and mf‐negative participants, but only reported density in people mf‐positive at baseline; none reported the overall change in the population mf density post‐treatment. Dahoma 2000 assessed mf density by density categories and we did not include these data in our analysis.
Adding albendazole to ivermectin was associated with inconsistent reductions in mf density up to six months (372 participants, 3 trials; Table 3), and was not associated with greater reductions at 12 months (348 participants, 2 trials; Table 4).
Up to six months, there were three studies that gave albendazole with ivermectin, and one of these was assessed at high risk of bias (Beach 1999 excluded increases in mf density post‐treatment). Two studies, Dunyo 2000 and Simonsen 2004, which we assessed as at low or unclear risk of bias, reported little or no effect on density with albendazole. Beach 1999 reported a significant effect (P < 0.001) but what this means is unclear, given the risk of bias.
At 12 months, there were two trials at low or unclear risk of bias (Dunyo 2000; Simonsen 2004). There was little or no difference in density with albendazole, reported as not significant (P = 0.80) in one study that statistically tested this.
Antigenaemia prevalence
There was no difference in antigen prevalence at the longest follow‐up up to 12 months (1766 participants, 2 trials; Analysis 4.4).
There was no benefit of adding albendazole to ivermectin at six months (Analysis 4.5) or 12 months post‐treatment (Analysis 4.6), irrespective of baseline infection status.
Antigen density
Two trials reported the effects of adding albendazole to ivermectin on antigen density (Dunyo 2000; Simonsen 2004). Both trials recruited antigen‐positive and ‐negative participants, but only reported density in people antigen‐positive at baseline; none reported the overall change in the population antigen density post‐treatment.
Albendazole was associated with marginal reductions in antigen density at 12 months (733 participants, 2 trials; Table 5).
A slightly greater reduction in density with albendazole was reported in Dunyo 2000 (10.9% difference) and Simonsen 2004 (17.1% difference); the antigen density post‐treatment with albendazole was not significantly different (P > 0.80) in Dunyo 2000.
Clinical disease
At 12 months post‐treatment, adding albendazole to ivermectin had no effect on new (280 participants, 1 trial; Analysis 4.7: subgroup 1) or existing clinical disease (Analysis 4.7: subgroups 2 and 3); however, Dunyo 2000 was underpowered for clinical outcomes.
Adverse events
Treatment with albendazole plus ivermectin had no effect on the number of participants experiencing adverse events (627 participants, 1 trial; Analysis 4.8).
Beach 1999, Dahoma 2000, and Simonsen 2004 did not provide data in a form that we could use in meta‐analysis. Simonsen 2004 did not report the number of participants with adverse events in each group, but reported that all reactions were mild, and no significant relationship between headache or fever and the treatment given (P = 0.42 and P = 0.96). Beach 1999 reported that adverse reactions were generally mild, with no significant differences (P > 0.05) in the frequency or severity of symptoms between groups. Dahoma 2000 reported significant differences in fever (P = 0.045) and dizziness (P = 0.029) with ivermectin alone, and significant differences (P = 0.012) in headaches were reported with the combination treatment.
No serious or severe adverse reactions were reported in any of the trials. No localized inflammatory reactions were observed in Beach 1999 and Dunyo 2000, and Dahoma 2000 and Simonsen 2004 did not report this.
Sensitivity analysis
In the sensitivity analyses including only trials where the risk of bias for allocation concealment was low, no difference between albendazole plus ivermectin and ivermectin groups in mf prevalence, antigenaemia prevalence, or adverse events was evident. We do not present the sensitivity analyses here, as the results did not differ from those in the primary analyses.
Discusión
Resumen de los resultados principales
El albendazol administrado solo o agregado a un fármaco microfilaricida logra poco o ningún cambio en la prevalencia de mf en el plazo de dos semanas a 12 meses después del tratamiento (evidencia de certeza alta), aunque no se conoce si hay un efecto sobre la densidad de mf en el plazo de uno a seis meses (evidencia de certeza muy baja), o a los 12 meses de seguimiento (evidencia de muy baja certeza). Para la prevalencia de antigenemia entre seis a 12 meses, el albendazol solo o en combinación logra poco o ningún cambio (evidencia de certeza alta). Para la densidad de antígenos a los seis a 12 meses, no se sabe si el albendazol tiene un efecto (evidencia de muy baja certeza). Para la prevalencia de nematodos adultos detectados con ecografía a los 12 meses, el albendazol puede lograr poco o ningún cambio (evidencia de certeza baja). El albendazol solo o agregado a un fármaco microfilaricida logra poco o ningún cambio en los eventos adversos (evidencia de certeza alta). Ver "Resumen de resultados", tabla 1.
El albendazol administrado solo logra poco o ningún cambio en la prevalencia de mf cuatro a 12 meses después del tratamiento (evidencia de certeza alta), aunque no se conoce si hay un efecto sobre la densidad de mf después de cuatro a seis meses (evidencia de muy baja certeza), o a los 12 meses de seguimiento (evidencia de muy baja certeza). Para la prevalencia de la antigenemia seis a 12 meses después del tratamiento, el albendazol logra poco o ningún cambio (evidencia de certeza alta). Para la densidad de antígenos a los seis a 12 meses, no se sabe si el albendazol tiene un efecto (evidencia de muy baja certeza). Para la prevalencia de nematodos adultos detectados con ecografía, no se midió el efecto del albendazol. El albendazol probablemente logra poco o ningún cambio en los eventos adversos (evidencia de certeza moderada). Ver "Resumen de resultados", tabla 2.
El albendazol agregado a la DEC probablemente logra poco o ningún cambio en la prevalencia de mf seis a 12 meses después del tratamiento (evidencia de certeza moderada). Para la densidad de mf entre uno a seis meses, no se conoce si hay un efecto (evidencia de muy baja certeza), aunque el albendazol coadministrado con DEC puede lograr poco o ningún cambio en la densidad de mf a los 12 meses (evidencia de certeza baja). Para la prevalencia de la antigenemia entre seis a 12 meses después del tratamiento, el albendazol logra poco o ningún cambio (evidencia de certeza alta). Para la densidad de antígenos a los seis a 12 meses, no se sabe si el albendazol tiene un efecto (evidencia de muy baja certeza). Para la prevalencia de nematodos adultos detectados con ecografía a los 12 meses, el albendazol más DEC puede lograr poco o ningún cambio (evidencia de certeza baja). El albendazol agregado a la DEC logra poco o ningún cambio en los eventos adversos (evidencia de certeza alta). Ver "Resumen de los hallazgos", tabla 3.
El albendazol agregado a la ivermectina probablemente logra poco o ningún cambio en la prevalencia de mf en el plazo de dos semanas a 12 meses después del tratamiento (evidencia de certeza moderada). Para la densidad de mf entre cuatro a seis meses, no se conoce si hay un efecto (evidencia de muy baja certeza), aunque el albendazol coadministrado con ivermectina puede lograr poco o ningún cambio a los 12 meses (evidencia de certeza baja). Para la prevalencia de la antigenemia a los 12 meses, el albendazol logra poco o ningún cambio (evidencia de certeza alta). Para la densidad del antígeno a los 12 meses, el albendazol más combinación de ivermectina puede lograr poco o ningún cambio (evidencia de certeza baja). Para la prevalencia de nematodos adultos detectados con ecografía, no se midió el efecto del albendazol más ivermectina versus ivermectina. El albendazol agregado a la ivermectina probablemente logra poco o ningún cambio en los eventos adversos (evidencia de certeza moderada). Ver "Resumen de los hallazgos", tabla 4.
Compleción y aplicabilidad general de las pruebas
Medidas de posibilidad de transmisión
En pacientes con filariasis linfática y personas de las comunidades donde la filariasis linfática es endémica, el tratamiento con albendazol solo o el albendazol agregado a los fármacos antifiláricos, DEC o ivermectina, tuvo poco o ningún efecto sobre la prevalencia de mf. Todos los ensayos incluidos en la revisión evaluaron la prevalencia de mf, y la evidencia sobre la ausencia de efecto proviene de los ensayos realizados en diversas ubicaciones y contextos, que incluían tanto a adultos como a niños, y que incluían a individuos tanto infectados como no infectados.
Los ensayos usaron un rango de métodos para medir y calcular los cambios en la densidad de mf; la eficacia informada del albendazol administrado solo o en combinación con un fármaco microfilaricida varió desde un efecto a ningún efecto y se observó una mayor inconsistencia hasta seis meses después del tratamiento. Todos los ensayos midieron la densidad de mf, aunque los autores del ensayo presentaron principalmente los resultados de subgrupos pequeños de individuos con microfilaremia al momento del seguimiento, en lugar de todos los individuos asignados al azar. No fue posible evaluar el beneficio de los regímenes de albendazol administrado a las comunidades endémicas.
Ningún ensayo incluido en la revisión evaluó el tratamiento con albendazol dos veces por año, de manera que no fue posible determinar si existe un apoyo a la recomendación de la OMS sobre el albendazol solo dos veces por año para tratar la filariasis linfática en zonas donde la loiasis es endémica (WHO 2012). Otros estudios informaron un beneficio de una dosis o una frecuencia mayor del albendazol para el tratamiento individual y el control en las comunidades, aunque estos ensayos eran ensayos no controlados con placebo (Pion 2015) o no estaban diseñados para evaluar los efectos del albendazol solo (Kar 2015; Tafatatha 2015).
Marcadores de la infección por nematodos adultos
Se cree que el albendazol tiene algunas propiedades macrofilaricidas cuando se administra en dosis altas durante varias semanas (Jayakody 1993). Sin embargo, una única dosis de 400 mg de albendazol (la dosis usada en los programas de AMF), administrado como monoterapia o como un tratamiento combinado, tuvo poco o ningún efecto sobre la prevalencia de nematodos adultos después de seis a 12 meses.
La evidencia de un efecto general del albendazol para reducir la viabilidad de los nematodos adultos estuvo limitada a la comparación de las reducciones de la densidad de antígeno y la interpretación estadística de los autores del ensayo, aunque ningún estudio informó un efecto considerable (p < 0,05) del albendazol solo o cuando se lo agregó a un fármaco microfilaricida. Los ensayos tuvieron una asignación al azar individual y evaluaron principalmente a subgrupos de individuos con antigenemia, por lo que no fue posible evaluar el efecto del albendazol en la densidad del AFC a nivel de la comunidad.
Tres ensayos también evaluaron la prevalencia de nematodos adultos (signo de la danza filárica) mediante ecografía en participantes masculinos tratados con albendazol coadministrado con DEC o DEC sola. La evidencia limitada actual indica que el albendazol puede implicar poco o ningún beneficio adicional sobre la DEC sola. Un ensayo incluido en esta revisión informó que el agregado del albendazol pareció reducir el efecto macrofilaricida de la DEC contra la W. bancrofti (Dreyer 2006). Sin embargo, estos ensayos fueron pequeños por lo que no es posible descartar por completo algún efecto macrofilaricida.
Enfermedad clínica
El efecto del albendazol, solo o agregado a la ivermectina, no fue significativo para la enfermedad clínica. Esto no resulta sorprendente porque el tamaño del efecto para los resultados clínicos fue pequeño, y el único ensayo que lo evaluó no tenía poder estadístico para detectar pequeños beneficios clínicos (Dunyo 2000).
Eventos adversos.
Casi todos los ensayos informaron los eventos adversos y se observó que el tratamiento con albendazol solo o combinado con ivermectina o DEC logró poco cambio en los eventos adversos en los pacientes con filariasis linfática o en los pacientes de las comunidades endémicas. Los eventos adversos fueron por lo general leves y sistémicos. Los eventos adversos locales se informaron en dos ensayos pequeños que comparaban albendazol coadministrado con DEC versus DEC sola (Dreyer 2006; Rizzo 2007). Rizzo 2007 no observó ninguna diferencia entre los grupos, aunque Dreyer 2006 detectó una proporción mayor de "reacciones sensibles" en los hombres del grupo de DEC en comparación con los hombres que recibieron la combinación de albendazol y DEC. No parece haber problemas de seguridad para el albendazol cuando se administra en dosis o en combinaciones farmacológicas recomendadas para los programas de AMF para la filariasis linfática (WHO 2006).
Efectos a largo plazo
Se recomiendan rondas múltiples de tratamiento anual con albendazol y DEC o ivermectina en los programas de eliminación de la filariasis linfática para interrumpir la transmisión de manera sostenible. La evidencia es insuficiente para establecer conclusiones significativas sobre la repercusión a largo plazo del albendazol para la filariasis linfática. La repercusión del albendazol en los resultados a largo plazo (a los 24 o 36 meses después del tratamiento) se evaluó en cuatro ensayos que comparaban albendazol agregado a la DEC con DEC sola.
En un subgrupo pequeño de participantes asignados al azar, Kshirsagar 2004 informó que no hubo ningún efecto del agregado de albendazol para cualquiera de los resultados parasitológicos medidos después de tres rondas anuales de tratamiento. Pani 2002 y Bockarie 2007 mostraron poco o ningún efecto del agregado de albendazol para los resultados parasitológicos a los 24 o 36 meses después de una dosis única de los tratamientos; y Pani 2002; un ensayo muy pequeño, informó un mayor aumento de la densidad de antígeno a los 36 meses después del tratamiento con el tratamiento combinado con albendazol.
Certeza de la evidencia
13 ensayos, incluido un ECA con asignación al azar grupal, con 8713 participantes reunieron los criterios de inclusión. Se evaluó la certeza de la evidencia para los resultados de la prevalencia de mf y la prevalencia de antigenemia como alta para el análisis principal, albendazol solo o agregado a un fármaco microfilaricida. En las comparaciones individuales, la certeza de la evidencia para la prevalencia de mf se consideró alta para el albendazol solo, y moderada para el albendazol agregado a la DEC y el albendazol agregado a la ivermectina. Los otros resultados parasitológicos, la densidad de mf, la densidad de antígeno y la prevalencia de nematodos adultos detectada con ecografía, tuvieron evidencia de certeza baja o muy baja de un efecto del albendazol.
Todos los ensayos se describieron como aleatorios, aunque tenían limitaciones importantes. La mayoría de los estudios incluidos se diseñaron principalmente para evaluar la efectividad del albendazol para el tratamiento individual, y ninguno consideró explícitamente los efectos sobre la transmisión en las comunidades. Los números de participantes perdidos o excluidos del seguimiento fueron también muy altos (por encima de un 20%) en casi la mitad de los ensayos, lo cual podría dar lugar a desequilibrios en los grupos de comparación. Sin embargo, los casos perdidos por lo general fueron equivalentes entre los grupos de tratamiento dentro de los ensayos.
Las diferencias en el diseño (participantes con pruebas positivas para mf solo versus participantes con pruebas positivas y negativas para mf, medición e informe variable del resultado y duración del seguimiento) dificultaron la comparación de los ensayos. La mayoría de los ensayos informaron resultados principalmente para los que presentaban pruebas positivas para mf o pruebas positivas para el antígeno al inicio. El análisis selectivo de los subgrupos de participantes asignados al azar puede influir en las conclusiones del estudio, y dar lugar a una sobrestimación o a una dilución de los efectos potenciales del tratamiento.
Para los datos de densidad de parásitos, la diferencia en la medida de resumen de resultado informada (es decir media geométrica, media aritmética, media del logaritmo), los métodos de análisis usados, y la falta de informe de las DE o los IC en la mayoría de los ensayos hizo imposible incluir estos resultados en un metanálisis. Los estudios deben informar las medidas de la varianza o los IC para que la cantidad de incertidumbre en la estimación puntual sea clara. Los métodos analíticos usados por algunos ensayos se consideraron en alto riesgo de sesgo debido al método usado para calcular el cambio desde el inicio (Beach 1999; Fox 2005), o el uso de la media aritmética como el cálculo promedio. Para los estudios que no informaron ninguna transformación en la escala del logaritmo para la asimetría en los datos, el uso de la media aritmética para medir los datos asimétricos no es apropiado. Las pruebas de significación estadística tampoco fueron siempre realizadas o informadas. Por estas razones, la certeza de la evidencia se disminuyó para los resultados de densidad en dos niveles debido a la imprecisión; en uno debido al riesgo de sesgo cuando se incluyeron los datos de Beach 1999 o Fox 2005; y en uno cuando también hubo inconsistencia en los ensayos.
Sesgos potenciales en el proceso de revisión
Errores estadísticos en el análisis
Se incluyó un ECA con asignación al azar grupal en la revisión (Wamae 2011), aunque los autores del ensayo no tomaron en cuenta de forma adecuada la asignación al azar grupal. Los análisis para los resultados primarios y secundarios no se ajustaron para el agrupamiento, y los autores del ensayo informaron los resultados de los subgrupos de los individuos con microfilaremia y antigenemia. Lo anterior podría repercutir en la interpretación del ensayo, y no se utilizaron estos datos en los análisis. Sin embargo, se informaron todos los resultados relevantes no incluidos en los análisis en el Apéndice 2.
Resultados de densidad de parásitos
Debido al informe deficiente de los resultados de la densidad de parásitos no fue posible combinar los ensayos en un metanálisis. Se intentó establecer contacto con varios autores del ensayo para aclarar los métodos o solicitar los IC para los datos (Beach 1999; Simonsen 2004; Fox 2005; Dreyer 2006; Bockarie 2007; Rizzo 2007; De Britto 2015). Se recibió respuesta de Dreyer 2006 y Rizzo 2007, y se están esperando datos de Beach 1999. No se pudo hallar una dirección de correo electrónico activa para Simonsen 2004.
Por lo tanto, se analizaron los datos de densidad al comparar la diferencia en la reducción de porcentaje entre los grupos de intervención y de control, otorgando una menor ponderación a los ensayos que informaban la media (debido a que la misma no representa los datos potencialmente asimétricos). También se consideraron los resultados de los análisis estadísticos informados por los autores. Este procedimiento podría introducir sesgo, debido a que los autores evaluaron a subgrupos de los individuos totales asignados al azar y calcularon la media geométrica y la reducción de porcentaje en la media geométrica mediante diferentes métodos. Las pruebas de significación estadística tampoco fueron siempre realizadas o informadas. Sin embargo, la evidencia se consideró de certeza baja a muy baja.
Análisis de subgrupos
Muchos de los ensayos incluidos tenían varios intervalos de seguimiento diferentes e informaron sobre los subgrupos de participantes para los resultados. Se analizó el seguimiento más largo hasta los 12 meses de cada ensayo, y se utilizó el número asignado al azar como denominador, cuando fue posible. Este hecho dio lugar a la combinación de los ensayos que analizaban a individuos con microfilaremia o que presentaban pruebas positivas para los nematodos adultos con ensayos que analizaban a los individuos infectados y no infectados. Se consideró que lo anterior no influiría en los hallazgos de la revisión.
Se detectó heterogeneidad moderada al comparar albendazol más ivermectina con ivermectina sola para la prevalencia de mf, aunque la misma pareció ser explicada por los períodos de seguimiento del ensayo, que variaron desde dos semanas a 12 meses.
También se realizaron metanálisis adicionales para evaluar diferentes períodos de seguimiento (hasta seis y a los 12; 24 y 36 meses), y se estratificaron los análisis de acuerdo al estado de infección inicial de los participantes para descartar cualquier efecto potencial dependiente del tiempo u otros efectos específicos del albendazol. La cantidad de participantes en los análisis de subgrupos fue por lo general pequeña, aunque los resultados de estos metanálisis adicionales estuvieron muy de acuerdo con los análisis primarios que evaluaban los datos de seguimiento a más largo plazo.
Acuerdos y desacuerdos con otros estudios o revisiones
Los resultados de la revisión están de acuerdo con los resultados de una revisión bibliográfica publicada en 2005; Tisch 2005; que realizó una evaluación sistemática de los datos de los ensayos farmacológicos públicamente disponibles para determinar las estimaciones del efecto del fármaco contra las mf de W bancrofti en los individuos y las poblaciones. Tisch 2005 estableció la conclusión de que la administración de albendazol con un fármaco microfilaricida no parece aumentar la efectividad de un único fármaco microfilaricida, y los autores también recalcaron la necesidad de investigación adicional y un informe más claro de los ensayos. Sin embargo, los métodos de esta revisión bibliográfica fueron diferentes de la revisión Cochrane: no era una revisión sistemática realizada según protocolo; el cálculo del efecto y la precisión alrededor del cálculo del efecto para los resultados no se determinaron con metanálisis; y la calidad del estudio no se evaluó para los estudios incluidos.
Los resultados de la revisión están en conflicto con los documentos originales que dieron lugar a la introducción del albendazol a los programas de control filárico, incluida una conferencia de la OMS sobre los resultados de investigación sobre el albendazol en la filariasis linfática (WHO 1998) y una revisión narrativa (Ottesen 1999). La revisión narrativa realizada por la OMS estableció la conclusión de que "las combinaciones de dosis única de dos fármacos de albendazol más ivermectina o DEC son superiores en eficacia al tratamiento con un único fármaco para disminuir la microfilaremia en la filariasis linfática" y que el "Albendazol solo tiene una actividad de eliminación o esterilización en las filarias adultas linfáticas" (WHO 1998).
Una revisión y metanálisis de las opiniones de expertos para Gyapong 2005 favoreció los regímenes de dos fármacos sobre los fármacos microfilaricidas únicos para tratar y prevenir la filariasis linfática. Sus análisis son diferentes de estos análisis de varias maneras: no era una revisión sistemática realizada según protocolo; los autores incluyeron bibliografía científica complementada con informes y estudios y no evaluaron la calidad de los estudios; los autores sólo incluyeron estudios en los que los participantes presentaban microfilaremia; la significación estadística también puede haberse exagerado en algunos análisis, debido a que los datos de varios estudios se incorporaron dos veces (al contar los resultados a los seis y 12 meses y combinarlos en el mismo metanálisis), lo cual reduce artificialmente los IC del 95%.
Una revisión bibliográfica narrativa de Olsen 2007 presentó evidencia informada por los estudios individuales, y estableció la conclusión: "Los resultados con ALB agregado a un tratamiento de único fármaco con IVM o DEC contra la filariasis linfática fueron no concluyentes, aunque la DEC y la IVM en combinación parecieron ser superiores a la DEC o a la IVM sola”. Los análisis son diferentes de los presentados en esta revisión con respecto a los siguientes aspectos: no era una revisión sistemática realizada según protocolo; era un resumen narrativo de los estudios en lugar de un metanálisis de los datos; y la calidad del estudio no se evaluó para los estudios incluidos.

Study flow diagram.

‘Risk of bias' summary: review authors' judgements about each risk of bias item for each included study.
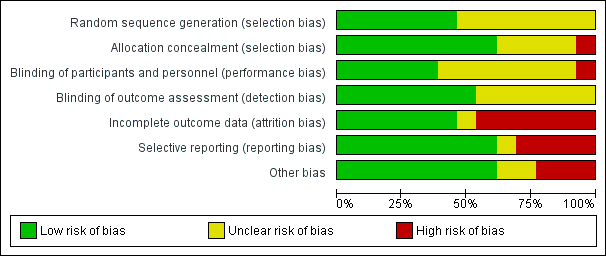
‘Risk of bias' graph: review authors' judgements about each risk of bias item presented as percentages across all included studies.

Comparison 1 Albendazole alone or added to a microfilaricidal drug, Outcome 1 Microfilaraemia (mf) prevalence: longest follow‐up (up to 12 months).
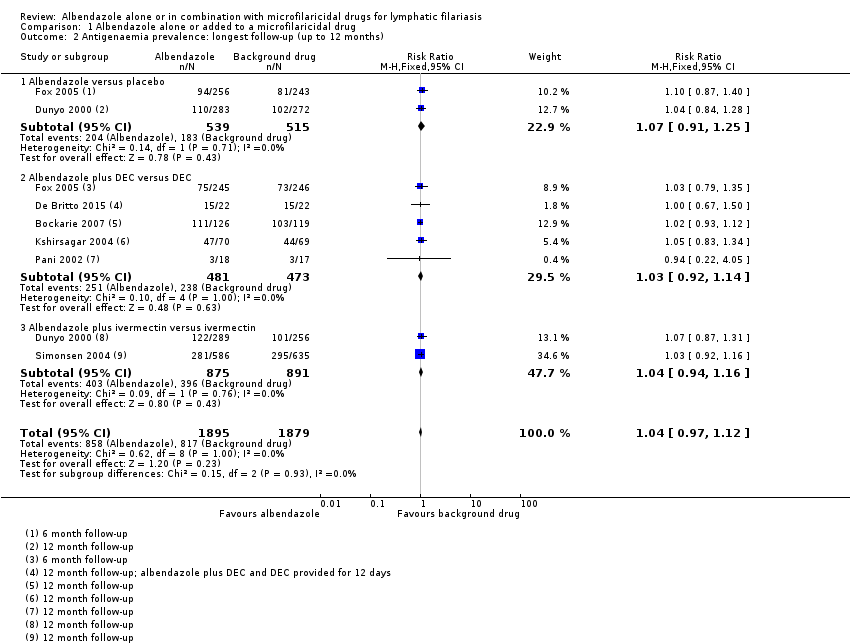
Comparison 1 Albendazole alone or added to a microfilaricidal drug, Outcome 2 Antigenaemia prevalence: longest follow‐up (up to 12 months).

Comparison 1 Albendazole alone or added to a microfilaricidal drug, Outcome 3 Adult worm prevalence by ultrasound: longest follow‐up (up to 12 months).

Comparison 1 Albendazole alone or added to a microfilaricidal drug, Outcome 4 New clinical disease (new cases hydrocoele).
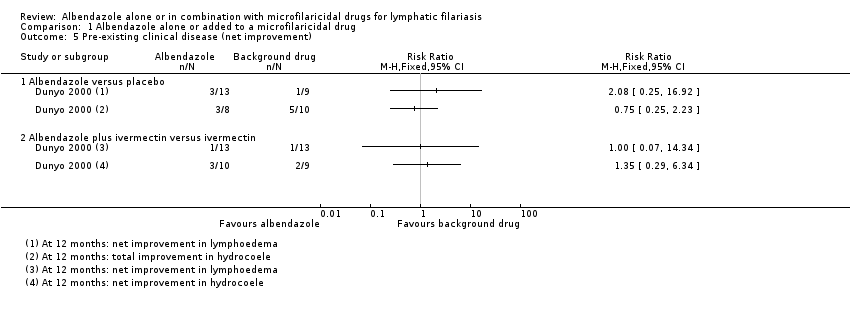
Comparison 1 Albendazole alone or added to a microfilaricidal drug, Outcome 5 Pre‐existing clinical disease (net improvement).

Comparison 1 Albendazole alone or added to a microfilaricidal drug, Outcome 6 Adverse events.
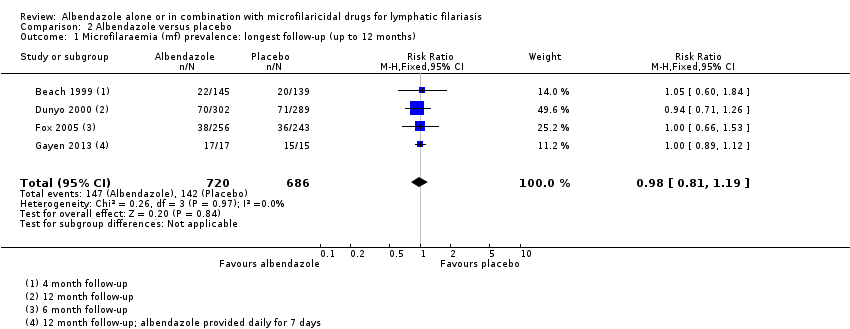
Comparison 2 Albendazole versus placebo, Outcome 1 Microfilaraemia (mf) prevalence: longest follow‐up (up to 12 months).
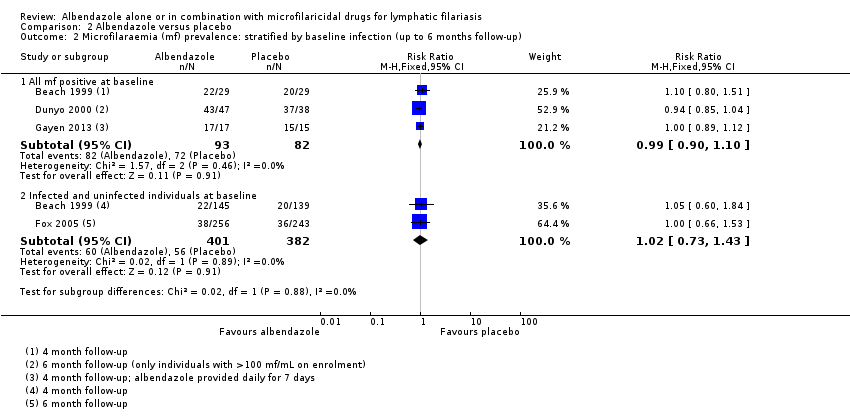
Comparison 2 Albendazole versus placebo, Outcome 2 Microfilaraemia (mf) prevalence: stratified by baseline infection (up to 6 months follow‐up).

Comparison 2 Albendazole versus placebo, Outcome 3 Microfilaraemia (mf) prevalence: stratified by baseline infection (12 months follow‐up).

Comparison 2 Albendazole versus placebo, Outcome 4 Antigenaemia prevalence: longest follow‐up (up to 12 months).

Comparison 2 Albendazole versus placebo, Outcome 5 Antigenaemia prevalence: stratified by baseline infection (6 months follow‐up).

Comparison 2 Albendazole versus placebo, Outcome 6 Antigenaemia prevalence: stratified by baseline infection (12 months follow‐up).

Comparison 2 Albendazole versus placebo, Outcome 7 Clinical disease.
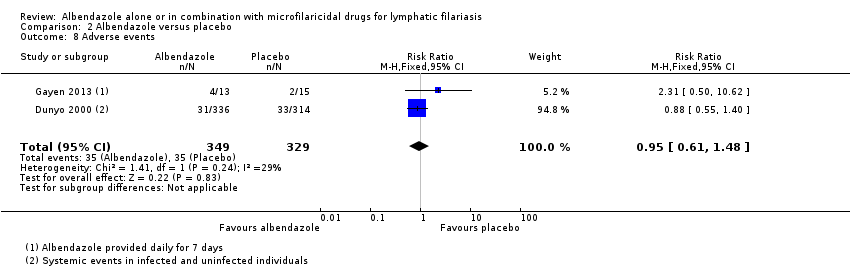
Comparison 2 Albendazole versus placebo, Outcome 8 Adverse events.
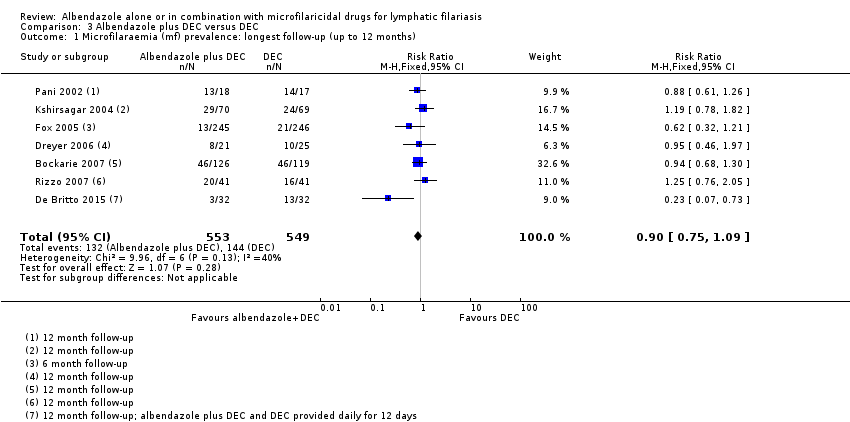
Comparison 3 Albendazole plus DEC versus DEC, Outcome 1 Microfilaraemia (mf) prevalence: longest follow‐up (up to 12 months).
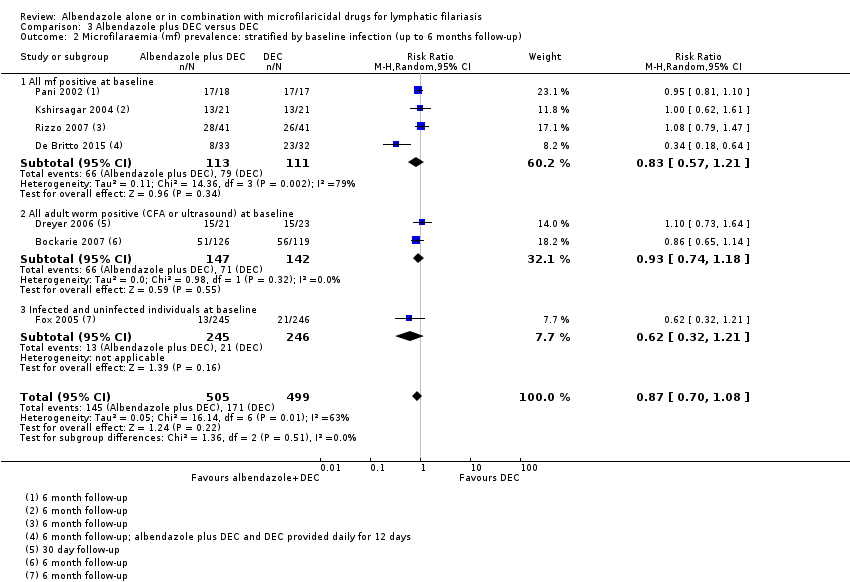
Comparison 3 Albendazole plus DEC versus DEC, Outcome 2 Microfilaraemia (mf) prevalence: stratified by baseline infection (up to 6 months follow‐up).

Comparison 3 Albendazole plus DEC versus DEC, Outcome 3 Microfilaraemia (mf) prevalence: stratified by baseline infection (12 months follow‐up).

Comparison 3 Albendazole plus DEC versus DEC, Outcome 4 Microfilaraemia (mf) prevalence: stratified by baseline infection (24 months follow‐up).

Comparison 3 Albendazole plus DEC versus DEC, Outcome 5 Microfilaraemia (mf) prevalence: stratified by baseline infection (36 months follow‐up).

Comparison 3 Albendazole plus DEC versus DEC, Outcome 6 Antigenaemia prevalence: longest follow‐up (up to 12 months).
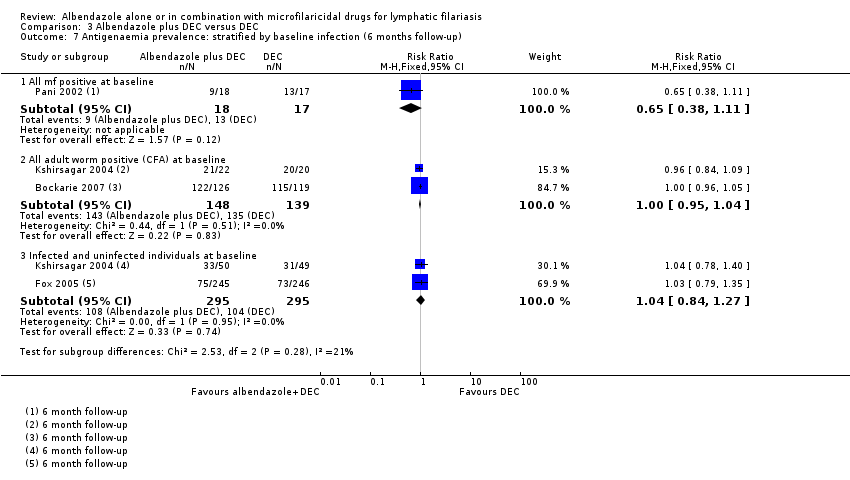
Comparison 3 Albendazole plus DEC versus DEC, Outcome 7 Antigenaemia prevalence: stratified by baseline infection (6 months follow‐up).
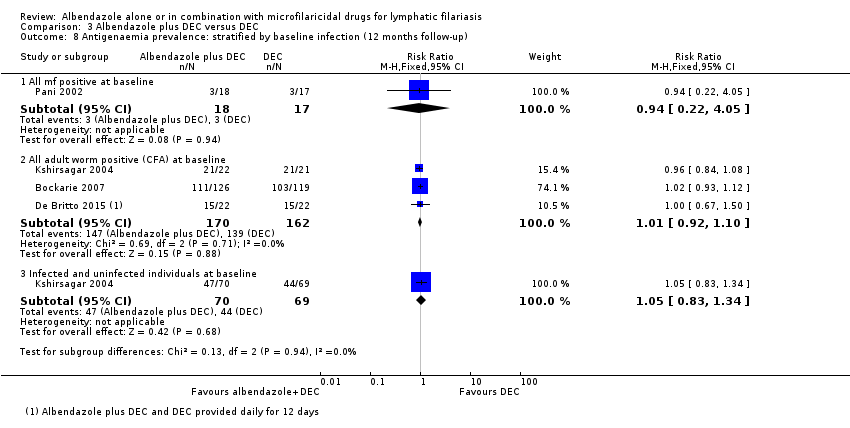
Comparison 3 Albendazole plus DEC versus DEC, Outcome 8 Antigenaemia prevalence: stratified by baseline infection (12 months follow‐up).
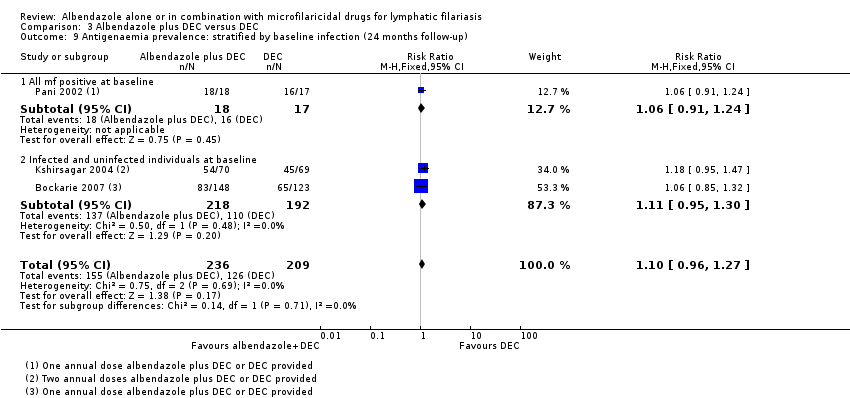
Comparison 3 Albendazole plus DEC versus DEC, Outcome 9 Antigenaemia prevalence: stratified by baseline infection (24 months follow‐up).

Comparison 3 Albendazole plus DEC versus DEC, Outcome 10 Antigenaemia prevalence: stratified by baseline infection (36 months follow‐up).

Comparison 3 Albendazole plus DEC versus DEC, Outcome 11 Adult worm prevalence by ultrasound: longest follow‐up (up to 12 months).
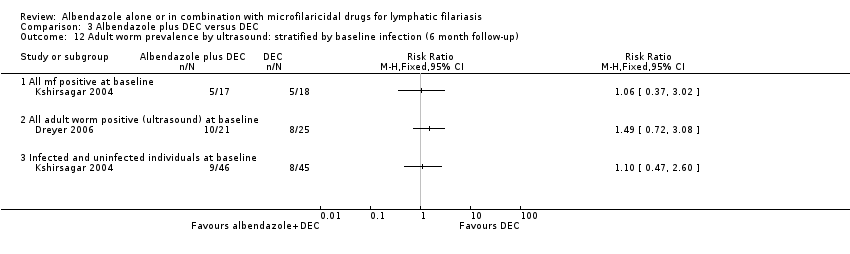
Comparison 3 Albendazole plus DEC versus DEC, Outcome 12 Adult worm prevalence by ultrasound: stratified by baseline infection (6 month follow‐up).

Comparison 3 Albendazole plus DEC versus DEC, Outcome 13 Adult worm prevalence by ultrasound: stratified by baseline infection (12 month follow‐up).
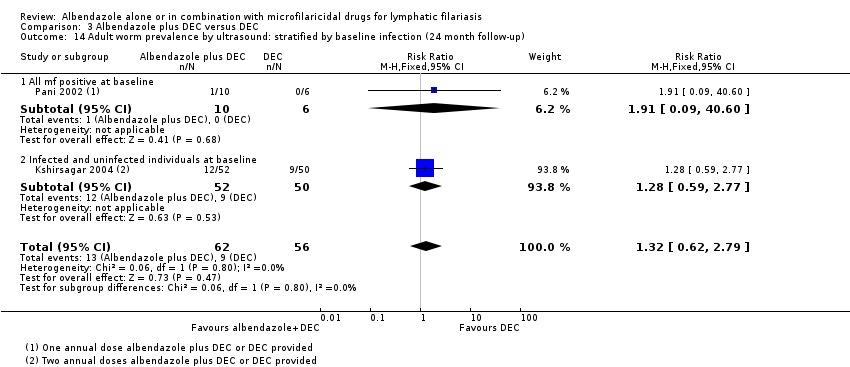
Comparison 3 Albendazole plus DEC versus DEC, Outcome 14 Adult worm prevalence by ultrasound: stratified by baseline infection (24 month follow‐up).

Comparison 3 Albendazole plus DEC versus DEC, Outcome 15 Adverse events.
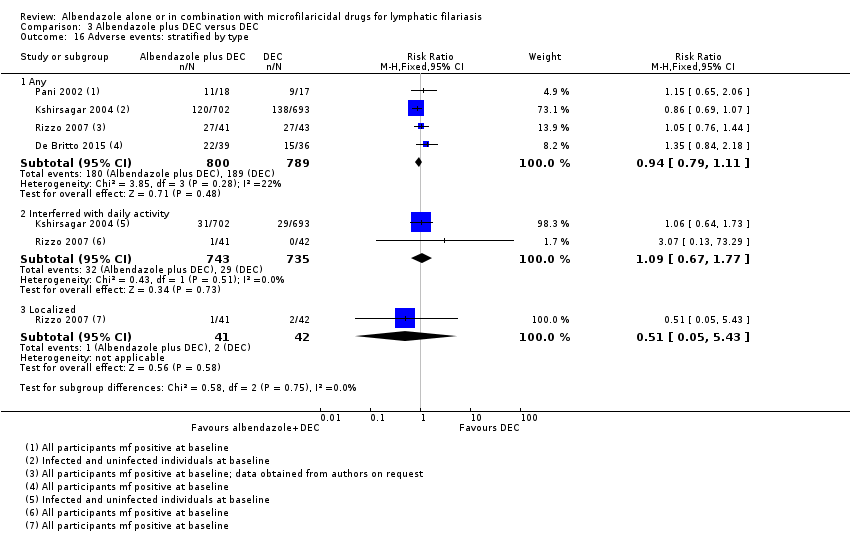
Comparison 3 Albendazole plus DEC versus DEC, Outcome 16 Adverse events: stratified by type.
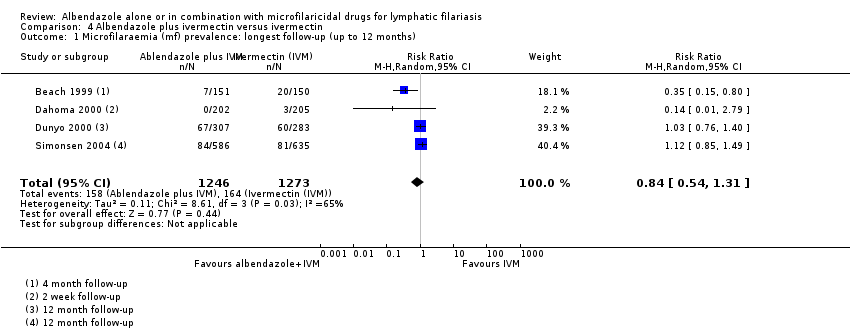
Comparison 4 Albendazole plus ivermectin versus ivermectin, Outcome 1 Microfilaraemia (mf) prevalence: longest follow‐up (up to 12 months).

Comparison 4 Albendazole plus ivermectin versus ivermectin, Outcome 2 Microfilaraemia (mf) prevalence: stratified by baseline infection (up to 6 months follow‐up).

Comparison 4 Albendazole plus ivermectin versus ivermectin, Outcome 3 Microfilaraemia (mf) prevalence: stratified by baseline infection (12 months follow‐up).
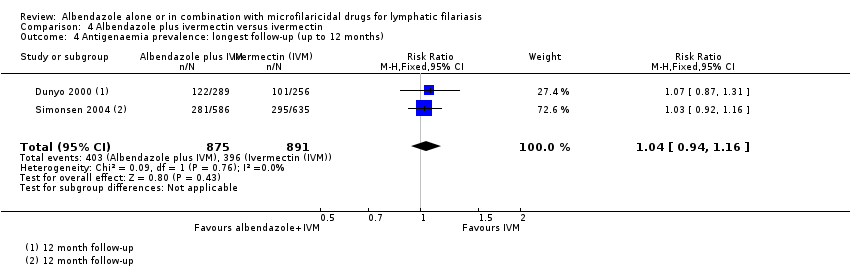
Comparison 4 Albendazole plus ivermectin versus ivermectin, Outcome 4 Antigenaemia prevalence: longest follow‐up (up to 12 months).

Comparison 4 Albendazole plus ivermectin versus ivermectin, Outcome 5 Antigenaemia prevalence: stratified by baseline infection (6 months follow‐up).

Comparison 4 Albendazole plus ivermectin versus ivermectin, Outcome 6 Antigenaemia prevalence: stratified by baseline infection (12 months follow‐up).

Comparison 4 Albendazole plus ivermectin versus ivermectin, Outcome 7 Clinical disease.

Comparison 4 Albendazole plus ivermectin versus ivermectin, Outcome 8 Adverse events.
| Albendazole alone or added to a microfilaricidal drug for lymphatic filariasis | ||||||
| Patient or population: people with lymphatic filariasis or communities where lymphatic filariasis is endemic Intervention: albendazole alone or in combination with a microfilaricidal drug | ||||||
| Outcomes | Anticipated absolute effects* (95% CI) | Relative effect | Number of participants | Certainty of the evidence | Comments | |
| Risk with no treatment or a single microfilaricidal drug | Risk with albendazole alone or in combination with a microfilaricidal drug | |||||
| Microfilaraemia (mf) prevalence | 179 per 1000 | 174 per 1000 | RR 0.95 | 5027 | ⊕⊕⊕⊕ | Albendazole makes little or no difference to mf prevalence. |
| Mf density | In the included studies the effects of treatment with albendazole varied. The difference between treatment groups ranged from a 81.7% greater reduction with albendazole to 13.6% greater reduction with a single microfilaricidal drug.a | ‐ | 1216 | ⊕⊝⊝⊝ Due to risk of bias, inconsistency, and imprecision | We do not know if albendazole has an effect on mf density. | |
| Mf density | In the included studies the effects of treatment with albendazole varied. The difference between treatment groups ranged from a 55.5% greater reduction with albendazole to a 15.8% greater reduction with a single microfilaricidal drug.e | ‐ | 1052 | ⊕⊝⊝⊝ Due to inconsistency and imprecision | We do not know if albendazole has an effect on mf density. | |
| Antigenaemia prevalence | 435 per 1000 | 452 per 1000 | RR 1.04 | 3774 | ⊕⊕⊕⊕ | Albendazole makes little or no difference to antigenaemia prevalence. |
| Antigen density | In the included studies treatment with albendazole had little or no effect on antigen density. There was a 1.5% to 17.1% greater reduction with albendazole in all studies except one; this study reported a 64.4% greater reduction in antigen density due to a small reduction with albendazole (16.9%) but a large increase in the placebo group.h | ‐ | 1374 | ⊕⊝⊝⊝ Due to risk of bias and imprecision | We do not know if albendazole has an effect on antigen density. | |
| Adult worm prevalence detected by ultrasound | 268 per 1000 | 311 per 1000 | RR 1.16 | 165 | ⊕⊕⊝⊝ Due to indirectness and imprecision | Albendazole may make little or no difference to adult worm prevalence detected by ultrasound. |
| Adverse events | 184 per 1000 | 178 per 1000 | RR 0.97 | 2894 | ⊕⊕⊕⊕ | Albendazole makes little or no difference to adverse events. |
| *The risk in the intervention group (and its 95% CI) is based on the assumed risk in the comparison group and the relative effect of the intervention (and its 95% CI). | ||||||
| GRADE Working Group grades of evidence | ||||||
| aEight studies reported geometric means, one study reported log mean, and one study reported the arithmetic mean. An effect of albendazole (P < 0.05) on the geometric mean mf density was reported in three analyses in two studies. No effect of albendazole (P > 0.05) was reported in six studies that used the geometric mean. | ||||||
| Albendazole alone for lymphatic filariasis | ||||||
| Patient or population: people with lymphatic filariasis or communities where lymphatic filariasis is endemic | ||||||
| Outcomes | Anticipated absolute effects* (95% CI) | Relative effect | Number of participants | Certainty of the evidence | Comments | |
| Risk with placebo | Risk with albendazole | |||||
| Microfilaraemia (mf) prevalence | 207 per 1000 | 203 per 1000 | RR 0.98 | 1406 | ⊕⊕⊕⊕ | Albendazole makes little or no difference to mf prevalence. |
| Mf density | Trend favoured albendazole to a variable extent. Albendazole reduced the geometric mean mf density by 28.7% to 61.1%. Placebo reduced the geometric mean mf density up to 17.2%, but the density also increased by 20.6%.c | ‐ | 285 | ⊕⊝⊝⊝ Due to risk of bias, inconsistency, and imprecision | We do not know if albendazole has an effect on mf density. | |
| Mf density | No trend. In one study that reported the geometric mean, albendazole reduced mf density by 68.5% and in the placebo group the reduction was 13%; however, the authors reported no significant difference with albendazole (P > 0.05).g | ‐ | 169 | ⊕⊝⊝⊝ Due to inconsistency and imprecision | We do not know if albendazole has an effect on mf density. | |
| Antigenaemia prevalence | 355 per 1000 | 380 per 1000 | RR 1.07 | 1054 | ⊕⊕⊕⊕ | Albendazole makes little or no difference to antigenaemia prevalence. |
| Antigen density | Trend showed little or no effect of albendazole. Albendazole reduced the geometric mean antigen density by 3.2% to 16.9%, and the placebo group antigen density was reduced by 1.7% and also increased by 47.5%.j | ‐ | 371 | ⊕⊝⊝⊝ Due to risk of bias and imprecision | We do not know if albendazole has an effect on antigen density. | |
| Adult worm prevalence detected by ultrasound ‐ not measured | ‐ | ‐ | ‐ | ‐ | ‐ | Adult worm prevalence detected by ultrasound was not measured for this comparison. |
| Adverse events | 106 per 1000 | 101 per 1000 | RR 0.95 | 678 | ⊕⊕⊕⊝ Due to imprecision | Albendazole probably makes little or no difference to adverse events. |
| *The risk in the intervention group (and its 95% CI) is based on the assumed risk in the comparison group and the relative effect of the intervention (and its 95% CI). | ||||||
| GRADE Working Group grades of evidence | ||||||
| aNot downgraded for risk of bias: most information is from studies at low or unclear risk of bias. Three studies had unclear or high risk of bias for attrition, but numbers of participants followed up were comparable between groups in each study. We judged plausible bias unlikely to seriously alter the results. | ||||||
| Albendazole added to DEC for lymphatic filariasis | ||||||
| Patient or population: people with lymphatic filariasis or communities where lymphatic filariasis is endemic | ||||||
| Outcomes | Anticipated absolute effects* (95% CI) | Relative effect | Number of participants | Certainty of the evidence | Comments | |
| Risk with DEC | Risk with albendazole plus DEC | |||||
| Microfilaraemia (mf) prevalence | 262 per 1000 | 236 per 1000 | RR 0.90 | 1102 | ⊕⊕⊕⊝ Due to imprecision | Albendazole probably makes little or no difference to mf prevalence. |
| Mf density | No trend. The difference between the albendazole plus DEC and the DEC groups percentage reductions from baseline ranged from a 30% greater reduction with albendazole plus DEC to a 13.6% greater reduction with DEC alone.c | ‐ | 559 | ⊕⊝⊝⊝ Due to risk of bias, inconsistency, and imprecision | We do not know if albendazole has an effect on mf density. | |
| Mf density | Trend showed little or no effect of albendazole. The difference between the albendazole plus DEC and the DEC groups percentage reductions from baseline ranged from a 5.6% greater reduction with albendazole plus DEC to a 15.8% greater reduction with DEC alone.g | ‐ | 535 | ⊕⊕⊝⊝ Due to imprecision | Albendazole may make little or no difference to mf density. | |
| Antigenaemia prevalence | 503 per 1000 | 518 per 1000 | RR 1.03 | 954 | ⊕⊕⊕⊕ | Albendazole makes little or no difference to antigenaemia prevalence. |
| Antigen density | Trend showed little or no effect of albendazole. The difference between the albendazole plus DEC and the DEC groups percentage reductions from baseline ranged from a 9.7% greater reduction in the geometric mean to a 10.7% greater reduction in the log mean with albendazole plus DEC.k | ‐ | 270 | ⊕⊝⊝⊝ Due to risk of bias and imprecision | We do not know if albendazole has an effect on antigen density. | |
| Adult worm prevalence detected by ultrasound | 268 per 1000 | 311 per 1000 | RR 1.16 | 165 | ⊕⊕⊝⊝ Due to indirectness and imprecision | Albendazole may make little or no difference to adult worm prevalence detected by ultrasound. |
| Adverse events | 240 per 1000 | 225 per 1000 | RR 0.94 | 1589 | ⊕⊕⊕⊕ | Albendazole makes little or no difference to adverse events. |
| *The risk in the intervention group (and its 95% CI) is based on the assumed risk in the comparison group and the relative effect of the intervention (and its 95% CI). | ||||||
| GRADE Working Group grades of evidence | ||||||
| aNot downgraded for inconsistency: I2 of 40% was explained through subgroup analysis. The heterogeneity was a result of one study which used a more intensive treatment regimen (daily dose for 12 days) compared to the other six studies (single dose). We therefore judged inconsistency does not seem to be a serious issue. | ||||||
| Albendazole added to ivermectin for lymphatic filariasis | ||||||
| Patient or population: people with lymphatic filariasis or communities where lymphatic filariasis is endemic | ||||||
| Outcomes | Anticipated absolute effects* (95% CI) | Relative effect | Number of participants | Certainty of the evidence | Comments | |
| Risk with ivermectin | Risk with albendazole plus ivermectin | |||||
| Microfilaraemia (mf) prevalence | 129 per 1000 | 108 per 1000 | RR 0.84 | 2519 | ⊕⊕⊕⊝ Due to imprecision | Albendazole probably makes little or no difference to mf prevalence. |
| Mf density | No trend. The difference between the albendazole plus ivermectin and the ivermectin groups percentage reductions from baseline ranged from a 3% to 22.8% greater reduction with albendazole plus ivermectin.d | ‐ | 372 | ⊕⊝⊝⊝ Due to risk of bias, inconsistency, and imprecision | We do not know if albendazole has an effect on mf density. | |
| Mf density | Trend showed little or no effect of albendazole. The difference between the albendazole plus ivermectin and the ivermectin groups percentage reductions from baseline ranged from a 6.7% to 9.1% greater reduction with albendazole plus ivermectin.h | ‐ | 348 | ⊕⊕⊝⊝ Due to imprecision | Albendazole may make little or no difference to mf density. | |
| Antigenaemia prevalence | 444 per 1000 | 462 per 1000 | RR 1.04 | 1766 | ⊕⊕⊕⊕ | Albendazole makes little or no difference to antigenaemia prevalence. |
| Antigen density | Trend showed little or no effect of albendazole. The difference between the albendazole plus ivermectin and the ivermectin groups percentage reductions from baseline ranged from a 10.9% to 17.1% greater reduction with albendazole plus ivermectin.h | ‐ | 733 | ⊕⊕⊝⊝ Due to imprecision | Albendazole may make little or no difference to antigen density. | |
| Adult worm prevalence detected by ultrasound ‐ not measured | ‐ | ‐ | ‐ | ‐ | ‐ | Adult prevalence detected by ultrasound was not measured for this comparison. |
| Adverse events | 122 per 1000 | 142 per 1000 | RR 1.16 | 627 | ⊕⊕⊕⊝ Due to imprecision | Albendazole probably makes little or no difference to adverse events. |
| *The risk in the intervention group (and its 95% CI) is based on the assumed risk in the comparison group and the relative effect of the intervention (and its 95% CI). | ||||||
| GRADE Working Group grades of evidence | ||||||
| aNot downgraded for risk of bias: most information is from studies at low or unclear risk of bias. Two studies had high risk and one had unclear risk of bias for attrition, but the number of participants followed up were comparable between groups in most of the studies. We judged plausible bias unlikely to seriously alter the results. | ||||||
| Endemic for | Drug recommendation | |||||
| Lymphatic filariasis | Onchocerciasis | Loiasis | Albendazole | Ivermectin | Diethylcarbamazine | Regimen |
| + | + | +a | Yes | No | No | Twice per yearb,c |
| + | + | ‐ | Yes | Yes | No | Annualb |
| + | ‐ | +a | Yes | No | No | Twice per yearb,c |
| ‐ | + | + | No | Yes | No | Annualc |
| +d | ‐ | ‐ | Yes | No | Yes | Annualb |
| ‐ | + | ‐ | No | Yes | No | Annual |
| ‐ | ‐ | + | No | No | No | ‐ |
| aIn areas where L loa is endemic, ivermectin must be used with caution as people with high L loa microfilaraemia are at greater risk of experiencing serious adverse effects (SAEs). Albendazole alone given twice per year is recommended when mass drug administration with ivermectin has not yet occurred. Where mass drug administration with ivermectin has already occurred for either lymphatic filariasis or onchocerciasis, ivermectin distribution can continue under current guidance on the use of ivermectin for onchocerciasis in areas co‐endemic for loiasis. For further information, see reference c. | ||||||
| Study details | Reported statistical analysis | ||||||
| Trial | Type of people enrolled | Mf density outcome denominator | CFA density outcome denominator | Mean reported | Explicit about method used to accommodate people with zero counts | Explicit about method used to calculate % reduction in density | If density increased post‐ treatment, authors set change to zero |
| Infected and uninfected | All mf‐positive | NA | GM | No | Yes | Yes | |
| Infected and uninfected | All CFA‐positivea | All CFA‐positiveb | GM | Yes (“n+1”) | Noa | NRa | |
| All mf‐positive | All mf‐positive | All CFA‐positive | LM | No | NR | NA | |
| All FDS‐positive | All individuals | NA | GM | Noc | Noc | NRc | |
| Infected and uninfected | All mf‐positived | All CFA‐positived | GM | Yes Calculation provided | Noe | NRe | |
| Infected and uninfected | All mf‐positive | All CFA‐positive | GM | Yes (“n+1”) | Yes | Yes | |
| All mf‐positive | All mf‐positive | NA | AM | NA | Noe | NRe | |
| Infected and uninfected | All mf‐positive | NA | AM | NAf | Noe | NRe | |
| All mf‐positive | All mf‐positive | All individuals | GM and AM | Nog | No | NR | |
| All mf‐positive | All mf‐positive | NA | GM | Yes (“n+1”) | NR | NA | |
| Infected and uninfected | All mf‐positive | All CFA‐positive | GM | Yes Calculation provided | Noe | NRe | |
| Abbreviations: AM: arithmetic mean; CFA: circulating filarial antigen; FDS: filarial dance sign; GM: geometric mean; LM: log mean; Mf: microfilariae; NA: not applicable; NR: not reported. | |||||||
| Background drug | Risk of bias: analysis used | Trial (follow‐up) | Intervention (albendazole) | Control | Difference between groups post‐treatment | ||||
| Participants | Baseline to follow‐up (% reduction) | Participants | Baseline to follow‐up (% reduction) | % reduction | Significance testing (% reduction) | Significance testing: mf density | |||
| Placebo | Low or unclear risk | Dunyo 2000a,b,c,d (6 months) | 62 | 1783 (95% CI 1215 to 2617) to 693 (95% CI 335 to 1431) (61.1%) | 57 | 2277 (95% CI 1576 to 3289) to 2745 (95% CI 1505 to 5007) (20.6% increase) | 81.7% | NR | NR |
| High risk | Beach 1999a,d,e (4 months) | 29 | 14.1 to 5.1 (28.7%) | 29 | 9.3 to 5.3 (17.2%) | 11.5% | NS (P > 0.05) | NS (P > 0.05) | |
| Fox 2005a,d,e (6 months) | 42 | 12.1 (95% CI 10.3 to 14.2) to 4.4 (95% CI 3.7 to 5.3) (34.7%) | 34 | 17.3 (95% CI 14.5 to 20.6) to 11.2 (95% CI 9.2 to 13.7) (10.3%) | 24.4% | * (P < 0.05) | * (P < 0.05) | ||
| Gayen 2013a,f,g (4 months) | 17 | 3942.32 to 821.88 (79%) | 15 | 4460.7 to 4390.7 (1.6%) | 77.4% | NRh | NR | ||
| DEC | Low or unclear risk | Pani 2002a,d,f (6 months) | 18 | 79.4, post‐treatment NR (81%) | 17 | 81.3, post‐treatment NR (74.7%) | 6.3% | NR | NS (P > 0.05) |
| Dreyer 2006d,f (1 month) | 21 | 55.9 to 12.7 (53.5%) | 23 | 129.5 to 18.8 (67.1%) | −13.6% | NS (P = 0.24) | NS (P = 0.83) | ||
| Rizzo 2007a,d,f (6 months) | 41 | 232.6 to 17.7 (92.4%) [2.36 (95% CI 2.16 to 2.57) to 1.27 (95% CI 0.94 to 1.60)]i | 43 | 182.6 to 10.5 (94.2%) [2.26 (95% CI 2.04 to 2.49) to 1.09 (95% CI 0.74 to 1.43)]i | −1.8% | NR | NS (P > 0.05) | ||
| (6 months) | 126 | 25.4 to 4.46 (82.4%) | 119 | 24.4 to 7.49 (69.3%) | 13.1% | NR | NS (P = 0.21) | ||
| De Britto 2015a,f,j (6 months) | 36 | 2.26 (± 0.57) to 0.15 (± NR) (99.2%) | 35 | 2.22 (± 0.52) to 0.83 (± NR) (96%) | 3.2% | NR | NR | ||
| High risk | Fox 2005a,d,e (6 months) | 41 | 13.4 (95% CI 11.4 to 15.8) to 0.76 (95% CI 0.7 to 0.9) (80.4%) | 39 | 12.9 (95% CI 11.0 to 15.2) to 2.8 (95% CI 2.3 to 3.4) (50.4%) | 30% | * (P = 0.02) | * (P <0.05) | |
| Ivermectin | Low or unclear risk | Dunyo 2000a,b,c,d (6 months) | 62 | 1585 (95% CI 1069 to 2350) to 110 (95% CI 50 to 239) (93.1%) | 55 | 2055 (95% CI 1389 to 3041) to 204 (95% CI 91 to 451) (90.1%) | 3% | NS (P = 0.71) | NR |
| Simonsen 2004a,b,d (6 months) | 105 | 812.6 to 29.8 (96.3%) | 98 | 763.5 to 150 (80.4%) | 15.9% | NRk | NRk | ||
| High risk | Beach 1999a,d,e (4 months) | 24 | 13.7 to 0.3 (98.9%) | 28 | 15.5 to 1.5 (76.1%) | 22.8% | *** (P < 0.001) | * (P < 0.05) | |
| Microfilariae (mf) density data and significance testing for differences between groups at baseline and follow‐up, as reported by study authors. We calculated the percentage reduction when this was not reported by the authors (values are italicized), and also the difference between the percentage reductions in the intervention and control groups. We judged the risk of bias as high when studies used analytical methods that could affect the interpretation of the data, and low or unclear risk when there was no obvious analytical issues. | |||||||||
| Background drug | Risk of bias: analysis used | Trial | Intervention (albendazole) | Control | Difference between groups post‐treatment | ||||
| Participants | Baseline to follow‐up (% reduction) | Participants | Baseline to follow‐up (% reduction) | % reduction | Significance testing: % reduction | Significance testing: mf density | |||
| Placebo | Low or unclear risk | Dunyo 2000a,b,c | 71 | 798 to 251 (68.5%) | 66 | 971 to 845 (13%) | 55.5% | NR | NS (P = 0.10) |
| High risk | Gayen 2013a,d,e | 17 | 3942.32 to 432.64 (89%) | 15 | 4460.7 to 4245 (4.8%) | 84.2% | NRf | NR | |
| DEC | Low or unclear risk | Pani 2002a,c,d | 18 | 79.4, post‐treatment NR (95.4%) | 17 | 81.3, post‐treatment NR (89.6%) | 5.8% | NR | NS (P > 0.05) |
| Dreyer 2006c,d | 22 | 55.9 to 6.1 (69.5%) | 25 | 129.5 to 4.8 (85.3%) | −15.8% | NS (P = 0.21) | NS (P = 0.87) | ||
| Rizzo 2007a,c,d | 41 | 232.6 to 5.2 (97.8%) [2.36 (95% CI 2.16 to 2.57) to 0.74 (95% CI 0.44 to 1.03)]g | 43 | 182.6 to 3.6 (98%) [2.26 (95% CI 2.04 to 2.49) to 0.65 (95% CI 0.35 to 0.95)]g | −0.2% | NR | NS (P > 0.05) | ||
| 126 | 25.4 to 3.47 (86.3%) | 119 | 24.4 to 4.27 (82.5%) | 3.8% | NR | NS (P = 0.6) | |||
| De Britto 2015a,d,h | 36 | 2.26 (± 0.57) to 0.07 (± NR) (99.4%) | 35 | 2.22 (± 0.52) to 0.52 (± NR) (98%) | 1.4% | NR | NR | ||
| High risk | Kshirsagar 2004a,d,e | 29 | NR to 249.2 (± 276.1) (NR) | 24 | NR to 245.9 (± 314.8) (NR) | NR | NR | NR | |
| Ivermectin | Low or unclear risk | Dunyo 2000a,b,c | 75 | 614 to 78 (87.3%) | 70 | 640 to 124 (80.6%) | 6.7% | NR | NS (P = 0.80) |
| Simonsen 2004a,b,c | 105 | 812.6 to 59.4 (92.7%) | 98 | 763.5 to 124.9 (83.6%) | 9.1% | NRi | NRi | ||
| Microfilariae (mf) density data and significance testing for differences between groups at baseline and follow‐up, as reported by study authors. We calculated the percentage reduction when this was not reported by the authors (values are italicized), and also the difference between the percentage reductions in the intervention and control groups. We judged the risk of bias as high when studies used analytical methods that could affect the interpretation of the data, and low or unclear risk when there was no obvious analytical issues. Abbreviations: mf: microfilariae; NR: not reported; NS: not significant; ±: standard deviation; CI: confidence interval. | |||||||||
| Background drug | Risk of bias: analysis used | Trial (follow‐up) | Intervention (albendazole) | Control | Difference between groups post‐treatment | ||||
| Participants | Baseline to follow‐up (% reduction) | Participants | Baseline to follow‐up (% reduction) | % reduction | Significance testing: % reduction | Significance testing: CFA density | |||
| Placebo | Low or unclear risk | Dunyo 2000a,b (12 months) | 105 | 1370 to 1139 (16.9%) | 103 | 1869 to 2757 (47.5% increase) | 64.4% | NR | NS (P = 0.11) |
| High risk | Fox 2005a,c (6 months) | 89 | 2640 (95% CI 2279 to 3058) to 2428 (95% CI 2071 to 2847) (3.2%) | 74 | 2298 (95% CI 1951 to 2706) to 2479 (95% CI 2105 to 2919) (1.7%) | 1.5% | NS (P > 0.05) | NS (P > 0.05) | |
| DEC | Low or unclear risk | (12 months) | 36 | 3.88 (± 0.48) to 2.89 (± NR) (89.8%) | 35 | 3.58 (± 0.69) to 2.9 (± NR) (79.1%) | 10.7% | NR | NS (P = 0.750) |
| High risk | Fox 2005a,c (6 months) | 85 | 2116 (95% CI 1798 to 2490) to 1350 (95% CI 1176 to 1549) (26.7%) | 79 | 2194 (95% CI 1842 to 2613) to 1597 (95% CI 1375 to 1855) (17%) | 9.7% | NS (P > 0.05) | NS (P > 0.05) | |
| (12 months) | 18 | 0.47 (± 0.18) to 0.08 (± 0.15) (83%) | 17 | 0.39 (± 0.21) to 0.07 (± 0.15) (82.1%) | 0.9% | NR | NR | ||
| Ivermectin | Low or unclear risk | Dunyo 2000a,b (12 months) | 121 | 1404 to 834 (40.6%) | 99 | 1689 to 1187 (29.7%) | 10.9% | NR | NS (P = 0.80) |
| (12 months) | 247 | 1338.4 to 986.6 (26.3%) | 266 | 1026.3 to 931.6 (9.2%) | 17.1% | NRf | NRf | ||
| Circulating filarial antigen (CFA) density data and significance testing for differences between groups at baseline and follow‐up, as reported by study authors. We calculated the percentage reduction when this was not reported by the authors (values are italicized), and also the difference between the percentage reductions in the intervention and control groups. We judged the risk of bias as high when studies used analytical methods that could affect the interpretation of the data, and low or unclear risk when there was no obvious analytical issues. Abbreviations: CFA: circulating filarial antigen; CI: confidence interval; DEC: diethylcarbamazine; mf: microfilariae; NR: not reported; NS: not significant; ±: standard deviation. | |||||||||
| Background drug | Risk of bias: Analysis used | Trial (follow‐up) | Intervention (albendazole) | Control | Difference between groups post‐treatment | ||||
| Participants | Baseline to follow‐up (% reduction) | Participants | Baseline to follow‐up (% reduction) | % reduction | Significance testing: % reduction | Significance testing: mf density | |||
| DEC | Low or unclear risk | (24 months)c | 348 | NR to 0.5 (83.7%) | 381 | NR to 0.7 (87.5%) | −3.8% | NR | NS (P = 0.53) |
| High risk | Pani 2002d,e (24 months)c | 18 | 98 (± 57) to 0.52 (± NR) (99.5%) | 17 | 133 (± 157) to 0.94 (± NR) (99.3%) | 0.2% | NR | NS (P > 0.05) | |
| (24 months)f | 16 | NR to 109.5 (± 143.3) (NR) | 15 | NR to 99.5 (± 119.3) (NR) | NR | NR | NR | ||
| Pani 2002d,e (36 months)c | 18 | 98 (± 57) to 0 (100%) | 17 | 133 (± 157) to 0 (100%) | 0% | NR | NR | ||
| (36 months)g | 4 | NR to 57.6 (± 56.0) (NR) | 8 | NR to 60.3 (± 61.5) (NR) | NR | NR | NR | ||
| Microfilariae (mf) density (mf/mL) data and significance testing for differences between groups at baseline and follow‐up, as reported by study authors. We calculated the percentage reduction when this was not reported by the authors (values are italicized), and also the difference between the percentage reductions in the intervention and control groups. We judged the risk of bias as high when studies used analytical methods that could affect the interpretation of the data, and low or unclear risk when there was no obvious analytical issues. Abbreviations: DEC: diethylcarbamazine; mf: microfilariae; NR: not reported; NS: not significant; ±: standard deviation. | |||||||||
| Background drug | Risk of bias: analysis used | Trial (follow‐up) | Intervention (albendazole) | Control | Difference between groups post‐treatment | ||||
| Participants | Baseline to follow‐up (% reduction) | Participants | Baseline to follow‐up (% reduction) | % reduction | Significance testing: % reduction | Significance testing: CFA density | |||
| DEC | High risk | Pani 2002a,b (24 months) | 18 | 0.5 to 0.48 (4%) | 17 | 0.39 to 0.44 (12.8% increase) | 16.8% | NR | NR |
| Pani 2002a,b (36 months) | 18 | 0.5 to 1.2 (140% increase) | 17 | 0.39 to 0.79 (102.6% increase) | −37.4% | NR | NR | ||
| Circulating filarial antigen (CFA) density data and significance testing for differences between groups at baseline and follow‐up, as reported by study authors. Data was reported as the arithmetic mean and presented by the authors in graphs only; we extracted this information using WebPlotDigitizer software. We calculated the percentage reduction after treatment, and the difference between the percentage reductions in the intervention and control groups. We judged the risk of bias as high when studies used analytical methods that could affect the interpretation of the data, and low or unclear risk when there was no obvious analytical issues. Abbreviations: CFA: circulating filarial antigen; DEC: diethylcarbamazine; mf: microfilariae; NR: not reported. | |||||||||
| Outcome or subgroup title | No. of studies | No. of participants | Statistical method | Effect size |
| 1 Microfilaraemia (mf) prevalence: longest follow‐up (up to 12 months) Show forest plot | 12 | 5027 | Risk Ratio (M‐H, Fixed, 95% CI) | 0.95 [0.85, 1.07] |
| 1.1 Albendazole versus placebo | 4 | 1406 | Risk Ratio (M‐H, Fixed, 95% CI) | 0.98 [0.81, 1.19] |
| 1.2 Albendazole plus DEC versus DEC | 7 | 1102 | Risk Ratio (M‐H, Fixed, 95% CI) | 0.90 [0.75, 1.09] |
| 1.3 Albendazole plus ivermectin versus ivermectin | 4 | 2519 | Risk Ratio (M‐H, Fixed, 95% CI) | 0.97 [0.80, 1.19] |
| 2 Antigenaemia prevalence: longest follow‐up (up to 12 months) Show forest plot | 7 | 3774 | Risk Ratio (M‐H, Fixed, 95% CI) | 1.04 [0.97, 1.12] |
| 2.1 Albendazole versus placebo | 2 | 1054 | Risk Ratio (M‐H, Fixed, 95% CI) | 1.07 [0.91, 1.25] |
| 2.2 Albendazole plus DEC versus DEC | 5 | 954 | Risk Ratio (M‐H, Fixed, 95% CI) | 1.03 [0.92, 1.14] |
| 2.3 Albendazole plus ivermectin versus ivermectin | 2 | 1766 | Risk Ratio (M‐H, Fixed, 95% CI) | 1.04 [0.94, 1.16] |
| 3 Adult worm prevalence by ultrasound: longest follow‐up (up to 12 months) Show forest plot | 3 | 165 | Risk Ratio (M‐H, Fixed, 95% CI) | 1.16 [0.72, 1.86] |
| 3.1 Albendazole plus DEC versus DEC | 3 | 165 | Risk Ratio (M‐H, Fixed, 95% CI) | 1.16 [0.72, 1.86] |
| 4 New clinical disease (new cases hydrocoele) Show forest plot | 1 | 535 | Risk Ratio (M‐H, Fixed, 95% CI) | 1.40 [0.23, 8.36] |
| 4.1 Albendazole versus placebo | 1 | 255 | Risk Ratio (M‐H, Fixed, 95% CI) | 0.98 [0.06, 15.45] |
| 4.2 Albendazole plus ivermectin versus ivermectin | 1 | 280 | Risk Ratio (M‐H, Fixed, 95% CI) | 1.81 [0.17, 19.73] |
| 5 Pre‐existing clinical disease (net improvement) Show forest plot | 1 | Risk Ratio (M‐H, Fixed, 95% CI) | Totals not selected | |
| 5.1 Albendazole versus placebo | 1 | Risk Ratio (M‐H, Fixed, 95% CI) | 0.0 [0.0, 0.0] | |
| 5.2 Albendazole plus ivermectin versus ivermectin | 1 | Risk Ratio (M‐H, Fixed, 95% CI) | 0.0 [0.0, 0.0] | |
| 6 Adverse events Show forest plot | 6 | 2894 | Risk Ratio (M‐H, Fixed, 95% CI) | 0.97 [0.84, 1.13] |
| 6.1 Albendazole versus placebo | 2 | 678 | Risk Ratio (M‐H, Fixed, 95% CI) | 0.95 [0.61, 1.48] |
| 6.2 Albendazole plus DEC versus DEC | 4 | 1589 | Risk Ratio (M‐H, Fixed, 95% CI) | 0.94 [0.79, 1.11] |
| 6.3 Albendazole plus ivermectin versus ivermectin | 1 | 627 | Risk Ratio (M‐H, Fixed, 95% CI) | 1.16 [0.77, 1.74] |
| Outcome or subgroup title | No. of studies | No. of participants | Statistical method | Effect size |
| 1 Microfilaraemia (mf) prevalence: longest follow‐up (up to 12 months) Show forest plot | 4 | 1406 | Risk Ratio (M‐H, Fixed, 95% CI) | 0.98 [0.81, 1.19] |
| 2 Microfilaraemia (mf) prevalence: stratified by baseline infection (up to 6 months follow‐up) Show forest plot | 4 | Risk Ratio (M‐H, Fixed, 95% CI) | Subtotals only | |
| 2.1 All mf positive at baseline | 3 | 175 | Risk Ratio (M‐H, Fixed, 95% CI) | 0.99 [0.90, 1.10] |
| 2.2 Infected and uninfected individuals at baseline | 2 | 783 | Risk Ratio (M‐H, Fixed, 95% CI) | 1.02 [0.73, 1.43] |
| 3 Microfilaraemia (mf) prevalence: stratified by baseline infection (12 months follow‐up) Show forest plot | 2 | Risk Ratio (M‐H, Fixed, 95% CI) | Subtotals only | |
| 3.1 All mf positive at baseline | 2 | 169 | Risk Ratio (M‐H, Fixed, 95% CI) | 0.94 [0.86, 1.03] |
| 3.2 Infected and uninfected individuals at baseline | 1 | 591 | Risk Ratio (M‐H, Fixed, 95% CI) | 0.94 [0.71, 1.26] |
| 4 Antigenaemia prevalence: longest follow‐up (up to 12 months) Show forest plot | 2 | 1054 | Risk Ratio (M‐H, Fixed, 95% CI) | 1.07 [0.91, 1.25] |
| 5 Antigenaemia prevalence: stratified by baseline infection (6 months follow‐up) Show forest plot | 1 | Risk Ratio (M‐H, Fixed, 95% CI) | Totals not selected | |
| 5.1 Infected and uninfected individuals at baseline | 1 | Risk Ratio (M‐H, Fixed, 95% CI) | 0.0 [0.0, 0.0] | |
| 6 Antigenaemia prevalence: stratified by baseline infection (12 months follow‐up) Show forest plot | 1 | Risk Ratio (M‐H, Fixed, 95% CI) | Totals not selected | |
| 6.1 All adult worm positive (CFA) at baseline | 1 | Risk Ratio (M‐H, Fixed, 95% CI) | 0.0 [0.0, 0.0] | |
| 6.2 Infected and uninfected individuals at baseline | 1 | Risk Ratio (M‐H, Fixed, 95% CI) | 0.0 [0.0, 0.0] | |
| 7 Clinical disease Show forest plot | 1 | Risk Ratio (M‐H, Fixed, 95% CI) | Totals not selected | |
| 7.1 New cases hydrocoele | 1 | Risk Ratio (M‐H, Fixed, 95% CI) | 0.0 [0.0, 0.0] | |
| 7.2 Net improvement (lymphoedema) | 1 | Risk Ratio (M‐H, Fixed, 95% CI) | 0.0 [0.0, 0.0] | |
| 7.3 Total improvement (hydrocoele) | 1 | Risk Ratio (M‐H, Fixed, 95% CI) | 0.0 [0.0, 0.0] | |
| 8 Adverse events Show forest plot | 2 | 678 | Risk Ratio (M‐H, Fixed, 95% CI) | 0.95 [0.61, 1.48] |
| Outcome or subgroup title | No. of studies | No. of participants | Statistical method | Effect size |
| 1 Microfilaraemia (mf) prevalence: longest follow‐up (up to 12 months) Show forest plot | 7 | 1102 | Risk Ratio (M‐H, Fixed, 95% CI) | 0.90 [0.75, 1.09] |
| 2 Microfilaraemia (mf) prevalence: stratified by baseline infection (up to 6 months follow‐up) Show forest plot | 7 | 1004 | Risk Ratio (M‐H, Random, 95% CI) | 0.87 [0.70, 1.08] |
| 2.1 All mf positive at baseline | 4 | 224 | Risk Ratio (M‐H, Random, 95% CI) | 0.83 [0.57, 1.21] |
| 2.2 All adult worm positive (CFA or ultrasound) at baseline | 2 | 289 | Risk Ratio (M‐H, Random, 95% CI) | 0.93 [0.74, 1.18] |
| 2.3 Infected and uninfected individuals at baseline | 1 | 491 | Risk Ratio (M‐H, Random, 95% CI) | 0.62 [0.32, 1.21] |
| 3 Microfilaraemia (mf) prevalence: stratified by baseline infection (12 months follow‐up) Show forest plot | 6 | Risk Ratio (M‐H, Random, 95% CI) | Subtotals only | |
| 3.1 All mf positive at baseline | 4 | 224 | Risk Ratio (M‐H, Random, 95% CI) | 0.88 [0.54, 1.45] |
| 3.2 All adult worm positive (CFA or ultrasound) at baseline | 2 | 291 | Risk Ratio (M‐H, Random, 95% CI) | 0.95 [0.70, 1.27] |
| 3.3 Infected and uninfected individuals at baseline | 1 | 139 | Risk Ratio (M‐H, Random, 95% CI) | 1.19 [0.78, 1.82] |
| 4 Microfilaraemia (mf) prevalence: stratified by baseline infection (24 months follow‐up) Show forest plot | 3 | Risk Ratio (M‐H, Fixed, 95% CI) | Subtotals only | |
| 4.1 All mf positive at baseline | 1 | 35 | Risk Ratio (M‐H, Fixed, 95% CI) | 0.94 [0.06, 13.93] |
| 4.2 All adult worm positive (CFA) at baseline | 1 | 245 | Risk Ratio (M‐H, Fixed, 95% CI) | 0.73 [0.46, 1.17] |
| 4.3 Infected and uninfected individuals at baseline | 2 | 868 | Risk Ratio (M‐H, Fixed, 95% CI) | 0.95 [0.71, 1.27] |
| 5 Microfilaraemia (mf) prevalence: stratified by baseline infection (36 months follow‐up) Show forest plot | 1 | Risk Ratio (M‐H, Fixed, 95% CI) | Totals not selected | |
| 5.1 Infected and uninfected individuals at baseline | 1 | Risk Ratio (M‐H, Fixed, 95% CI) | 0.0 [0.0, 0.0] | |
| 6 Antigenaemia prevalence: longest follow‐up (up to 12 months) Show forest plot | 5 | 954 | Risk Ratio (M‐H, Fixed, 95% CI) | 1.03 [0.92, 1.14] |
| 7 Antigenaemia prevalence: stratified by baseline infection (6 months follow‐up) Show forest plot | 4 | Risk Ratio (M‐H, Fixed, 95% CI) | Subtotals only | |
| 7.1 All mf positive at baseline | 1 | 35 | Risk Ratio (M‐H, Fixed, 95% CI) | 0.65 [0.38, 1.11] |
| 7.2 All adult worm positive (CFA) at baseline | 2 | 287 | Risk Ratio (M‐H, Fixed, 95% CI) | 1.00 [0.95, 1.04] |
| 7.3 Infected and uninfected individuals at baseline | 2 | 590 | Risk Ratio (M‐H, Fixed, 95% CI) | 1.04 [0.84, 1.27] |
| 8 Antigenaemia prevalence: stratified by baseline infection (12 months follow‐up) Show forest plot | 4 | Risk Ratio (M‐H, Fixed, 95% CI) | Subtotals only | |
| 8.1 All mf positive at baseline | 1 | 35 | Risk Ratio (M‐H, Fixed, 95% CI) | 0.94 [0.22, 4.05] |
| 8.2 All adult worm positive (CFA) at baseline | 3 | 332 | Risk Ratio (M‐H, Fixed, 95% CI) | 1.01 [0.92, 1.10] |
| 8.3 Infected and uninfected individuals at baseline | 1 | 139 | Risk Ratio (M‐H, Fixed, 95% CI) | 1.05 [0.83, 1.34] |
| 9 Antigenaemia prevalence: stratified by baseline infection (24 months follow‐up) Show forest plot | 3 | 445 | Risk Ratio (M‐H, Fixed, 95% CI) | 1.10 [0.96, 1.27] |
| 9.1 All mf positive at baseline | 1 | 35 | Risk Ratio (M‐H, Fixed, 95% CI) | 1.06 [0.91, 1.24] |
| 9.2 Infected and uninfected individuals at baseline | 2 | 410 | Risk Ratio (M‐H, Fixed, 95% CI) | 1.11 [0.95, 1.30] |
| 10 Antigenaemia prevalence: stratified by baseline infection (36 months follow‐up) Show forest plot | 2 | 174 | Risk Ratio (M‐H, Fixed, 95% CI) | 1.14 [0.92, 1.42] |
| 10.1 All mf positive at baseline | 1 | 35 | Risk Ratio (M‐H, Fixed, 95% CI) | 1.21 [0.95, 1.53] |
| 10.2 Infected and uninfected individuals at baseline | 1 | 139 | Risk Ratio (M‐H, Fixed, 95% CI) | 1.12 [0.84, 1.50] |
| 11 Adult worm prevalence by ultrasound: longest follow‐up (up to 12 months) Show forest plot | 3 | 165 | Risk Ratio (M‐H, Fixed, 95% CI) | 1.16 [0.72, 1.86] |
| 12 Adult worm prevalence by ultrasound: stratified by baseline infection (6 month follow‐up) Show forest plot | 2 | Risk Ratio (M‐H, Fixed, 95% CI) | Totals not selected | |
| 12.1 All mf positive at baseline | 1 | Risk Ratio (M‐H, Fixed, 95% CI) | 0.0 [0.0, 0.0] | |
| 12.2 All adult worm positive (ultrasound) at baseline | 1 | Risk Ratio (M‐H, Fixed, 95% CI) | 0.0 [0.0, 0.0] | |
| 12.3 Infected and uninfected individuals at baseline | 1 | Risk Ratio (M‐H, Fixed, 95% CI) | 0.0 [0.0, 0.0] | |
| 13 Adult worm prevalence by ultrasound: stratified by baseline infection (12 month follow‐up) Show forest plot | 3 | Risk Ratio (M‐H, Fixed, 95% CI) | Subtotals only | |
| 13.1 All mf positive at baseline | 2 | 57 | Risk Ratio (M‐H, Fixed, 95% CI) | 0.79 [0.37, 1.66] |
| 13.2 All adult worm positive (ultrasound) at baseline | 1 | 46 | Risk Ratio (M‐H, Fixed, 95% CI) | 1.53 [0.69, 3.40] |
| 13.3 Infected and uninfected individuals at baseline | 1 | 102 | Risk Ratio (M‐H, Fixed, 95% CI) | 0.96 [0.53, 1.75] |
| 14 Adult worm prevalence by ultrasound: stratified by baseline infection (24 month follow‐up) Show forest plot | 2 | 118 | Risk Ratio (M‐H, Fixed, 95% CI) | 1.32 [0.62, 2.79] |
| 14.1 All mf positive at baseline | 1 | 16 | Risk Ratio (M‐H, Fixed, 95% CI) | 1.91 [0.09, 40.60] |
| 14.2 Infected and uninfected individuals at baseline | 1 | 102 | Risk Ratio (M‐H, Fixed, 95% CI) | 1.28 [0.59, 2.77] |
| 15 Adverse events Show forest plot | 4 | 1589 | Risk Ratio (M‐H, Fixed, 95% CI) | 0.94 [0.79, 1.11] |
| 16 Adverse events: stratified by type Show forest plot | 4 | Risk Ratio (M‐H, Fixed, 95% CI) | Subtotals only | |
| 16.1 Any | 4 | 1589 | Risk Ratio (M‐H, Fixed, 95% CI) | 0.94 [0.79, 1.11] |
| 16.2 Interferred with daily activity | 2 | 1478 | Risk Ratio (M‐H, Fixed, 95% CI) | 1.09 [0.67, 1.77] |
| 16.3 Localized | 1 | 83 | Risk Ratio (M‐H, Fixed, 95% CI) | 0.51 [0.05, 5.43] |
| Outcome or subgroup title | No. of studies | No. of participants | Statistical method | Effect size |
| 1 Microfilaraemia (mf) prevalence: longest follow‐up (up to 12 months) Show forest plot | 4 | 2519 | Risk Ratio (M‐H, Random, 95% CI) | 0.84 [0.54, 1.31] |
| 2 Microfilaraemia (mf) prevalence: stratified by baseline infection (up to 6 months follow‐up) Show forest plot | 4 | Risk Ratio (M‐H, Random, 95% CI) | Subtotals only | |
| 2.1 All mf positive at baseline | 4 | 607 | Risk Ratio (M‐H, Random, 95% CI) | 0.71 [0.50, 1.02] |
| 2.2 Infected and uninfected individuals at baseline | 3 | 1929 | Risk Ratio (M‐H, Random, 95% CI) | 0.54 [0.23, 1.25] |
| 3 Microfilaraemia (mf) prevalence: stratified by baseline infection (12 months follow‐up) Show forest plot | 2 | Risk Ratio (M‐H, Fixed, 95% CI) | Subtotals only | |
| 3.1 All mf positive at baseline | 2 | 348 | Risk Ratio (M‐H, Fixed, 95% CI) | 0.99 [0.88, 1.12] |
| 3.2 Infected and uninfected individuals at baseline | 2 | 1811 | Risk Ratio (M‐H, Fixed, 95% CI) | 1.08 [0.88, 1.33] |
| 4 Antigenaemia prevalence: longest follow‐up (up to 12 months) Show forest plot | 2 | 1766 | Risk Ratio (M‐H, Fixed, 95% CI) | 1.04 [0.94, 1.16] |
| 5 Antigenaemia prevalence: stratified by baseline infection (6 months follow‐up) Show forest plot | 1 | Risk Ratio (M‐H, Fixed, 95% CI) | Totals not selected | |
| 5.1 All adult worm positive (CFA) at baseline | 1 | Risk Ratio (M‐H, Fixed, 95% CI) | 0.0 [0.0, 0.0] | |
| 5.2 Infected and uninfected individuals at baseline | 1 | Risk Ratio (M‐H, Fixed, 95% CI) | 0.0 [0.0, 0.0] | |
| 6 Antigenaemia prevalence: stratified by baseline infection (12 months follow‐up) Show forest plot | 2 | Risk Ratio (M‐H, Fixed, 95% CI) | Subtotals only | |
| 6.1 All adult worm positive (CFA) at baseline | 2 | 733 | Risk Ratio (M‐H, Fixed, 95% CI) | 1.03 [0.98, 1.08] |
| 6.2 Infected and uninfected individuals at baseline | 2 | 1766 | Risk Ratio (M‐H, Fixed, 95% CI) | 1.04 [0.94, 1.16] |
| 7 Clinical disease Show forest plot | 1 | Risk Ratio (M‐H, Fixed, 95% CI) | Totals not selected | |
| 7.1 New cases hydrocoele | 1 | Risk Ratio (M‐H, Fixed, 95% CI) | 0.0 [0.0, 0.0] | |
| 7.2 Net improvement (lymphoedema) | 1 | Risk Ratio (M‐H, Fixed, 95% CI) | 0.0 [0.0, 0.0] | |
| 7.3 Net improvement (hydrocoele) | 1 | Risk Ratio (M‐H, Fixed, 95% CI) | 0.0 [0.0, 0.0] | |
| 8 Adverse events Show forest plot | 1 | Risk Ratio (M‐H, Fixed, 95% CI) | Totals not selected | |