Abordajes quirúrgicos de la histerectomía para las enfermedades ginecológicas benignas
Referencias
Referencias de los estudios incluidos en esta revisión
Referencias de los estudios excluidos de esta revisión
Referencias de los estudios en espera de evaluación
Referencias adicionales
Referencias de otras versiones publicadas de esta revisión
Characteristics of studies
Characteristics of included studies [ordered by study ID]
| Methods | Single‐centre study, parallel‐group design Duration: April 2002 to February 2004 (1 year, 10 months) Randomisation: computer‐generated allocation list Allocation concealment: numbered, sealed, opaque envelopes Blinding: no Dropouts: there were no dropouts or conversions Follow‐up: women were followed up until 1 month after surgery. No loss to follow‐up | |
| Participants | 48 women with a mean age of 55 years in the VHO group and 53 years in the LAVHO group | |
| Interventions | VHO versus LAVHO Surgeons: 5 different surgeons carried out both procedures | |
| Outcomes | Primary outcome: complications (blood loss more than 500 ml, blood transfusion, haematoma, postoperative fever) | |
| Notes | France University Hospital of Marseille Funding not reported | |
| Risk of bias | ||
| Bias | Authors' judgement | Support for judgement |
| Random sequence generation (selection bias) | Low risk | Computer‐generated allocation list |
| Allocation concealment (selection bias) | Low risk | Numbered, sealed, opaque envelopes |
| Blinding (performance bias and detection bias) | High risk | Blinding not reported |
| Incomplete outcome data (attrition bias) | Low risk | No dropouts; no losses to follow‐up |
| Selective reporting (reporting bias) | Unclear risk | No clear primary outcome was defined |
| Other bias | Unclear risk | Surgeons' experience with laparoscopic procedures not reported |
| Methods | Single‐centre study, parallel‐group design Duration: June 1997 to December 2000 (2 years, 6 months) Randomisation: computer‐selected randomisation Allocation concealment: not clearly described Blinding: no Follow‐up: no loss to follow‐up | |
| Participants | 119 women with a mean age of 47 years for the AH group and 48 years for the VH group | |
| Interventions | AH versus VH Surgeons: the same surgeons carried out the surgery. Experience not reported | |
| Outcomes | Operative time; operative complications (injury to major vessel, ureter, bladder and bowel); drop in haemoglobin; postoperative complications; hospital stay No clear primary or secondary outcomes | |
| Notes | Italy University Hospital of Parma Funding not reported | |
| Risk of bias | ||
| Bias | Authors' judgement | Support for judgement |
| Random sequence generation (selection bias) | Low risk | Computer‐selected randomisation |
| Allocation concealment (selection bias) | Unclear risk | Patients were randomly allocated, not clearly described |
| Blinding (performance bias and detection bias) | High risk | Blinding not reported |
| Incomplete outcome data (attrition bias) | Low risk | No dropouts; no loss to follow‐up |
| Selective reporting (reporting bias) | Unclear risk | Primary outcome not (pre)defined |
| Other bias | Unclear risk | No other bias identified. Surgeons' experience not reported |
| Methods | Single‐centre study, parallel‐group design Duration: April 2004 to April 2006 (2 years) Randomisation: computer‐generated Allocation concealment: sealed, opaque envelopes Blinding: no Number of women eligible = 95. Number of patients randomised = 60 Follow‐up: in the 12‐month follow‐up, 7 patients in LH and 6 in VH were lost to follow‐up. There were no conversions Power calculation was performed for sample size: 30 patients per group were necessary to detect a difference of more than 25% in discharge at day 2 (less than 5% versus more than 30% in VH and LH, respectively) with 80% power and a significance level of 0.05 Analysis by intention‐to‐treat: yes (no conversions) | |
| Participants | 60 women with a mean age of 49 years in the LH group and 51 in the VH group Inclusion criteria: women with an indication for vaginal hysterectomy for benign pathology Exclusion criteria: uterine volume greater than 300 ml, previous surgery for pelvic inflammatory disease or endometriosis, suspicion of malignancy, the presence of an ovarian cyst greater than 4 cm and a vaginal prolapse higher than first degree | |
| Interventions | LH versus VH LH: total laparoscopic hysterectomy including the laparoscopic closure of the vaginal cuff and its suspension to the uterosacral ligaments VH: following Heaney's technique Antibiotic treatment: prophylactic antibiotic treatment (type not mentioned) at the beginning of the surgery and repeated 12 hours later Type of anaesthesia (in VH): not mentioned Surgeons' experience: all the procedures were performed by 2 skilled surgeons for each group; only surgeons who had performed at least 50 procedures were involved | |
| Outcomes | Primary outcome: hospital stay (with fixed parameters to discharge patients) Secondary outcomes: pain (as measured by VAS and analgesic request), blood loss and execution of adnexectomy if preoperatively planned | |
| Notes | Italy San Paolo Hospital, University School of Medicine (Milan) Funding not reported | |
| Risk of bias | ||
| Bias | Authors' judgement | Support for judgement |
| Random sequence generation (selection bias) | Low risk | Computer‐generated allocation list |
| Allocation concealment (selection bias) | Low risk | Sealed, opaque envelopes based on a computer‐generated allocation list |
| Blinding (performance bias and detection bias) | High risk | Blinding not reported |
| Incomplete outcome data (attrition bias) | High risk | Dropout and loss to follow‐up mentioned; no conversions. 10% lost to follow‐up |
| Selective reporting (reporting bias) | Low risk | Primary endpoint was clearly stated |
| Other bias | Low risk | No other bias identified |
| Methods | Single‐centre study, parallel‐group design Duration: June 2006 to May 2008 (2 years) Randomisation: computer‐generated random numbers Allocation concealment: envelopes Blinding: no Number of women randomised = 200. No dropouts reported. No conversions mentioned Follow‐up: duration of follow‐up not mentioned. No loss to follow‐up Power calculation for sample size: not reported | |
| Participants | 200 women; age only mentioned in groups and not in means Inclusion criteria: women scheduled for hysterectomy for benign disease without uterine decent and a uterine size < 14 weeks gestational age Exclusion criteria: primary diagnosis related to cancer, pelvic endometriosis, adnexal pathology, multiple abdominal scar from previous surgery and prolapse | |
| Interventions | VH versus AH VH: non‐descent vaginal hysterectomy. The surgical technique is not described either for VH or for AH Use of prophylactic antibiotic treatment not reported Surgeons' experience not mentioned | |
| Outcomes | Length of hospital stay, operating time, intra and postoperative blood transfusion, minor and major complications | |
| Notes | India Hospital New Raipur (Dabur Park) Funding not reported | |
| Risk of bias | ||
| Bias | Authors' judgement | Support for judgement |
| Random sequence generation (selection bias) | Unclear risk | Computer‐generated random numbers were used for randomisation. While assigning groups to envelopes, if the computer‐generated random number was odd, the assigned group was A (non‐descent vaginal hysterectomy). If the random number was even, the envelope was assigned to group B: abdominal hysterectomy |
| Allocation concealment (selection bias) | Low risk | Simple random allocation of study participants to 2 surgical procedure groups was done by using envelopes numbered from 001 to 200. While assigning groups to envelopes, if the computer‐generated random number was odd, the assigned group was A (non‐descent vaginal hysterectomy) for the first (001 numbered) envelope. A card with Group‐A: ND vaginal hysterectomy written over it was put inside the envelope. The next envelope was then taken and next random number was checked. If the random number was even, the envelope was assigned to group B: abdominal hysterectomy. A card with Group‐B: abdominal hysterectomy written over it was put inside the envelope no 002. Similarly cards with group‐A/B written over them were put inside sequentially numbered envelopes by matching with odd/even random numbers as generated by computer. 1st patient for the clinical trial was allocated to the group assigned to the envelope no‐001, 2nd patient was allotted to the group assigned to the envelope no.002. In this way 200 participants were allocated into 2 intervention groups and eventually the numbers in 2 groups were 100 in group A and 100 in group B |
| Blinding (performance bias and detection bias) | High risk | Blinding not reported |
| Incomplete outcome data (attrition bias) | Low risk | No dropouts; no loss to follow‐up |
| Selective reporting (reporting bias) | Unclear risk | Insufficient information available |
| Other bias | Unclear risk | The distribution in age and parity between the groups is somewhat skewed. Surgeon's experience not reported |
| Methods | Single‐centre study Duration: September 2009 to June 2010 Randomisation: computerised balanced method (1:1). Random numbers were computer‐generated Allocation concealment: random numbers were inserted in numbered, sealed and opaque envelopes. A single envelope was opened by the surgeon when the patient was hospitalised Number of women: assessed for eligibility = 118, randomised = 102 Follow‐up: single‐port LAVH ‐ no loss to follow‐up or dropout; multiple‐port LAVH ‐ 2 excluded from analysis, 0 lost to follow‐up ‐ 2 discontinued intervention Power calculation for sample size: yes, based on previous study of 24‐hour pain scores, they used 2.5 +/‐ 0.7 compared with 3.5 +/‐ 0.8 (mean and SD) and 1.9 +/‐ 1.4 compared with 2.8 +/‐ 1.4 for single‐port LAVH and multi‐port LAVH, as the primary criterion to calculate a minimum sample size of 45 patients for each group | |
| Participants | n = 102 Inclusion criteria: women, age 30 to 79 years, and an ASA classification of I or II Exclusion criteria: if disease was malignant, if they needed additional adnexal surgery (n = 13) or unwilling to participate (n = 3) | |
| Interventions | Single‐port LAVH versus multi‐port LAVH Single‐port LAVH: A 1.5 cm horizontal intra‐umbilical skin incision, a 1.5 cm to 2 cm rectus fasciotomy to open the peritoneal cavity, insertion small wound extractor. The wrist of surgical glove fixed to outer ring of wound extractor. A 12 mm trocar was inserted through a small hole made in one of the fingertip areas of the glove and advanced into the abdominal cavity. An additional hole for the accessory channel was made in another fingertip of the glove and one 5 mm trocar was inserted Multi‐port LAVH: 4 ports, one 12 mm port inserted umbilically, the other 5 mm ports in lateral abdominal wall and suprapubic. 0 degree rigid 10 mm scope Surgeons: all procedures were performed by a single surgeon, assisted by another surgeon, at a single institute Antibiotics: perioperative antibiotic treatment not reported Postoperative assessment performed by 2 independent investigators | |
| Outcomes | Postoperative pain (at 12, 24 and 48 hours, VAS) Operative time, additional procedures, blood loss, transfusion requirements, postoperative hospital stay | |
| Notes | Taiwan Taipei Veterans General Hospital, Taipei Funding reported, i.e. Taipei Veterans General Hospital, Taipei and Yen‐Tjing‐Ling Medical Foundation, Taiwan | |
| Risk of bias | ||
| Bias | Authors' judgement | Support for judgement |
| Random sequence generation (selection bias) | Low risk | Computer‐generated numbers |
| Allocation concealment (selection bias) | Low risk | Numbered, sealed and opaque envelopes |
| Blinding (performance bias and detection bias) | High risk | Not reported |
| Incomplete outcome data (attrition bias) | Low risk | Dropouts and loss to follow‐up reported. No loss to follow‐up. 2 discontinued multi‐port LAVH |
| Selective reporting (reporting bias) | Unclear risk | No primary outcome defined. Insufficient information available |
| Other bias | Unclear risk | Surgeons reported, but experience unclear. Analysis according to intention‐to‐treat not mentioned |
| Methods | Multicentre study (n = 2), parallel‐group design Duration: January to December 1999 (1 year) Randomisation: pre‐determined computer‐generated randomisation code Allocation concealment: not reported Number of women randomised = 80. No dropouts reported. 3 LAVH converted to AH Power calculation to estimate sample size: yes, 35 women required for each surgery arm (assuming that the incidence of complications in women who had LH(a) was 10% and there was an increase of complication rate to 40%), with an alpha (type I error) of 0.05 and a beta (type II error) of 0.2 | |
| Participants | 80 women with a mean age of 50 years for the LH(a) group and 49 years for the VH group Inclusion criteria: women scheduled for abdominal hysterectomy for benign disease with traditional contraindications for VH, including uterine size larger than 280 g and one or more of the following: previous pelvic surgery, history of pelvic inflammatory disease (PID), moderate or severe endometriosis, concomitant adnexal masses, indication for adnexectomy and nulliparity without uterine descent Exclusion criteria: anaesthetic contraindications for laparoscopic surgery; suspicious adnexal mass on ultrasound; ovarian blood flow and tumour markers; vaginal narrowed to less than 2 fingers wide; immobile uterus with no descent and no lateral mobilisation | |
| Interventions | VH versus LH (LH(a)) Antibiotics: both groups received prophylactic antibiotic treatment (cefazolin 2 g IV) at the beginning and anticoagulant therapy with low molecular weight heparin the evening before the operation | |
| Outcomes | Intra‐operative and postoperative complications; febrile morbidity; analgesia requirement; postoperative hospital stay; conversion to laparotomy; uterine size and weight | |
| Notes | France 2 hospitals in Paris Funding not reported | |
| Risk of bias | ||
| Bias | Authors' judgement | Support for judgement |
| Random sequence generation (selection bias) | Low risk | Pre‐determined computer‐generated randomisation code |
| Allocation concealment (selection bias) | Unclear risk | Not reported |
| Blinding (performance bias and detection bias) | High risk | Blinding not reported |
| Incomplete outcome data (attrition bias) | Low risk | No dropouts, 3 procedures converted. No loss to follow‐up |
| Selective reporting (reporting bias) | Unclear risk | Insufficient information available. Primary outcome not clearly defined in paper |
| Other bias | Low risk | No other bias identified |
| Methods | Single‐centre study, parallel‐group design Duration: not reported Randomisation: method not stated Allocation concealment not reported Blinding: no Follow‐up: assessment of pain, nausea and vomiting, 8 pm day of surgery, 10 am and 6 pm first day and 10 am second postoperative day. Pulmonary function assessed pre‐operatively and 10 am, first and second day. Time of anaesthesia, surgery, per and postoperative complications and difference in erythrocyte volume fraction (EVF) before and 2 days after surgery. No loss to follow‐up | |
| Participants | 40 women with a mean age of 46 years (LH(a) group) and 48 years (AH group) | |
| Interventions | AH versus LH (LH(a)). Both groups stratified to total and subtotal hysterectomies | |
| Outcomes | Primary: postoperative pain, pulmonary function | |
| Notes | Sweden University Hospital of Sahlgrenska Funding: Goteborg Medical Society Fund, Swedish Medical Research Council | |
| Risk of bias | ||
| Bias | Authors' judgement | Support for judgement |
| Random sequence generation (selection bias) | Unclear risk | Not reported |
| Allocation concealment (selection bias) | Unclear risk | Not reported |
| Blinding (performance bias and detection bias) | High risk | Blinding not reported |
| Incomplete outcome data (attrition bias) | Low risk | No dropouts; no loss to follow‐up |
| Selective reporting (reporting bias) | Low risk | Primary outcome clearly defined |
| Other bias | High risk | Analysis according to intention‐to‐treat unclear; no exclusion criteria reported. No sample size calculation performed. Surgeon's experience not reported |
| Methods | Single‐centre study, parallel‐group design Duration: September 1995 to February 1997 (1 year, 6 months) Randomisation: assigned according to a computer‐generated randomisation schedule with random block sizes Allocation concealment: All patients were told of their assignment before surgery Blinding: no Dropout: 4 withdrew before surgery (3 AH group and 1 LH group) Follow‐up: daily diary for 6 weeks, recording symptoms, lifestyle impact, life events, medication. In each arm, 1 patient refused to keep a diary | |
| Participants | 44 women with a mean age of 42.8 years (LH group) and 43.8 years (AH group) | |
| Interventions | AH versus LH 3 10 mm trocar sites ‐ 1 umbilical and 1 in each lower quadrant lateral to inferior epigastric artery 6 cm to 8 cm above pubic rami. Uterine arteries occluded laparoscopically with electrocautery. Cardinal ligaments cut laparoscopically. If the uterus had minimal descent, uterosacral ligaments were also cut laparoscopically. Vagina incised either laparoscopically or vaginally, depending on the ease that this could be achieved. Either anterior or posterior fornix, depending on access. Surgery then completed vaginally. Vaginal cuff closed vaginally Postoperative pain relief was given to patients intravenously | |
| Outcomes | Operative time; blood loss; length of hospital stay; uterine weight; intra‐operative complications; postoperative pain; return to work/normal activities and hospital costs per patient | |
| Notes | USA Cleveland Clinic Foundation, Ohio Funding by Ethicon Endosurgery and the Minimally Invasive Center of the Cleveland Clinic Foundation | |
| Risk of bias | ||
| Bias | Authors' judgement | Support for judgement |
| Random sequence generation (selection bias) | Low risk | Computer‐generated randomisation schedule with random block sizes |
| Allocation concealment (selection bias) | Unclear risk | Not reported |
| Blinding (performance bias and detection bias) | High risk | No blinding |
| Incomplete outcome data (attrition bias) | Low risk | 4 patients withdrew before surgery and data were included where possible. In each arm 1 patient was lost to follow‐up |
| Selective reporting (reporting bias) | Low risk | No reporting bias identified |
| Other bias | Unclear risk | Funding from pharmaceutical or surgical instrumentation company. Surgeon's experience unclear |
| Methods | Single‐centre study, parallel‐group design Duration: 24 months Randomisation: computer‐generated randomisation numbers Blinding: no Follow‐up: women were followed up until discharge from hospital. Postoperatively, temperature and analgesic requirement were recorded daily. No loss to follow‐up Power calculation for sample size: no | |
| Participants | 62 women aged from 43 to 50 years | |
| Interventions | AH versus LH (LAVH) | |
| Outcomes | Operating time; blood loss; complications; febrile morbidity; analgesic administration and hospital stay | |
| Notes | Italy San Paolo Biomedical Sciences Institute, University of Milan Funding not reported | |
| Risk of bias | ||
| Bias | Authors' judgement | Support for judgement |
| Random sequence generation (selection bias) | Low risk | Computer‐generated randomisation numbers |
| Allocation concealment (selection bias) | Low risk | Sealed, opaque envelopes |
| Blinding (performance bias and detection bias) | High risk | Blinding not reported |
| Incomplete outcome data (attrition bias) | Low risk | No dropouts; no loss to follow‐up |
| Selective reporting (reporting bias) | Unclear risk | Primary outcome not predefined |
| Other bias | Unclear risk | Surgeon's experience unclear. Power calculation for sample size not performed |
| Methods | Multicentre study (n = 30), parallel‐group design Duration: November 1996 to September 2000 (4 years) Randomisation: 2:1 imbalance randomisation method. Allocation to abdominal or vaginal trial by surgeon. Randomisation to conventional or laparoscopic approach was performed with a computer‐generated program and allocation was advised by telephone call to the central North Yorkshire Clinical Trials unit. Allocation concealment: ‐ Vaginal trial: 504 (VH: 168, vLH: 336) ‐ Number of patients that withdrew/dropped out pre‐operatively: AH:6, aLH: 11,VH: 5, vLH: 12 Power calculation to estimate sample size: yes. The sample size for the abdominal trial was calculated on the basis of 9% of AH having major complications. In order to detect a reduction in complication rate of 50%, a sample size of 450 in each arm was required using 80% power and a 2‐sided type 1 error rate of 5% | |
| Participants | 1380 women with a mean age of 41 years | |
| Interventions | 4 arms: VH, LH in the vaginal trial (vLH); AH and LH in the abdominal trial(aLH) | |
| Outcomes | Primary outcomes: major complications (major haemorrhage, bowel injury, ureteric injury, bladder injury, pulmonary embolus, anaesthesia problems, unintended laparotomy, wound dehiscence, haematoma) Secondary outcomes: minor complications (major haemorrhage, anaesthesia problems, pyrexia, infection, haematoma, DVT); blood loss; pain; analgesia requirement; sexual activity; body image; health status; length of surgery; length of hospital stay | |
| Notes | UK (28 centres) and South Africa (2 centres) Funding: National Health Service Research and Development Health Technology Assessment Programme, UK | |
| Risk of bias | ||
| Bias | Authors' judgement | Support for judgement |
| Random sequence generation (selection bias) | Low risk | Randomised with use of a computer‐generated program |
| Allocation concealment (selection bias) | Low risk | Telephone inquiry |
| Blinding (performance bias and detection bias) | High risk | Blinding not reported |
| Incomplete outcome data (attrition bias) | High risk | 17 patients in each trial dropped out before surgery and sensitivity analysis was performed. Particularly in the AH arm and LH arms loss to follow‐up was high (> 15%) Quality of life outcome at baseline reported in 76% of women |
| Selective reporting (reporting bias) | Low risk | Primary and secondary outcomes well defined |
| Other bias | Unclear risk | Surgical procedures not reported. Surgeons of all grades and experience participated |
| Methods | Single‐centre Duration: February 2009 to September 2009 (7 months) Randomisation: computer‐generated list Allocation concealment: treatment allocation was concealed until the day of surgery Blinding: no Number of women: 123 women eligible, of which 82 randomised: 41 randomised to LH and 41 randomised to VH. No dropout Follow‐up: no loss to follow‐up Power calculation to estimate sample size: yes, based on mean VAS pain score after VH reported by Candiani et al (2011). With an alpha error of 5% and a power of 95%, at least 40 patients in each group needed to detect a 50% decrease in the mean postoperative pain on day 0 in patients with LH Intention‐to‐treat analysis: not reported | |
| Participants | 82 women with a mean age of 48 years in both groups Inclusion criteria: indication for hysterectomy for a supposed benign gynaecological condition Exclusion criteria: uterine volume > 14 weeks of gestation, suspicion of malignancy, concomitant presence of large adnexal masses (diameter > 4 cm) and pelvic organ prolapse > stage 1 according to POP‐Q classification. Chronic pelvic pain and endometriosis or PID were excluded | |
| Interventions | TLH versus VH TLH: intrauterine manipulator inserted. 5 mm scope umbilical site. 3 5 mm ancillary trocars inserted, 1 suprapubically and 2 laterally. Coagulation and dissection of round ligaments and infundibulopelvic ligaments. Broad ligament opened to uterovesical fold, caudal reflection of bladder. Uterine arteries, cardinal ligaments and uterosacral ligaments coagulated and transected. Colpotomy with monopolar hook. Uterus extracted vaginally. Vaginal cuff closure with single layer sutures VH: performed according to a standardised technique Surgeons: surgical team and their experience were not reported Antibiotic and antithrombotic prophylaxis administered postoperatively | |
| Outcomes | Primary outcome: postoperative pain (VAS at 1, 3, 8 and 24 hours after procedure) Secondary outcome: operative time | |
| Notes | Varese, Italy Del Ponte Hospital, University of Insubria Funding: not reported | |
| Risk of bias | ||
| Bias | Authors' judgement | Support for judgement |
| Random sequence generation (selection bias) | Low risk | Randomisation with use of a computer‐generated list |
| Allocation concealment (selection bias) | Unclear risk | Concealed until day of surgery. Method of concealment not reported |
| Blinding (performance bias and detection bias) | High risk | Blinding not reported |
| Incomplete outcome data (attrition bias) | Low risk | Dropout and loss to follow‐up reported. Low numbers |
| Selective reporting (reporting bias) | Unclear risk | Primary outcome not clearly defined in methods of study |
| Other bias | Low risk | Surgical experience reported |
| Methods | Single‐centre Duration: October 2009 to May 2010 (7 months) Randomisation: block randomisation, computer‐generated list, with block size of 28 Allocation concealment: the surgeon was notified of the allocation on the day of the procedure Blinding: patients and research assistants were blinded to group randomisation Number of women: 112 patients eligible of which 76 randomised. 38 allocated to each group. Randomised = 76; analysed = 76. No dropouts Follow‐up: no loss to follow‐up Power calculation for sample size: yes, a reduction in pain intensity of 2 points on the VAS would be regarded as clinically significant. With alpha = 0.05 and beta = 0.20, a sample size of 38 women per group would be required to detect a reduction in the mean pain score at 1 hour after surgery from 4.7 to 2.7 Intention‐to‐treat analysis: not reported | |
| Participants | 76 patients with a mean age of 46 and 47 years for each group Inclusion criteria: women with benign gynaecological conditions requiring hysterectomy Exclusion criteria: pelvic organ prolapse > grade I. Severe cardiopulmonary disease if anaesthesiology team decided that laparoscopy was contraindicated | |
| Interventions | LH versus mini‐LH Same surgical technique was used for both LH and mini‐LH. LH was a standardised technique. Only difference is that in mini‐ LH all ports were 3 mm or smaller Surgeons: same surgical team skilled in advanced laparoscopy Patients underwent a standardised anaesthesia protocol | |
| Outcomes | Primary outcome: postoperative pain (VAS 1, 3, 8 and 24 hours postoperative) Secondary outcomes: operative parameters, volume in inflated CO2 | |
| Notes | Varese, Italy Del Ponte Hospital, University of Insubria Funding: not reported | |
| Risk of bias | ||
| Bias | Authors' judgement | Support for judgement |
| Random sequence generation (selection bias) | Low risk | Randomisation: block‐randomisation, computer‐generated list |
| Allocation concealment (selection bias) | Low risk | Allocation concealment described |
| Blinding (performance bias and detection bias) | Low risk | Patients and research assistants were blinded to group randomisation |
| Incomplete outcome data (attrition bias) | Low risk | Dropout and loss to follow‐up reported, low numbers |
| Selective reporting (reporting bias) | Low risk | Primary and secondary outcomes defined |
| Other bias | Low risk | No other bias identified |
| Methods | Single‐centre study, parallel‐group design with no blinding Duration: March to September 1997 (6 months) Randomisation: patients were randomly allocated Blinding: no Number of women randomised = 50. No dropouts reported. Tissue trauma analysis for 18 uncomplicated hysterectomies in both groups were included Follow‐up: first follow‐up visit was scheduled 4 weeks after the operation and then followed up until complete recovery. No loss to follow‐up | |
| Participants | 50 women with a mean age of 47 years (LH(a) group) and 48 years (AH group) | |
| Interventions | AH versus LH (LH(a)) | |
| Outcomes | Operating time; anaesthetic time; blood loss; haemoglobin change; hospital stay; sick leave and complications | |
| Notes | Finland Jorvi Hospital, Espoo Funding: The Clinical Research Institution of Helsinki University Central Hospital and Jorvi Hospital, The Finnish Medical Foundation and The Research Foundation of Orion Corporation | |
| Risk of bias | ||
| Bias | Authors' judgement | Support for judgement |
| Random sequence generation (selection bias) | Unclear risk | Patients were randomly allocated. Method not clearly described |
| Allocation concealment (selection bias) | Low risk | Sequentially numbered and sealed, opaque envelopes |
| Blinding (performance bias and detection bias) | High risk | Blinding not reported |
| Incomplete outcome data (attrition bias) | Low risk | No dropouts; no loss to follow‐up |
| Selective reporting (reporting bias) | Unclear risk | Insufficient information available |
| Other bias | Unclear risk | Tissue trauma reported in uncomplicated surgeries only Funding from pharmaceutical or surgical instrumentation company |
| Methods | Single‐centre study, parallel‐group design Duration: June 1999 to May 2001 (2 years) Randomisation: sealed envelopes containing computer‐generated block randomisation numbers, block size of 10 Follow‐up: 6 weeks after surgery | |
| Participants | 90 women with a mean age of 45.1 years | |
| Interventions | AH versus VH versus LH (LH(a)) All operations performed under general anaesthesia by second author, with the assistance of the other authors. Standardised postoperative protocol of 2 doses of IV meperidine 50 mg every 4 hours for pain control followed by acetaminophen 325 mg every 6 hours | |
| Outcomes | Operating time; hospital stay; intra‐operative blood loss; complications; postoperative tenderness score; return to work; antibiotics used | |
| Notes | Taiwan Shin Kong Wu Ho‐Su Memorial Medical Centre, Taipei Funding not reported | |
| Risk of bias | ||
| Bias | Authors' judgement | Support for judgement |
| Random sequence generation (selection bias) | Low risk | Computer‐generated block randomisation numbers |
| Allocation concealment (selection bias) | Low risk | Sealed, opaque envelopes |
| Blinding (performance bias and detection bias) | High risk | Blinding not reported |
| Incomplete outcome data (attrition bias) | Low risk | No dropouts. No loss to follow‐up |
| Selective reporting (reporting bias) | Unclear risk | Insufficient information |
| Other bias | Unclear risk | Uterine weight in AH group was significantly higher than in VH and LAVH group |
| Methods | Single‐centre Duration: October 2009 to March 2010 (5 months) Randomisation: based on computer‐generated random sampling numbers Allocation concealment: not described Blinding: no Number of women randomised = 68. 34 in TLH arm analysed. 30 in SP‐LH arm analysed: 4 converted procedures excluded from analysis Follow‐up: no loss to follow‐up Power calculation for sample size: yes, a difference of 0.8 in the VAS score was considered clinically relevant. The number of cases needed per group was 34 Intention‐to‐treat analysis not applied | |
| Participants | Mean age was 48 years Inclusion criteria: age >/ = 20 years, no evidence of gynaecologic malignancy, normal cervical cytology or histology, appropriate medical status for laparoscopic surgery (ASA 1 or 2), adequate uterus size for vaginal removal (</ = 12 weeks) Exclusion criteria: uterine size larger than 12 weeks, history of pelvic radiation therapy, suspicion of gynaecologic cancer, more than 3 prior laparotomies, treated for gastrointestinal or gynaecologic malignancy | |
| Interventions | SP‐TLH versus 4‐port/conventional TLH Conventional TLH: 4 5 mm trocars were placed. A 5 mm port for the laparoscope inserted through the umbilicus. 2 5 mm ports were placed in the left lower quadrant of the abdomen and one in the right lower quadrant SP‐TLH: a 1.2 cm vertical intra‐umbilical skin incision was made and a 1.5 cm rectus fasciotomy was performed for entrance to the peritoneal cavity. A single 3‐channel port was used. After introduction in both arms the procedure was performed similarly. Utero‐ovarian ligaments and round ligaments and broad ligaments were sequentially ligated and dissected. The vesico‐uterine peritoneal fold was opened and the bladder mobilised. The uterine vessels were sealed and dissected. The uterus was removed vaginally; some had to be morcellated. The vaginal vault was sutured laparoscopically or transvaginally, depending on the surgeon's decision Surgeons' experience: all procedures performed by 3 skilled surgeons. Surgical experience: at least 100 LH and 30 SP‐LH | |
| Outcomes | Primary: postoperative pain (VAS) and need of analgesics Secondary: operative time, intra and postoperative complications, postoperative hospital stay, haemoglobin | |
| Notes | Korea Gangnam Medical Center, Seoul Funding not reported | |
| Risk of bias | ||
| Bias | Authors' judgement | Support for judgement |
| Random sequence generation (selection bias) | Low risk | Randomisation: based on computer‐generated random sampling numbers |
| Allocation concealment (selection bias) | High risk | Allocation concealment not described |
| Blinding (performance bias and detection bias) | High risk | Blinding not reported |
| Incomplete outcome data (attrition bias) | Unclear risk | No loss to follow‐up, 4 converted procedures in SP arm excluded from analysis |
| Selective reporting (reporting bias) | Unclear risk | Converted procedures not analysed; primary and secondary outcomes predefined |
| Other bias | Low risk | No other bias identified |
| Methods | Single‐centre study, parallel‐group design Duration: August 2002 to January 2005 (2 years, 6 months) Randomisation: randomly allocated Blinding: no Number of women eligible = 88, and randomised = 59 Dropouts: in the LH group, 1 woman refused the allocated procedure and an AH was performed. There were 2 intra‐operative conversions to AH. There were 2 patients with re interventions (laparotomy) in the AH group Follow‐up: women were followed up until 3 months after surgery. At 12 weeks the follow‐up was complete in 81% of the LH group and 94% of the AH group | |
| Participants | 59 women with a mean age of 46 years in both groups | |
| Interventions | TAH versus TLH LH: intentional TLH procedures, using the Storz uterine manipulator type Clemont Ferrand, and a 4‐port technique with bipolar coagulation and scissors. Opening the bladder flap and colpotomy (with the use of monopolar coagulation) were performed laparoscopically, as well as laparoscopic extracorporeal suturing of the vagina Antibiotic treatment: both groups received prophylactic antibiotic treatment (amoxicillin clavulanate 2.2 g IV) and anticoagulant therapy | |
| Outcomes | Primary: quality of life (questionnaire RAND‐36) | |
| Notes | The Netherlands Maxima Medical Centre, Veldhoven No funding | |
| Risk of bias | ||
| Bias | Authors' judgement | Support for judgement |
| Random sequence generation (selection bias) | Low risk | Patients were randomly allocated |
| Allocation concealment (selection bias) | Low risk | Sealed, opaque envelopes shuffled and sequentially numbered |
| Blinding (performance bias and detection bias) | High risk | No blinding |
| Incomplete outcome data (attrition bias) | High risk | 1 refused assigned procedure and was analysed in assigned treatment group. Loss to follow‐up was almost 20% in LH group; in AH group 6% |
| Selective reporting (reporting bias) | Low risk | Primary outcomes predefined and accordingly reported |
| Other bias | Unclear risk | Different group of surgeons for different procedures. More residents as first surgeon in AH |
| Methods | Single‐centre. Stratified, open, randomised, controlled, parallel‐group trial Duration: April 2010 to March 2011 (1 year) Randomisation: computer‐generated list. Stratified random sampling. Group 1: uterus </ = 12 weeks of gestation (n = 32); Group 2: uterus > 12 to 16 weeks of gestation (n = 11); Group 3: history of abdominal surgery (n = 7) Allocation concealment: sealed, opaque, numbered envelopes Blinding: researcher blinded; patients not blinded Number of women: after randomisation: LAVH 25 (group 1 = 16; group 2 = 6; group 3 = 3); AH 25 (group 1 = 16; group 2 = 5; group 3 = 4) Follow‐up: until discharge from the hospital. No loss to follow‐up Power calculation for sample size: yes, it was calculated from the population mean from a sample size determination as per WHO Health Studies. A power calculation verified that no more that 24 patients were needed in each group Analysis by intention‐to‐treat: not reported | |
| Participants | 50 women Inclusion criteria: indication for hysterectomy because of benign disease. Uterus </ = 16 weeks Exclusion criteria: cardiopulmonary disease, cardiac arrhythmias, history of ischaemic heart disease, other medical risks | |
| Interventions | LAVH versus AH Surgical techniques not reported Surgeons: 2 surgeons who performed both procedures at least 30 times Preoperatively antibiotic prophylaxis cefotaxime 1 g | |
| Outcomes | Intraoperative blood loss, duration of operation, intraoperative and early postoperative complications, conversion rate, pain, duration of hospital stay | |
| Notes | Thailand Srinagarind Hospital, Khon Kaen Funding: grant support by the Faculty of Medicine of Khon Kaen University | |
| Risk of bias | ||
| Bias | Authors' judgement | Support for judgement |
| Random sequence generation (selection bias) | Low risk | Randomisation by means of a computer‐generated list of random numbers |
| Allocation concealment (selection bias) | Low risk | Sealed, opaque, numbered envelopes |
| Blinding (performance bias and detection bias) | Unclear risk | Blinding of researcher; patients not blinded |
| Incomplete outcome data (attrition bias) | Low risk | No loss to follow‐up reported, conversion rate reported |
| Selective reporting (reporting bias) | Unclear risk | Insufficient information available |
| Other bias | Unclear risk | Not reported if 3 groups are comparable on basic characteristics; power calculation unclear |
| Methods | Single‐centre study, parallel‐group design Duration: November 1993 to February 1995 (1 year, 4 months) Randomisation: method not reported Allocation concealment: not reported Blinding: no Follow‐up: until discharge from the hospital. No loss to follow‐up | |
| Participants | 70 women with a mean age of 43 (LAVH group) and 48 years (AH group) | |
| Interventions | AH versus LH (LAVH) AH arm: the abdominal hysterectomies followed a common technique (Ober and Meinrenken 1964) Antibiotics: both groups received peri‐operative antibiotic prophylaxis with 2 g of cephalosporin (Ceftriaxon), 15 minutes prior to the operation | |
| Outcomes | Operating time, pain relief, size of uterus, haemoglobin change, stay in hospital and complications | |
| Notes | Germany Hospital in Stuttgart Funding not reported Paper in German language. Translation was commissioned | |
| Risk of bias | ||
| Bias | Authors' judgement | Support for judgement |
| Random sequence generation (selection bias) | Unclear risk | Not reported |
| Allocation concealment (selection bias) | Unclear risk | Not reported |
| Blinding (performance bias and detection bias) | High risk | No blinding |
| Incomplete outcome data (attrition bias) | Low risk | No dropouts; no loss to follow‐up |
| Selective reporting (reporting bias) | Unclear risk | Primary outcome not defined |
| Other bias | High risk | No exclusion criteria; no power calculation for sample size. Surgeons' experience unclear |
| Methods | Multicentre study (n = 2), parallel‐group design Duration: not reported Randomisation: a table of random digits, numbered 1 to 100 Blinding: no Number of women randomised = 100, number analysed = 100. No dropouts or conversions Follow‐up: until women returned to work/normal activities. No loss to follow‐up | |
| Participants | 100 women. The age of the women was not reported | |
| Interventions | AH versus LH (LH(a)) AH arm: according to standard techniques. Abdomen was entered via a Pfannenstiel incision. The entire abdominal cavity was palpated and the pelvis inspected. The uterine ligaments were clamped and ligated. The bladder peritoneum was opened and the bladder was mobilised away from the cervix and upper anterior vaginal wall. Uterine vessels were clamped, cut and ligated. The vagina was closed with resorbable sutures. Performed by any skilled gynaecologist in the department Surgeons: different group of surgeons for different procedures | |
| Outcomes | Operation time; hospital stay; time elapsed before resuming work; postoperative pain; complications and blood loss | |
| Notes | Norway (2 centres) Aker University Hospital, Oslo, and Akershus central Hospital, Oslo Funding not reported | |
| Risk of bias | ||
| Bias | Authors' judgement | Support for judgement |
| Random sequence generation (selection bias) | Low risk | Table of random digits |
| Allocation concealment (selection bias) | Low risk | Sealed envelopes |
| Blinding (performance bias and detection bias) | High risk | Blinding not reported |
| Incomplete outcome data (attrition bias) | Low risk | No dropouts; no loss to follow‐up |
| Selective reporting (reporting bias) | Unclear risk | Primary outcome not defined |
| Other bias | Unclear risk | Different group of surgeons for different procedures |
| Methods | Duration: November 1999 to December 2000 (1 year, 1 month) Randomisation: randomly assigned to treatment groups. Method not stated Allocation concealment not reported Follow‐up: until discharged from hospital. No loss to follow‐up reported Power calculation for sample size: no Intention‐to‐treat analysis: no | |
| Participants | 101 women with a mean age of 45.9 (LAVH group) and 45.5 (TLH group) | |
| Interventions | LAVH versus TLH (a comparison of 2 LH techniques) TLH arm: same manner as the LAVH procedure above the uterine artery level. After dissection of the bladder flap and resection of the broad ligament, the uterine artery was coagulated by bipolar electrocoagulator and separated from the uterine sidewall by scissors. Bilateral desiccation and transection of the cardinal‐uterosacral ligament complex. Circular colpotomy was performed close to the cervix and uterus was removed through the vagina All operations performed under GA Surgeons: by the same gynaecologist for each procedure (LAVH by one surgeon and TLH by another) | |
| Outcomes | Operation time, blood loss, hospital stay, cost, complications and sexual symptoms | |
| Notes | Taiwan Kaohsiung Municipal Hsiao Kang Hospital Funding not reported | |
| Risk of bias | ||
| Bias | Authors' judgement | Support for judgement |
| Random sequence generation (selection bias) | Unclear risk | Not reported |
| Allocation concealment (selection bias) | Unclear risk | Not reported |
| Blinding (performance bias and detection bias) | High risk | Blinding not reported |
| Incomplete outcome data (attrition bias) | High risk | 13 dropouts (excluded from analysis after randomisation because of conversions to AH (n = 3), incomplete records (n = 7) or combined surgical procedures (n = 3)). No further loss to follow‐up reported |
| Selective reporting (reporting bias) | Unclear risk | Primary outcome not defined |
| Other bias | High risk | Analysis not according to intention‐to‐treat. Different surgeons for different procedures Women were randomised to treatment groups before a large number (i.e. 66) of the women were excluded. Therefore, the women in each treatment group may not have been a true representation of the original randomised groups |
| Methods | Multicentre (n = 3) study, parallel‐group design Duration: 2 years Randomisation: performed by the research nurse using a computer‐generated schedule Follow‐up: women asked to keep a diary of recovery 'milestones' and reviewed by the research nurse 4 weeks after surgery. EuroQol Health Questionnaire completed at 1, 6 and 12 months after surgery. The response rate for the patient questionnaire was 87% and that for EuroQol was 78%, 64% and 47% at 1, 6 and 12 months, respectively | |
| Participants | 190 women with a mean age of 42.7 years (AH group) and 41.1 (LH group) | |
| Interventions | AH versus LH. Operation procedures not reported Surgeons: performed by 5 consultant gynaecologists who have undertaken a minimum of 50 LH procedures | |
| Outcomes | Length of operation; length of hospital stay; admission to ITU; readmissions; women requiring additional surgery; blood transfusions; complications (major and minor); patient‐reported outcomes; costs and change in health status | |
| Notes | Scotland 3 hospitals in Glasgow Funding: Scottish Home and Health Department, Scotland | |
| Risk of bias | ||
| Bias | Authors' judgement | Support for judgement |
| Random sequence generation (selection bias) | Low risk | Computer‐generated |
| Allocation concealment (selection bias) | Low risk | By third party (research nurse) |
| Blinding (performance bias and detection bias) | High risk | Blinding not reported |
| Incomplete outcome data (attrition bias) | High risk | 10 dropouts were not analysed. 7 women did not attend surgery and 3 records were not available (< 10%) Loss to follow‐up: at 12 months only 47% of patients filled out the questionnaire |
| Selective reporting (reporting bias) | Unclear risk | Insufficient information available |
| Other bias | Low risk | No other bias identified |
| Methods | Multicentre study (n = 4), parallel‐group design Duration: October 1995 to November 1996 (1 year, 1 month) Randomisation: computer‐generated sequence Allocation concealment: not reported Blinding: no Follow‐up: until patient left hospital. Postoperative follow‐up included evaluation of pain on postoperative days 1, 2 and 3, length of postoperative hospital stay and evaluation of postoperative complications. No loss to follow‐up | |
| Participants | 116 women with a mean age of 49 years | |
| Interventions | AH versus LH (LAVH) AH arm: performed according to the technique described by Mattingly and Thompson Surgeon experience: not reported Postoperative medication consisted of the administration of ketorolac by intramuscular injection or by mouth every 6 hours for the first 24 hours | |
| Outcomes | Blood loss; postoperative fever; postoperative pain; length of postoperative hospital stay; postoperative complications; haemoglobin reduction and intra‐operative conversion to abdominal surgery | |
| Notes | Italy 4 university hospitals Funding not reported | |
| Risk of bias | ||
| Bias | Authors' judgement | Support for judgement |
| Random sequence generation (selection bias) | Low risk | Computer‐generated |
| Allocation concealment (selection bias) | Unclear risk | Not reported |
| Blinding (performance bias and detection bias) | High risk | Blinding not reported |
| Incomplete outcome data (attrition bias) | Low risk | No dropouts; no loss to follow‐up |
| Selective reporting (reporting bias) | Unclear risk | Insufficient information available |
| Other bias | Low risk | No other bias identified |
| Methods | 2‐centre study, parallel‐group design Duration of trial not stated Randomisation: computer‐generated in blocks of 10 Allocation concealment: sequentially numbered, sealed, opaque envelopes, opened by nursing staff immediately prior to surgery Follow‐up: follow‐up at 6 weeks and 6 months with completion of SF‐6 Short Form general health survey. Loss to follow‐up not clearly described | |
| Participants | 36 women with a mean age of 42 years | |
| Interventions | AH versus VH Surgeons: performed by most senior surgeon available | |
| Outcomes | Primary outcome: duration of hospital stay | |
| Notes | UK Royal Free and North Middlesex Hospitals Funding not reported | |
| Risk of bias | ||
| Bias | Authors' judgement | Support for judgement |
| Random sequence generation (selection bias) | Low risk | Randomised by computer |
| Allocation concealment (selection bias) | Low risk | Sealed, opaque envelopes |
| Blinding (performance bias and detection bias) | Low risk | Sham abdominal dressing until discharge |
| Incomplete outcome data (attrition bias) | Unclear risk | No dropouts; loss to follow‐up not clearly described |
| Selective reporting (reporting bias) | Low risk | Primary and secondary outcomes were adequately reported |
| Other bias | Low risk | No other bias identified |
| Methods | Multicentre study, parallel‐group design Duration: January 2005 to December 2005 (1 year) Randomisation: computer‐generated allocation list; in operating room Allocation concealment: numbered, sealed opaque envelopes Blinding: no Number of women eligible: 86. Number of women randomised = 81. There were no dropouts. Conversions to AH: 2 in LAVH group and 4 in minilaparotomy group Follow‐up: women were followed up until discharge. No loss to follow‐up Power calculation was performed for sample size. Actual sample size was necessary to detect a difference in complications between the 2 groups of 30% (complication rate 42% in control group) with 80% power with a significance level of 0.05 Intention‐to‐treat analysis was possible from data but not performed by authors on all outcomes | |
| Participants | 81 women with a mean age of 49 years in the LAVH group and 48 years in the minilaparotomy group Inclusion criteria: benign disease: myoma and/or abnormal uterine bleeding with and without adnexal masses. Contraindication for vaginal hysterectomy Exclusion criteria: uterine size greater than 700 g on ultrasound, previous midline incision, absolute contraindication to laparoscopy | |
| Interventions | LAVH versus minilaparotomy LAVH: 4‐port technique, laparoscopic dissection with bipolar forceps and scissors of either round and utero‐ovarian ligaments or infundibulo‐pelvic ligaments. Opening bladder flap, followed by vaginal hysterectomy. Uterosacral/cardinal ligament complex was anchored vaginally to vaginal vault. Laparoscopy at the end of the procedure Minilaparotomy: Trendelenburg position, 4 cm to 9 cm transverse incision, moving operative window with 3 retractors. Ligaments cut after electrocoagulation, whereas vascular pedicles clamped, ligated and cut. Vaginal vault abdominally closed with running suture and suspension to uterosacral/cardinal ligament complex Surgeons: experience not reported Prophylactic antibiotic treatment: first or second‐generation cephalosporin IV GA for both LAVH and mini‐laparotomy | |
| Outcomes | Primary outcome: overall complications Secondary outcomes: operative time; conversions; haemoglobin drop (day 1); VAS pain (day 1 and 2); time to return bowel function; hospital stay | |
| Notes | Italy 3 university hospitals in Rome Funding not reported | |
| Risk of bias | ||
| Bias | Authors' judgement | Support for judgement |
| Random sequence generation (selection bias) | Low risk | Computer‐generated list |
| Allocation concealment (selection bias) | Low risk | Numbered, sealed, opaque envelopes in operating room |
| Blinding (performance bias and detection bias) | High risk | Blinding not reported |
| Incomplete outcome data (attrition bias) | Low risk | No dropouts; no loss to follow‐up |
| Selective reporting (reporting bias) | Unclear risk | Insufficient information available |
| Other bias | Low risk | No other bias identified |
| Methods | Single‐centre, parallel‐group design Duration: not reported Randomisation: 1:1 ratio. Method not reported Blinding: no Follow‐up: 4 to 6 weeks after surgery, all patients returned for a gynaecological examination including vaginal ultrasound. 6 to 8 weeks after surgery patients were asked to complete an anonymous questionnaire if they considered the duration of their postoperative hospital stay and sick leave to have been adequate. In a subgroup of patients (TLH: n = 38; AH: n = 38), postoperative health status and quality of life were self assessed prospectively 1, 3 and 12 weeks after surgery using "The Medical Outcome Trust 36‐item Short‐Form Health Survey questionnaire". Loss to follow‐up not described | |
| Participants | 143 women with median age 48 years | |
| Interventions | AH versus LH (LH(a)) AH arm: antibiotics were not routinely prescribed in this group of patients. They underwent either a lower midline or Pfannenstiel incision. If the adnexa were to be removed, the infundibulopelvic ligaments were clamped, transected and ligated. In cases where the adnexa were not to be removed, the utero‐ovarian pedicles were transected and ligated. The anterior broad ligaments were divided down to the vesico‐vaginal junction and the bladder reflected to just below the vaginal cuff. The uterine vessels were divided close to the uterus. Following division of the cardinal and uterosacral ligaments, the uterus was excised. The vaginal cuff was closed with interrupted sutures and the peritoneal layers closed and attached to the top of vagina Surgeons: 2 out of 5 surgeons of senior registrar grade and specifically trained in LH(a). 2 out of 10 surgeons of senior registrar grade trained in AH | |
| Outcomes | Operating time (minutes); complications; postoperative pain relief; convalescence (sick leave); hospital stay; quality of life; economic analysis (cost) | |
| Notes | Sweden University Hospital of Sahlgrenska Funding: Goteborg Medical Society Fund, Swedish Medical Research Council | |
| Risk of bias | ||
| Bias | Authors' judgement | Support for judgement |
| Random sequence generation (selection bias) | Unclear risk | Not reported |
| Allocation concealment (selection bias) | Low risk | Sealed, opaque envelopes |
| Blinding (performance bias and detection bias) | High risk | Blinding not reported |
| Incomplete outcome data (attrition bias) | Unclear risk | No dropouts; loss to follow‐up unknown |
| Selective reporting (reporting bias) | Low risk | Primary outcomes clearly defined and reported |
| Other bias | Low risk | No other bias identified |
| Methods | Single‐centre study, parallel‐group design Duration: January 1996 to May 1998 (2 years, 5 months) Randomisation: computer‐generated numbers. Randomly allocated to one of 3 operating methods in 4 blocks of 30 to ensure a balanced number of patients throughout study period. Interim analysis done after 25 patients were randomised to each group Allocation concealment: sealed, opaque envelopes prepared by and successively opened by the research nurse Follow‐up: 2 weeks postoperatively in outpatient clinic for examination to detect complications and evaluate need for further sick leave. No loss to follow‐up | |
| Participants | 120 women with a mean age of 47 years (AH group), 49 years (VH group) and 48 years (LAVH group) | |
| Interventions | AH versus VH versus LH (LAVH) ‐ 3 treatment arms AH arm: the abdomen was opened and closed in different ways according to surgeon preference. The uterus was removed by extrafascial technique and the vagina closed and covered by peritoneum VH arm: the vault was injected with 20 ml of mepivacain/adrenalin before incision in order to minimise bleeding. The peritoneal folds were opened and ligaments and uterine vessels were divided. If at this time the uterine size did not allow easy exteriorisation, bisecting, coring, morcellation, enucleation or combinations of these volume‐reducing techniques were performed. The peritoneum was closed, followed by suturing of the sacrouterine ligaments and vaginal vault | |
| Outcomes | Duration of surgery, duration of anaesthesia, stay in hospital, recovery time, peri‐operative blood loss and complications | |
| Notes | Sweden Hospital of Helsingborg Funding: Thelma Zoegas Foundation and the Stig and Ragna Gorthons Foundation, Sweden | |
| Risk of bias | ||
| Bias | Authors' judgement | Support for judgement |
| Random sequence generation (selection bias) | Low risk | Randomised by computer |
| Allocation concealment (selection bias) | Low risk | Sealed, opaque envelopes |
| Blinding (performance bias and detection bias) | High risk | Blinding not reported |
| Incomplete outcome data (attrition bias) | Low risk | No dropouts; no loss to follow‐up |
| Selective reporting (reporting bias) | Low risk | Primary outcome defined |
| Other bias | Low risk | No other bias; no differences between the 3 groups regarding patients' characteristics. Surgeons' experience varied |
| Methods | Multicentre study (2 institutions) Duration: June 2007 to March 2011 (45 months) Randomisation: stratified by surgeon and uterine size (> or </= 12 weeks). Participants were assigned randomly according to a computer‐generated randomisation schedule with random block sizes Allocation concealment: not described Blinding: yes; patients were blinded to their assessment Number of women: randomised = 75 women. In both arms 6 cases dropped out before the intervention was performed Follow‐up: no loss to follow‐up Power calculation for sample size: yes, 23 participants per arm were needed to detect a difference of >/= 30 minutes in operating time between conventional versus robotic‐assisted TLH with 90% power and a significance level of 0.05 Intention‐to‐treat analysis applied (converted procedures analysed in original allocated arm) | |
| Participants | 53 women with a mean age of 45.6 and 43.8 respectively Inclusion criteria: >/= 18 years old, hysterectomy for benign conditions Exclusion criteria: suspected malignancy, medical illness that precluded laparoscopy, inability to give informed consent, morbid obesity (BMI > 44), or need for concomitant bowel resection | |
| Interventions | TLH and robotic‐assisted TLH Conventional: 4 ports Robotic‐assisted: performed with the Da Vinci Surgical System with an umbilical port for laparoscopic camera, one 10/12 mm port placed in the right of left subcostal area lateral to the rectus for suture introduction, 2 8 mm robotic ports placed in the bilateral lower quadrants and one 5 mm port 8 cm inferior to right or left subcostal margin The technique to perform the hysterectomy was performed in both arms in a standard fashion, with the entirety of the hysterectomy performed laparoscopically Surgeons: 5 experienced laparoscopists: 75 to 400 LH and at least 20 RH | |
| Outcomes | Primary outcomes: total case time from incision to closure Secondary outcomes: intra‐ and postoperative complications, the impact of surgery on daily living and narcotic use for 6 weeks | |
| Notes | USA Supported by a grant from the Cleveland Clinic Center for Surgical Innovation, Teaching and Education | |
| Risk of bias | ||
| Bias | Authors' judgement | Support for judgement |
| Random sequence generation (selection bias) | Low risk | Randomisation was stratified by surgeon and uterine size (> or </= 12 weeks). Participants were assigned randomly according to a computer‐generated randomisation schedule with random block sizes |
| Allocation concealment (selection bias) | Unclear risk | Allocation concealment not described |
| Blinding (performance bias and detection bias) | Low risk | Patients blinded to their assessment |
| Incomplete outcome data (attrition bias) | Low risk | No loss to follow‐up. In both arms 6 cases dropped out before the intervention was performed |
| Selective reporting (reporting bias) | Low risk | No reporting bias identified |
| Other bias | Low risk | No other bias. Stratified by surgeon and uterine size |
| Methods | Single‐centre study, parallel‐group design Duration: January 1997 to 30 September 1998 (1 year, 9 months) Randomisation: method not stated and allocation concealment not reported Blinding: no Follow‐up: until women were discharged from hospital. Postoperative pain was assessed 3 days after surgery. No loss to follow‐up | |
| Participants | 102 women with a mean age of 48 years | |
| Interventions | AH versus LH (TLH) Intravenous pain relief was given postoperatively | |
| Outcomes | Operating time; blood loss; postoperative pain; postoperative decrease in haemoglobin; complications and duration of postoperative hospital stay | |
| Notes | Italy Gynaecologic University Hospital of Palermo Funding not reported | |
| Risk of bias | ||
| Bias | Authors' judgement | Support for judgement |
| Random sequence generation (selection bias) | Unclear risk | Not reported |
| Allocation concealment (selection bias) | Unclear risk | Not reported |
| Blinding (performance bias and detection bias) | High risk | Blinding not reported |
| Incomplete outcome data (attrition bias) | Low risk | No dropouts; no loss to follow‐up |
| Selective reporting (reporting bias) | Unclear risk | Primary outcome not defined |
| Other bias | Low risk | No power calculation reported, no other bias identified |
| Methods | Multicentre study, parallel‐group design Duration: October 1996 to May 2003 (5 years, 6 months) Randomisation: block randomisation (according random table) Allocation concealment: sealed, opaque envelopes Power calculation for sample size: 60 patients per group were necessary to detect a difference between the 2 groups of 10 units or more on the PGWB with 90% power, a significance level of 0.05 and a dropout rate of 20% | |
| Participants | 119 women with a mean age of 44 years in both groups | |
| Interventions | AH versus LH(a) | |
| Outcomes | Primary outcome: psychological well being (questionnaires PGWB) | |
| Notes | Sweden 2 county hospitals, 2 central hospitals and 1 university hospital in the southeast Funding: grants from the Medical Research Council of South East Sweden | |
| Risk of bias | ||
| Bias | Authors' judgement | Support for judgement |
| Random sequence generation (selection bias) | Low risk | According to random table |
| Allocation concealment (selection bias) | Low risk | Sealed, opaque envelopes |
| Blinding (performance bias and detection bias) | High risk | No blinding |
| Incomplete outcome data (attrition bias) | Unclear risk | 1 dropout after randomisation and 5 lost to follow‐up were not analysed (1 LH and 5 AH group), i.e. < 5%. It is not clear how many women were lost to follow‐up after 6 months |
| Selective reporting (reporting bias) | Low risk | Primary outcome predefined |
| Other bias | Unclear risk | Only 9% of eligible patients were randomised |
| Methods | Single‐centre study, parallel‐group design Duration: March 1992 to October 1993 (1 year, 8 months) Randomisation: containing computer‐generated block randomisation numbers. Block size of 10 Allocation concealment: sealed envelopes Follow‐up: 6 weeks after surgery and until women return to work. No loss to follow‐up | |
| Participants | 80 women with a mean age of 46 years | |
| Interventions | AH + BSO versus LH (LAVH) + BSO Surgeons: operations performed by one of the authors. Experience unknown | |
| Outcomes | Operating time, blood loss, haemoglobin change, hospital stay, postoperative analgesia, complications, recovery time (subjective assessment of patient's general well being and return to normal activity) and cost | |
| Notes | UK St Thomas's Hospital, London Funding not reported | |
| Risk of bias | ||
| Bias | Authors' judgement | Support for judgement |
| Random sequence generation (selection bias) | Low risk | Randomised by computer |
| Allocation concealment (selection bias) | Low risk | Sealed, opaque envelopes |
| Blinding (performance bias and detection bias) | High risk | Blinding not reported |
| Incomplete outcome data (attrition bias) | Low risk | No dropouts; no loss to follow‐up |
| Selective reporting (reporting bias) | Unclear risk | Insufficient information available |
| Other bias | Low risk | No other bias reported. Surgeon's experience unknown, but all surgeries performed by 1 surgeon |
| Methods | Single‐centre study, parallel‐group design Duration: not reported Randomisation: method not stated Blinding: no Follow‐up: routinely up to 6 days. No loss to follow‐up | |
| Participants | 60 women with an overall mean age of 42.3 years (range 34 to 76 years) | |
| Interventions | AH versus VH versus LH (TLH) VH: by Heaney's technique LH (TLH): 10 mm laparoscope inserted at umbilicus, 2 5 mm secondary ports for laparoscopic instruments. Uterine mobiliser with blunt tip used to antevert uterus and delineate vaginal fornices. Round ligaments divided with monopolar forceps and vesico‐uterine fold divided with scissors and bladder mobilised until anterior vagina identified. Utero‐ovarian ligament and fallopian tube pedicles desiccated with bipolar forceps, then scissors division of broad ligament peritoneum. Uterine artery grasped, elevated and bipolar coagulated. Cardinal and uterosacral ligaments divided with monopolar forceps. Vagina entered posteriorly near cervico‐vaginal junction. 4 cm vaginal delineator outlined circumferentially the cervico‐vaginal junction and prevented loss of pneumoperitoneum. Monopolar forceps completed the circumferential culdotomy. Uterus removed vaginally (after morcellation if necessary). Laparoscopic vaginal vault interrupted suturing and suspended by suture attachment to uterosacral/cardinal pedicles, sutures being tied extracorporally | |
| Outcomes | Operative time; pre and postoperative haemoglobin; complications | |
| Notes | Brazil Sao Paulo University School of Medicine Hospital Funding: Foundation of Research Support from Sao Paulo State | |
| Risk of bias | ||
| Bias | Authors' judgement | Support for judgement |
| Random sequence generation (selection bias) | Unclear risk | Not reported |
| Allocation concealment (selection bias) | Unclear risk | Not reported |
| Blinding (performance bias and detection bias) | High risk | Blinding not reported |
| Incomplete outcome data (attrition bias) | Low risk | No dropouts; no loss to follow‐up |
| Selective reporting (reporting bias) | Unclear risk | Primary outcome not clearly defined |
| Other bias | Low risk | No other bias identified |
| Methods | Single‐centre study, parallel‐group design Duration: not reported Randomisation: random numbers table Blinding: no Follow‐up: 6 to 8 weeks after surgery, women completed a questionnaire on their recovery. All kept a prospective diary of their recovery for 6 weeks. No loss to follow‐up | |
| Participants | 45 women with a mean age of 41 years (LH group) and 45 years (VH group) | |
| Interventions | VH versus LH VH arm: modified Heaney approach | |
| Outcomes | Operating time; analgesia required; hospital stay; recovery time and postoperative complications | |
| Notes | UK Royal Free Hospital, London Funding not reported | |
| Risk of bias | ||
| Bias | Authors' judgement | Support for judgement |
| Random sequence generation (selection bias) | Low risk | Random numbers table |
| Allocation concealment (selection bias) | Unclear risk | Not reported |
| Blinding (performance bias and detection bias) | High risk | Blinding not reported |
| Incomplete outcome data (attrition bias) | Low risk | No dropouts; no loss to follow‐up |
| Selective reporting (reporting bias) | Unclear risk | Primary outcome not defined; insufficient information available |
| Other bias | Low risk | No other bias identified |
| Methods | Duration: April 2007 to June 2009 (2 years, 1 month) Randomisation and allocation: not reported Blinding: no. Randomisation was revealed to the surgeon before induction of anaesthesia Follow‐up: at 1, 3 and 6 months. 9 patients were lost to follow‐up and were not analysed and reported because they needed adenectomy or did not return for follow‐up Power calculation for sample size: yes was calculated using operative time as a primary outcome. With a type I error of 0.05 and a power of 80%, a sample size of 30 women in each arm was required No intention‐to‐treat analysis | |
| Participants | 90 women with a mean age of 41.9 in the TLH group, 43.4 in the LAVH group and 43.7 in the NDVH group Inclusion: benign pathology of uterus and not amenable to or failed medical therapy Exclusion: malignancy, PID, uterovaginal descent greater that first degree. Patients with contraindication for laparoscopy | |
| Interventions | TLH versus LAVH versus non‐descent VH (NDVH) TLH: 4 ports were made. A 10 mm umbilical port for laparoscope, 2 ports of 5 mm, 1 extra 10 mm port. All pedicles were coagulated and transected laparoscopically. Adnexa were preserved. The uterus was cut at the vault laparoscopically. Uterus was delivered vaginally and vault was sutured laparoscopically LAVH: the laparoscopic part included coagulation and transection of round ligament, ovarian ligament and medial end of tube followed by dissection of bladder peritoneum. The procedure was then completed vaginally: uterosacrale ligaments, cardinal ligaments and uterine vessels were ligated and transected. The uterus was extracted vaginally. Vaginal cuff sutured NDVH: incision was made in cervico‐vesical junction anteriorly. Bladder was pushed anteriorly and pouch of Douglas opened posteriorly. Uterosacral ligaments, Mackenrodt ligament, uterine vessels followed by round and ovarian ligament were clamped, transected. In cases of large uteri, bisection of the specimen or myomectomy was done. Vaginal cuff was sutured Surgeons: all procedures were performed by the same surgeon. Experience not reported | |
| Outcomes | Intra‐ and postoperative parameters Primary outcomes: total duration of surgery and blood loss Secondary outcomes: postoperative pain, febrile morbidity, infection, total duration of hospital stay, satisfaction (HRQOL and SF‐12) and sexual dysfunction (self developed questionnaire) | |
| Notes | India All India institute, New Delhi Funding: not reported | |
| Risk of bias | ||
| Bias | Authors' judgement | Support for judgement |
| Random sequence generation (selection bias) | Unclear risk | Not reported |
| Allocation concealment (selection bias) | Unclear risk | Not reported |
| Blinding (performance bias and detection bias) | High risk | Randomisation was revealed to surgeon just before induction of anaesthesia. Blinding of patients or researchers not reported |
| Incomplete outcome data (attrition bias) | High risk | No dropouts. Loss to follow‐up reported (n = 9; i.e. 10%) |
| Selective reporting (reporting bias) | Low risk | Patients who also underwent adnexal removal were excluded to minimise bias |
| Other bias | Low risk | No other bias identified |
| Methods | Single tertiary centre Duration: April 2008 to June 2010 (2 years, 1 month) Randomisation: computer‐based Allocation procedure: not reported Number of patients randomised = 23, number of patients analysed = 20. 3 dropouts: serum interleukin level could not be processed in 1 patient from each group; 1 patient had conversion to mini‐laparotomy Blinding: not reported Analysis by intention‐to‐treat: no; 1 conversion in the LAVH group was taken out of analysis and was not further reported Follow‐up: no loss to follow‐up Power calculation for sample size: to detect a difference of 1 standard deviation between interleukin level of the 2 groups of hysterectomy for a uterine size >/= 12 weeks, with type 1 error of 0.01 and a power of 80%, we calculated that 10 women needed to be operated in each group | |
| Participants | 20 women with a mean age of 41.6 years in the LAVH group and 43 years in the NDVH group Inclusion criteria: women with benign pathology of uterus who had estimated uterine weight between 300 g and 1500 g and were planned for hysterectomy Exclusion criteria: genital malignancy, acute pelvic inflammatory disease, utero‐vaginal descent greater than first degree and any contraindications for laparoscopy | |
| Interventions | Laparoscopic‐assisted vaginal hysterectomy (LAVH) versus non‐descent vaginal hysterectomy (NDVH) LAVH: 4 ports were made. A 10 mm port was placed at umbilicus for laparoscope. 3 other ports were placed in the lowed abdomen. The laparoscopic part included coagulation and transection of round ligament and transection of bladder peritoneum. When preservation of adnexa was needed, the fallopian tube and ovarian ligament were coagulated and transected. In cases where salpingo‐oophorectomy was needed, the infundibulopelvic ligament was isolated, coagulated and transected. The procedure was completed vaginally. The anterior and posterior cul‐de‐sac were opened. The cardinal ligaments, uterosacral ligaments and the uterine vessels were ligated and transected. The uterus was extracted vaginally. Vaginal cuff was closed NDVH: incision was made in cervico‐vesical junction anteriorly. Bladder was pushed anteriorly and pouch of Douglas opened posteriorly. The uterosacral ligaments, cardinal ligaments, uterine vessels followed by round and ovarian ligaments were clamped, cut and ligated. After clamping uterine arteries, uterus was bisected and myomectomy done to reduce the bulk of the uterus. Vaginal cuff was closed Surgeons: all procedures performed by the same surgeon. Experience not reported Antibiotic and thrombo prophylaxis not specified | |
| Outcomes | Primary: venous blood levels of IL‐6 preoperatively and 3, 24 and 72 hours after surgery Secondary: blood loss, operating time, postoperative analgesia requirement, hospital stay and morbidity | |
| Notes | India All India institute, New Delhi Funding: not reported | |
| Risk of bias | ||
| Bias | Authors' judgement | Support for judgement |
| Random sequence generation (selection bias) | Unclear risk | Randomisation: computer‐based, but not further specified |
| Allocation concealment (selection bias) | Unclear risk | Allocation procedure not reported |
| Blinding (performance bias and detection bias) | High risk | Blinding not reported |
| Incomplete outcome data (attrition bias) | High risk | Dropouts: n = 3, i.e. 15%. No loss to follow‐up |
| Selective reporting (reporting bias) | Unclear risk | Since the study focused mainly on tissue trauma, 1 patient who underwent a conversion to mini‐laparotomy was excluded from the final analysis |
| Other bias | Unclear risk | Analysis by intention‐to‐treat: not reported |
| Methods | Single‐centre Duration: 2008 to 2011 (3 years) Randomisation: the randomisation scheme was generated by using the website www.randomization.com Allocation concealment: not reported Blinding: patients could not be blinded because the robot surgery took place in another building Number of women: 100 patients randomised; 95 completed the study Follow‐up: loss to follow‐up not described Power calculation for sample size: not performed Analysis by intention‐to‐treat | |
| Participants | 95 patients with a mean age of 45.8 years in the conventional group and 46.3 years in the robot‐assisted group Inclusion criteria: indication for hysterectomy because of benign lesions if vaginal hysterectomy was expected to be difficult because of myomas or nulliparity. Uterus weight less than 500 g Exclusion criteria: not reported | |
| Interventions | Robot‐assisted LH versus conventional LH RALH: a 3‐armed daVinci standard surgical robot was used cLH: a 10 mm optical port and 3 5 mm working trocars were used Both procedures performed according the same standard operating procedure Antibiotic prophylaxis: cefazoline 2 g Surgeons: 2 senior gynaecologists experienced in laparoscopic surgery, performing at least 50 laparoscopic LH and 30 RH per year. The surgical team consisted of a console surgeon, a bedside assistant and a surgical nurse No conversions to laparotomy | |
| Outcomes | Primary outcomes: surgical outcome (time to hospital discharge) and quality of life | |
| Notes | Switzerland Cantonal Hospital, Aarau Funding not reported | |
| Risk of bias | ||
| Bias | Authors' judgement | Support for judgement |
| Random sequence generation (selection bias) | Low risk | The randomisation scheme was generated by using the website www.randomization.com |
| Allocation concealment (selection bias) | Unclear risk | Not reported |
| Blinding (performance bias and detection bias) | High risk | Patients could not be blinded because the robot surgery took place in another building |
| Incomplete outcome data (attrition bias) | Unclear risk | No dropout. Follow‐up not described |
| Selective reporting (reporting bias) | Low risk | Primary and secondary outcomes predefined and reported as such |
| Other bias | Low risk | No other bias identified |
| Methods | Single‐centre study, parallel‐group design Duration: August 1995 to December 1997 (2 years, 4 months) Randomisation: computer‐generated randomisation list Allocation concealment: concealment by telephone inquiry Blinding: no Follow‐up: following discharge from hospital the women received a self administered questionnaire to evaluate their recuperation over a period of 12 months. 35 women (72.9%) answered the questionnaire, 20 of 28 (71.4%) in the LAVH group and 15 of 20 (75%) in the AH group | |
| Participants | 48 women with median age of 48 years | |
| Interventions | AH versus LH (LH(a)) | |
| Outcomes | Primary outcome: length of stay in hospital Secondary outcomes: operating time; postoperative pain; blood loss and recovery time until return to full work activity | |
| Notes | Germany Friedrich Schiller University, Jena Funding not reported | |
| Risk of bias | ||
| Bias | Authors' judgement | Support for judgement |
| Random sequence generation (selection bias) | Low risk | Computer‐generated list |
| Allocation concealment (selection bias) | Low risk | Telephone inquiry |
| Blinding (performance bias and detection bias) | High risk | Blinding not reported |
| Incomplete outcome data (attrition bias) | High risk | No dropouts; loss to follow‐up: 75% and 78% (i.e. > 15% loss to follow‐up), respectively, answered the questionnaire after 12 months |
| Selective reporting (reporting bias) | Low risk | No reporting bias identified |
| Other bias | Unclear risk | Surgeons' experience was not clear |
| Methods | Single‐centre study, parallel‐group design Duration: January 1997 to January 2001 (4 years) Randomisation: computer‐generated randomisation unknown to the surgeons Blinding: no Follow‐up: telephone interviews 2 months after discharge to determine the number of days before going back to normal activities. No loss to follow‐up Power calculation for sample size: no | |
| Participants | 122 women with a mean age of 46.3 (LH(a) group) and 47.3 (AH group) | |
| Interventions | AH versus LH (LH(a)) | |
| Outcomes | Operating time, laparo‐conversions, blood loss, haemoglobin drop, fever, transfusions, hospital stay and convalescence | |
| Notes | Italy S Orsola Hospital, University of Bologna Funding not reported | |
| Risk of bias | ||
| Bias | Authors' judgement | Support for judgement |
| Random sequence generation (selection bias) | Low risk | Computer‐generated |
| Allocation concealment (selection bias) | Unclear risk | Allocation reported as "unknown to surgeons" |
| Blinding (performance bias and detection bias) | High risk | Blinding not reported |
| Incomplete outcome data (attrition bias) | Low risk | No dropouts; no loss to follow‐up |
| Selective reporting (reporting bias) | Unclear risk | Primary outcome not defined |
| Other bias | Low risk | No other bias identified |
| Methods | Single‐centre study, 3 parallel‐groups Duration: May 2005 to September 2007 (2 years, 4 months) Randomisation: computer‐generated list Allocation concealment: serially numbered, opaque, sealed envelopes Blinding: patients were not blinded. Those performing the surgical procedures did not know which patients had been included in the study and those assessing the outcomes were blinded to the group assignment Number of women eligible 189, number of women randomised 150. There were no dropouts Follow‐up: no loss to follow‐up Power calculation for sample size: yes, 36 patients in each group were necessary to detect a difference of more than 24 hours in discharge time with an alpha error level of 5% and a beta error of 80% Analysis was by intention‐to‐treat (no conversions) | |
| Participants | 50 women in the VH group (mean age 47.8 years) 50 women in the LAVH group (mean age 49.0 years) 50 women in the mini‐laparotomy (mini‐LPT) group (mean age 47.7 years) Inclusion criteria: symptomatic or rapidly growing myomas, age less than 55 years and uterine size greater than or equal to 12 weeks of gestation Exclusion criteria: nulliparous women, uterine size greater than or equal to 16 weeks, previous uterine surgery and suspicion of malignant gynaecological disease | |
| Interventions | VH versus LAVH versus mini‐LPT VH: as described by Dargent in 2004. If the uterine size did not allow easy exteriorisation, bisecting, coring, morcellation, enucleation of myomas or combinations of these volume‐reducing techniques were performed LAVH: type ID (dissection up to but not including uterine arteries plus anterior structures, and posterior culdotomy) according to the AAGL Classification System for Laparoscopic Hysterectomy Mini‐LPT: performed using a 4 cm to 7 cm suprapubic incision. The subcutaneous fat and the abdominal fascia were transversely opened 2 cm above the skin incision. The abdominal muscle and the parietal peritoneum were longitudinally opened on the midline Antibiotics: all patients received intraoperative prophylactic antibiotic therapy (ampicillin sodium/sulbactam sodium combination 2 g). Intravenous pain relief was given postoperatively Surgeons: all procedures were performed by 2 equally skilled and experienced surgeons using identical techniques | |
| Outcomes | Primary outcome: difference in hospital discharge time (measured in hours) among the 3 procedures Secondary outcomes: operating time, blood loss, paralytic ileus time, intraoperative complications, febrile morbidity, intensity of postoperative pain and early postoperative complications | |
| Notes | Italy Tor Vergata University Hospital, Rome Funding not reported | |
| Risk of bias | ||
| Bias | Authors' judgement | Support for judgement |
| Random sequence generation (selection bias) | Low risk | Computer‐generated list |
| Allocation concealment (selection bias) | Low risk | Sealed, opaque envelopes |
| Blinding (performance bias and detection bias) | Unclear risk | Those assessing the outcomes were blinded to the group assignment; patients were not blinded |
| Incomplete outcome data (attrition bias) | Low risk | No dropouts; no loss to follow‐up |
| Selective reporting (reporting bias) | Low risk | Primary and secondary outcomes (pre)defined and accordingly reported |
| Other bias | Low risk | Procedures were performed by 2 equally skilled and experienced surgeons using identical techniques |
| Methods | Single‐centre study, parallel‐group design Duration: April 2003 to June 2005 (2 years, 2 months) Randomisation: numbered, sealed, opaque envelopes based on a computer‐generated list Blinding: those who performed surgical procedures did not know which patients undergoing surgery had been included in the study. Those assessing the outcomes were blinded to the group assignments Number of women eligible = 89; 9 women refused to participate and 80 patients were included (40 in each group). There were no conversions or dropouts Follow‐up: women were followed up until 30 days after surgery. No loss to follow‐up Power calculation for sample size: yes, at least 26 patients in each group were necessary to detect a difference of more than 24 hours in discharge time with a significance level of 0.05% and a power of 80% | |
| Participants | 80 women with a mean age of 49 years in the VH group and 48 years in the LAVH group Inclusion criteria: symptomatic or rapidly growing myomas, age < 55 years, uterine size at least 12 weeks gestation Exclusion criteria: nulliparous women, uterine size greater than 16 weeks gestation, previous uterine surgery, suspicion of malignant gynaecological disease | |
| Interventions | VH versus LAVH VH: as described by Dargent in 2004. If the uterine size did not allow easy exteriorisation, bisecting, coring, morcellation, enucleation of myomas or combinations of these volume‐reducing techniques were performed LAVH: type ID (dissection up to but not including uterine arteries plus anterior structures and posterior culdotomy) according to the AAGL Classification System for Laparoscopic Hysterectomy Antibiotics: patients in both groups received prophylactic antibiotic therapy by an ampicillin sodium/sulbactam sodium combination Type of anaesthesia not mentioned for VH Surgeons: all procedures performed by the same 2 surgeons using the same technique. Surgeon experience not mentioned | |
| Outcomes | Primary outcomes: discharge time as measured in hours after surgery. The patients were discharged from the hospital when they were tolerant of a normal diet, able to dress themselves, fully mobile, apyrexial and not requiring analgesics Secondary outcomes: differences in operation time, blood loss, paralytic ileus time, febrile morbidity (body temperature 38°C in 2 consecutive measurements 4 hours apart), intensity of pain, early postoperative complications (any unfavourable episode occurring within 30 days after surgery requiring readmission, blood transfusion or repeat surgery) | |
| Notes | Italy Tor Vergata University Hospital Research funds by the Italian Ministry of Education | |
| Risk of bias | ||
| Bias | Authors' judgement | Support for judgement |
| Random sequence generation (selection bias) | Low risk | Computer‐generated list |
| Allocation concealment (selection bias) | Low risk | Numbered, sealed, opaque envelopes |
| Blinding (performance bias and detection bias) | Unclear risk | Those assessing the outcomes were blinded to the group assignments; patients not blinded |
| Incomplete outcome data (attrition bias) | Low risk | No dropouts; no loss to follow‐up |
| Selective reporting (reporting bias) | Low risk | Primary and secondary outcomes (pre)defined and accordingly reported |
| Other bias | Low risk | No other bias identified |
| Methods | Parallel‐group design Duration: July 2004 to January 2005 (6 months) Randomisation: not reported Blinding: not reported Follow‐up: women were followed up until 1 month after surgery. The return rate of the questionnaires at 1 month was 100% | |
| Participants | 60 women. Mean age 45 years in both groups | |
| Interventions | VH and TAH | |
| Outcomes | Primary outcome: quality of life (questionnaire SF‐36) | |
| Notes | Brazil It is unclear from which hospital(s) the women were recruited Funding not reported The subscales and score ranges of the questionnaire SF‐36 are not in agreement with the international standard | |
| Risk of bias | ||
| Bias | Authors' judgement | Support for judgement |
| Random sequence generation (selection bias) | Unclear risk | Not reported |
| Allocation concealment (selection bias) | Unclear risk | Not reported |
| Blinding (performance bias and detection bias) | High risk | Blinding of patients not reported. The interviewer at 1 month after surgery was blinded |
| Incomplete outcome data (attrition bias) | Low risk | No dropouts; no loss to follow‐up |
| Selective reporting (reporting bias) | Low risk | No reporting bias identified |
| Other bias | Unclear risk | The subscales and score ranges of the questionnaire SF‐36 were not in agreement with the international standard |
| Methods | Single‐centre Duration: January 2010 to January 2011 (12 months) Randomisation: patients were randomly assigned 1:1 with the use of a computer‐generated schedule to undergo LESS LAVH or multi‐port LAVH. Randomisation was performed in permuted blocks of 4 with random variation of the blocking number Allocation procedure: a research nurse prepared all numbered, opaque, sealed envelopes Number of women 40 women randomised, 39 women analysed. 1 SP‐LH procedure converted Follow‐up: 1 woman assigned to multi‐port was lost to follow‐up Power calculation for sample size: yes, on the basis of the difference in primary outcome. Assuming a standard deviation of 2 points for the BIS or CS score, allowing 5% dropout rate, they estimated that 20 patients would be needed per group | |
| Participants | 39 women with a mean age of 44.6 and 43.5 respectively Inclusion criteria: patients who had an indication for hysterectomy, no evidence of gynaecologic malignancy, appropriate medical status for laparoscopic surgery (ASA 1 or 2) Exclusion criteria: age </= 18 years, uterine size > 20 weeks, recent diagnosis of cancer, inability to understand and provide written informed consent | |
| Interventions | SP‐LH versus conventional multi‐port LAVH Multi‐port: after the primary 12 mm trocar was placed at the umbilicus, a 5 mm trocar was placed in each lower quadrant, lateral to the inferior epigastric artery Surgeons: all procedures by a single surgeon with experience of more than 500 LH and 200 SP‐LH | |
| Outcomes | Primary outcomes: cosmetic satisfaction 1, 4 and 24 weeks after surgery Secondary outcomes: operative time, perioperative complications and postoperative hospital stay | |
| Notes | Korea Samsung Medical Center, Seoul Supported by grant CRS 110‐09‐1 from Samsung Medical Center | |
| Risk of bias | ||
| Bias | Authors' judgement | Support for judgement |
| Random sequence generation (selection bias) | Low risk | Randomly assigned 1:1 with the use of a computer‐generated schedule to undergo LESS LAVH or multi‐port LAVH. Randomisation was performed in permuted blocks of 4 with random variation of the blocking number |
| Allocation concealment (selection bias) | Low risk | A research nurse prepared all numbered, opaque, sealed envelopes |
| Blinding (performance bias and detection bias) | High risk | Blinding not reported |
| Incomplete outcome data (attrition bias) | Low risk | Loss to follow‐up/conversions reported (< 5%) |
| Selective reporting (reporting bias) | Low risk | No reporting bias |
| Other bias | Low risk | No other bias identified |
| Methods | Single‐centre study, parallel‐group design Duration: January 1999 to December 1999 (1 year) Randomisation: pre‐determined computer‐generated randomisation code Follow‐up: until women were discharged from hospital | |
| Participants | 80 women with a mean age of 49 years | |
| Interventions | VH versus LH (LH(a)) | |
| Outcomes | Uterine weight; operative time; haemoglobin drop; postoperative complications; blood loss; pain relief and hospital stay | |
| Notes | France Hopital Hotel‐Dieu, Paris Funding not reported | |
| Risk of bias | ||
| Bias | Authors' judgement | Support for judgement |
| Random sequence generation (selection bias) | Low risk | Computer‐generated randomisation code |
| Allocation concealment (selection bias) | Unclear risk | Not reported |
| Blinding (performance bias and detection bias) | High risk | Blinding not reported |
| Incomplete outcome data (attrition bias) | Low risk | No dropouts; no loss to follow‐up |
| Selective reporting (reporting bias) | Unclear risk | Outcomes not clearly defined; insufficient information available |
| Other bias | Low risk | Surgeons' experience not specified. No other possible bias identified |
| Methods | Single‐centre study, parallel‐group design Duration: June 1991 to February 1992 (9 months) Randomisation: computer‐generated randomisation numbers Follow‐up: postoperative follow‐up consisted of a telephone call by the attending surgeon on the evening of surgery and the first 2 postoperative days. Patients were then seen 1 and 6 weeks postoperatively in the outpatient clinic | |
| Participants | 56 women with a mean age of 38 years Exclusion criteria: 1) A concomitant anterior or posterior colporrhaphy was required; 2) cervical conisation was performed within the previous 48 hours; and 3) additional antibiotic prophylaxis was required for valvular heart disease. They were also excluded if they had absolute contraindications to laparoscopy, such as 1) any condition that could not tolerate anaesthesia, 2) severe bleeding disorder, 3) acute peritonitis of the upper abdomen and uterine myomata or 4) a pelvic mass larger than 16 gestational weeks in size | |
| Interventions | VH versus LH (LH(a)) VH arm: anaesthesiologist's choice of general or regional anaesthesia. A modified Heaney technique was performed using O‐coated polyglycolic acid suture for all pedicles. The vaginal cuff was closed in all cases All received pre‐operative antibiotic prophylaxis (cefazolin 2 g) intravenously. If allergic to penicillin, 200 mg dose of doxycycline intravenously was used | |
| Outcomes | Operating time, blood loss, anaesthesia time, intra‐operative complications, febrile morbidity, pain relief and costs | |
| Notes | USA Gynecology clinic, University of Tennessee, Memphis Funding not reported | |
| Risk of bias | ||
| Bias | Authors' judgement | Support for judgement |
| Random sequence generation (selection bias) | Low risk | Computer‐generated numbers |
| Allocation concealment (selection bias) | Unclear risk | Not reported |
| Blinding (performance bias and detection bias) | High risk | No blinding |
| Incomplete outcome data (attrition bias) | Unclear risk | No dropouts, loss to follow‐up not reported |
| Selective reporting (reporting bias) | Unclear risk | Primary outcome not defined |
| Other bias | Unclear risk | No intention‐to‐treat analysis, no power calculation. Procedures performed by different group of surgeons |
| Methods | Multicentre study (n = 3), parallel‐group design Duration: not reported Randomisation: computer‐generated randomisation list Number of women randomised = 67, number analysed = 65. 2 women who were randomised refused their assigned procedure and they were removed from the study and their random numbers discarded Follow‐up: 2 and 6 weeks postoperatively in the outpatient office. No loss to follow‐up | |
| Participants | 65 women with a mean age of 38.3 (LH(a) group) and 41.5 (AH group) Exclusion criteria: concomitant colporrhaphy, urethropexy, vaginal vault suspension or a non‐gynaecologic major operation required. Medical conditions requiring in‐hospital monitoring or if they had known cervical or endometrial cancer. Candidates were also excluded if they had absolute contraindications to operative laparoscopy, including: 1) uterine leiomyomas or pelvic masses greater than 18 gestational weeks in size, 2) conditions making them intolerant to anaesthesia, 3) severe bleeding disorders, 4) acute periodontitis of the upper abdomen with severe distension, or 5) a midline abdominal hernia | |
| Interventions | AH versus LH (LH(a)) LH(a) arm: 3 12 mm trocars were used, one placed infra umbilically and one placed in each lower quadrant approximately 6 cm to 8 cm above the pubic rami, lateral to the inferior epigastric arteries. A Hulka tenaculum was used to manipulate the uterus. The bladder flap was developed by incising the vesicouterine fold of peritoneum and dissecting the bladder below the cervix. The ureters were then identified and mobilised using linear incisions in the medial leaf of the broad ligament, midway between the uterosacral ligaments and infundibulopelvic vessels AH arm: modified Richardson technique Surgeon experience: not reported | |
| Outcomes | Operating time; blood loss; intra‐operative and postoperative complications; hospital stay; febrile morbidity; requirement for analgesia; recovery time; conversion to abdominal hysterectomy and costs | |
| Notes | USA University of Tennessee, Memphis; Bowman Gray School of medicine, Winston‐Salem, North Carolina; University of North Carolina, Chapel Hill Funding: US Surgical Corporation, Norwalk, Connecticut USA | |
| Risk of bias | ||
| Bias | Authors' judgement | Support for judgement |
| Random sequence generation (selection bias) | Low risk | Computer‐generated |
| Allocation concealment (selection bias) | Low risk | Sealed, opaque envelopes |
| Blinding (performance bias and detection bias) | High risk | No blinding |
| Incomplete outcome data (attrition bias) | Low risk | 2 women refused assigned procedure and were excluded from analysis No loss to follow‐up |
| Selective reporting (reporting bias) | Unclear risk | Primary outcome not defined |
| Other bias | Unclear risk | Analysis not according to intention‐to‐treat Funding from pharmaceutical or surgical instrumentation company |
| Methods | Single‐centre study, parallel‐group design Duration: August 1997 to March 1999 (1 year, 6 months) Randomisation: computer‐generated random number sequence Blinding: no Follow‐up: duration not specified Not analysed on intention‐to‐treat basis ‐ 2 LAVHs converted to AH analysed as AH | |
| Participants | 200 women with a mean age of 46.9 years (AH) and 46.7 years (LAVH) | |
| Interventions | AH versus LH (LAVH) Surgeons' experience: 2 attending doctors performed all hysterectomies, each with an experience of more than 50 laparoscopic procedures | |
| Outcomes | Operating time; complications; duration of hospital stay | |
| Notes | Taiwan University and municipal hospital in Kaohsuing Funding not reported | |
| Risk of bias | ||
| Bias | Authors' judgement | Support for judgement |
| Random sequence generation (selection bias) | Low risk | Computer‐generated |
| Allocation concealment (selection bias) | Unclear risk | Not reported |
| Blinding (performance bias and detection bias) | High risk | Blinding not reported |
| Incomplete outcome data (attrition bias) | Unclear risk | No dropouts, loss to follow‐up unclear. Follow‐up period not specified |
| Selective reporting (reporting bias) | Unclear risk | Primary outcome not defined |
| Other bias | High risk | Analysis not according to intention‐to‐treat (with 2 conversions from LH to AH). No power calculation reported. Surgeons' experience not reported. AH technique not reported |
| Methods | Single‐centre study, parallel‐group design Duration: January 1996 to June 1996 (6 months) Randomisation: computer‐generated sequence of random numbers Analysis by intention‐to‐treat was reported | |
| Participants | 44 women with a median age of 44 (LH(a) group) and 43 (AH group) | |
| Interventions | AH versus LH (LH(a)) Surgeon experience: not reported | |
| Outcomes | Operation time; blood loss; postoperative stay and postoperative complications | |
| Notes | Hong Kong Chinese University Funding: direct grant for research from the Chinese University of Hong Kong | |
| Risk of bias | ||
| Bias | Authors' judgement | Support for judgement |
| Random sequence generation (selection bias) | Low risk | Computer‐generated |
| Allocation concealment (selection bias) | Unclear risk | Not reported |
| Blinding (performance bias and detection bias) | High risk | Blinding not reported |
| Incomplete outcome data (attrition bias) | Unclear risk | 4 dropouts were not analysed (4 declined the operation) and 2 lost to follow‐up (refused to participate postoperatively). This is 5% to 10% of the sample |
| Selective reporting (reporting bias) | Unclear risk | Primary outcome not defined. Dropouts were not analysed |
| Other bias | Low risk | No other bias identified |
| Methods | Single‐centre Duration: 2004 to 2007 (3 years) Randomisation: not reported Allocation concealment: not reported Blinding: not reported Number of women: 101 women were randomised to 3 groups (34 LAVH, 35 TVH, 32 TAH). Dropouts not reported Follow‐up: duration not specified Power calculation for sample size: not reported | |
| Participants | 69 women Inclusion criteria: patients of reproductive age and who had delivered at least 1 child. No adnexal disease, no gynaecological surgery history | |
| Interventions | TAH versus LAVH versus TVH TAH: performed utilising a standard technique LAVH: performed in a modified lithotomy position using a video‐monitor to record the laparoscopic part of the operation. A 10 mm scope was inserted subumbilically. Second and third entries were made suprapubically and on both sides. Round ligaments, tubes and utero‐ovarian ligaments were diathermy and cut. In some cases the adnexa were also removed and others were to be preserved. The uterovesical fold of the peritoneum was divided by scissors. The uterine artery and the partial cardinal and uterosacral ligament were diathermy and cut. The cervix was circumcised and the pouch of Douglas opened to allow ligation and division of the partial cardinal and uterosacral ligament, as in a traditional vaginal hysterectomy. No conversions Surgeons: 2 senior gynaecologists performed all operations | |
| Outcomes | Operation time, blood loss, pain score (VAS), bowel recovery time, fever, postoperative morbidity, hospital stay | |
| Notes | China Peking Union Medical College hospital, Beijing Funding: not reported | |
| Risk of bias | ||
| Bias | Authors' judgement | Support for judgement |
| Random sequence generation (selection bias) | Unclear risk | Not reported |
| Allocation concealment (selection bias) | Unclear risk | Not reported |
| Blinding (performance bias and detection bias) | High risk | Not reported |
| Incomplete outcome data (attrition bias) | Unclear risk | Dropout not mentioned. From tables it seems that there was no loss to follow‐up, but follow‐up procedure was not specified |
| Selective reporting (reporting bias) | Unclear risk | Primary and secondary outcomes not defined |
| Other bias | High risk | Procedures really comparable as in 2 of the 3 groups salpingo‐oophorectomy was also performed. Pain score results must be interpreted with caution as different analgesics were used during the operation and postoperatively |
AAGL: American Association of Gynecologic Laparoscopists
AH: abdominal hysterectomy
aLH = laparoscopic cases in the abdominal arm of the eVALuate trial
ASA: American Society of Anaesthesiologists
BDI: Beck Depression Inventory
BIS: Body Image Scale
BMI: body mass index
BSO: bilateral oophorectomy
cLH: conventional laparoscopic hysterectomy
CRP: C‐reactive protein
CS: Cosmetic Scale
DVT: deep vein thrombosis
GA: general anaesthesia
GIA: not an abbreviation; refers to a registered trademark (stapler device)
HRQOL: health‐related quality of life
HRT: hormone replacement therapy
IL‐6: interleukin 6
ITU: intensive therapy unit
IV: intravenous
LAVH: laparoscopic‐assisted vaginal hysterectomy
LAVHO: laparoscopy‐assisted vaginal hysterectomy with bilateral oophorectomy
LH(a): hysterectomy where the procedure is done laparoscopically up to and including the uterine vessels and the remaining part vaginally
NDVH: non‐descent vaginal hysterectomy
NSAID: nonsteroidal anti‐inflammatory drug
PGWB: Psychological General Well Being
PID: pelvic inflammatory disease
RALH: robot‐assisted laparoscopic hysterectomy
SD: standard deviation
SP: single‐port
STAI: State‐Trait Anxiety Inventory
TAH: Total Abdominal Hysterectomy
TVH: Total Vaginal Hysterectomy
TLH: total laparoscopic hysterectomy
VAS: visual analogue scale
VE: vaginal examination
VH: vaginal hysterectomy
VHO: vaginal hysterectomy with bilateral oophorectomy
vLH: laparoscopic cases in the vaginal arm of the eVALuate trial
WHO: World Health Organization
WHQ: Women’s Health Questionnaire
Characteristics of excluded studies [ordered by study ID]
| Study | Reason for exclusion |
| Randomised trial comparing AH without colporrhaphy versus VH with colporrhaphy (n = 30). The complication profile for hysterectomy with colporrhaphy is different to hysterectomy without colporrhaphy. Inclusion of this trial and pooling for meta‐analysis would introduce undue clinical heterogeneity. Operation time was longer and hospital stay shorter in VH with colporrhaphy, compared with AH | |
| Non‐randomised comparison of VH and AH for women with moderately enlarged uterus. Women undergoing VH had less blood loss, a smaller haemoglobin drop and a shorter hospital stay | |
| Randomised trial of LAVH versus AH (n = 46), but no intention‐to‐treat analysis. Authors did not measure any of our pre‐specified outcomes, focusing on tissue trauma (laboratory findings). There was one conversion to laparotomy in the laparoscopy group and a bladder lesions and a thrombophlebitis in the AH group. These patients were excluded from analysis. Lower CRP and CPK were found after LAVH | |
| Although presented as a randomised study, this was a comparison between a first sample of 100 patients treated with hysterectomy by laparotomy and a second sample of 100 patients treated with laparoscopic hysterectomy | |
| There was not sufficient information available to decide that this was a randomised controlled study. Although in the discussion it was mentioned that this was a randomised study, this could not be confirmed in the description of the design of the study | |
| This study was not a randomised controlled study. Study assessed hysterectomy techniques and the rate of total laparoscopic hysterectomy (TLH) | |
| Women included in another publication on the same outcome measures | |
| There was not sufficient information available to decide that this was a randomised controlled study. No further data provided by author after request | |
| Randomised trial of LH(a) (n = 15) versus TLH (n = 15) versus AH (n = 15) mainly focusing on tissue trauma by measuring IL‐6 and CRP. Lower values for both tissue trauma parameters were observed in LH(a) and TLH compared to AH 24 hours postoperatively | |
| It appeared that only part of the collected data (i.e. 2 instead of 3 intervention groups) were reported in the study published in 2006, which was included in the 2009 update of this review. In a paper published in 2010, 3 intervention groups were reported, including the 2 described in the paper of 2006 and the missing third group. However, the study design (e.g. randomisation procedure) was insufficiently described to clarify this discrepancy. After requesting from the authors more information on the study design, we received too little information to assess the study for inclusion and exclusion criteria. Therefore, we excluded both papers from 2006 and 2010 from this review | |
| See Drahonovsky 2006 | |
| No comparison between routes of hysterectomy; women were randomised to have a drain or no drain after VH | |
| Randomised trial of TLH versus AH (n = 74), but did not measure any of our pre‐specified outcomes, focusing on psychological well being. No differences were found | |
| This randomised controlled study was excluded because 40 out of 68 included patients had surgery for non‐benign indications. The data on the 28 patients with benign indications were not reported separately | |
| No comparison between different routes of hysterectomy; this randomised, double‐blind study compared 2 laparotomy techniques: transverse muscle‐cutting Maylard incision and the Pfannenstiel incision for AH | |
| Women included in another publication on the same outcome measures | |
| Randomised controlled trial (n = 70) but compared 2 variants of LAVH (described in the study as LAVH and VALH (vaginally assisted laparoscopic hysterectomy) respectively), rather than comparing LAVH with another surgical approach. In LAVH, the round ligament, upper broad ligament, infundibulopelvic or uteroovarian ligament, bladder pillars in preparation of the bladder flap were taken laparoscopically; the uterine vessels, cardinal‐uterosacral ligaments, anterior and posterior culdotomy and vaginal cuff closure were taken vaginally. In VALH, all steps were performed laparoscopically, other than taking the uterine vessels and vaginal cuff closure, which were performed vaginally. Operation time shorter for VALH (mean 81.33 versus 89.47 minutes, P value = 0.01), with no other significant differences in outcomes reported | |
| Randomised controlled trial (n = 541) but compared 2 variants of colpotomy in LAVH (vaginal and laparoscopic approach), rather than comparing LAVH with another surgical approach. The vaginal approach was associated with significantly fewer urinary tract injuries as compared with the laparoscopic approach (9/274 and 1/267 respectively) | |
| Not a randomised controlled study. Allocated to study groups based on the attending physician scheduled for the case. Intervention: laparoscopic hysterectomy (LH) versus abdominal hysterectomy (AH) | |
| The study was excluded from the meta‐analysis because the primary outcome was on laboratory results and not on clinical data comparing routes of hysterectomy | |
| No comparison between routes of hysterectomy; patient with large symptomatic myomas were randomised for an abdominal approach through minilaparotomy or midline incision | |
| This study is a prospective case‐control study and not a RCT | |
| Not a true randomised trial; patients were assigned to receive single‐port TLH or conventional TLH according to the sequence of their admission | |
| Randomised controlled trial (n = 68) but compared 2 variants of LH(a) (with and without vaginal cuff suspension), rather than comparing LH(a) with another surgical approach. Less mobility of the bladder neck was found on ultrasound in LH(a) with suspension | |
| Case of scientific felony at Magna Graecia University of Catanzaro (via http://www.ncbi.nlm.nih.gov/pubmed/17923838) | |
| No comparison between routes of hysterectomy; this randomised prospective study among women undergoing VH compared a closed vault technique with an open technique | |
| This study was excluded from the review and meta‐analysis because this was not a randomised controlled study. Patients were allocated to study groups by the attending gynaecologist in a non‐randomised manner. Intervention: laparoscopic hysterectomy (LH) versus abdominal hysterectomy (AH) | |
| Not a randomised controlled study, alternatively assigned to study groups. Intervention: laparoscopic hysterectomy (LH) versus abdominal hysterectomy (AH) | |
| Randomised trial comparing subtotal AH versus subtotal LH (n = 47). The complication profile for subtotal hysterectomy is different to total hysterectomy. Inclusion of this trial and pooling for meta‐analysis would introduce undue clinical heterogeneity. ASH was performed by Pfannenstiel incision and excision of the uterus in the cervical isthmus region after dissection of the uterine arteries | |
| No further data provided by author | |
| Not a comparison of 2 different types of hysterectomy. In this study, 2 different techniques with regard to time point of coagulation of uterine vessels during LH(a) were compared | |
| This study was excluded in the review and meta‐analysis because this was not a randomised controlled study. Historical comparison of LAVH and TLH | |
| No further data provided by author | |
| Not a truly randomised controlled study, allocated to study groups according to the last digit of their hospital record number by secretarial staff. Intervention: laparoscopic hysterectomy (LH) with bilateral salpingo‐oophorectomy (BSO) versus abdominal hysterectomy (AH) with BSO | |
| No comparison between routes of hysterectomy; this randomised controlled study compared wound bleeding after injecting the colpotomy wound in LAVH with diluted vasopressin versus normal saline solution | |
| The study was excluded from the meta‐analysis because the primary outcome was on laboratory results and not on clinical data comparing routes of hysterectomy |
AH: abdominal hysterectomy
ASH: subtotal abdominal hysterectomy
CPK: creatine phosphokinase
CRP: C‐reactive protein
IL‐6: interleukin 6
LAVH: laparoscopic‐assisted vaginal hysterectomy
LH: laparoscopic hysterectomy
LSH: subtotal laparoscopic hysterectomy
RCT: randomised controlled trial
TLH: total laparoscopic hysterectomy
VALH: vaginally assisted laparoscopic hysterectomy
VAS: visual analogue scale
VH: vaginal hysterectomy
Characteristics of studies awaiting assessment [ordered by study ID]
| Methods | Randomisation procedure was based on a computer‐generated list |
| Participants | 108 women requiring hysterectomy for enlarged myomatous uterus |
| Interventions | 3 treatment arms: TLH (n = 36); LAVH (n = 36); VH (n = 36) |
| Outcomes | The primary outcome was the discharge time comparison. The secondary outcomes were operating time, blood loss, paralytic ileus time, intraoperative complications, postoperative pain and early postoperative complications |
| Notes | Results: the mean discharge time was shorter after VH than after LAVH and TLH (P value = 0.001). Operating time significantly influenced the discharge time, considered as a dependent variable in general linear model analysis (P value = 0.006). In contrast, blood loss did not influence the discharge time (P value = 0.55). The mean operating time was significantly shorter in VH than in TLH and LAVH groups (P value = 0.000). The intraoperative blood loss was greater during LAVH than during TLH and VH (P value = 0.000). Paralytic ileus time was shorter after VH than after TLH and LAVH (P value = 0.000). No intraoperative complications or conversions to laparotomy occurred |
LAVH: laparoscopic‐assisted vaginal hysterectomy
TLH: total laparoscopic hysterectomy
VH: vaginal hysterectomy
Data and analyses
| Outcome or subgroup title | No. of studies | No. of participants | Statistical method | Effect size | |||||||||||||||||||||||||||||||||||||||||||||||||||||||
| 1 Return to normal activities (days) Show forest plot | 3 | 176 | Mean Difference (IV, Random, 95% CI) | ‐12.33 [‐19.89, ‐4.77] | |||||||||||||||||||||||||||||||||||||||||||||||||||||||
| Analysis 1.1  Comparison 1 VH versus AH, Outcome 1 Return to normal activities (days). | |||||||||||||||||||||||||||||||||||||||||||||||||||||||||||
| 2 Long‐term outcomes: satisfaction (dichotomous) Show forest plot | 1 | Odds Ratio (M‐H, Fixed, 95% CI) | Subtotals only | ||||||||||||||||||||||||||||||||||||||||||||||||||||||||
| Analysis 1.2  Comparison 1 VH versus AH, Outcome 2 Long‐term outcomes: satisfaction (dichotomous). | |||||||||||||||||||||||||||||||||||||||||||||||||||||||||||
| 3 Intraoperative visceral injury (dichotomous) Show forest plot | 4 | Odds Ratio (M‐H, Fixed, 95% CI) | Subtotals only | ||||||||||||||||||||||||||||||||||||||||||||||||||||||||
| Analysis 1.3 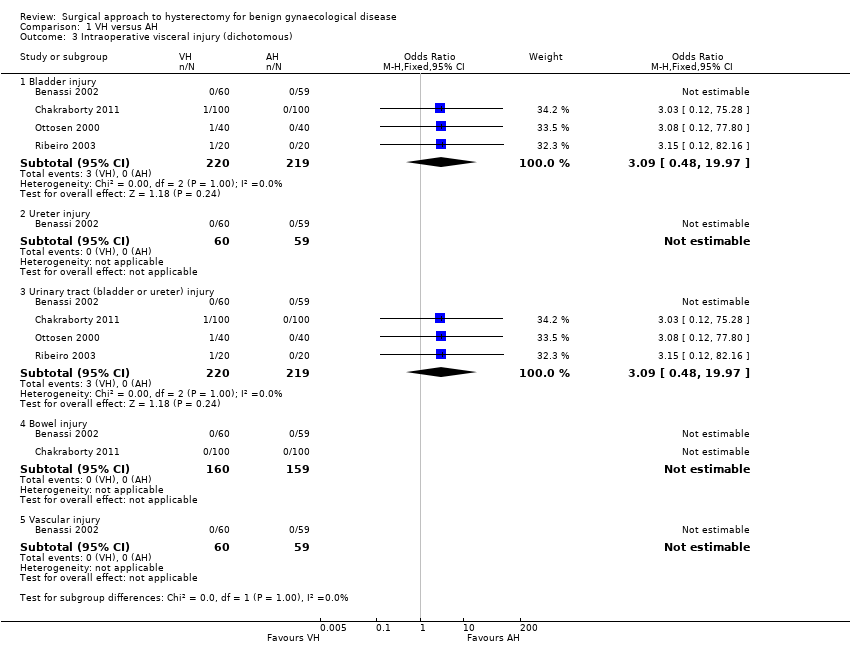 Comparison 1 VH versus AH, Outcome 3 Intraoperative visceral injury (dichotomous). | |||||||||||||||||||||||||||||||||||||||||||||||||||||||||||
| 3.1 Bladder injury | 4 | 439 | Odds Ratio (M‐H, Fixed, 95% CI) | 3.09 [0.48, 19.97] | |||||||||||||||||||||||||||||||||||||||||||||||||||||||
| 3.2 Ureter injury | 1 | 119 | Odds Ratio (M‐H, Fixed, 95% CI) | 0.0 [0.0, 0.0] | |||||||||||||||||||||||||||||||||||||||||||||||||||||||
| 3.3 Urinary tract (bladder or ureter) injury | 4 | 439 | Odds Ratio (M‐H, Fixed, 95% CI) | 3.09 [0.48, 19.97] | |||||||||||||||||||||||||||||||||||||||||||||||||||||||
| 3.4 Bowel injury | 2 | 319 | Odds Ratio (M‐H, Fixed, 95% CI) | 0.0 [0.0, 0.0] | |||||||||||||||||||||||||||||||||||||||||||||||||||||||
| 3.5 Vascular injury | 1 | 119 | Odds Ratio (M‐H, Fixed, 95% CI) | 0.0 [0.0, 0.0] | |||||||||||||||||||||||||||||||||||||||||||||||||||||||
| 4 Long‐term complications (dichotomous) Show forest plot | 1 | Odds Ratio (M‐H, Fixed, 95% CI) | Subtotals only | ||||||||||||||||||||||||||||||||||||||||||||||||||||||||
| Analysis 1.4 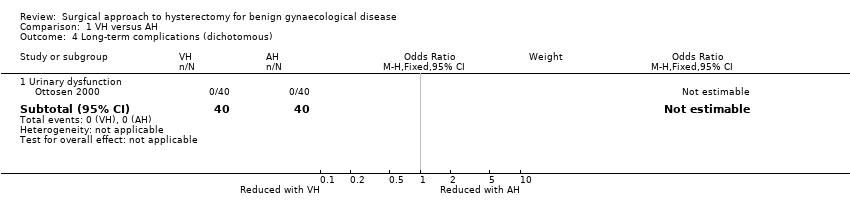 Comparison 1 VH versus AH, Outcome 4 Long‐term complications (dichotomous). | |||||||||||||||||||||||||||||||||||||||||||||||||||||||||||
| 4.1 Urinary dysfunction | 1 | 80 | Odds Ratio (M‐H, Fixed, 95% CI) | 0.0 [0.0, 0.0] | |||||||||||||||||||||||||||||||||||||||||||||||||||||||
| 5 Operation time (mins) Show forest plot | 4 | Mean Difference (IV, Random, 95% CI) | Subtotals only | ||||||||||||||||||||||||||||||||||||||||||||||||||||||||
| Analysis 1.5  Comparison 1 VH versus AH, Outcome 5 Operation time (mins). | |||||||||||||||||||||||||||||||||||||||||||||||||||||||||||
| 5.1 VH versus standard AH | 3 | 259 | Mean Difference (IV, Random, 95% CI) | ‐11.01 [‐35.09, 13.08] | |||||||||||||||||||||||||||||||||||||||||||||||||||||||
| 5.2 VH versus minilaparotomy AH | 1 | 100 | Mean Difference (IV, Random, 95% CI) | ‐63.0 [‐65.11, ‐60.89] | |||||||||||||||||||||||||||||||||||||||||||||||||||||||
| 6 Short‐term outcomes (dichotomous) Show forest plot | 6 | Odds Ratio (M‐H, Fixed, 95% CI) | Subtotals only | ||||||||||||||||||||||||||||||||||||||||||||||||||||||||
| Analysis 1.6 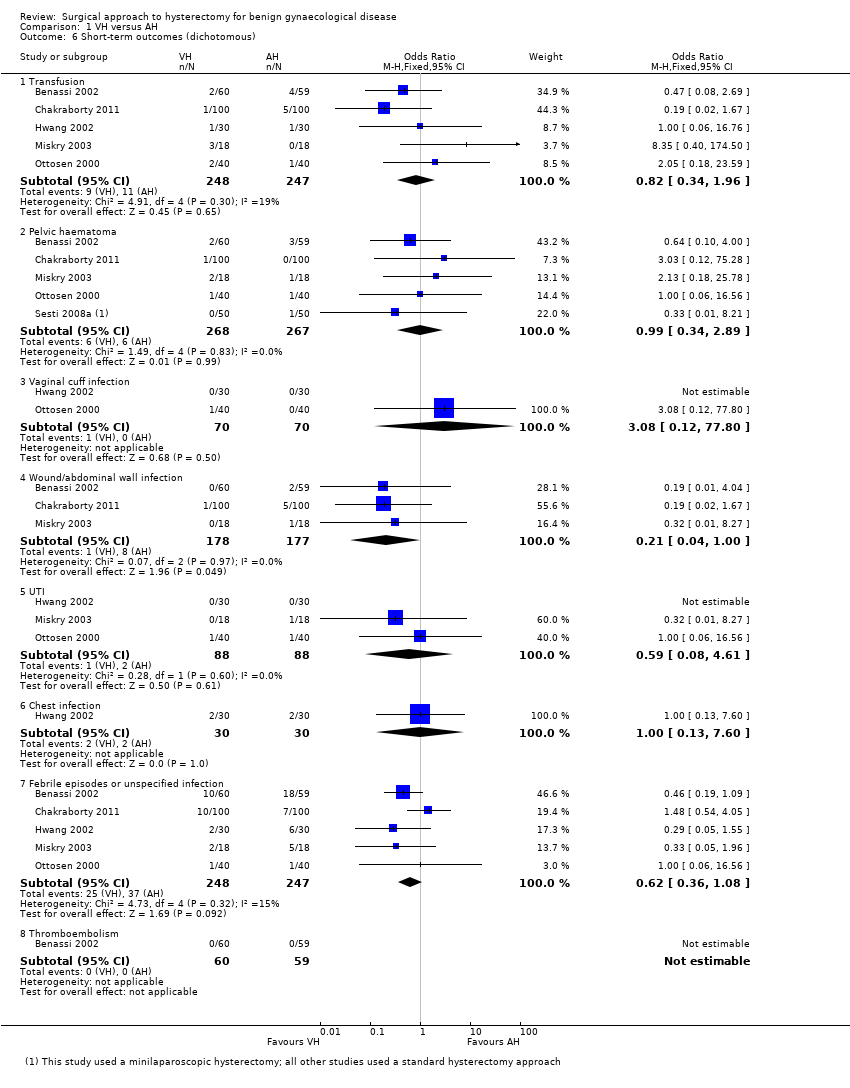 Comparison 1 VH versus AH, Outcome 6 Short‐term outcomes (dichotomous). | |||||||||||||||||||||||||||||||||||||||||||||||||||||||||||
| 6.1 Transfusion | 5 | 495 | Odds Ratio (M‐H, Fixed, 95% CI) | 0.82 [0.34, 1.96] | |||||||||||||||||||||||||||||||||||||||||||||||||||||||
| 6.2 Pelvic haematoma | 5 | 535 | Odds Ratio (M‐H, Fixed, 95% CI) | 0.99 [0.34, 2.89] | |||||||||||||||||||||||||||||||||||||||||||||||||||||||
| 6.3 Vaginal cuff infection | 2 | 140 | Odds Ratio (M‐H, Fixed, 95% CI) | 3.08 [0.12, 77.80] | |||||||||||||||||||||||||||||||||||||||||||||||||||||||
| 6.4 Wound/abdominal wall infection | 3 | 355 | Odds Ratio (M‐H, Fixed, 95% CI) | 0.21 [0.04, 1.00] | |||||||||||||||||||||||||||||||||||||||||||||||||||||||
| 6.5 UTI | 3 | 176 | Odds Ratio (M‐H, Fixed, 95% CI) | 0.59 [0.08, 4.61] | |||||||||||||||||||||||||||||||||||||||||||||||||||||||
| 6.6 Chest infection | 1 | 60 | Odds Ratio (M‐H, Fixed, 95% CI) | 1.0 [0.13, 7.60] | |||||||||||||||||||||||||||||||||||||||||||||||||||||||
| 6.7 Febrile episodes or unspecified infection | 5 | 495 | Odds Ratio (M‐H, Fixed, 95% CI) | 0.62 [0.36, 1.08] | |||||||||||||||||||||||||||||||||||||||||||||||||||||||
| 6.8 Thromboembolism | 1 | 119 | Odds Ratio (M‐H, Fixed, 95% CI) | 0.0 [0.0, 0.0] | |||||||||||||||||||||||||||||||||||||||||||||||||||||||
| 7 Length of hospital stay (days) Show forest plot | 5 | Mean Difference (IV, Fixed, 95% CI) | Subtotals only | ||||||||||||||||||||||||||||||||||||||||||||||||||||||||
| Analysis 1.7  Comparison 1 VH versus AH, Outcome 7 Length of hospital stay (days). | |||||||||||||||||||||||||||||||||||||||||||||||||||||||||||
| 7.1 VH versus standard AH | 4 | 295 | Mean Difference (IV, Fixed, 95% CI) | ‐1.07 [‐1.22, ‐0.92] | |||||||||||||||||||||||||||||||||||||||||||||||||||||||
| 7.2 VH versus minilaparotomy AH | 1 | 100 | Mean Difference (IV, Fixed, 95% CI) | ‐2.1 [‐2.19, ‐2.01] | |||||||||||||||||||||||||||||||||||||||||||||||||||||||
| 8 All outcomes, descriptive data Show forest plot | Other data | No numeric data | |||||||||||||||||||||||||||||||||||||||||||||||||||||||||
| Analysis 1.8
Comparison 1 VH versus AH, Outcome 8 All outcomes, descriptive data. | |||||||||||||||||||||||||||||||||||||||||||||||||||||||||||
| 8.1 Quality of life (descriptive data) | Other data | No numeric data | |||||||||||||||||||||||||||||||||||||||||||||||||||||||||
| 8.2 Operation time (descriptive data) | Other data | No numeric data | |||||||||||||||||||||||||||||||||||||||||||||||||||||||||
| 8.3 Length of hospital stay (descriptive data) | Other data | No numeric data | |||||||||||||||||||||||||||||||||||||||||||||||||||||||||
| Outcome or subgroup title | No. of studies | No. of participants | Statistical method | Effect size | ||||||||||||||||||||||||||||||||||||||||||||||||||||||||||||||||||||||||||||||||||||||||||||||||||||
| 1 Return to normal activities (days) Show forest plot | 6 | Mean Difference (IV, Fixed, 95% CI) | Subtotals only | |||||||||||||||||||||||||||||||||||||||||||||||||||||||||||||||||||||||||||||||||||||||||||||||||||||
| Analysis 2.1  Comparison 2 LH versus AH, Outcome 1 Return to normal activities (days). | ||||||||||||||||||||||||||||||||||||||||||||||||||||||||||||||||||||||||||||||||||||||||||||||||||||||||
| 1.1 LAVH versus AH | 1 | 80 | Mean Difference (IV, Fixed, 95% CI) | ‐8.40 [‐12.15, ‐4.65] | ||||||||||||||||||||||||||||||||||||||||||||||||||||||||||||||||||||||||||||||||||||||||||||||||||||
| 1.2 LH(a) versus AH | 5 | 440 | Mean Difference (IV, Fixed, 95% CI) | ‐15.17 [‐17.21, ‐13.14] | ||||||||||||||||||||||||||||||||||||||||||||||||||||||||||||||||||||||||||||||||||||||||||||||||||||
| 2 Satisfaction Show forest plot | 1 | Odds Ratio (M‐H, Fixed, 95% CI) | Totals not selected | |||||||||||||||||||||||||||||||||||||||||||||||||||||||||||||||||||||||||||||||||||||||||||||||||||||
| Analysis 2.2 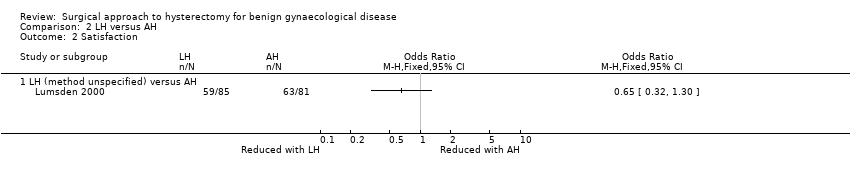 Comparison 2 LH versus AH, Outcome 2 Satisfaction. | ||||||||||||||||||||||||||||||||||||||||||||||||||||||||||||||||||||||||||||||||||||||||||||||||||||||||
| 2.1 LH (method unspecified) versus AH | 1 | Odds Ratio (M‐H, Fixed, 95% CI) | 0.0 [0.0, 0.0] | |||||||||||||||||||||||||||||||||||||||||||||||||||||||||||||||||||||||||||||||||||||||||||||||||||||
| 3 Bladder injury Show forest plot | 12 | 2038 | Odds Ratio (M‐H, Fixed, 95% CI) | 1.89 [0.91, 3.90] | ||||||||||||||||||||||||||||||||||||||||||||||||||||||||||||||||||||||||||||||||||||||||||||||||||||
| Analysis 2.3 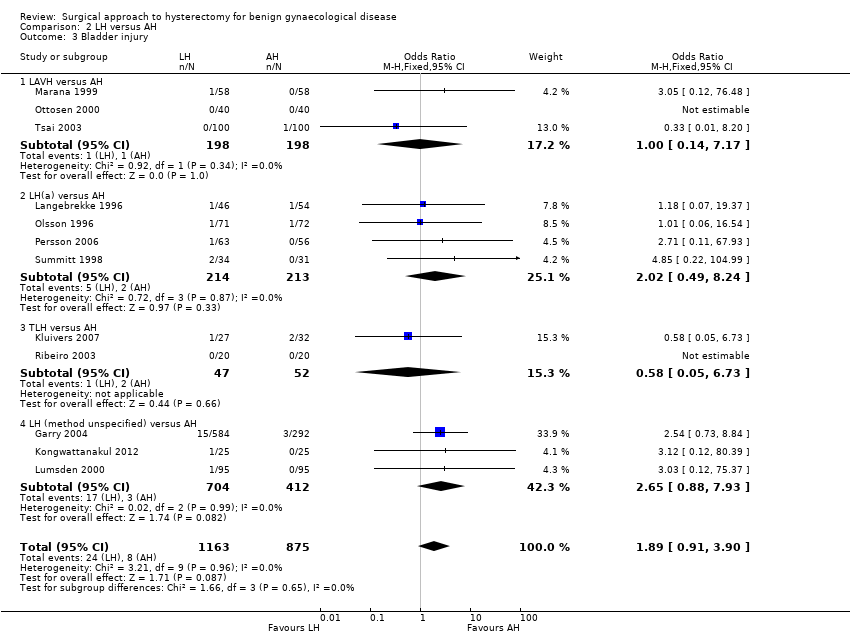 Comparison 2 LH versus AH, Outcome 3 Bladder injury. | ||||||||||||||||||||||||||||||||||||||||||||||||||||||||||||||||||||||||||||||||||||||||||||||||||||||||
| 3.1 LAVH versus AH | 3 | 396 | Odds Ratio (M‐H, Fixed, 95% CI) | 1.0 [0.14, 7.17] | ||||||||||||||||||||||||||||||||||||||||||||||||||||||||||||||||||||||||||||||||||||||||||||||||||||
| 3.2 LH(a) versus AH | 4 | 427 | Odds Ratio (M‐H, Fixed, 95% CI) | 2.02 [0.49, 8.24] | ||||||||||||||||||||||||||||||||||||||||||||||||||||||||||||||||||||||||||||||||||||||||||||||||||||
| 3.3 TLH versus AH | 2 | 99 | Odds Ratio (M‐H, Fixed, 95% CI) | 0.58 [0.05, 6.73] | ||||||||||||||||||||||||||||||||||||||||||||||||||||||||||||||||||||||||||||||||||||||||||||||||||||
| 3.4 LH (method unspecified) versus AH | 3 | 1116 | Odds Ratio (M‐H, Fixed, 95% CI) | 2.65 [0.88, 7.93] | ||||||||||||||||||||||||||||||||||||||||||||||||||||||||||||||||||||||||||||||||||||||||||||||||||||
| 4 Ureter injury Show forest plot | 7 | 1417 | Odds Ratio (M‐H, Fixed, 95% CI) | 3.46 [0.94, 12.71] | ||||||||||||||||||||||||||||||||||||||||||||||||||||||||||||||||||||||||||||||||||||||||||||||||||||
| Analysis 2.4  Comparison 2 LH versus AH, Outcome 4 Ureter injury. | ||||||||||||||||||||||||||||||||||||||||||||||||||||||||||||||||||||||||||||||||||||||||||||||||||||||||
| 4.1 LH(a) versus AH | 1 | 100 | Odds Ratio (M‐H, Fixed, 95% CI) | 6.12 [0.29, 130.87] | ||||||||||||||||||||||||||||||||||||||||||||||||||||||||||||||||||||||||||||||||||||||||||||||||||||
| 4.2 TLH versus AH | 3 | 201 | Odds Ratio (M‐H, Fixed, 95% CI) | 3.35 [0.34, 32.97] | ||||||||||||||||||||||||||||||||||||||||||||||||||||||||||||||||||||||||||||||||||||||||||||||||||||
| 4.3 LH (method unspecified) versus AH | 3 | 1116 | Odds Ratio (M‐H, Fixed, 95% CI) | 2.82 [0.44, 18.03] | ||||||||||||||||||||||||||||||||||||||||||||||||||||||||||||||||||||||||||||||||||||||||||||||||||||
| 5 Urinary tract (bladder or ureter) injury Show forest plot | 13 | 2140 | Odds Ratio (M‐H, Fixed, 95% CI) | 2.44 [1.24, 4.80] | ||||||||||||||||||||||||||||||||||||||||||||||||||||||||||||||||||||||||||||||||||||||||||||||||||||
| Analysis 2.5 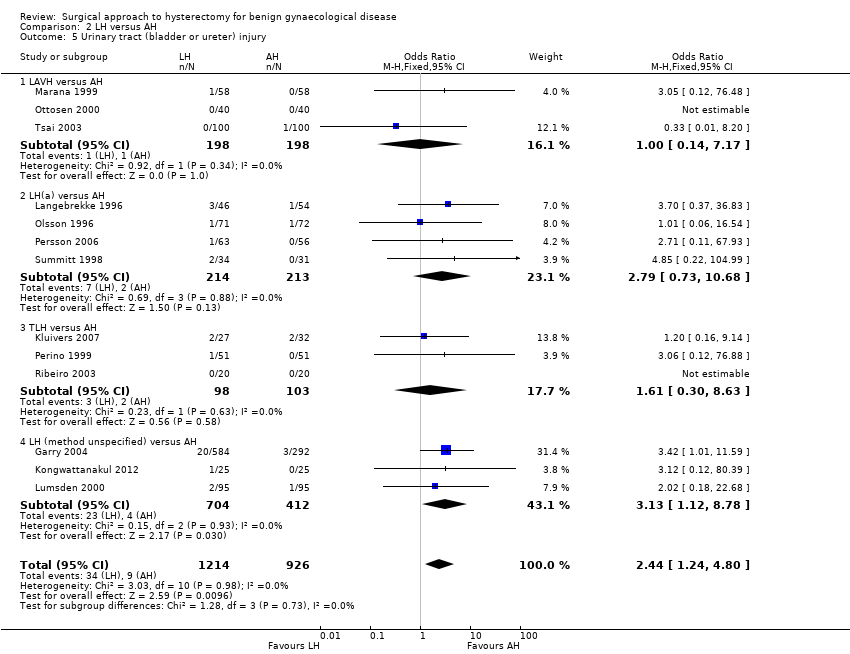 Comparison 2 LH versus AH, Outcome 5 Urinary tract (bladder or ureter) injury. | ||||||||||||||||||||||||||||||||||||||||||||||||||||||||||||||||||||||||||||||||||||||||||||||||||||||||
| 5.1 LAVH versus AH | 3 | 396 | Odds Ratio (M‐H, Fixed, 95% CI) | 1.0 [0.14, 7.17] | ||||||||||||||||||||||||||||||||||||||||||||||||||||||||||||||||||||||||||||||||||||||||||||||||||||
| 5.2 LH(a) versus AH | 4 | 427 | Odds Ratio (M‐H, Fixed, 95% CI) | 2.79 [0.73, 10.68] | ||||||||||||||||||||||||||||||||||||||||||||||||||||||||||||||||||||||||||||||||||||||||||||||||||||
| 5.3 TLH versus AH | 3 | 201 | Odds Ratio (M‐H, Fixed, 95% CI) | 1.61 [0.30, 8.63] | ||||||||||||||||||||||||||||||||||||||||||||||||||||||||||||||||||||||||||||||||||||||||||||||||||||
| 5.4 LH (method unspecified) versus AH | 3 | 1116 | Odds Ratio (M‐H, Fixed, 95% CI) | 3.13 [1.12, 8.78] | ||||||||||||||||||||||||||||||||||||||||||||||||||||||||||||||||||||||||||||||||||||||||||||||||||||
| 6 Bowel injury Show forest plot | 4 | 1175 | Odds Ratio (M‐H, Fixed, 95% CI) | 0.21 [0.03, 1.33] | ||||||||||||||||||||||||||||||||||||||||||||||||||||||||||||||||||||||||||||||||||||||||||||||||||||
| Analysis 2.6  Comparison 2 LH versus AH, Outcome 6 Bowel injury. | ||||||||||||||||||||||||||||||||||||||||||||||||||||||||||||||||||||||||||||||||||||||||||||||||||||||||
| 6.1 LAVH versus AH | 1 | 50 | Odds Ratio (M‐H, Fixed, 95% CI) | 0.32 [0.01, 8.25] | ||||||||||||||||||||||||||||||||||||||||||||||||||||||||||||||||||||||||||||||||||||||||||||||||||||
| 6.2 TLH versus AH | 1 | 59 | Odds Ratio (M‐H, Fixed, 95% CI) | 0.0 [0.0, 0.0] | ||||||||||||||||||||||||||||||||||||||||||||||||||||||||||||||||||||||||||||||||||||||||||||||||||||
| 6.3 LH (method unspecified) versus AH | 2 | 1066 | Odds Ratio (M‐H, Fixed, 95% CI) | 0.17 [0.02, 1.60] | ||||||||||||||||||||||||||||||||||||||||||||||||||||||||||||||||||||||||||||||||||||||||||||||||||||
| 7 Vascular injury Show forest plot | 2 | 956 | Odds Ratio (M‐H, Fixed, 95% CI) | 1.76 [0.52, 5.87] | ||||||||||||||||||||||||||||||||||||||||||||||||||||||||||||||||||||||||||||||||||||||||||||||||||||
| Analysis 2.7  Comparison 2 LH versus AH, Outcome 7 Vascular injury. | ||||||||||||||||||||||||||||||||||||||||||||||||||||||||||||||||||||||||||||||||||||||||||||||||||||||||
| 7.1 LAVH versus AH | 1 | 80 | Odds Ratio (M‐H, Fixed, 95% CI) | 5.26 [0.24, 113.11] | ||||||||||||||||||||||||||||||||||||||||||||||||||||||||||||||||||||||||||||||||||||||||||||||||||||
| 7.2 LH (method unspecified) versus AH | 1 | 876 | Odds Ratio (M‐H, Fixed, 95% CI) | 1.34 [0.35, 5.08] | ||||||||||||||||||||||||||||||||||||||||||||||||||||||||||||||||||||||||||||||||||||||||||||||||||||
| 8 Fistula Show forest plot | 2 | 245 | Odds Ratio (M‐H, Fixed, 95% CI) | 3.07 [0.32, 29.96] | ||||||||||||||||||||||||||||||||||||||||||||||||||||||||||||||||||||||||||||||||||||||||||||||||||||
| Analysis 2.8  Comparison 2 LH versus AH, Outcome 8 Fistula. | ||||||||||||||||||||||||||||||||||||||||||||||||||||||||||||||||||||||||||||||||||||||||||||||||||||||||
| 8.1 LH(a) versus AH | 1 | 143 | Odds Ratio (M‐H, Fixed, 95% CI) | 3.09 [0.12, 77.01] | ||||||||||||||||||||||||||||||||||||||||||||||||||||||||||||||||||||||||||||||||||||||||||||||||||||
| 8.2 TLH versus AH | 1 | 102 | Odds Ratio (M‐H, Fixed, 95% CI) | 3.06 [0.12, 76.88] | ||||||||||||||||||||||||||||||||||||||||||||||||||||||||||||||||||||||||||||||||||||||||||||||||||||
| 9 Urinary dysfunction Show forest plot | 2 | 246 | Odds Ratio (M‐H, Fixed, 95% CI) | 0.94 [0.48, 1.84] | ||||||||||||||||||||||||||||||||||||||||||||||||||||||||||||||||||||||||||||||||||||||||||||||||||||
| Analysis 2.9 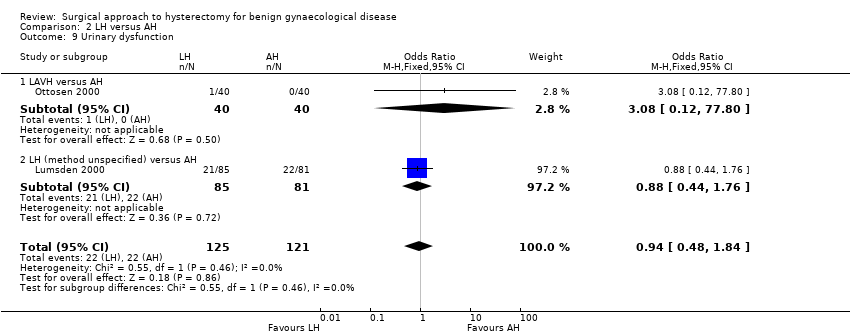 Comparison 2 LH versus AH, Outcome 9 Urinary dysfunction. | ||||||||||||||||||||||||||||||||||||||||||||||||||||||||||||||||||||||||||||||||||||||||||||||||||||||||
| 9.1 LAVH versus AH | 1 | 80 | Odds Ratio (M‐H, Fixed, 95% CI) | 3.08 [0.12, 77.80] | ||||||||||||||||||||||||||||||||||||||||||||||||||||||||||||||||||||||||||||||||||||||||||||||||||||
| 9.2 LH (method unspecified) versus AH | 1 | 166 | Odds Ratio (M‐H, Fixed, 95% CI) | 0.88 [0.44, 1.76] | ||||||||||||||||||||||||||||||||||||||||||||||||||||||||||||||||||||||||||||||||||||||||||||||||||||
| 10 Operation time (mins) Show forest plot | 12 | Mean Difference (IV, Random, 95% CI) | Subtotals only | |||||||||||||||||||||||||||||||||||||||||||||||||||||||||||||||||||||||||||||||||||||||||||||||||||||
| Analysis 2.10 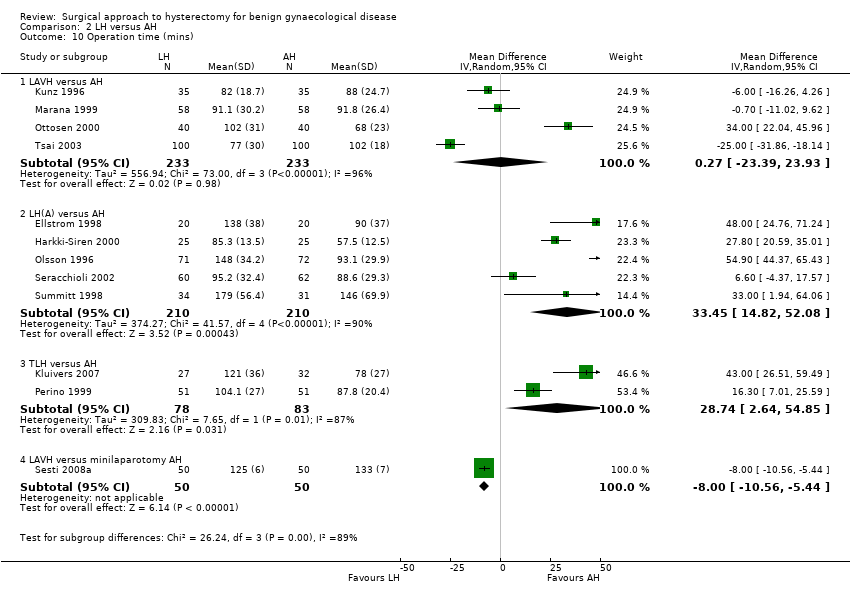 Comparison 2 LH versus AH, Outcome 10 Operation time (mins). | ||||||||||||||||||||||||||||||||||||||||||||||||||||||||||||||||||||||||||||||||||||||||||||||||||||||||
| 10.1 LAVH versus AH | 4 | 466 | Mean Difference (IV, Random, 95% CI) | 0.27 [‐23.39, 23.93] | ||||||||||||||||||||||||||||||||||||||||||||||||||||||||||||||||||||||||||||||||||||||||||||||||||||
| 10.2 LH(A) versus AH | 5 | 420 | Mean Difference (IV, Random, 95% CI) | 33.45 [14.82, 52.08] | ||||||||||||||||||||||||||||||||||||||||||||||||||||||||||||||||||||||||||||||||||||||||||||||||||||
| 10.3 TLH versus AH | 2 | 161 | Mean Difference (IV, Random, 95% CI) | 28.74 [2.64, 54.85] | ||||||||||||||||||||||||||||||||||||||||||||||||||||||||||||||||||||||||||||||||||||||||||||||||||||
| 10.4 LAVH versus minilaparotomy AH | 1 | 100 | Mean Difference (IV, Random, 95% CI) | ‐8.0 [‐10.56, ‐5.44] | ||||||||||||||||||||||||||||||||||||||||||||||||||||||||||||||||||||||||||||||||||||||||||||||||||||
| 11 Bleeding Show forest plot | 5 | 1266 | Odds Ratio (M‐H, Fixed, 95% CI) | 0.45 [0.15, 1.37] | ||||||||||||||||||||||||||||||||||||||||||||||||||||||||||||||||||||||||||||||||||||||||||||||||||||
| Analysis 2.11  Comparison 2 LH versus AH, Outcome 11 Bleeding. | ||||||||||||||||||||||||||||||||||||||||||||||||||||||||||||||||||||||||||||||||||||||||||||||||||||||||
| 11.1 LAVH versus AH | 2 | 197 | Odds Ratio (M‐H, Fixed, 95% CI) | 0.60 [0.08, 4.64] | ||||||||||||||||||||||||||||||||||||||||||||||||||||||||||||||||||||||||||||||||||||||||||||||||||||
| 11.2 LH(a) versus AH | 2 | 193 | Odds Ratio (M‐H, Fixed, 95% CI) | 0.16 [0.02, 1.34] | ||||||||||||||||||||||||||||||||||||||||||||||||||||||||||||||||||||||||||||||||||||||||||||||||||||
| 11.3 LH (method unspecified) versus AH | 1 | 876 | Odds Ratio (M‐H, Fixed, 95% CI) | 1.50 [0.16, 14.51] | ||||||||||||||||||||||||||||||||||||||||||||||||||||||||||||||||||||||||||||||||||||||||||||||||||||
| 12 Transfusion Show forest plot | 19 | 2638 | Odds Ratio (M‐H, Random, 95% CI) | 0.58 [0.30, 1.10] | ||||||||||||||||||||||||||||||||||||||||||||||||||||||||||||||||||||||||||||||||||||||||||||||||||||
| Analysis 2.12 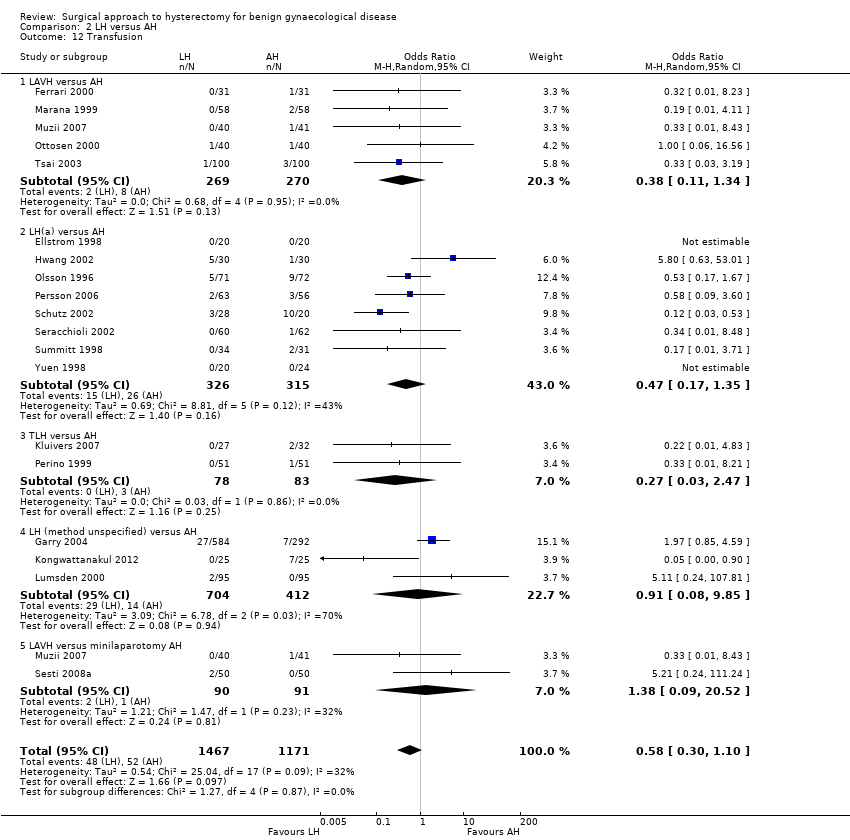 Comparison 2 LH versus AH, Outcome 12 Transfusion. | ||||||||||||||||||||||||||||||||||||||||||||||||||||||||||||||||||||||||||||||||||||||||||||||||||||||||
| 12.1 LAVH versus AH | 5 | 539 | Odds Ratio (M‐H, Random, 95% CI) | 0.38 [0.11, 1.34] | ||||||||||||||||||||||||||||||||||||||||||||||||||||||||||||||||||||||||||||||||||||||||||||||||||||
| 12.2 LH(a) versus AH | 8 | 641 | Odds Ratio (M‐H, Random, 95% CI) | 0.47 [0.17, 1.35] | ||||||||||||||||||||||||||||||||||||||||||||||||||||||||||||||||||||||||||||||||||||||||||||||||||||
| 12.3 TLH versus AH | 2 | 161 | Odds Ratio (M‐H, Random, 95% CI) | 0.27 [0.03, 2.47] | ||||||||||||||||||||||||||||||||||||||||||||||||||||||||||||||||||||||||||||||||||||||||||||||||||||
| 12.4 LH (method unspecified) versus AH | 3 | 1116 | Odds Ratio (M‐H, Random, 95% CI) | 0.91 [0.08, 9.85] | ||||||||||||||||||||||||||||||||||||||||||||||||||||||||||||||||||||||||||||||||||||||||||||||||||||
| 12.5 LAVH versus minilaparotomy AH | 2 | 181 | Odds Ratio (M‐H, Random, 95% CI) | 1.38 [0.09, 20.52] | ||||||||||||||||||||||||||||||||||||||||||||||||||||||||||||||||||||||||||||||||||||||||||||||||||||
| 13 Pelvic haematoma Show forest plot | 8 | 782 | Odds Ratio (M‐H, Fixed, 95% CI) | 0.75 [0.38, 1.47] | ||||||||||||||||||||||||||||||||||||||||||||||||||||||||||||||||||||||||||||||||||||||||||||||||||||
| Analysis 2.13  Comparison 2 LH versus AH, Outcome 13 Pelvic haematoma. | ||||||||||||||||||||||||||||||||||||||||||||||||||||||||||||||||||||||||||||||||||||||||||||||||||||||||
| 13.1 LAVH versus AH | 3 | 276 | Odds Ratio (M‐H, Fixed, 95% CI) | 0.33 [0.05, 2.10] | ||||||||||||||||||||||||||||||||||||||||||||||||||||||||||||||||||||||||||||||||||||||||||||||||||||
| 13.2 LH(a) versus AH | 4 | 406 | Odds Ratio (M‐H, Fixed, 95% CI) | 0.93 [0.44, 1.97] | ||||||||||||||||||||||||||||||||||||||||||||||||||||||||||||||||||||||||||||||||||||||||||||||||||||
| 13.3 LAVH versus minilaparotomy AH | 1 | 100 | Odds Ratio (M‐H, Fixed, 95% CI) | 0.33 [0.01, 8.21] | ||||||||||||||||||||||||||||||||||||||||||||||||||||||||||||||||||||||||||||||||||||||||||||||||||||
| 14 Unintended laparotomy Show forest plot | 2 | Odds Ratio (M‐H, Fixed, 95% CI) | Subtotals only | |||||||||||||||||||||||||||||||||||||||||||||||||||||||||||||||||||||||||||||||||||||||||||||||||||||
| Analysis 2.14 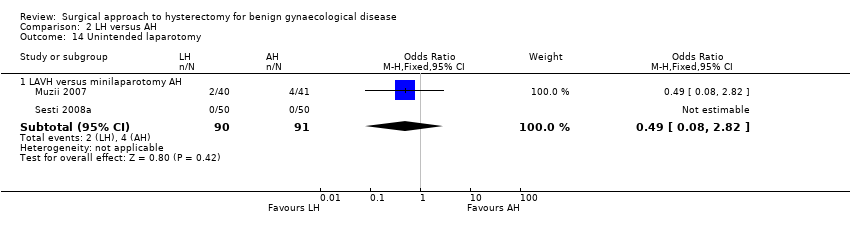 Comparison 2 LH versus AH, Outcome 14 Unintended laparotomy. | ||||||||||||||||||||||||||||||||||||||||||||||||||||||||||||||||||||||||||||||||||||||||||||||||||||||||
| 14.1 LAVH versus minilaparotomy AH | 2 | 181 | Odds Ratio (M‐H, Fixed, 95% CI) | 0.49 [0.08, 2.82] | ||||||||||||||||||||||||||||||||||||||||||||||||||||||||||||||||||||||||||||||||||||||||||||||||||||
| 15 Length of hospital stay (days) Show forest plot | 11 | Mean Difference (IV, Random, 95% CI) | Subtotals only | |||||||||||||||||||||||||||||||||||||||||||||||||||||||||||||||||||||||||||||||||||||||||||||||||||||
| Analysis 2.15 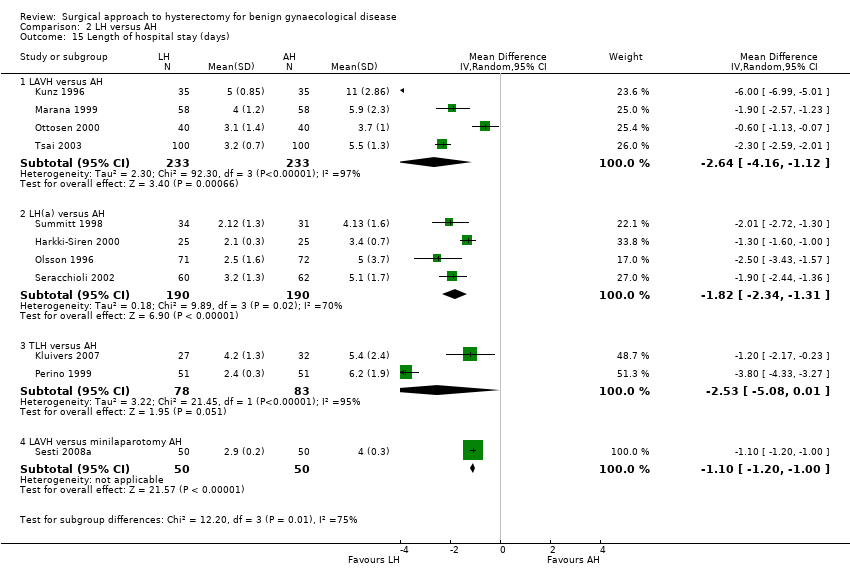 Comparison 2 LH versus AH, Outcome 15 Length of hospital stay (days). | ||||||||||||||||||||||||||||||||||||||||||||||||||||||||||||||||||||||||||||||||||||||||||||||||||||||||
| 15.1 LAVH versus AH | 4 | 466 | Mean Difference (IV, Random, 95% CI) | ‐2.64 [‐4.16, ‐1.12] | ||||||||||||||||||||||||||||||||||||||||||||||||||||||||||||||||||||||||||||||||||||||||||||||||||||
| 15.2 LH(a) versus AH | 4 | 380 | Mean Difference (IV, Random, 95% CI) | ‐1.82 [‐2.34, ‐1.31] | ||||||||||||||||||||||||||||||||||||||||||||||||||||||||||||||||||||||||||||||||||||||||||||||||||||
| 15.3 TLH versus AH | 2 | 161 | Mean Difference (IV, Random, 95% CI) | ‐2.53 [‐5.08, 0.01] | ||||||||||||||||||||||||||||||||||||||||||||||||||||||||||||||||||||||||||||||||||||||||||||||||||||
| 15.4 LAVH versus minilaparotomy AH | 1 | 100 | Mean Difference (IV, Random, 95% CI) | ‐1.1 [‐1.20, ‐1.00] | ||||||||||||||||||||||||||||||||||||||||||||||||||||||||||||||||||||||||||||||||||||||||||||||||||||
| 16 Vaginal cuff infection Show forest plot | 9 | 852 | Odds Ratio (M‐H, Fixed, 95% CI) | 1.43 [0.67, 3.04] | ||||||||||||||||||||||||||||||||||||||||||||||||||||||||||||||||||||||||||||||||||||||||||||||||||||
| Analysis 2.16  Comparison 2 LH versus AH, Outcome 16 Vaginal cuff infection. | ||||||||||||||||||||||||||||||||||||||||||||||||||||||||||||||||||||||||||||||||||||||||||||||||||||||||
| 16.1 LAVH versus AH | 3 | 396 | Odds Ratio (M‐H, Fixed, 95% CI) | 0.75 [0.17, 3.37] | ||||||||||||||||||||||||||||||||||||||||||||||||||||||||||||||||||||||||||||||||||||||||||||||||||||
| 16.2 LH(a) versus AH | 6 | 456 | Odds Ratio (M‐H, Fixed, 95% CI) | 1.79 [0.73, 4.37] | ||||||||||||||||||||||||||||||||||||||||||||||||||||||||||||||||||||||||||||||||||||||||||||||||||||
| 17 Wound/abdominal wall infection Show forest plot | 6 | 611 | Odds Ratio (M‐H, Fixed, 95% CI) | 0.29 [0.12, 0.71] | ||||||||||||||||||||||||||||||||||||||||||||||||||||||||||||||||||||||||||||||||||||||||||||||||||||
| Analysis 2.17  Comparison 2 LH versus AH, Outcome 17 Wound/abdominal wall infection. | ||||||||||||||||||||||||||||||||||||||||||||||||||||||||||||||||||||||||||||||||||||||||||||||||||||||||
| 17.1 LAVH versus AH | 1 | 81 | Odds Ratio (M‐H, Fixed, 95% CI) | 0.20 [0.01, 4.19] | ||||||||||||||||||||||||||||||||||||||||||||||||||||||||||||||||||||||||||||||||||||||||||||||||||||
| 17.2 LH(a) versus AH | 4 | 259 | Odds Ratio (M‐H, Fixed, 95% CI) | 0.35 [0.12, 1.03] | ||||||||||||||||||||||||||||||||||||||||||||||||||||||||||||||||||||||||||||||||||||||||||||||||||||
| 17.3 LH (method unspecified) versus AH | 1 | 190 | Odds Ratio (M‐H, Fixed, 95% CI) | 0.24 [0.03, 2.21] | ||||||||||||||||||||||||||||||||||||||||||||||||||||||||||||||||||||||||||||||||||||||||||||||||||||
| 17.4 LAVH versus minilaparotomy AH | 1 | 81 | Odds Ratio (M‐H, Fixed, 95% CI) | 0.20 [0.01, 4.19] | ||||||||||||||||||||||||||||||||||||||||||||||||||||||||||||||||||||||||||||||||||||||||||||||||||||
| 18 Urinary tract infection Show forest plot | 8 | 659 | Odds Ratio (M‐H, Fixed, 95% CI) | 1.04 [0.54, 2.00] | ||||||||||||||||||||||||||||||||||||||||||||||||||||||||||||||||||||||||||||||||||||||||||||||||||||
| Analysis 2.18  Comparison 2 LH versus AH, Outcome 18 Urinary tract infection. | ||||||||||||||||||||||||||||||||||||||||||||||||||||||||||||||||||||||||||||||||||||||||||||||||||||||||
| 18.1 LAVH versus AH | 1 | 80 | Odds Ratio (M‐H, Fixed, 95% CI) | 0.33 [0.01, 8.22] | ||||||||||||||||||||||||||||||||||||||||||||||||||||||||||||||||||||||||||||||||||||||||||||||||||||
| 18.2 LH(a) versus AH | 5 | 339 | Odds Ratio (M‐H, Fixed, 95% CI) | 1.27 [0.55, 2.95] | ||||||||||||||||||||||||||||||||||||||||||||||||||||||||||||||||||||||||||||||||||||||||||||||||||||
| 18.3 LH (method unspecified) versus AH | 2 | 240 | Odds Ratio (M‐H, Fixed, 95% CI) | 0.84 [0.26, 2.69] | ||||||||||||||||||||||||||||||||||||||||||||||||||||||||||||||||||||||||||||||||||||||||||||||||||||
| 19 Chest infection Show forest plot | 3 | 294 | Odds Ratio (M‐H, Fixed, 95% CI) | 0.31 [0.07, 1.35] | ||||||||||||||||||||||||||||||||||||||||||||||||||||||||||||||||||||||||||||||||||||||||||||||||||||
| Analysis 2.19  Comparison 2 LH versus AH, Outcome 19 Chest infection. | ||||||||||||||||||||||||||||||||||||||||||||||||||||||||||||||||||||||||||||||||||||||||||||||||||||||||
| 19.1 LH(a) versus AH | 2 | 104 | Odds Ratio (M‐H, Fixed, 95% CI) | 0.63 [0.10, 3.93] | ||||||||||||||||||||||||||||||||||||||||||||||||||||||||||||||||||||||||||||||||||||||||||||||||||||
| 19.2 LH (method not specified) versus AH | 1 | 190 | Odds Ratio (M‐H, Fixed, 95% CI) | 0.11 [0.01, 2.01] | ||||||||||||||||||||||||||||||||||||||||||||||||||||||||||||||||||||||||||||||||||||||||||||||||||||
| 20 Febrile episodes or unspecified infection Show forest plot | 16 | Odds Ratio (M‐H, Fixed, 95% CI) | Subtotals only | |||||||||||||||||||||||||||||||||||||||||||||||||||||||||||||||||||||||||||||||||||||||||||||||||||||
| Analysis 2.20  Comparison 2 LH versus AH, Outcome 20 Febrile episodes or unspecified infection. | ||||||||||||||||||||||||||||||||||||||||||||||||||||||||||||||||||||||||||||||||||||||||||||||||||||||||
| 20.1 LAVH versus AH | 4 | 339 | Odds Ratio (M‐H, Fixed, 95% CI) | 0.25 [0.09, 0.73] | ||||||||||||||||||||||||||||||||||||||||||||||||||||||||||||||||||||||||||||||||||||||||||||||||||||
| 20.2 LH(a) versus AH | 7 | 572 | Odds Ratio (M‐H, Fixed, 95% CI) | 0.55 [0.33, 0.90] | ||||||||||||||||||||||||||||||||||||||||||||||||||||||||||||||||||||||||||||||||||||||||||||||||||||
| 20.3 TLH versus AH | 2 | 161 | Odds Ratio (M‐H, Fixed, 95% CI) | 0.36 [0.11, 1.21] | ||||||||||||||||||||||||||||||||||||||||||||||||||||||||||||||||||||||||||||||||||||||||||||||||||||
| 20.4 LH (method unspecified) versus AH | 3 | 1116 | Odds Ratio (M‐H, Fixed, 95% CI) | 0.94 [0.65, 1.37] | ||||||||||||||||||||||||||||||||||||||||||||||||||||||||||||||||||||||||||||||||||||||||||||||||||||
| 20.5 LAVH versus minilaparotomy AH | 1 | 81 | Odds Ratio (M‐H, Fixed, 95% CI) | 0.14 [0.01, 2.72] | ||||||||||||||||||||||||||||||||||||||||||||||||||||||||||||||||||||||||||||||||||||||||||||||||||||
| 21 Thromboembolism Show forest plot | 3 | 1125 | Odds Ratio (M‐H, Fixed, 95% CI) | 0.89 [0.23, 3.39] | ||||||||||||||||||||||||||||||||||||||||||||||||||||||||||||||||||||||||||||||||||||||||||||||||||||
| Analysis 2.21 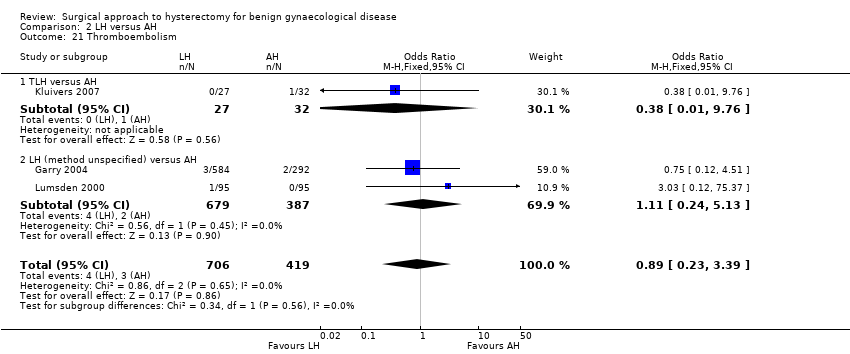 Comparison 2 LH versus AH, Outcome 21 Thromboembolism. | ||||||||||||||||||||||||||||||||||||||||||||||||||||||||||||||||||||||||||||||||||||||||||||||||||||||||
| 21.1 TLH versus AH | 1 | 59 | Odds Ratio (M‐H, Fixed, 95% CI) | 0.38 [0.01, 9.76] | ||||||||||||||||||||||||||||||||||||||||||||||||||||||||||||||||||||||||||||||||||||||||||||||||||||
| 21.2 LH (method unspecified) versus AH | 2 | 1066 | Odds Ratio (M‐H, Fixed, 95% CI) | 1.11 [0.24, 5.13] | ||||||||||||||||||||||||||||||||||||||||||||||||||||||||||||||||||||||||||||||||||||||||||||||||||||
| 22 Wound dehiscence Show forest plot | 1 | Odds Ratio (M‐H, Fixed, 95% CI) | Subtotals only | |||||||||||||||||||||||||||||||||||||||||||||||||||||||||||||||||||||||||||||||||||||||||||||||||||||
| Analysis 2.22 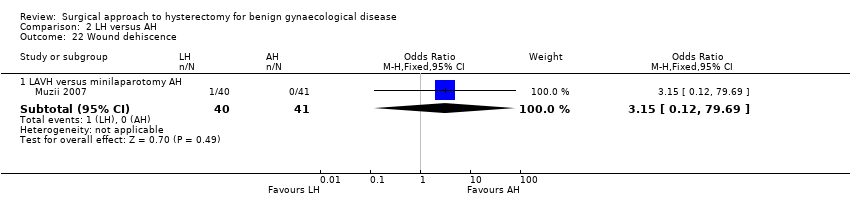 Comparison 2 LH versus AH, Outcome 22 Wound dehiscence. | ||||||||||||||||||||||||||||||||||||||||||||||||||||||||||||||||||||||||||||||||||||||||||||||||||||||||
| 22.1 LAVH versus minilaparotomy AH | 1 | 81 | Odds Ratio (M‐H, Fixed, 95% CI) | 3.15 [0.12, 79.69] | ||||||||||||||||||||||||||||||||||||||||||||||||||||||||||||||||||||||||||||||||||||||||||||||||||||
| 23 Return to normal activities (descriptive data) Show forest plot | Other data | No numeric data | ||||||||||||||||||||||||||||||||||||||||||||||||||||||||||||||||||||||||||||||||||||||||||||||||||||||
| Analysis 2.23
Comparison 2 LH versus AH, Outcome 23 Return to normal activities (descriptive data). | ||||||||||||||||||||||||||||||||||||||||||||||||||||||||||||||||||||||||||||||||||||||||||||||||||||||||
| 24 Long‐term outcomes: quality of life (descriptive data) Show forest plot | Other data | No numeric data | ||||||||||||||||||||||||||||||||||||||||||||||||||||||||||||||||||||||||||||||||||||||||||||||||||||||
| Analysis 2.24
Comparison 2 LH versus AH, Outcome 24 Long‐term outcomes: quality of life (descriptive data). | ||||||||||||||||||||||||||||||||||||||||||||||||||||||||||||||||||||||||||||||||||||||||||||||||||||||||
| 25 Operation time (descriptive data) Show forest plot | Other data | No numeric data | ||||||||||||||||||||||||||||||||||||||||||||||||||||||||||||||||||||||||||||||||||||||||||||||||||||||
| Analysis 2.25
Comparison 2 LH versus AH, Outcome 25 Operation time (descriptive data). | ||||||||||||||||||||||||||||||||||||||||||||||||||||||||||||||||||||||||||||||||||||||||||||||||||||||||
| 26 Length of hospital stay (descriptive data) Show forest plot | Other data | No numeric data | ||||||||||||||||||||||||||||||||||||||||||||||||||||||||||||||||||||||||||||||||||||||||||||||||||||||
| Analysis 2.26
Comparison 2 LH versus AH, Outcome 26 Length of hospital stay (descriptive data). | ||||||||||||||||||||||||||||||||||||||||||||||||||||||||||||||||||||||||||||||||||||||||||||||||||||||||
| 27 Pain relief (descriptive data) Show forest plot | Other data | No numeric data | ||||||||||||||||||||||||||||||||||||||||||||||||||||||||||||||||||||||||||||||||||||||||||||||||||||||
| Analysis 2.27
Comparison 2 LH versus AH, Outcome 27 Pain relief (descriptive data). | ||||||||||||||||||||||||||||||||||||||||||||||||||||||||||||||||||||||||||||||||||||||||||||||||||||||||
| 27.1 Pain scales | Other data | No numeric data | ||||||||||||||||||||||||||||||||||||||||||||||||||||||||||||||||||||||||||||||||||||||||||||||||||||||
| 27.2 Postoperative analgesics | Other data | No numeric data | ||||||||||||||||||||||||||||||||||||||||||||||||||||||||||||||||||||||||||||||||||||||||||||||||||||||
| 27.3 Recovery from pain (days) | Other data | No numeric data | ||||||||||||||||||||||||||||||||||||||||||||||||||||||||||||||||||||||||||||||||||||||||||||||||||||||
| 28 Cost (descriptive data) Show forest plot | Other data | No numeric data | ||||||||||||||||||||||||||||||||||||||||||||||||||||||||||||||||||||||||||||||||||||||||||||||||||||||
| Analysis 2.28
Comparison 2 LH versus AH, Outcome 28 Cost (descriptive data). | ||||||||||||||||||||||||||||||||||||||||||||||||||||||||||||||||||||||||||||||||||||||||||||||||||||||||
| Outcome or subgroup title | No. of studies | No. of participants | Statistical method | Effect size | ||||||||||||||||||||||||||||||||||||||||||||||||||
| 1 Return to normal activities (days) Show forest plot | 2 | 140 | Mean Difference (IV, Fixed, 95% CI) | ‐1.07 [‐4.21, 2.06] | ||||||||||||||||||||||||||||||||||||||||||||||||||
| Analysis 3.1  Comparison 3 LH versus VH, Outcome 1 Return to normal activities (days). | ||||||||||||||||||||||||||||||||||||||||||||||||||||||
| 1.1 LAVH versus VH | 1 | 80 | Mean Difference (IV, Fixed, 95% CI) | ‐1.60 [‐5.11, 1.91] | ||||||||||||||||||||||||||||||||||||||||||||||||||
| 1.2 LH(a) versus VH | 1 | 60 | Mean Difference (IV, Fixed, 95% CI) | 1.0 [‐5.95, 7.95] | ||||||||||||||||||||||||||||||||||||||||||||||||||
| 2 Ureter injury Show forest plot | 2 | 594 | Odds Ratio (M‐H, Fixed, 95% CI) | 1.51 [0.06, 37.18] | ||||||||||||||||||||||||||||||||||||||||||||||||||
| Analysis 3.2 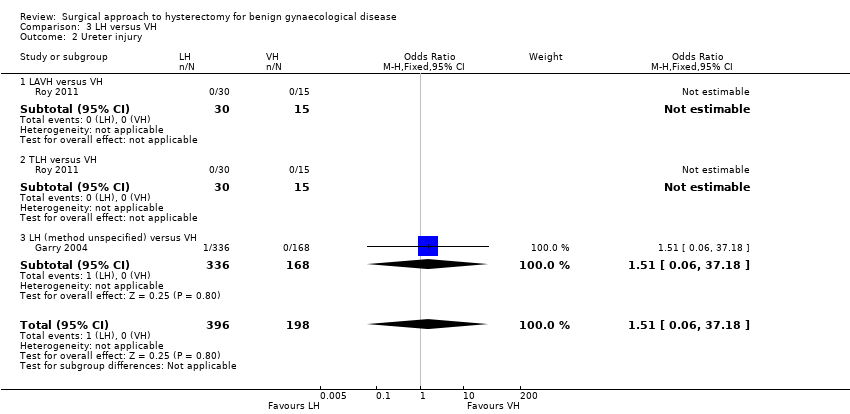 Comparison 3 LH versus VH, Outcome 2 Ureter injury. | ||||||||||||||||||||||||||||||||||||||||||||||||||||||
| 2.1 LAVH versus VH | 1 | 45 | Odds Ratio (M‐H, Fixed, 95% CI) | 0.0 [0.0, 0.0] | ||||||||||||||||||||||||||||||||||||||||||||||||||
| 2.2 TLH versus VH | 1 | 45 | Odds Ratio (M‐H, Fixed, 95% CI) | 0.0 [0.0, 0.0] | ||||||||||||||||||||||||||||||||||||||||||||||||||
| 2.3 LH (method unspecified) versus VH | 1 | 504 | Odds Ratio (M‐H, Fixed, 95% CI) | 1.51 [0.06, 37.18] | ||||||||||||||||||||||||||||||||||||||||||||||||||
| 3 Bladder injury Show forest plot | 7 | 895 | Odds Ratio (M‐H, Fixed, 95% CI) | 0.91 [0.32, 2.56] | ||||||||||||||||||||||||||||||||||||||||||||||||||
| Analysis 3.3  Comparison 3 LH versus VH, Outcome 3 Bladder injury. | ||||||||||||||||||||||||||||||||||||||||||||||||||||||
| 3.1 LAVH versus VH | 2 | 125 | Odds Ratio (M‐H, Fixed, 95% CI) | 0.33 [0.01, 8.22] | ||||||||||||||||||||||||||||||||||||||||||||||||||
| 3.2 LH(a) versus VH | 2 | 136 | Odds Ratio (M‐H, Fixed, 95% CI) | 2.98 [0.30, 29.43] | ||||||||||||||||||||||||||||||||||||||||||||||||||
| 3.3 TLH versus VH | 2 | 85 | Odds Ratio (M‐H, Fixed, 95% CI) | 0.32 [0.01, 8.26] | ||||||||||||||||||||||||||||||||||||||||||||||||||
| 3.4 LH (method unspecified) versus VH | 2 | 549 | Odds Ratio (M‐H, Fixed, 95% CI) | 0.83 [0.18, 3.79] | ||||||||||||||||||||||||||||||||||||||||||||||||||
| 4 Urinary tract (bladder or ureter) injury Show forest plot | 7 | 895 | Odds Ratio (M‐H, Fixed, 95% CI) | 1.00 [0.36, 2.75] | ||||||||||||||||||||||||||||||||||||||||||||||||||
| Analysis 3.4  Comparison 3 LH versus VH, Outcome 4 Urinary tract (bladder or ureter) injury. | ||||||||||||||||||||||||||||||||||||||||||||||||||||||
| 4.1 LAVH versus VH | 2 | 125 | Odds Ratio (M‐H, Fixed, 95% CI) | 0.33 [0.01, 8.22] | ||||||||||||||||||||||||||||||||||||||||||||||||||
| 4.2 LH(a) versus VH | 2 | 136 | Odds Ratio (M‐H, Fixed, 95% CI) | 2.98 [0.30, 29.43] | ||||||||||||||||||||||||||||||||||||||||||||||||||
| 4.3 TLH versus VH | 2 | 85 | Odds Ratio (M‐H, Fixed, 95% CI) | 0.32 [0.01, 8.26] | ||||||||||||||||||||||||||||||||||||||||||||||||||
| 4.4 LH (method unspecified) versus VH | 2 | 549 | Odds Ratio (M‐H, Fixed, 95% CI) | 1.01 [0.23, 4.38] | ||||||||||||||||||||||||||||||||||||||||||||||||||
| 5 Bowel injury Show forest plot | 2 | 639 | Odds Ratio (M‐H, Fixed, 95% CI) | 0.0 [0.0, 0.0] | ||||||||||||||||||||||||||||||||||||||||||||||||||
| Analysis 3.5 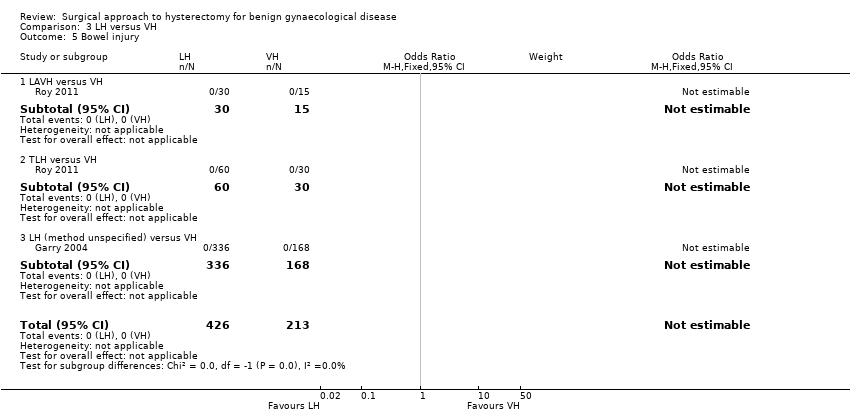 Comparison 3 LH versus VH, Outcome 5 Bowel injury. | ||||||||||||||||||||||||||||||||||||||||||||||||||||||
| 5.1 LAVH versus VH | 1 | 45 | Odds Ratio (M‐H, Fixed, 95% CI) | 0.0 [0.0, 0.0] | ||||||||||||||||||||||||||||||||||||||||||||||||||
| 5.2 TLH versus VH | 1 | 90 | Odds Ratio (M‐H, Fixed, 95% CI) | 0.0 [0.0, 0.0] | ||||||||||||||||||||||||||||||||||||||||||||||||||
| 5.3 LH (method unspecified) versus VH | 1 | 504 | Odds Ratio (M‐H, Fixed, 95% CI) | 0.0 [0.0, 0.0] | ||||||||||||||||||||||||||||||||||||||||||||||||||
| 6 Vascular injury Show forest plot | 4 | 685 | Odds Ratio (M‐H, Fixed, 95% CI) | 1.58 [0.48, 5.27] | ||||||||||||||||||||||||||||||||||||||||||||||||||
| Analysis 3.6 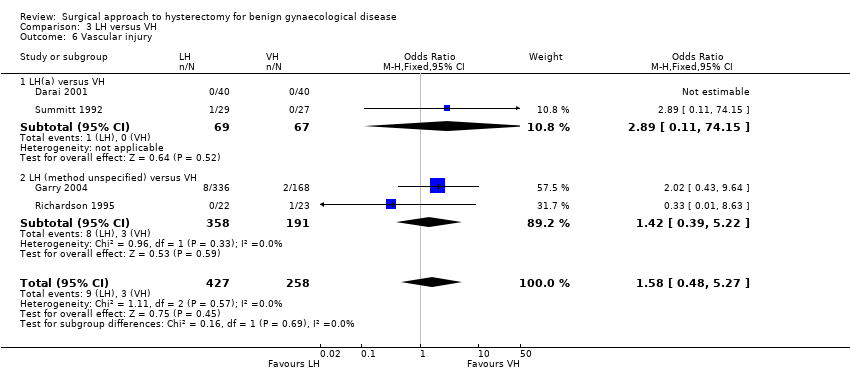 Comparison 3 LH versus VH, Outcome 6 Vascular injury. | ||||||||||||||||||||||||||||||||||||||||||||||||||||||
| 6.1 LH(a) versus VH | 2 | 136 | Odds Ratio (M‐H, Fixed, 95% CI) | 2.89 [0.11, 74.15] | ||||||||||||||||||||||||||||||||||||||||||||||||||
| 6.2 LH (method unspecified) versus VH | 2 | 549 | Odds Ratio (M‐H, Fixed, 95% CI) | 1.42 [0.39, 5.22] | ||||||||||||||||||||||||||||||||||||||||||||||||||
| 7 Fistula Show forest plot | 1 | Odds Ratio (M‐H, Fixed, 95% CI) | Subtotals only | |||||||||||||||||||||||||||||||||||||||||||||||||||
| Analysis 3.7  Comparison 3 LH versus VH, Outcome 7 Fistula. | ||||||||||||||||||||||||||||||||||||||||||||||||||||||
| 7.1 LH(a) versus VH | 1 | 56 | Odds Ratio (M‐H, Fixed, 95% CI) | 0.30 [0.01, 7.67] | ||||||||||||||||||||||||||||||||||||||||||||||||||
| 8 Urinary dysfunction Show forest plot | 1 | Odds Ratio (M‐H, Fixed, 95% CI) | Subtotals only | |||||||||||||||||||||||||||||||||||||||||||||||||||
| Analysis 3.8  Comparison 3 LH versus VH, Outcome 8 Urinary dysfunction. | ||||||||||||||||||||||||||||||||||||||||||||||||||||||
| 8.1 LAVH versus VH | 1 | 80 | Odds Ratio (M‐H, Fixed, 95% CI) | 3.08 [0.12, 77.80] | ||||||||||||||||||||||||||||||||||||||||||||||||||
| 9 Operation time (mins) Show forest plot | 9 | Mean Difference (IV, Random, 95% CI) | Subtotals only | |||||||||||||||||||||||||||||||||||||||||||||||||||
| Analysis 3.9  Comparison 3 LH versus VH, Outcome 9 Operation time (mins). | ||||||||||||||||||||||||||||||||||||||||||||||||||||||
| 9.1 LAVH versus VH | 5 | 377 | Mean Difference (IV, Random, 95% CI) | 33.60 [20.13, 47.07] | ||||||||||||||||||||||||||||||||||||||||||||||||||
| 9.2 LH(a) versus VH | 3 | 213 | Mean Difference (IV, Random, 95% CI) | 53.58 [43.67, 63.49] | ||||||||||||||||||||||||||||||||||||||||||||||||||
| 9.3 TLH versus VH | 1 | 60 | Mean Difference (IV, Random, 95% CI) | 17.30 [3.34, 31.26] | ||||||||||||||||||||||||||||||||||||||||||||||||||
| 10 Bleeding Show forest plot | 3 | 614 | Odds Ratio (M‐H, Fixed, 95% CI) | 1.55 [0.24, 10.09] | ||||||||||||||||||||||||||||||||||||||||||||||||||
| Analysis 3.10 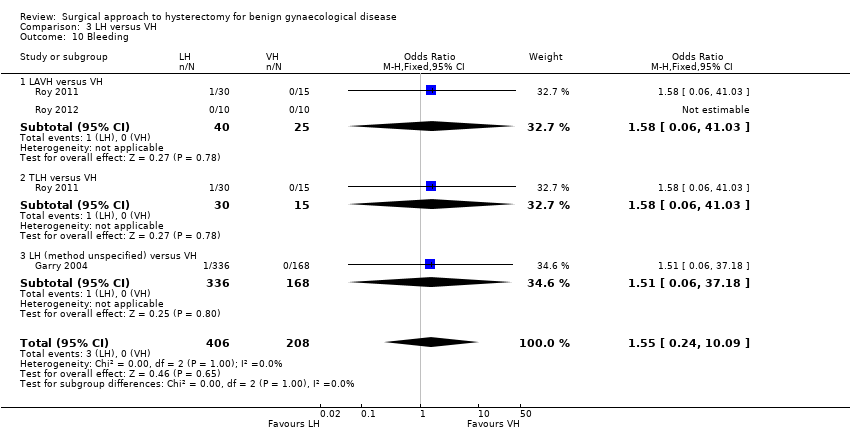 Comparison 3 LH versus VH, Outcome 10 Bleeding. | ||||||||||||||||||||||||||||||||||||||||||||||||||||||
| 10.1 LAVH versus VH | 2 | 65 | Odds Ratio (M‐H, Fixed, 95% CI) | 1.58 [0.06, 41.03] | ||||||||||||||||||||||||||||||||||||||||||||||||||
| 10.2 TLH versus VH | 1 | 45 | Odds Ratio (M‐H, Fixed, 95% CI) | 1.58 [0.06, 41.03] | ||||||||||||||||||||||||||||||||||||||||||||||||||
| 10.3 LH (method unspecified) versus VH | 1 | 504 | Odds Ratio (M‐H, Fixed, 95% CI) | 1.51 [0.06, 37.18] | ||||||||||||||||||||||||||||||||||||||||||||||||||
| 11 Transfusion Show forest plot | 8 | 1039 | Odds Ratio (M‐H, Fixed, 95% CI) | 1.60 [0.80, 3.18] | ||||||||||||||||||||||||||||||||||||||||||||||||||
| Analysis 3.11  Comparison 3 LH versus VH, Outcome 11 Transfusion. | ||||||||||||||||||||||||||||||||||||||||||||||||||||||
| 11.1 LAVH versus VH | 4 | 273 | Odds Ratio (M‐H, Fixed, 95% CI) | 0.74 [0.16, 3.41] | ||||||||||||||||||||||||||||||||||||||||||||||||||
| 11.2 LH(a) versus VH | 3 | 217 | Odds Ratio (M‐H, Fixed, 95% CI) | 2.49 [0.63, 9.86] | ||||||||||||||||||||||||||||||||||||||||||||||||||
| 11.3 TLH versus VH | 1 | 45 | Odds Ratio (M‐H, Fixed, 95% CI) | 1.58 [0.06, 41.03] | ||||||||||||||||||||||||||||||||||||||||||||||||||
| 11.4 LH (method unspecified) versus VH | 1 | 504 | Odds Ratio (M‐H, Fixed, 95% CI) | 1.74 [0.63, 4.79] | ||||||||||||||||||||||||||||||||||||||||||||||||||
| 12 Pelvic haematoma Show forest plot | 4 | 308 | Odds Ratio (M‐H, Fixed, 95% CI) | 1.21 [0.36, 4.03] | ||||||||||||||||||||||||||||||||||||||||||||||||||
| Analysis 3.12  Comparison 3 LH versus VH, Outcome 12 Pelvic haematoma. | ||||||||||||||||||||||||||||||||||||||||||||||||||||||
| 12.1 LAVH versus VH | 3 | 228 | Odds Ratio (M‐H, Fixed, 95% CI) | 1.70 [0.40, 7.26] | ||||||||||||||||||||||||||||||||||||||||||||||||||
| 12.2 LH(a) versus VH | 1 | 80 | Odds Ratio (M‐H, Fixed, 95% CI) | 0.49 [0.04, 5.60] | ||||||||||||||||||||||||||||||||||||||||||||||||||
| 13 Unintended laparotomy Show forest plot | 10 | 1160 | Odds Ratio (M‐H, Fixed, 95% CI) | 1.55 [0.76, 3.16] | ||||||||||||||||||||||||||||||||||||||||||||||||||
| Analysis 3.13 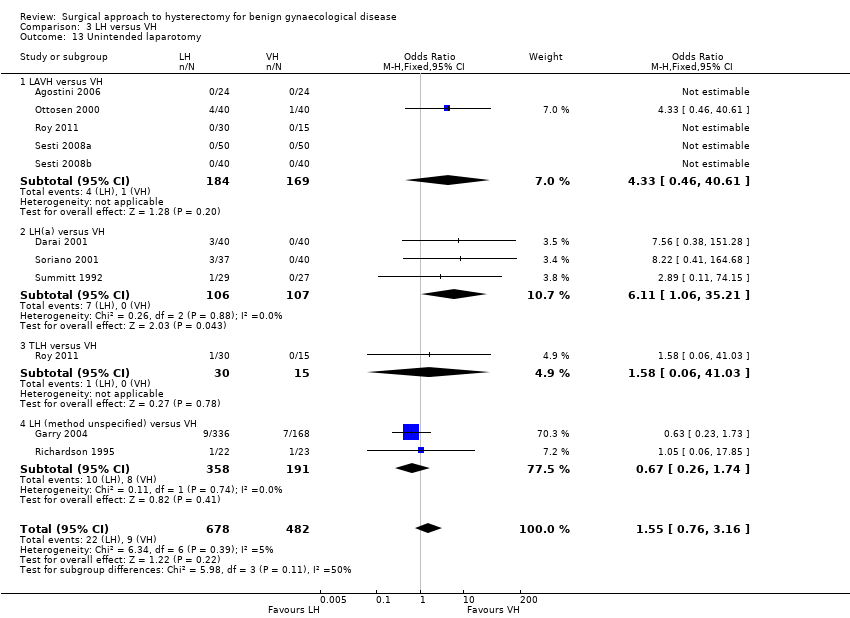 Comparison 3 LH versus VH, Outcome 13 Unintended laparotomy. | ||||||||||||||||||||||||||||||||||||||||||||||||||||||
| 13.1 LAVH versus VH | 5 | 353 | Odds Ratio (M‐H, Fixed, 95% CI) | 4.33 [0.46, 40.61] | ||||||||||||||||||||||||||||||||||||||||||||||||||
| 13.2 LH(a) versus VH | 3 | 213 | Odds Ratio (M‐H, Fixed, 95% CI) | 6.11 [1.06, 35.21] | ||||||||||||||||||||||||||||||||||||||||||||||||||
| 13.3 TLH versus VH | 1 | 45 | Odds Ratio (M‐H, Fixed, 95% CI) | 1.58 [0.06, 41.03] | ||||||||||||||||||||||||||||||||||||||||||||||||||
| 13.4 LH (method unspecified) versus VH | 2 | 549 | Odds Ratio (M‐H, Fixed, 95% CI) | 0.67 [0.26, 1.74] | ||||||||||||||||||||||||||||||||||||||||||||||||||
| 14 Vaginal cuff infection Show forest plot | 4 | 276 | Odds Ratio (M‐H, Fixed, 95% CI) | 0.98 [0.22, 4.39] | ||||||||||||||||||||||||||||||||||||||||||||||||||
| Analysis 3.14 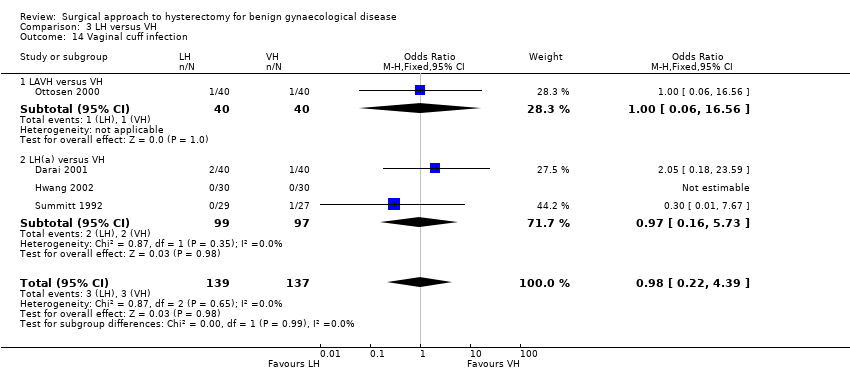 Comparison 3 LH versus VH, Outcome 14 Vaginal cuff infection. | ||||||||||||||||||||||||||||||||||||||||||||||||||||||
| 14.1 LAVH versus VH | 1 | 80 | Odds Ratio (M‐H, Fixed, 95% CI) | 1.0 [0.06, 16.56] | ||||||||||||||||||||||||||||||||||||||||||||||||||
| 14.2 LH(a) versus VH | 3 | 196 | Odds Ratio (M‐H, Fixed, 95% CI) | 0.97 [0.16, 5.73] | ||||||||||||||||||||||||||||||||||||||||||||||||||
| 15 Wound/abdominal wall infection Show forest plot | 2 | 170 | Odds Ratio (M‐H, Fixed, 95% CI) | 2.88 [0.31, 27.06] | ||||||||||||||||||||||||||||||||||||||||||||||||||
| Analysis 3.15  Comparison 3 LH versus VH, Outcome 15 Wound/abdominal wall infection. | ||||||||||||||||||||||||||||||||||||||||||||||||||||||
| 15.1 LAVH versus VH | 1 | 45 | Odds Ratio (M‐H, Fixed, 95% CI) | 2.72 [0.12, 60.29] | ||||||||||||||||||||||||||||||||||||||||||||||||||
| 15.2 LH(a) versus VH | 1 | 80 | Odds Ratio (M‐H, Fixed, 95% CI) | 3.08 [0.12, 77.80] | ||||||||||||||||||||||||||||||||||||||||||||||||||
| 15.3 TLH versus VH | 1 | 45 | Odds Ratio (M‐H, Fixed, 95% CI) | 0.0 [0.0, 0.0] | ||||||||||||||||||||||||||||||||||||||||||||||||||
| 16 Urinary tract infection Show forest plot | 3 | 230 | Odds Ratio (M‐H, Fixed, 95% CI) | 1.66 [0.40, 6.82] | ||||||||||||||||||||||||||||||||||||||||||||||||||
| Analysis 3.16  Comparison 3 LH versus VH, Outcome 16 Urinary tract infection. | ||||||||||||||||||||||||||||||||||||||||||||||||||||||
| 16.1 LAVH versus VH | 2 | 125 | Odds Ratio (M‐H, Fixed, 95% CI) | 1.02 [0.15, 6.89] | ||||||||||||||||||||||||||||||||||||||||||||||||||
| 16.2 LH(a) versus VH | 1 | 60 | Odds Ratio (M‐H, Fixed, 95% CI) | 3.10 [0.12, 79.23] | ||||||||||||||||||||||||||||||||||||||||||||||||||
| 16.3 TLH versus VH | 1 | 45 | Odds Ratio (M‐H, Fixed, 95% CI) | 2.72 [0.12, 60.29] | ||||||||||||||||||||||||||||||||||||||||||||||||||
| 17 Chest infection Show forest plot | 1 | Odds Ratio (M‐H, Fixed, 95% CI) | Subtotals only | |||||||||||||||||||||||||||||||||||||||||||||||||||
| Analysis 3.17  Comparison 3 LH versus VH, Outcome 17 Chest infection. | ||||||||||||||||||||||||||||||||||||||||||||||||||||||
| 17.1 LH(a) versus VH | 1 | 60 | Odds Ratio (M‐H, Fixed, 95% CI) | 0.19 [0.01, 4.06] | ||||||||||||||||||||||||||||||||||||||||||||||||||
| 18 Febrile episodes or unspecified infection Show forest plot | 9 | 1074 | Odds Ratio (M‐H, Fixed, 95% CI) | 0.80 [0.51, 1.24] | ||||||||||||||||||||||||||||||||||||||||||||||||||
| Analysis 3.18 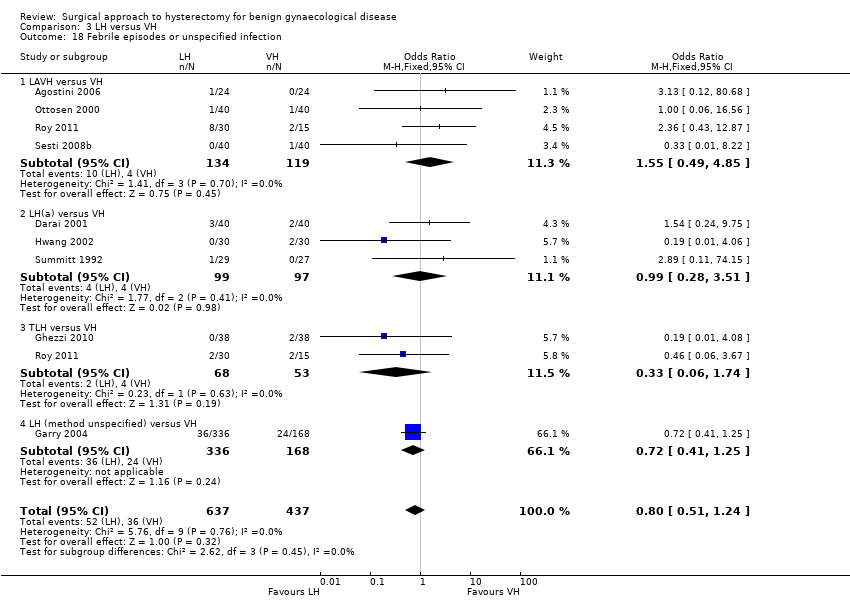 Comparison 3 LH versus VH, Outcome 18 Febrile episodes or unspecified infection. | ||||||||||||||||||||||||||||||||||||||||||||||||||||||
| 18.1 LAVH versus VH | 4 | 253 | Odds Ratio (M‐H, Fixed, 95% CI) | 1.55 [0.49, 4.85] | ||||||||||||||||||||||||||||||||||||||||||||||||||
| 18.2 LH(a) versus VH | 3 | 196 | Odds Ratio (M‐H, Fixed, 95% CI) | 0.99 [0.28, 3.51] | ||||||||||||||||||||||||||||||||||||||||||||||||||
| 18.3 TLH versus VH | 2 | 121 | Odds Ratio (M‐H, Fixed, 95% CI) | 0.33 [0.06, 1.74] | ||||||||||||||||||||||||||||||||||||||||||||||||||
| 18.4 LH (method unspecified) versus VH | 1 | 504 | Odds Ratio (M‐H, Fixed, 95% CI) | 0.72 [0.41, 1.25] | ||||||||||||||||||||||||||||||||||||||||||||||||||
| 19 Thromboembolism Show forest plot | 2 | 564 | Odds Ratio (M‐H, Fixed, 95% CI) | 1.00 [0.15, 6.67] | ||||||||||||||||||||||||||||||||||||||||||||||||||
| Analysis 3.19  Comparison 3 LH versus VH, Outcome 19 Thromboembolism. | ||||||||||||||||||||||||||||||||||||||||||||||||||||||
| 19.1 TLH versus VH | 1 | 60 | Odds Ratio (M‐H, Fixed, 95% CI) | 0.32 [0.01, 8.24] | ||||||||||||||||||||||||||||||||||||||||||||||||||
| 19.2 LH (method unspecified) versus VH | 1 | 504 | Odds Ratio (M‐H, Fixed, 95% CI) | 2.52 [0.12, 52.76] | ||||||||||||||||||||||||||||||||||||||||||||||||||
| 20 Length of hospital stay (days) Show forest plot | 7 | 525 | Mean Difference (IV, Random, 95% CI) | 0.88 [0.73, 1.03] | ||||||||||||||||||||||||||||||||||||||||||||||||||
| Analysis 3.20  Comparison 3 LH versus VH, Outcome 20 Length of hospital stay (days). | ||||||||||||||||||||||||||||||||||||||||||||||||||||||
| 20.1 LAVH versus VH | 4 | 308 | Mean Difference (IV, Random, 95% CI) | 0.91 [0.76, 1.06] | ||||||||||||||||||||||||||||||||||||||||||||||||||
| 20.2 LH(a) versus VH | 2 | 157 | Mean Difference (IV, Random, 95% CI) | 0.40 [‐0.42, 1.22] | ||||||||||||||||||||||||||||||||||||||||||||||||||
| 20.3 TLH versus VH | 1 | 60 | Mean Difference (IV, Random, 95% CI) | ‐0.5 [‐2.41, 1.41] | ||||||||||||||||||||||||||||||||||||||||||||||||||
| 21 Return to normal activities (descriptive data) Show forest plot | Other data | No numeric data | ||||||||||||||||||||||||||||||||||||||||||||||||||||
| Analysis 3.21
Comparison 3 LH versus VH, Outcome 21 Return to normal activities (descriptive data). | ||||||||||||||||||||||||||||||||||||||||||||||||||||||
| 22 Long‐term outcomes: quality of life (descriptive data) Show forest plot | Other data | No numeric data | ||||||||||||||||||||||||||||||||||||||||||||||||||||
| Analysis 3.22
Comparison 3 LH versus VH, Outcome 22 Long‐term outcomes: quality of life (descriptive data). | ||||||||||||||||||||||||||||||||||||||||||||||||||||||
| 23 Operation time (descriptive data) Show forest plot | Other data | No numeric data | ||||||||||||||||||||||||||||||||||||||||||||||||||||
| Analysis 3.23
Comparison 3 LH versus VH, Outcome 23 Operation time (descriptive data). | ||||||||||||||||||||||||||||||||||||||||||||||||||||||
| 24 Length of hospital stay (descriptive data) Show forest plot | Other data | No numeric data | ||||||||||||||||||||||||||||||||||||||||||||||||||||
| Analysis 3.24
Comparison 3 LH versus VH, Outcome 24 Length of hospital stay (descriptive data). | ||||||||||||||||||||||||||||||||||||||||||||||||||||||
| 25 Pain relief (descriptive data) Show forest plot | Other data | No numeric data | ||||||||||||||||||||||||||||||||||||||||||||||||||||
| Analysis 3.25
Comparison 3 LH versus VH, Outcome 25 Pain relief (descriptive data). | ||||||||||||||||||||||||||||||||||||||||||||||||||||||
| 25.1 Pain scales | Other data | No numeric data | ||||||||||||||||||||||||||||||||||||||||||||||||||||
| 25.2 Postoperative analgesics | Other data | No numeric data | ||||||||||||||||||||||||||||||||||||||||||||||||||||
| 26 Cost (descriptive data) Show forest plot | Other data | No numeric data | ||||||||||||||||||||||||||||||||||||||||||||||||||||
| Analysis 3.26
Comparison 3 LH versus VH, Outcome 26 Cost (descriptive data). | ||||||||||||||||||||||||||||||||||||||||||||||||||||||
| Outcome or subgroup title | No. of studies | No. of participants | Statistical method | Effect size | |||||||||||||||
| 1 Return to normal activities (days) Show forest plot | 1 | Mean Difference (IV, Fixed, 95% CI) | Subtotals only | ||||||||||||||||
| Analysis 4.1  Comparison 4 RH versus LH, Outcome 1 Return to normal activities (days). | |||||||||||||||||||
| 2 Intraoperative visceral injury (dichotomous) Show forest plot | 1 | Odds Ratio (M‐H, Fixed, 95% CI) | Subtotals only | ||||||||||||||||
| Analysis 4.2  Comparison 4 RH versus LH, Outcome 2 Intraoperative visceral injury (dichotomous). | |||||||||||||||||||
| 2.1 Ureter injury | 1 | 100 | Odds Ratio (M‐H, Fixed, 95% CI) | 0.33 [0.01, 8.21] | |||||||||||||||
| 2.2 Vascular injury | 1 | 100 | Odds Ratio (M‐H, Fixed, 95% CI) | 1.0 [0.06, 16.44] | |||||||||||||||
| 2.3 Wound/abdominal wall infection | 1 | 100 | Odds Ratio (M‐H, Fixed, 95% CI) | 0.33 [0.01, 8.21] | |||||||||||||||
| 2.4 Wound dehiscence | 1 | 100 | Odds Ratio (M‐H, Fixed, 95% CI) | 0.33 [0.01, 8.21] | |||||||||||||||
| 3 Operation time Show forest plot | 2 | 152 | Mean Difference (IV, Random, 95% CI) | 44.09 [5.31, 82.88] | |||||||||||||||
| Analysis 4.3  Comparison 4 RH versus LH, Outcome 3 Operation time. | |||||||||||||||||||
| 4 Transfusion Show forest plot | 1 | Odds Ratio (M‐H, Fixed, 95% CI) | Subtotals only | ||||||||||||||||
| Analysis 4.4  Comparison 4 RH versus LH, Outcome 4 Transfusion. | |||||||||||||||||||
| 5 Return to normal activities (descriptive data) Show forest plot | Other data | No numeric data | |||||||||||||||||
| Analysis 4.5
Comparison 4 RH versus LH, Outcome 5 Return to normal activities (descriptive data). | |||||||||||||||||||
| Outcome or subgroup title | No. of studies | No. of participants | Statistical method | Effect size | ||||||||||||||||
| 1 Bladder injury Show forest plot | 1 | Odds Ratio (M‐H, Fixed, 95% CI) | Subtotals only | |||||||||||||||||
| Analysis 5.1  Comparison 5 SP‐LH versus LH, Outcome 1 Bladder injury. | ||||||||||||||||||||
| 1.1 SP‐TLH versus TLH | 1 | 64 | Odds Ratio (M‐H, Fixed, 95% CI) | 3.51 [0.14, 89.42] | ||||||||||||||||
| 2 Operation time (mins) Show forest plot | 2 | Mean Difference (IV, Fixed, 95% CI) | Totals not selected | |||||||||||||||||
| Analysis 5.2  Comparison 5 SP‐LH versus LH, Outcome 2 Operation time (mins). | ||||||||||||||||||||
| 2.1 SP‐LAVH versus LAVH | 1 | Mean Difference (IV, Fixed, 95% CI) | 0.0 [0.0, 0.0] | |||||||||||||||||
| 2.2 SP‐TLH versus TLH | 1 | Mean Difference (IV, Fixed, 95% CI) | 0.0 [0.0, 0.0] | |||||||||||||||||
| 3 Transfusion Show forest plot | 3 | 203 | Odds Ratio (M‐H, Fixed, 95% CI) | 1.37 [0.30, 6.26] | ||||||||||||||||
| Analysis 5.3 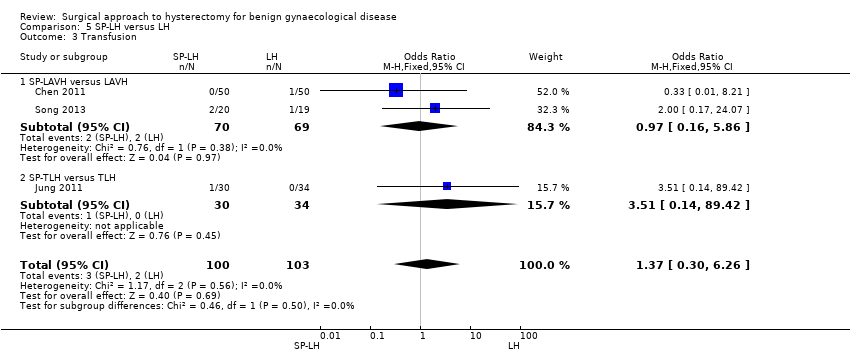 Comparison 5 SP‐LH versus LH, Outcome 3 Transfusion. | ||||||||||||||||||||
| 3.1 SP‐LAVH versus LAVH | 2 | 139 | Odds Ratio (M‐H, Fixed, 95% CI) | 0.97 [0.16, 5.86] | ||||||||||||||||
| 3.2 SP‐TLH versus TLH | 1 | 64 | Odds Ratio (M‐H, Fixed, 95% CI) | 3.51 [0.14, 89.42] | ||||||||||||||||
| 4 Pelvic haematoma Show forest plot | 1 | Odds Ratio (M‐H, Fixed, 95% CI) | Subtotals only | |||||||||||||||||
| Analysis 5.4  Comparison 5 SP‐LH versus LH, Outcome 4 Pelvic haematoma. | ||||||||||||||||||||
| 4.1 SP‐LAVH versus LAVH | 1 | 100 | Odds Ratio (M‐H, Fixed, 95% CI) | 3.06 [0.12, 76.95] | ||||||||||||||||
| 5 Wound/abdominal wall infection Show forest plot | 1 | Odds Ratio (M‐H, Fixed, 95% CI) | Subtotals only | |||||||||||||||||
| Analysis 5.5  Comparison 5 SP‐LH versus LH, Outcome 5 Wound/abdominal wall infection. | ||||||||||||||||||||
| 5.1 SP‐LAVH versus LAVH | 1 | 100 | Odds Ratio (M‐H, Fixed, 95% CI) | 0.33 [0.01, 8.21] | ||||||||||||||||
| 6 Febrile episodes or unspecified infection Show forest plot | 1 | Odds Ratio (M‐H, Fixed, 95% CI) | Subtotals only | |||||||||||||||||
| Analysis 5.6 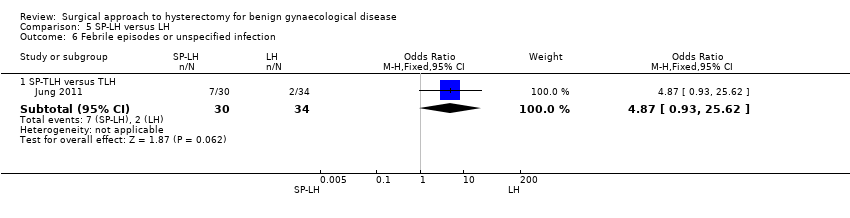 Comparison 5 SP‐LH versus LH, Outcome 6 Febrile episodes or unspecified infection. | ||||||||||||||||||||
| 6.1 SP‐TLH versus TLH | 1 | 64 | Odds Ratio (M‐H, Fixed, 95% CI) | 4.87 [0.93, 25.62] | ||||||||||||||||
| 7 Postoperative ileus Show forest plot | 1 | Odds Ratio (M‐H, Fixed, 95% CI) | Subtotals only | |||||||||||||||||
| Analysis 5.7  Comparison 5 SP‐LH versus LH, Outcome 7 Postoperative ileus. | ||||||||||||||||||||
| 7.1 SP‐TLH versus TLH | 1 | 64 | Odds Ratio (M‐H, Fixed, 95% CI) | 2.36 [0.20, 27.39] | ||||||||||||||||
| 8 Length of hospital stay (days) Show forest plot | 1 | Mean Difference (IV, Fixed, 95% CI) | Subtotals only | |||||||||||||||||
| Analysis 5.8 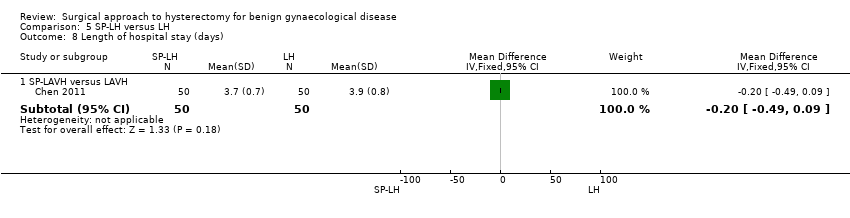 Comparison 5 SP‐LH versus LH, Outcome 8 Length of hospital stay (days). | ||||||||||||||||||||
| 8.1 SP‐LAVH versus LAVH | 1 | 100 | Mean Difference (IV, Fixed, 95% CI) | ‐0.20 [‐0.49, 0.09] | ||||||||||||||||
| 9 Operation time (descriptive data) Show forest plot | Other data | No numeric data | ||||||||||||||||||
| Analysis 5.9
Comparison 5 SP‐LH versus LH, Outcome 9 Operation time (descriptive data). | ||||||||||||||||||||
| 10 Length of hospital stay (descriptive data) Show forest plot | Other data | No numeric data | ||||||||||||||||||
| Analysis 5.10
Comparison 5 SP‐LH versus LH, Outcome 10 Length of hospital stay (descriptive data). | ||||||||||||||||||||
| Outcome or subgroup title | No. of studies | No. of participants | Statistical method | Effect size |
| 1 Intraoperative visceral injury (dich) Show forest plot | 2 | Odds Ratio (M‐H, Fixed, 95% CI) | Subtotals only | |
| Analysis 6.1 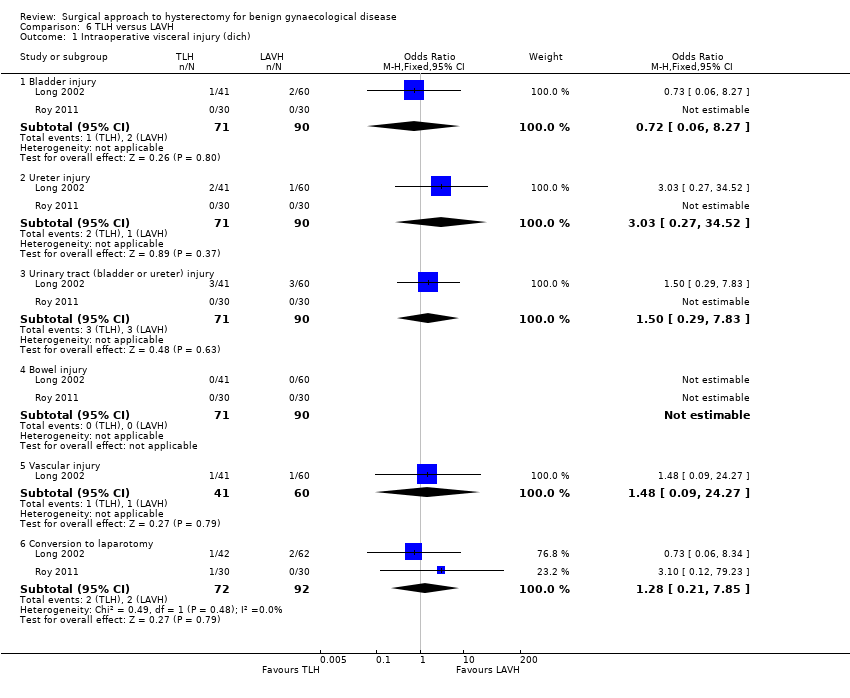 Comparison 6 TLH versus LAVH, Outcome 1 Intraoperative visceral injury (dich). | ||||
| 1.1 Bladder injury | 2 | 161 | Odds Ratio (M‐H, Fixed, 95% CI) | 0.72 [0.06, 8.27] |
| 1.2 Ureter injury | 2 | 161 | Odds Ratio (M‐H, Fixed, 95% CI) | 3.03 [0.27, 34.52] |
| 1.3 Urinary tract (bladder or ureter) injury | 2 | 161 | Odds Ratio (M‐H, Fixed, 95% CI) | 1.5 [0.29, 7.83] |
| 1.4 Bowel injury | 2 | 161 | Odds Ratio (M‐H, Fixed, 95% CI) | 0.0 [0.0, 0.0] |
| 1.5 Vascular injury | 1 | 101 | Odds Ratio (M‐H, Fixed, 95% CI) | 1.48 [0.09, 24.27] |
| 1.6 Conversion to laparotomy | 2 | 164 | Odds Ratio (M‐H, Fixed, 95% CI) | 1.28 [0.21, 7.85] |
| 2 Long‐term complications (dich) Show forest plot | 1 | 202 | Odds Ratio (M‐H, Fixed, 95% CI) | 1.09 [0.54, 2.17] |
| Analysis 6.2 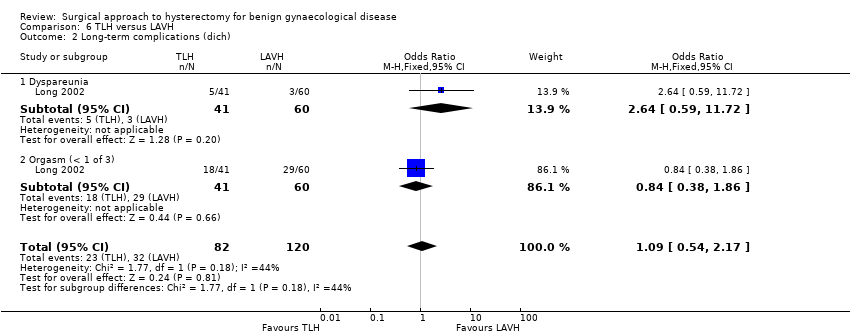 Comparison 6 TLH versus LAVH, Outcome 2 Long‐term complications (dich). | ||||
| 2.1 Dyspareunia | 1 | 101 | Odds Ratio (M‐H, Fixed, 95% CI) | 2.64 [0.59, 11.72] |
| 2.2 Orgasm (< 1 of 3) | 1 | 101 | Odds Ratio (M‐H, Fixed, 95% CI) | 0.84 [0.38, 1.86] |
| 3 Operation time (mins) Show forest plot | 1 | Mean Difference (IV, Fixed, 95% CI) | Subtotals only | |
| Analysis 6.3  Comparison 6 TLH versus LAVH, Outcome 3 Operation time (mins). | ||||
| 4 Short‐term outcomes (dich) Show forest plot | 2 | Odds Ratio (M‐H, Random, 95% CI) | Totals not selected | |
| Analysis 6.4 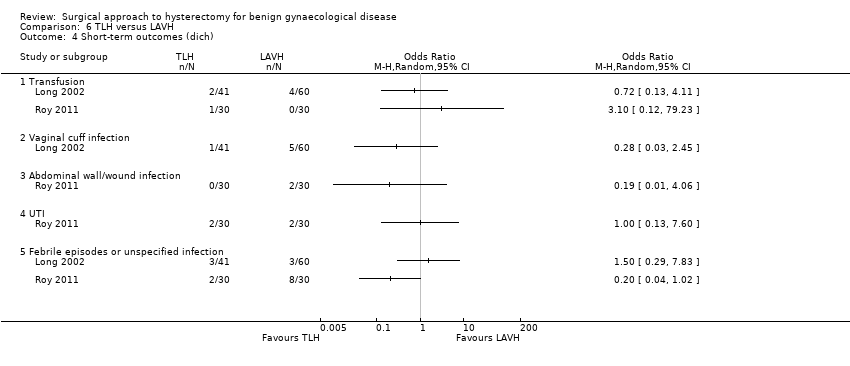 Comparison 6 TLH versus LAVH, Outcome 4 Short‐term outcomes (dich). | ||||
| 4.1 Transfusion | 2 | Odds Ratio (M‐H, Random, 95% CI) | 0.0 [0.0, 0.0] | |
| 4.2 Vaginal cuff infection | 1 | Odds Ratio (M‐H, Random, 95% CI) | 0.0 [0.0, 0.0] | |
| 4.3 Abdominal wall/wound infection | 1 | Odds Ratio (M‐H, Random, 95% CI) | 0.0 [0.0, 0.0] | |
| 4.4 UTI | 1 | Odds Ratio (M‐H, Random, 95% CI) | 0.0 [0.0, 0.0] | |
| 4.5 Febrile episodes or unspecified infection | 2 | Odds Ratio (M‐H, Random, 95% CI) | 0.0 [0.0, 0.0] | |
| 5 Length of hospital stay (days) Show forest plot | 1 | Mean Difference (IV, Fixed, 95% CI) | Subtotals only | |
| Analysis 6.5  Comparison 6 TLH versus LAVH, Outcome 5 Length of hospital stay (days). | ||||
| Outcome or subgroup title | No. of studies | No. of participants | Statistical method | Effect size | ||||||||||||
| 1 Operation time (descriptive data) Show forest plot | Other data | No numeric data | ||||||||||||||
| Analysis 7.1
Comparison 7 Mini‐LH versus TLH, Outcome 1 Operation time (descriptive data). | ||||||||||||||||
| 2 Length of hospital stay (descriptive data) Show forest plot | Other data | No numeric data | ||||||||||||||
| Analysis 7.2
Comparison 7 Mini‐LH versus TLH, Outcome 2 Length of hospital stay (descriptive data). | ||||||||||||||||

Study flow diagram.
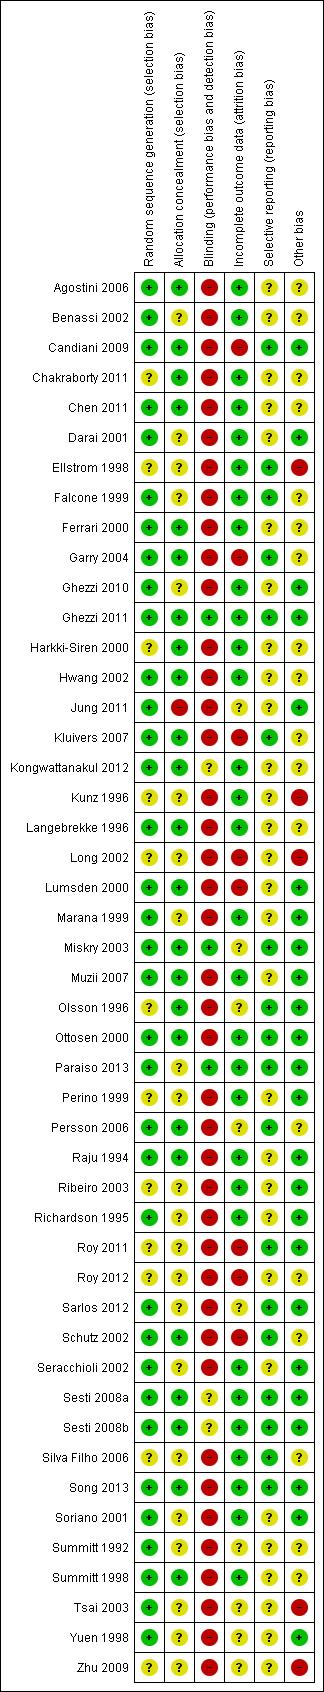
'Risk of bias' summary: review authors' judgements about each methodological quality item for each included study.
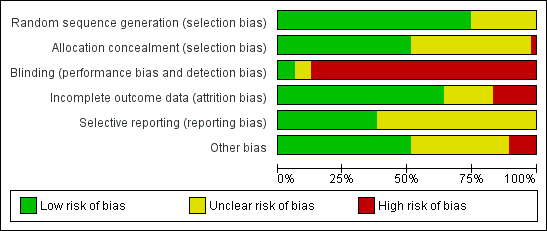
'Risk of bias' graph: review authors' judgements about each methodological quality item presented as percentages across all included studies.
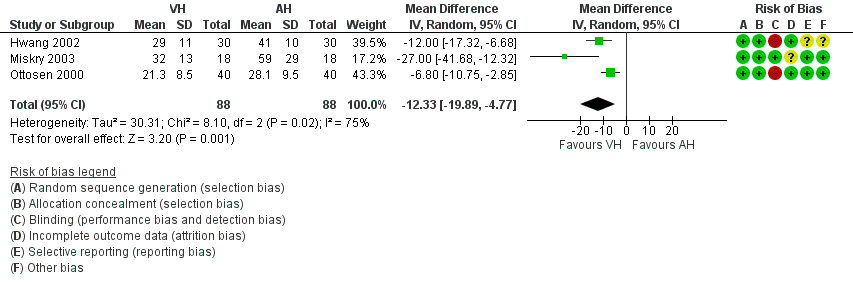
Forest plot of comparison: 1 VH versus AH, outcome: 1.1 Return to normal activities (days).
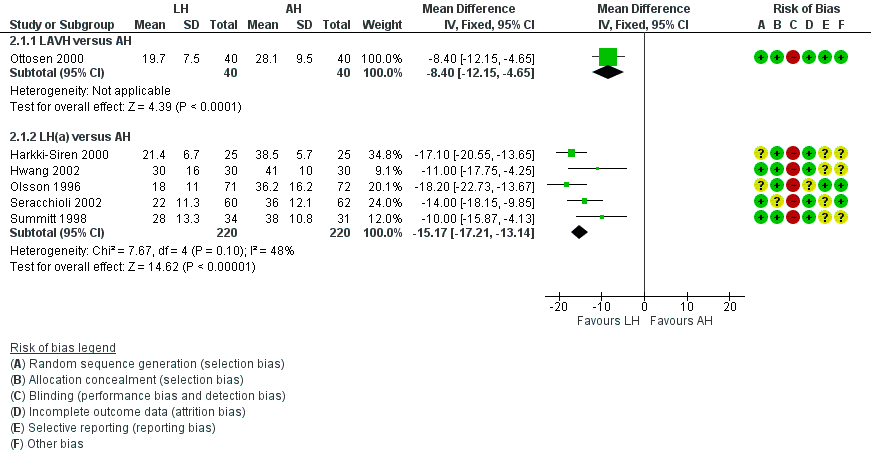
Forest plot of comparison: 2 LH versus AH, outcome: 2.1 Return to normal activities (days).
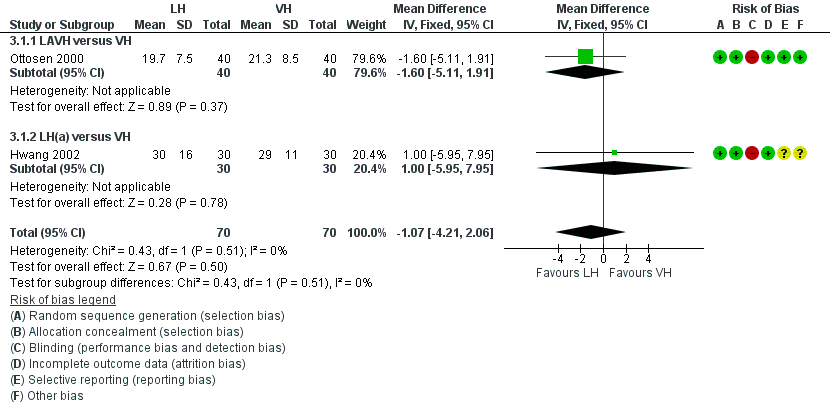
Forest plot of comparison: 3 LH versus VH, outcome: 3.1 Return to normal activities (days).
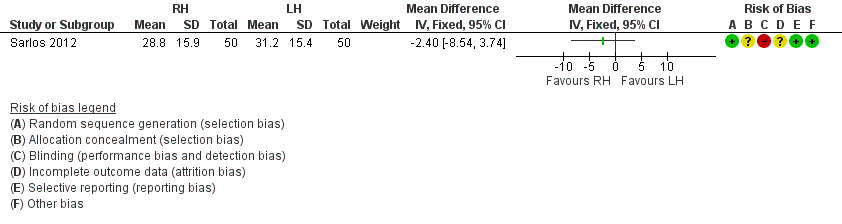
Forest plot of comparison: 4 RH versus LH, outcome: 4.1 Return to normal activities (days).

Comparison 1 VH versus AH, Outcome 1 Return to normal activities (days).

Comparison 1 VH versus AH, Outcome 2 Long‐term outcomes: satisfaction (dichotomous).

Comparison 1 VH versus AH, Outcome 3 Intraoperative visceral injury (dichotomous).

Comparison 1 VH versus AH, Outcome 4 Long‐term complications (dichotomous).

Comparison 1 VH versus AH, Outcome 5 Operation time (mins).

Comparison 1 VH versus AH, Outcome 6 Short‐term outcomes (dichotomous).
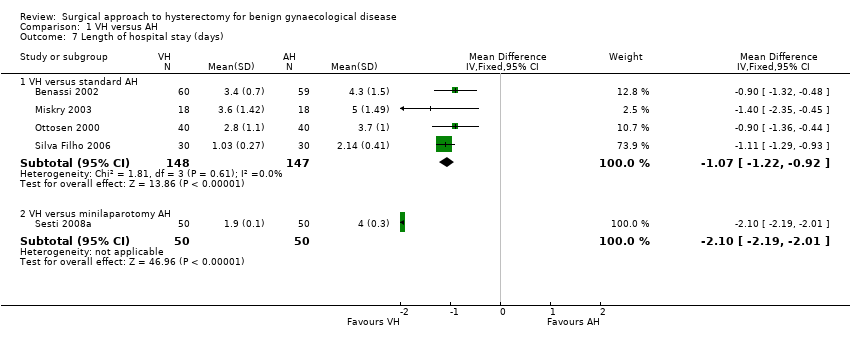
Comparison 1 VH versus AH, Outcome 7 Length of hospital stay (days).
| Study | VH | AH | Comments | |
| Quality of life (descriptive data) | ||||
| Silva Filho 2006 | Questionnaire SF‐36. Only data from functional capacity, physical aspect and pain are presented. A high score is a better quality of life | n = 30 | n = 30 | Functional capacity: VH mean = 95, IQ‐range = 75 to 100. AH mean = 72.5, IQ‐range = 55 to 90 A higher rate of patients in VH would choose the same therapeutic modality (90 % versus 65.5 %, P value = 0.021) |
| Operation time (descriptive data) | ||||
| Hwang 2002 | With 2nd procedure: | With 2nd procedure: | Not tested separately | |
| Miskry 2003 | Mean 68.8 (range 30 to 180) mins | Mean 68.2 (range 45 to 174) mins | — | |
| Ribeiro 2003 | Mean 78 mins | Mean 109 mins | No measure of spread stated | |
| Length of hospital stay (descriptive data) | ||||
| Hwang 2002 | n = 30 | n = 30 | Not tested separately | |
| Ribeiro 2003 | n = 20 | n = 20 | — | |
Comparison 1 VH versus AH, Outcome 8 All outcomes, descriptive data.
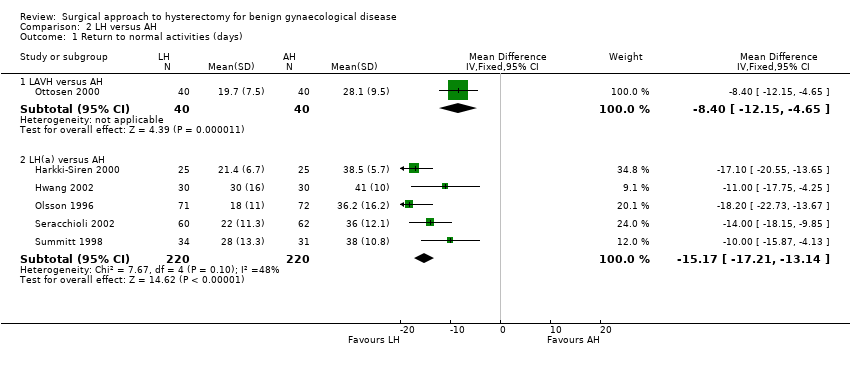
Comparison 2 LH versus AH, Outcome 1 Return to normal activities (days).

Comparison 2 LH versus AH, Outcome 2 Satisfaction.

Comparison 2 LH versus AH, Outcome 3 Bladder injury.
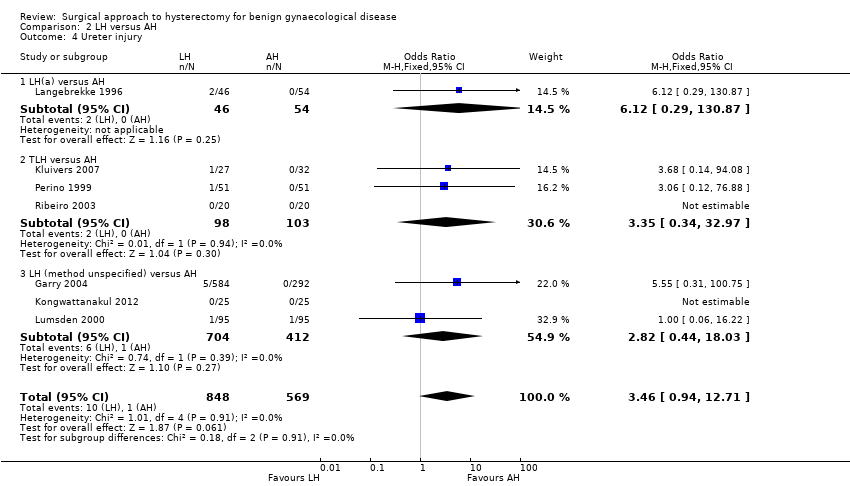
Comparison 2 LH versus AH, Outcome 4 Ureter injury.

Comparison 2 LH versus AH, Outcome 5 Urinary tract (bladder or ureter) injury.
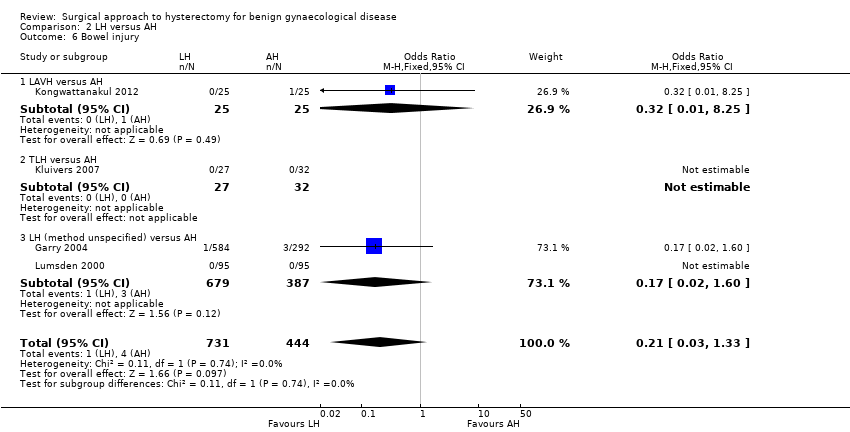
Comparison 2 LH versus AH, Outcome 6 Bowel injury.
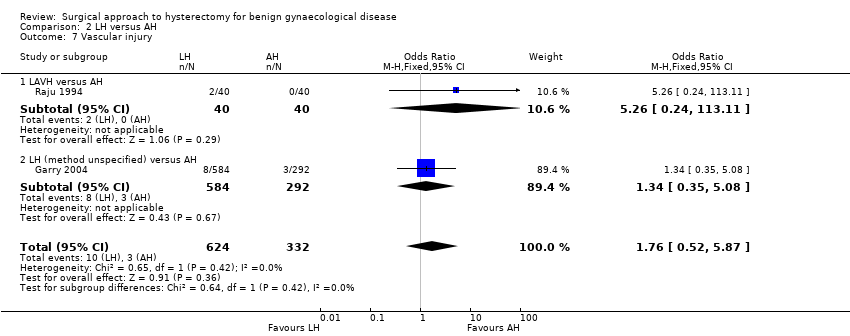
Comparison 2 LH versus AH, Outcome 7 Vascular injury.

Comparison 2 LH versus AH, Outcome 8 Fistula.

Comparison 2 LH versus AH, Outcome 9 Urinary dysfunction.

Comparison 2 LH versus AH, Outcome 10 Operation time (mins).

Comparison 2 LH versus AH, Outcome 11 Bleeding.

Comparison 2 LH versus AH, Outcome 12 Transfusion.

Comparison 2 LH versus AH, Outcome 13 Pelvic haematoma.

Comparison 2 LH versus AH, Outcome 14 Unintended laparotomy.

Comparison 2 LH versus AH, Outcome 15 Length of hospital stay (days).
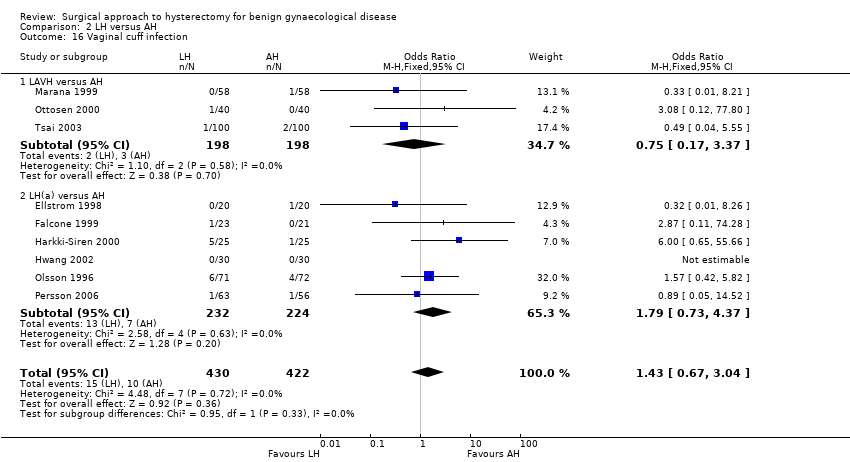
Comparison 2 LH versus AH, Outcome 16 Vaginal cuff infection.

Comparison 2 LH versus AH, Outcome 17 Wound/abdominal wall infection.
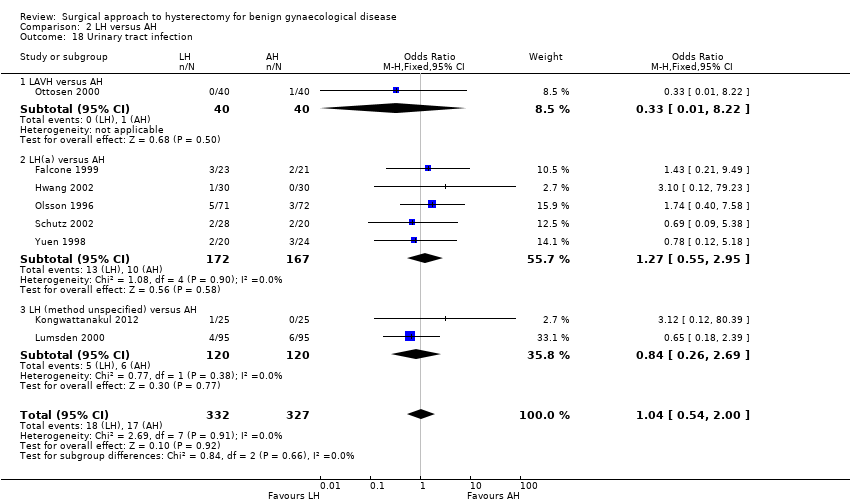
Comparison 2 LH versus AH, Outcome 18 Urinary tract infection.
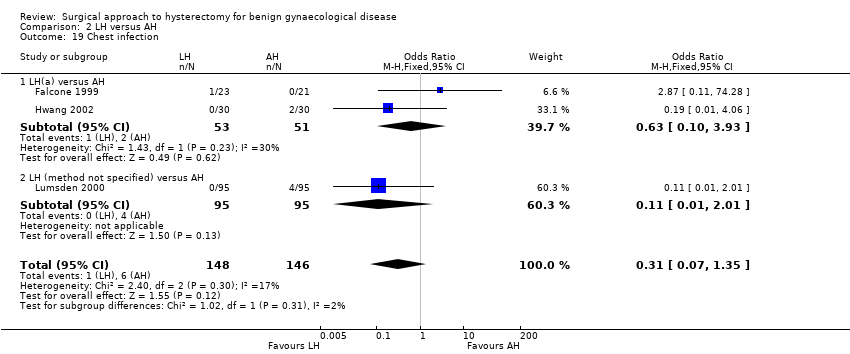
Comparison 2 LH versus AH, Outcome 19 Chest infection.
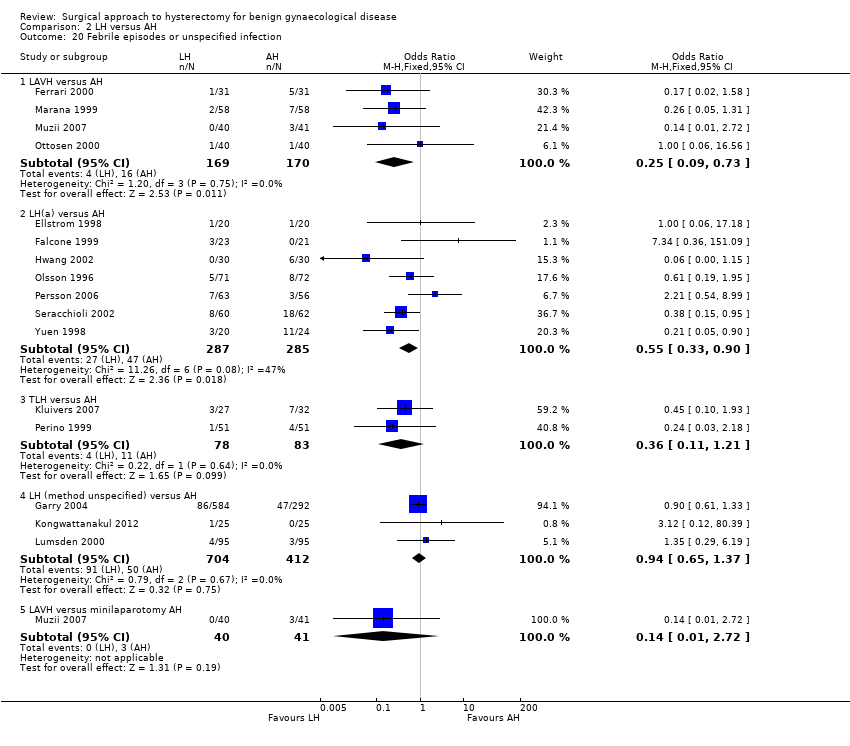
Comparison 2 LH versus AH, Outcome 20 Febrile episodes or unspecified infection.

Comparison 2 LH versus AH, Outcome 21 Thromboembolism.

Comparison 2 LH versus AH, Outcome 22 Wound dehiscence.
| Study | LH | AH | Comments |
| Langebrekke 1996 | n = 46 | n = 54 | P value < 0.001 |
| Persson 2006 | n = 63 | n = 56 | P value = 0.0081 |
| Raju 1994 | n = 40 | n = 40 | P value < 0.0001 |
| Schutz 2002 | n = 28 | n = 20 | — |
Comparison 2 LH versus AH, Outcome 23 Return to normal activities (descriptive data).
| Study | Description | LH | AH | Comments |
| Garry 2004 | Questionnaire assessment of sexual activity, body image (BIS) and health status (SF‐12) before and after surgery (6 weeks, 4 months and 1 year) | SF scores | SF scores | SF scores |
| Kluivers 2007 | Questionnaire RAND‐36. A high score is a better quality of life. Statistical analysis with use of linear mixed model to evaluate the differences between 2 and 12 weeks while accounting for baseline value In Nieboer 2012, the same patients were evaluated with use of the same questionnaire 4 years after surgery | n = 27 at baseline n = 23 at 4 years | n = 32 at baseline n = 26 at 4 years | Difference (95%CI) in favour of LH (the score range on subscales is 100, score range on total RAND‐36 scales is 800) over the first 12 weeks: Analysis over 4 years follow up after surgery: Total RAND‐36 scores overall mean difference 50.4 points (95% confidence interval 1.0 –99.7) in favour of LH. Statistically significant higher scores were also found on the domains physical role functioning, social role functioning and vitality |
| Lumsden 2000 | EuroQol Health Questionnaire used to measure women's evaluation of their health state post surgery (1, 6 and 12 months after surgery). Use of a visual analogue thermometer (0 is worst imaginable health state and 100 is best imaginable health state). | 1 month (post‐op minus pre‐op): n = 74. Mean = 7, SD = 24.1. Median = 10, range (‐50 to 50) 6 months: n = 62. Mean = 11.3, SD = 23.9. Median = 15, range (‐50 to 60) | 1 month: n = 76. Mean = 6.8, SD = 19.2. Median = 8, range (‐50 to 60). | Mean difference: 1 month: ‐1.6 (‐7.2 to 6.9) |
| Olsson 1996 | 6 to 8 weeks after surgery participants were asked in an anonymous questionnaire if they considered the duration of their post‐operative stay adequate | 9% of women in the LAVH group considered their time in hospital following surgery to be too short | 17% of women in the AH group considered their time in hospital following surgery to be too short | — |
| Persson 2006 | Questionnaires: Psychological General Wellbeing (PGWI), Women Health Questionnaire (WHQ), Spielberger Trait Anxiety Inventory (STAI) and Beck's Depression Inventory (BDI) Persson 2008 analysed wellbeing on a 0 to 100 VAS and stress coping ability | n = 63 | n = 56 | Main effect between groups: PGWB P value = 0.719, WHQ P value = 0.800, STAI P value = 0.418, BDI P value = 0.788. Main effect over time: PGWB P value < 0.0001, WHQ P value < 0.0001, STAI P value = 0.0002, BDI P value = 0.0002 In Persson 2008: No significant difference was found in the day‐by‐day recovery of the general wellbeing between the operating methods. Stress coping ability did significantly influence the day‐by‐day recovery of general wellbeing |
Comparison 2 LH versus AH, Outcome 24 Long‐term outcomes: quality of life (descriptive data).
| Study | LH | AH | Comments |
| Falcone 1999 | n = 23 | n = 21 | LH(a) vs AH |
| Ferrari 2000 | n = 31 | n = 31 | LAVH vs AH |
| Garry 2004 | n = 584 | n = 292 | non‐categorisable LH vs AH |
| Hwang 2002 | With 2nd procedure | With 2nd procedure | LH(a) vs AH |
| Langebrekke 1996 | n = 46 | n = 54 | LH(a) vs AH |
| Muzii 2007 | n = 40 median = 86 mins range (60 to 120) | n = 41 median = 58 mins range (45 to 75) | LAVH vs minilaparotomy AH |
| Persson 2006 | n = 63 | n = 56 | LH(a) vs AH |
| Raju 1994 | n = 40 | n = 40 | LAVH vs AH |
| Ribeiro 2003 | n = 20 | n = 20 | TLH vs AH |
| Schutz 2002 | n = 28 | n = 20 | LH(a) vs AH |
| Yuen 1998 | n = 20 | n = 24 | LH(a) vs AH |
Comparison 2 LH versus AH, Outcome 25 Operation time (descriptive data).
| Study | LH | AH | Comments |
| Falcone 1999 | n = 23 | n = 21 | P value = 0.038 |
| Ferrari 2000 | n = 31 | n = 31 | P value < 0.001 |
| Garry 2004 | n = 584 | n = 292 | — |
| Hwang 2002 | n = 30 | n = 30 | Not tested separately |
| Langebrekke 1996 | n = 46 | n = 54 | P value < 0.001 |
| Muzii 2007 | n = 40 median = 2 days range (1 to 3) | n = 41 median = 3 days range = (1 to 5) | P value = 0.53 |
| Persson 2006 | n = 63 | n = 56 | P value = 0.0006 In the same population (described in Persson 2008), duration of sick leave was associated with the occurrence of postoperative complications but not with stress‐coping ability |
| Raju 1994 | n = 40 | n = 40 | P value < 0.0001 |
| Ribeiro 2003 | n = 20 | n = 20 | — |
| Schutz 2002 | n = 28 | n = 20 | — |
| Yuen 1998 | n = 20 | n = 24 | P value < 0.001 |
Comparison 2 LH versus AH, Outcome 26 Length of hospital stay (descriptive data).
| Study | Description | LH | AH | Conclusions |
| Pain scales | ||||
| Ellstrom 1998 | Pain during rest and when coughing. 100 mm visual analogue scale, endpoints 'no pain' and 'worst pain possible'. Day 0, Day 1 (10am and 6pm) and Day 2 | n = 40 | n = 40 | Lower pain score following LAVH compared to AH at 10am on 1st and 2nd day when coughing (P value < 0.05 and P value < 0.01 respectively). No significant difference with the pain scores at rest |
| Falcone 1999 | Weekly visual analogue scales for pain (from "no pain" to "most severe pain". Reported in graph form | n = 22 | n = 20 | No significant difference in change over time (group by time interaction) between groups. No difference in mean pain scores over the postoperative interval (P value = 0.38). The number of weeks before a pain score of less than 1 was recorded was not significantly different between the 2 groups (P value = 0.95) |
| Garry 2004 | Daily diary using a visual analogue scale, scored on day 0 (operation day), and days 2, 7 and 21. Analysis of covariance used to adjust pain scores over days 0 to 6 by the number of days that opiates were used | VH: n = 168 | AH: n = 292 | A higher proportion of AH participants used opiates than aLH. AH is more painful than aLH and LH has a tendency to be less painful than vLH |
| Marana 1999 | 10‐point visual analogue scale. Evaluation of pain on postoperative days 1, 2 and 3 | n = 58 | n = 58 | Significant difference between 2 groups at 3 evaluations. Lower pain score following LAVH compared to AH |
| Muzii 2007 | VAS scores (no further description) Postoperative day 1 and 2 | n = 40 Day 1 median = 2.8 Range (0 to 6) Day 2 median = 0.8 Range (0 to 3.7) | n = 41 Day 1 median = 4.4 Range (2 to 6.2) Day 2 median = 2.9 Range (2 to 5.5) | Day 1 P value < 0.05 Day 2 P value < 0.05 |
| Olsson 1996 | Visual analogue scale (range 0 to 7), 2 days after surgery | n = 71 | n = 72 | Postoperative pain 2 days after surgery was significantly less following LAVH compared to AH |
| Perino 1999 | 10‐point visual analogue scale, 0 = no pain to 10 = maximum pain. Assessed pain for 3 days after surgery | n = 51 | n = 51 | Participants who underwent LH had less intense postoperative pain than those in the AH group |
| Schutz 2002 | 10‐point visual analogue scale on days 1, 3 and 5. Pain index on 4th postoperative day (WHO scale) | n = 28 | n = 20 | Pain index was 0 on postoperative day 4 in the LH group and 5 in the AH group, LH was significantly less painful than AH |
| Postoperative analgesics | ||||
| Falcone 1999 | Length of time PCA pump was required (hours) and number of narcotic (oxycodone) or acetaminophen pills used in the hospital and after discharge was recorded | n = 23 | n = 21 | Participants in the LH group required less PCA time |
| Ferrari 2000 | Analgesic requirement recorded daily for 3 groups (number who require analgesia for more than 24 hours after surgery): | Group 1: n = 31 | Group 1: n = 31. Median = 24, n% = 77, P value < 0.001. | LAVH was associated with a significantly lower administration of analgesics after the first 24 postoperative hours. Group 2, uteri weighing less than 500 g, LAVH was associated with less analgesic administration |
| Kluivers 2007 | Number of participants receiving opioids during the first 3 days after surgery were recorded | n = 27 | n = 32 | Less women in LH versus AH group required opioids (P value < 0.01) |
| Langebrekke 1996 | Number of participants receiving analgesics (parenterally, oral and rectal analgesics) during the hospital stay and 5 days postoperatively | n = 46 | n = 54 | The need for both kinds of analgesics was reduced in the LH group |
| Raju 1994 | Duration of postoperative analgesia (days) | n = 40 | n = 40 | Participants in the LAVH group required fewer days of analgesia than participants in the AH group |
| Summitt 1998 | Use of intramuscular narcotics and oral pain medication | n = 34 | n = 31 | A statistically greater number of patients in the AH group required IM narcotics on the day of surgery compared to those in the LH group |
| Recovery from pain (days) | ||||
| Raju 1994 | Number of days until participants are free from pain | n = 40 | n = 40 | Participants who had LAVH recovered from pain quicker than those who had AH |
Comparison 2 LH versus AH, Outcome 27 Pain relief (descriptive data).
| Study | Description | LH | AH | Comments |
| Ellstrom 1998 | Analysis of cost over a period of 12 weeks, starting on the day the participant entered the hospital. Direct costs (hospital costs) and indirect costs (loss of production value) were analysed separately. Units of currency = Swedish crowns (SEK) | n = 38 | n = 38 | The change in costs between LH and AH are negligible as approximately 50% of hospital costs are fixed costs |
| Falcone 1999 | Hospital costs (amount a provider must pay for goods and services) were assessed through the hospital accounting system. The direct and indirect costs were calculated for each patient from 3 different components: operating room costs, anaesthesia costs and ward costs | n = 24 | n = 24 | Total hospital costs were not significantly higher in the LH group than the AH group |
| Lumsden 2000 | Single set of unit costs applied to each unit of resource to provide a NHS cost for each woman. 1997/98 prices | n = 95 | n = 95 | AH had significantly lower total costs than LH, resulting principally from the difference in operation costs. When the cost of disposable equipment was removed, the difference was non‐significant |
| Raju 1994 | Cost analysis of each type of procedure on the major points of difference between either operation: cost of disposable consumables and the comparative costs of postoperative lengths of stay in hospital | n = 40 | n = 40 | — |
| Summitt 1998 | Hospital charges for both groups | n = 34 | n = 31 | Lack of a statistical difference in total hospital charges |
Comparison 2 LH versus AH, Outcome 28 Cost (descriptive data).

Comparison 3 LH versus VH, Outcome 1 Return to normal activities (days).

Comparison 3 LH versus VH, Outcome 2 Ureter injury.

Comparison 3 LH versus VH, Outcome 3 Bladder injury.
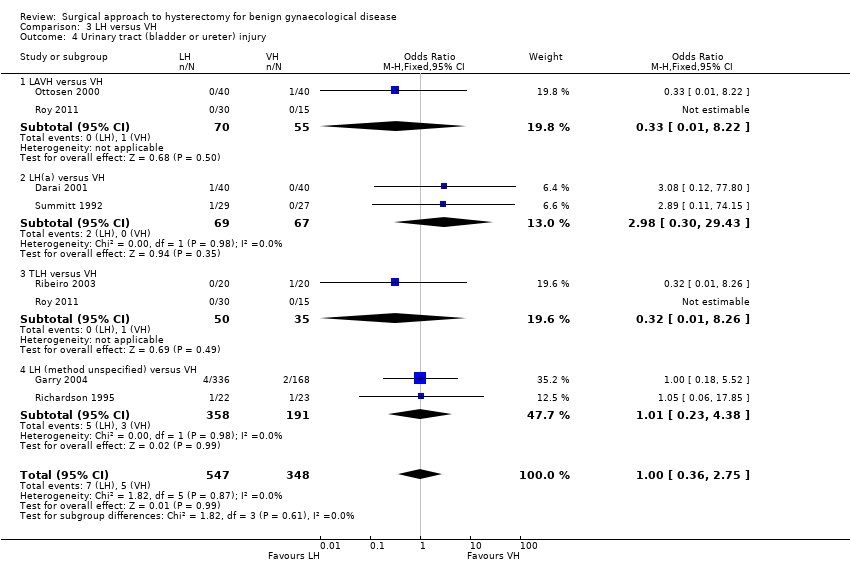
Comparison 3 LH versus VH, Outcome 4 Urinary tract (bladder or ureter) injury.

Comparison 3 LH versus VH, Outcome 5 Bowel injury.

Comparison 3 LH versus VH, Outcome 6 Vascular injury.

Comparison 3 LH versus VH, Outcome 7 Fistula.

Comparison 3 LH versus VH, Outcome 8 Urinary dysfunction.
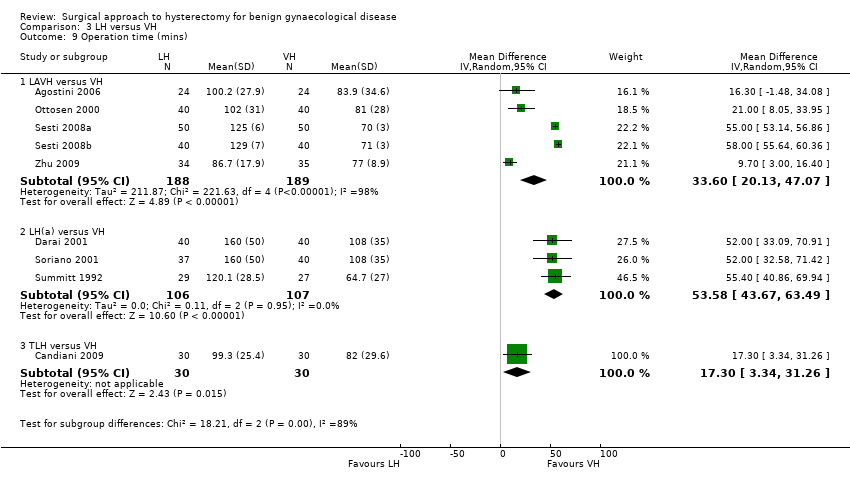
Comparison 3 LH versus VH, Outcome 9 Operation time (mins).

Comparison 3 LH versus VH, Outcome 10 Bleeding.

Comparison 3 LH versus VH, Outcome 11 Transfusion.

Comparison 3 LH versus VH, Outcome 12 Pelvic haematoma.

Comparison 3 LH versus VH, Outcome 13 Unintended laparotomy.

Comparison 3 LH versus VH, Outcome 14 Vaginal cuff infection.
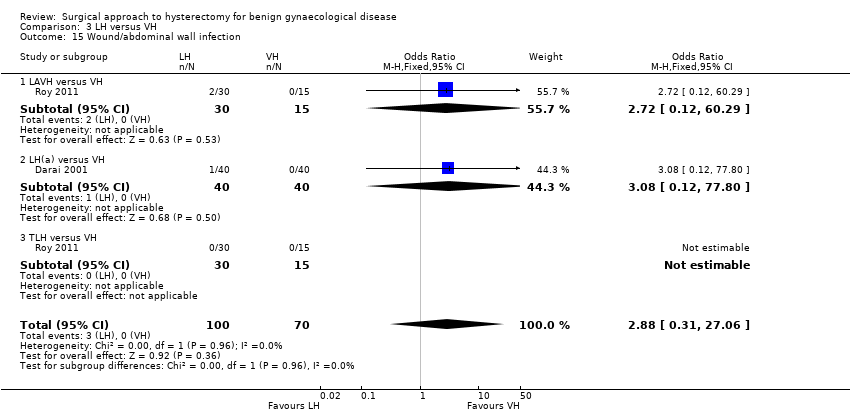
Comparison 3 LH versus VH, Outcome 15 Wound/abdominal wall infection.

Comparison 3 LH versus VH, Outcome 16 Urinary tract infection.
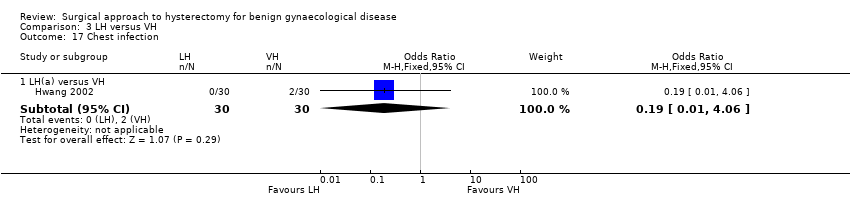
Comparison 3 LH versus VH, Outcome 17 Chest infection.

Comparison 3 LH versus VH, Outcome 18 Febrile episodes or unspecified infection.
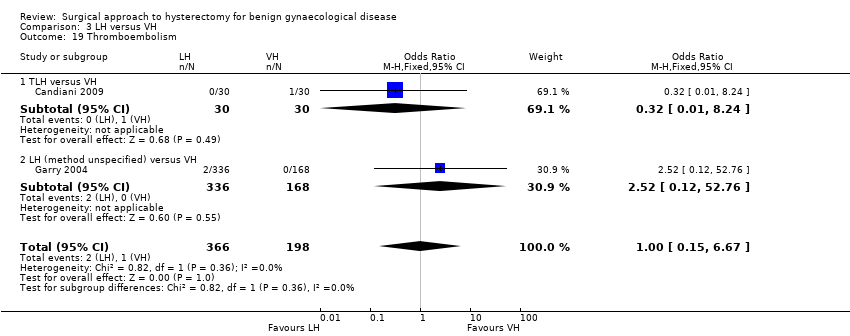
Comparison 3 LH versus VH, Outcome 19 Thromboembolism.
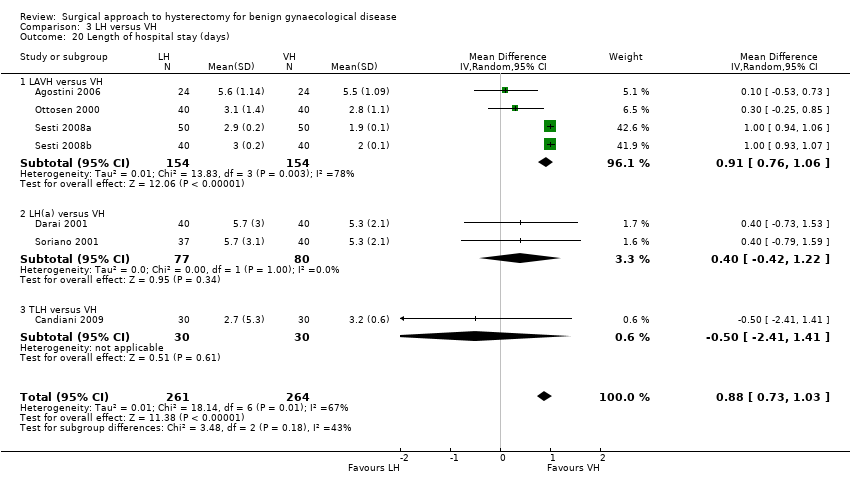
Comparison 3 LH versus VH, Outcome 20 Length of hospital stay (days).
| Study | LH | VH | Comments |
| Richardson 1995 | n = 22 | n = 23 | |
| Roy 2011 | TLH: n = 30 median = 15 days min‐max = 7 to 30 days LAVH: n = 30 median = 20 days min‐max = 8 to 40 days | n = 30 median = 14 days min‐max = 7 to 25 days | P value = 0.7 |
| Roy 2012 | n = 10 median = 20 days min‐max = 10 to 30 days | n = 10 median = 16 days min‐max = 12 to 24 days | P value = 0.05 |
Comparison 3 LH versus VH, Outcome 21 Return to normal activities (descriptive data).
| Study | Description | LH | VH | Comment |
| Roy 2011 | Patient satisfaction was evaluated using HRQOL (Health Related Quality Of Life) questionnaire and SF‐12 (12‐item Short Form health survey) and follow‐up visits in outpatient clinic were done at 1, 3 and 6 months | TLH: n = 30 LAVH: n = 30 | n = 30 | After 6 months of surgery, there was significant higher satisfaction rate among patients who underwent TLH and NDVH (non‐descent vaginal hysterectomy) than those who underwent LAVH (P value = 0.003). The satisfaction was similar between the TLH and NDVH group |
Comparison 3 LH versus VH, Outcome 22 Long‐term outcomes: quality of life (descriptive data).
| Study | LH | VH | Comments |
| Hwang 2002 | With 2nd proc: | With 2nd proc: | Kruskal Wallis test: |
| Ribeiro 2003 | n = 20 | n = 20 | — |
| Richardson 1995 | n = 22 | n = 23 | Some of these cases include oophorectomies. Oophorectomy (mean): LH 129.7 mins, VH 95.3 mins; no oophorectomy (mean): LH 132.7 mins, VH 64.7 mins |
| Roy 2012 | n = 10 median = 90 mins min‐max = 60 to 165 mins | n = 10 median = 75 min‐max = 40 to 105 | Not statistically significant |
Comparison 3 LH versus VH, Outcome 23 Operation time (descriptive data).
| Study | LH | VH | Comments |
| Hwang 2002 | n = 30 | n = 30 | Not tested separately |
| Richardson 1995 | n = 22 | n = 23 | — |
| Roy 2011 | TLH: n = 30 median = 2 days min‐max = 2 to 12 days LAVH: n = 30 median = 3 days min‐max = 4 days | VH: n = 30 median = 2 days min‐max = 1 to 4 days | P value = 0.15 |
| Roy 2012 | n = 10 median = 3 days min‐max = 2 to 4 days | n = 10 median = 2 days min‐max = 2 to 4 days | Not statistically significant |
Comparison 3 LH versus VH, Outcome 24 Length of hospital stay (descriptive data).
| Study | Description | LH | VH | Conclusion |
| Pain scales | ||||
| Ghezzi 2010 | VAS pain scores at several times post surgery | n = 41 VAS score after 1 h: mean = 4.7, SD = 2.6 VAS score after 3 h: mean = 3.2, SD = 2.5 VAS score after 8 h: mean = 2.1, SD = 2.2 VAS score after 24 h: mean = 1.8, SD = 1.7 | n = 41 VAS score after 1 h: mean = 7.8, SD = 1.7 VAS score after 3 h: mean = 6.6, SD = 2.0 VAS score after 8 h: mean = 5.3, SD = 2.1 VAS score after 24 h: mean = 3.6, SD = 2.6 | P value < 0.0001 P value < 0.0001 P value < 0.0001 P value = 0.001 |
| Sesti 2008b | VAS pain 24 hours post surgery | 6 patients (15%) reported absence of pain 24 hours post surgery | 20 patients (50%) reported absence of pain (VAS = 0) 24 hours post surgery | Patients undergoing LAVH had more postoperative pain compared with patients undergoing VH |
| Postoperative analgesics | ||||
| Ghezzi 2010 | The need for additional use of analgesics after the operation | n = 41 7 (17.1%) | n = 41 32 (78.0%) | P value < 0.0001 |
| Richardson 1995 | The number of postoperative opoid injections and the number of days analgesia was required was recorded | n = 22 | n = 23 | The number of opoid injections and analgesia requirements were similar in each group |
| Soriano 2001 | Total consumption of paracetamol, NSAID and subcutaneous opoid | n = 37 | n = 40 | No significant difference in the total consumption of paracetamol, NSAID and subcutaneous opoid between the 2 groups |
| Summitt 1992 | Pain control was assessed by documenting the intramuscular narcotic use on the day of surgery and the number of pain tablets used on the day of surgery and the first 2 postoperative days | n = 28 | n = 27 | — |
Comparison 3 LH versus VH, Outcome 25 Pain relief (descriptive data).
| Study | Description | LH | VH |
| Summitt 1992 | Mean total hospital charge when surgery was performed on an outpatient basis. Charges consisted of: operating room fee, operating room time, anaesthesia time, charges for disposable staples, scissors, graspers and a charge for recovery in the ambulatory surgery unit, including laboratory fees | n = 29 | n = 27 |
Comparison 3 LH versus VH, Outcome 26 Cost (descriptive data).
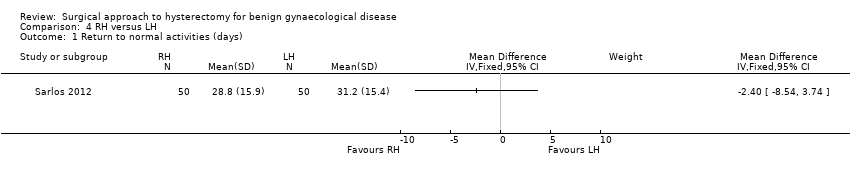
Comparison 4 RH versus LH, Outcome 1 Return to normal activities (days).

Comparison 4 RH versus LH, Outcome 2 Intraoperative visceral injury (dichotomous).

Comparison 4 RH versus LH, Outcome 3 Operation time.
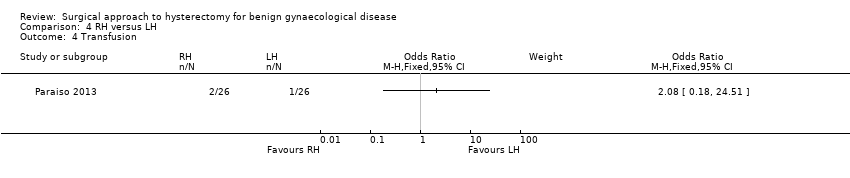
Comparison 4 RH versus LH, Outcome 4 Transfusion.
| Study | Description | RH | LH | Comment |
| Paraiso 2013 | Percentage to return to normal baseline activities at 1, 2, 3, 4, 5 and 6 weeks postoperatively | 1 week (n = 17): 22% 2 weeks (n = 17): 46% 3 weeks (n = 17): 54% 4 weeks (n = 17): 60% 5 weeks (n = 17): 66% 6 weeks (n = 16): 72% | 1 week (n = 19): 29% 2 weeks (n = 19): 46% 3 weeks (n = 18): 58% 4 weeks (n = 18): 64% 5 weeks (n = 17): 73% 6 weeks (n = 17): 82% | P value (overall) = 0.25 |
Comparison 4 RH versus LH, Outcome 5 Return to normal activities (descriptive data).

Comparison 5 SP‐LH versus LH, Outcome 1 Bladder injury.

Comparison 5 SP‐LH versus LH, Outcome 2 Operation time (mins).

Comparison 5 SP‐LH versus LH, Outcome 3 Transfusion.
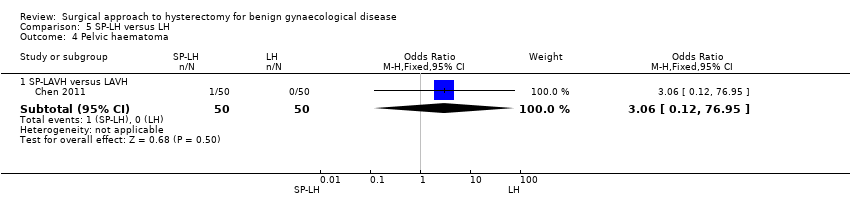
Comparison 5 SP‐LH versus LH, Outcome 4 Pelvic haematoma.
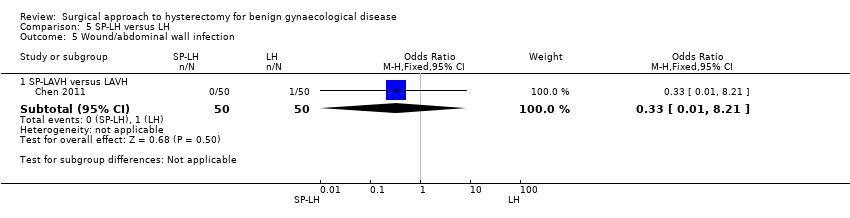
Comparison 5 SP‐LH versus LH, Outcome 5 Wound/abdominal wall infection.

Comparison 5 SP‐LH versus LH, Outcome 6 Febrile episodes or unspecified infection.

Comparison 5 SP‐LH versus LH, Outcome 7 Postoperative ileus.

Comparison 5 SP‐LH versus LH, Outcome 8 Length of hospital stay (days).
| Study | SP‐LH | Conventional LH | Comments |
| Song 2013 | n = 20 SP‐LAVH Mean = 92 min Range 57 to 220 min | n = 19 LAVH Mean = 95 min Range 70 to 154 min | P value = 0.47 |
Comparison 5 SP‐LH versus LH, Outcome 9 Operation time (descriptive data).
| Study | SP‐LH | LAVH | Comments |
| Jung 2011 | n = 30 SP‐TLH Median postoperative hospital stay = 3.4 days Range 3.0 to 4.3 days | n = 34 TLH Median postoperative hospital stay = 3.0 days Range 3.0 to 3.0 days | P value = 0.075 |
| Song 2013 | n = 20 SP‐LAVH Mean = 3 days Range 2 to 4 days | n = 19 LAVH Mean = 3 days Range 2 to 4 days | P value = 0.95 |
Comparison 5 SP‐LH versus LH, Outcome 10 Length of hospital stay (descriptive data).

Comparison 6 TLH versus LAVH, Outcome 1 Intraoperative visceral injury (dich).

Comparison 6 TLH versus LAVH, Outcome 2 Long‐term complications (dich).
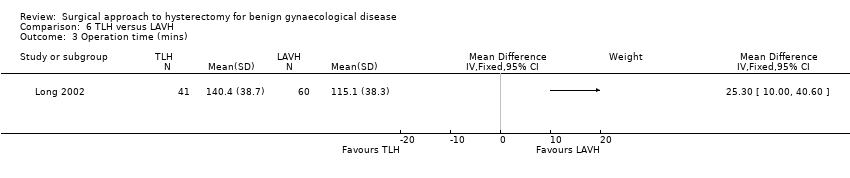
Comparison 6 TLH versus LAVH, Outcome 3 Operation time (mins).

Comparison 6 TLH versus LAVH, Outcome 4 Short‐term outcomes (dich).
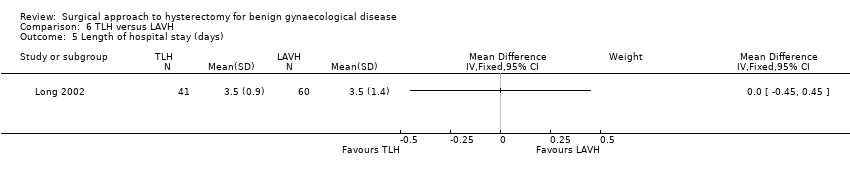
Comparison 6 TLH versus LAVH, Outcome 5 Length of hospital stay (days).
| Study | Mini‐TLH | Conventional TLH | Comments |
| Ghezzi 2011 | n = 38 Median = 58 mins Range: 30 to 135 mins | n = 38 Median = 60 mins Range: 30 to 155 mins | P value = 0.55 |
Comparison 7 Mini‐LH versus TLH, Outcome 1 Operation time (descriptive data).
| Study | mini‐TLH | Conventional TLH | Comment |
| Ghezzi 2011 | n = 38 Median = 1 day Range: 0 to 2 | n = 38 Median = 1 day Range: 1 to 2 | P value = 0.73 |
Comparison 7 Mini‐LH versus TLH, Outcome 2 Length of hospital stay (descriptive data).
| Vaginal hysterectomy versus abdominal hysterectomy for benign gynaecological disease | ||||||
| Patient or population: patients with benign gynaecological disease | ||||||
| Outcomes | Illustrative comparative risks* (95% CI) | Relative effect | No of participants | Quality of the evidence | Comments | |
| Assumed risk | Corresponding risk | |||||
| Abdominal hysterectomy | Vaginal hysterectomy | |||||
| Return to normal activities (days) | The mean return to normal activities (days) in the AH group was | The mean return to normal activities (days) in the VH group was | — | 176 | ⊕⊕⊕⊝ | — |
| Urinary tract (bladder or ureter) injury | 0 per 1000 | 0 per 1000 | OR 3.09 | 439 | ⊕⊕⊕⊝ | There were no urinary tract injuries in one study |
| *The basis for the assumed risk is the median control group risk across studies. The corresponding risk (and its 95% confidence interval) is based on the assumed risk in the comparison group and the relative effect of the intervention (and its 95% CI). | ||||||
| GRADE Working Group grades of evidence | ||||||
| 1There was a large difference in return to normal activities between the different studies; the analysis had high heterogeneity (I2 = 75%) but consistent direction of effect. | ||||||
| Laparoscopic hysterectomy versus abdominal hysterectomy for benign gynaecological disease | ||||||
| Patient or population: patients with benign gynaecological disease | ||||||
| Outcomes | Illustrative comparative risks* (95% CI) | Relative effect | No of participants | Quality of the evidence | Comments | |
| Assumed risk | Corresponding risk | |||||
| Abdominal hysterectomy | Laparoscopic hysterectomy | |||||
| Return to normal activities (days) | The mean return to normal activities (days) in the AH group was | The mean return to normal activities (days) in the LH group was | — | 520 | ⊕⊕⊝⊝ | — |
| Urinary tract (bladder or ureter) injury | 10 per 1000 | 24 per 1000 | OR 2.44 | 2140 | ⊕⊕⊝⊝ | — |
| Bowel injury | 7 per 1000 | 1 per 1000 | OR 0.21 | 1175 | ⊕⊕⊕⊝ | — |
| Vascular injury | 9 per 1000 | 16 per 1000 | OR 1.76 | 956 | ⊕⊕⊕⊝ | — |
| Bleeding | 16 per 1000 | 6 per 1000 | OR 0.45 | 1266 | ⊕⊕⊝⊝ | — |
| *The basis for the assumed risk is the median control group risk across studies. The corresponding risk (and its 95% confidence interval) is based on the assumed risk in the comparison group and the relative effect of the intervention (and its 95% CI). | ||||||
| GRADE Working Group grades of evidence | ||||||
| 1In some studies there was doubt about the method used for random sequence generation or allocation of patients. Furthermore, one study did not perform an intention‐to‐treat analysis. | ||||||
| Laparoscopic hysterectomy versus vaginal hysterectomy for benign gynaecological disease | ||||||
| Patient or population: patients with benign gynaecological disease | ||||||
| Outcomes | Illustrative comparative risks* (95% CI) | Relative effect | No of participants | Quality of the evidence | Comments | |
| Assumed risk | Corresponding risk | |||||
| Vaginal hysterectomy | Laparoscopic hysterectomy | |||||
| Return to normal activities (days) | The mean return to normal activities (days) in the VH group was | The mean return to normal activities (days) in the LH group was | — | 140 | ⊕⊕⊕⊝ | — |
| Urinary tract (bladder or ureter) injury | 16 per 1000 | 16 per 1000 | OR 1.0 | 865 | ⊕⊕⊝⊝ | — |
| Vascular injury | 12 per 1000 | 18 per 1000 | OR 1.58 | 745 | ⊕⊕⊝⊝ | — |
| Bleeding | 29 per 1000 | 25 per 1000 | OR 2.45 | 644 | ⊕⊕⊝⊝ | — |
| Unintended laparotomy | 24 per 1000 | 37 per 1000 | OR 1.55 | 1160 | ⊕⊕⊝⊝ | — |
| *The basis for the assumed risk is the median control group risk across studies. The corresponding risk (and its 95% confidence interval) is based on the assumed risk in the comparison group and the relative effect of the intervention (and its 95% CI). | ||||||
| GRADE Working Group grades of evidence | ||||||
| 1Wide confidence intervals crossing the line of no effect. | ||||||
| Type of LH | LH versus AH RCTs | LH versus VH RCTs | LH versus LH RCTs |
| LAVH | Ferrari 2000 | Agostini 2006 | Chen 2011 |
| Kunz 1996 | Ottosen 2000 | Roy 2011 | |
| Marana 1999 | Roy 2011 | Song 2013 | |
| Muzii 2007 | Roy 2012 | ||
| Ottosen 2000 | Sesti 2008(a) | ||
| Raju 1994b | Sesti 2008(b) | ||
| Sesti 2008(a) | |||
| Tsai 2003 | |||
| LH(a) | Ellstrom 1998 | Darai 2001 | |
| Falcone 1999 | Hwang 2002 | ||
| Harkki‐Siren 2000 | Soriano 2001 | ||
| Hwang 2002 | Summitt 1992 | ||
| Langebrekke 1998 | Zhu 2009 | ||
| Olsson 1996 | |||
| Persson 2006 | |||
| Schutz 2002 | |||
| Seracchioli 2002 | |||
| Summitt 1998 | |||
| Yuen 1998 | |||
| Zhu 2009 | |||
| TLH | Kluivers 2007 | Candiani 2009 | Ghezzi 2011 |
| Perino 1999 | Ghezzi 2010 | Jung 2011 | |
| Ribeiro 2003 | Morelli 2007 | Paraiso 2013 | |
| Ribeiro 2003 | Roy 2011 | ||
| Roy 2011 | Sarlos 2012 | ||
| Non‐categorisable LH | Garry 2004 | Garry 2004 | |
| Kongwattanakul 2012 | Richardson 1998 | ||
| Lumsden 2000 | |||
| AH: abdominal hysterectomy | |||
| Stage | Laparoscopic content |
| 0 | Laparoscopy done but no laparoscopic procedure before vaginal hysterectomy |
| 1 | Procedure includes laparoscopic adhesiolysis and/or excision of endometriosis |
| 2 | Either or both adnexa freed laparoscopically |
| 3 | Bladder dissected from the uterus laparoscopically |
| 4 | Uterine artery transected laparoscopically |
| 5 | Anterior and/or posterior colpotomy or entire uterus freed laparoscopically |
| Step | Laparoscopic content |
| 1 | Severing the round ligaments and dissection of the upper portion of the broad ligament |
| 2 | Severing the tubo‐uterine junction and the utero‐ovarian ligament if the adnexa are to be preserved, or severing the infundibulopelvic ligaments |
| 3 | Severing the uterine vessels |
| 4 | Preparation of the bladder flap |
| 5 | Severing the cardinal uterosacral ligaments complex |
| 6 | Performing anterior and posterior culdotomy and separation of the cervix |
| 7 | Closure of the vaginal cuff |
| Trial | No. dropouts | Details |
| Chen 2011 | 2 | Excluded from analysis postoperatively, because they underwent accessory adnexal surgery |
| Falcone 1999 | 4 (1 LH; 3 AH) | Withdrew pre‐operatively |
| Garry 2004 | 34 (23 LH (11 aLH; 12 vLH); 6 AH; 5 VH) | Withdrew pre‐operatively |
| Long 2002 | 13 | 3 laparotomy conversions were excluded from analysis; 7 incomplete records; 3 combined procedures that were excluded post‐randomisation |
| Lumsden 2000 | 10 | 10 dropouts were not analysed. 7 women did not attend surgery and 3 records were not available |
| Kluivers 2007 | 1 | Refused assignment procedure |
| Lumsden 2000 | 10 | 7 withdrew pre‐operatively; 3 case records not available |
| Paraiso 2013 | 6 | 6 withdrew after randomisation but before the intervention was performed |
| Persson 2006 | 6 | 5 allocated to AH and 1 to LH withdrew after informed consent prior to the operation or withdrew in the postoperative period before the 5‐week follow‐up |
| Roy 2011 | 9 | 5 excluded because they needed adenectomy during surgery and 4 excluded from all analyses because they did not show up for follow‐up after intervention |
| Roy 2012 | 1 | 1 LH patient excluded from analysis due to conversion |
| Sarlos 2012 | 5 | After randomisation 5 did not complete the study and were excluded from the analysis |
| Song 2013 | 1 | 1 lost to follow‐up because of dissatisfaction with hospital care |
| Summitt 1998 | 2 | Refused assignment procedure |
| Yuen 1998 | 6 | 4 declined operation; 2 refused to participate postoperatively |
| AH: abdominal hysterectomy | ||
| Outcome or subgroup title | No. of studies | No. of participants | Statistical method | Effect size |
| 1 Return to normal activities (days) Show forest plot | 3 | 176 | Mean Difference (IV, Random, 95% CI) | ‐12.33 [‐19.89, ‐4.77] |
| 2 Long‐term outcomes: satisfaction (dichotomous) Show forest plot | 1 | Odds Ratio (M‐H, Fixed, 95% CI) | Subtotals only | |
| 3 Intraoperative visceral injury (dichotomous) Show forest plot | 4 | Odds Ratio (M‐H, Fixed, 95% CI) | Subtotals only | |
| 3.1 Bladder injury | 4 | 439 | Odds Ratio (M‐H, Fixed, 95% CI) | 3.09 [0.48, 19.97] |
| 3.2 Ureter injury | 1 | 119 | Odds Ratio (M‐H, Fixed, 95% CI) | 0.0 [0.0, 0.0] |
| 3.3 Urinary tract (bladder or ureter) injury | 4 | 439 | Odds Ratio (M‐H, Fixed, 95% CI) | 3.09 [0.48, 19.97] |
| 3.4 Bowel injury | 2 | 319 | Odds Ratio (M‐H, Fixed, 95% CI) | 0.0 [0.0, 0.0] |
| 3.5 Vascular injury | 1 | 119 | Odds Ratio (M‐H, Fixed, 95% CI) | 0.0 [0.0, 0.0] |
| 4 Long‐term complications (dichotomous) Show forest plot | 1 | Odds Ratio (M‐H, Fixed, 95% CI) | Subtotals only | |
| 4.1 Urinary dysfunction | 1 | 80 | Odds Ratio (M‐H, Fixed, 95% CI) | 0.0 [0.0, 0.0] |
| 5 Operation time (mins) Show forest plot | 4 | Mean Difference (IV, Random, 95% CI) | Subtotals only | |
| 5.1 VH versus standard AH | 3 | 259 | Mean Difference (IV, Random, 95% CI) | ‐11.01 [‐35.09, 13.08] |
| 5.2 VH versus minilaparotomy AH | 1 | 100 | Mean Difference (IV, Random, 95% CI) | ‐63.0 [‐65.11, ‐60.89] |
| 6 Short‐term outcomes (dichotomous) Show forest plot | 6 | Odds Ratio (M‐H, Fixed, 95% CI) | Subtotals only | |
| 6.1 Transfusion | 5 | 495 | Odds Ratio (M‐H, Fixed, 95% CI) | 0.82 [0.34, 1.96] |
| 6.2 Pelvic haematoma | 5 | 535 | Odds Ratio (M‐H, Fixed, 95% CI) | 0.99 [0.34, 2.89] |
| 6.3 Vaginal cuff infection | 2 | 140 | Odds Ratio (M‐H, Fixed, 95% CI) | 3.08 [0.12, 77.80] |
| 6.4 Wound/abdominal wall infection | 3 | 355 | Odds Ratio (M‐H, Fixed, 95% CI) | 0.21 [0.04, 1.00] |
| 6.5 UTI | 3 | 176 | Odds Ratio (M‐H, Fixed, 95% CI) | 0.59 [0.08, 4.61] |
| 6.6 Chest infection | 1 | 60 | Odds Ratio (M‐H, Fixed, 95% CI) | 1.0 [0.13, 7.60] |
| 6.7 Febrile episodes or unspecified infection | 5 | 495 | Odds Ratio (M‐H, Fixed, 95% CI) | 0.62 [0.36, 1.08] |
| 6.8 Thromboembolism | 1 | 119 | Odds Ratio (M‐H, Fixed, 95% CI) | 0.0 [0.0, 0.0] |
| 7 Length of hospital stay (days) Show forest plot | 5 | Mean Difference (IV, Fixed, 95% CI) | Subtotals only | |
| 7.1 VH versus standard AH | 4 | 295 | Mean Difference (IV, Fixed, 95% CI) | ‐1.07 [‐1.22, ‐0.92] |
| 7.2 VH versus minilaparotomy AH | 1 | 100 | Mean Difference (IV, Fixed, 95% CI) | ‐2.1 [‐2.19, ‐2.01] |
| 8 All outcomes, descriptive data Show forest plot | Other data | No numeric data | ||
| 8.1 Quality of life (descriptive data) | Other data | No numeric data | ||
| 8.2 Operation time (descriptive data) | Other data | No numeric data | ||
| 8.3 Length of hospital stay (descriptive data) | Other data | No numeric data | ||
| Outcome or subgroup title | No. of studies | No. of participants | Statistical method | Effect size |
| 1 Return to normal activities (days) Show forest plot | 6 | Mean Difference (IV, Fixed, 95% CI) | Subtotals only | |
| 1.1 LAVH versus AH | 1 | 80 | Mean Difference (IV, Fixed, 95% CI) | ‐8.40 [‐12.15, ‐4.65] |
| 1.2 LH(a) versus AH | 5 | 440 | Mean Difference (IV, Fixed, 95% CI) | ‐15.17 [‐17.21, ‐13.14] |
| 2 Satisfaction Show forest plot | 1 | Odds Ratio (M‐H, Fixed, 95% CI) | Totals not selected | |
| 2.1 LH (method unspecified) versus AH | 1 | Odds Ratio (M‐H, Fixed, 95% CI) | 0.0 [0.0, 0.0] | |
| 3 Bladder injury Show forest plot | 12 | 2038 | Odds Ratio (M‐H, Fixed, 95% CI) | 1.89 [0.91, 3.90] |
| 3.1 LAVH versus AH | 3 | 396 | Odds Ratio (M‐H, Fixed, 95% CI) | 1.0 [0.14, 7.17] |
| 3.2 LH(a) versus AH | 4 | 427 | Odds Ratio (M‐H, Fixed, 95% CI) | 2.02 [0.49, 8.24] |
| 3.3 TLH versus AH | 2 | 99 | Odds Ratio (M‐H, Fixed, 95% CI) | 0.58 [0.05, 6.73] |
| 3.4 LH (method unspecified) versus AH | 3 | 1116 | Odds Ratio (M‐H, Fixed, 95% CI) | 2.65 [0.88, 7.93] |
| 4 Ureter injury Show forest plot | 7 | 1417 | Odds Ratio (M‐H, Fixed, 95% CI) | 3.46 [0.94, 12.71] |
| 4.1 LH(a) versus AH | 1 | 100 | Odds Ratio (M‐H, Fixed, 95% CI) | 6.12 [0.29, 130.87] |
| 4.2 TLH versus AH | 3 | 201 | Odds Ratio (M‐H, Fixed, 95% CI) | 3.35 [0.34, 32.97] |
| 4.3 LH (method unspecified) versus AH | 3 | 1116 | Odds Ratio (M‐H, Fixed, 95% CI) | 2.82 [0.44, 18.03] |
| 5 Urinary tract (bladder or ureter) injury Show forest plot | 13 | 2140 | Odds Ratio (M‐H, Fixed, 95% CI) | 2.44 [1.24, 4.80] |
| 5.1 LAVH versus AH | 3 | 396 | Odds Ratio (M‐H, Fixed, 95% CI) | 1.0 [0.14, 7.17] |
| 5.2 LH(a) versus AH | 4 | 427 | Odds Ratio (M‐H, Fixed, 95% CI) | 2.79 [0.73, 10.68] |
| 5.3 TLH versus AH | 3 | 201 | Odds Ratio (M‐H, Fixed, 95% CI) | 1.61 [0.30, 8.63] |
| 5.4 LH (method unspecified) versus AH | 3 | 1116 | Odds Ratio (M‐H, Fixed, 95% CI) | 3.13 [1.12, 8.78] |
| 6 Bowel injury Show forest plot | 4 | 1175 | Odds Ratio (M‐H, Fixed, 95% CI) | 0.21 [0.03, 1.33] |
| 6.1 LAVH versus AH | 1 | 50 | Odds Ratio (M‐H, Fixed, 95% CI) | 0.32 [0.01, 8.25] |
| 6.2 TLH versus AH | 1 | 59 | Odds Ratio (M‐H, Fixed, 95% CI) | 0.0 [0.0, 0.0] |
| 6.3 LH (method unspecified) versus AH | 2 | 1066 | Odds Ratio (M‐H, Fixed, 95% CI) | 0.17 [0.02, 1.60] |
| 7 Vascular injury Show forest plot | 2 | 956 | Odds Ratio (M‐H, Fixed, 95% CI) | 1.76 [0.52, 5.87] |
| 7.1 LAVH versus AH | 1 | 80 | Odds Ratio (M‐H, Fixed, 95% CI) | 5.26 [0.24, 113.11] |
| 7.2 LH (method unspecified) versus AH | 1 | 876 | Odds Ratio (M‐H, Fixed, 95% CI) | 1.34 [0.35, 5.08] |
| 8 Fistula Show forest plot | 2 | 245 | Odds Ratio (M‐H, Fixed, 95% CI) | 3.07 [0.32, 29.96] |
| 8.1 LH(a) versus AH | 1 | 143 | Odds Ratio (M‐H, Fixed, 95% CI) | 3.09 [0.12, 77.01] |
| 8.2 TLH versus AH | 1 | 102 | Odds Ratio (M‐H, Fixed, 95% CI) | 3.06 [0.12, 76.88] |
| 9 Urinary dysfunction Show forest plot | 2 | 246 | Odds Ratio (M‐H, Fixed, 95% CI) | 0.94 [0.48, 1.84] |
| 9.1 LAVH versus AH | 1 | 80 | Odds Ratio (M‐H, Fixed, 95% CI) | 3.08 [0.12, 77.80] |
| 9.2 LH (method unspecified) versus AH | 1 | 166 | Odds Ratio (M‐H, Fixed, 95% CI) | 0.88 [0.44, 1.76] |
| 10 Operation time (mins) Show forest plot | 12 | Mean Difference (IV, Random, 95% CI) | Subtotals only | |
| 10.1 LAVH versus AH | 4 | 466 | Mean Difference (IV, Random, 95% CI) | 0.27 [‐23.39, 23.93] |
| 10.2 LH(A) versus AH | 5 | 420 | Mean Difference (IV, Random, 95% CI) | 33.45 [14.82, 52.08] |
| 10.3 TLH versus AH | 2 | 161 | Mean Difference (IV, Random, 95% CI) | 28.74 [2.64, 54.85] |
| 10.4 LAVH versus minilaparotomy AH | 1 | 100 | Mean Difference (IV, Random, 95% CI) | ‐8.0 [‐10.56, ‐5.44] |
| 11 Bleeding Show forest plot | 5 | 1266 | Odds Ratio (M‐H, Fixed, 95% CI) | 0.45 [0.15, 1.37] |
| 11.1 LAVH versus AH | 2 | 197 | Odds Ratio (M‐H, Fixed, 95% CI) | 0.60 [0.08, 4.64] |
| 11.2 LH(a) versus AH | 2 | 193 | Odds Ratio (M‐H, Fixed, 95% CI) | 0.16 [0.02, 1.34] |
| 11.3 LH (method unspecified) versus AH | 1 | 876 | Odds Ratio (M‐H, Fixed, 95% CI) | 1.50 [0.16, 14.51] |
| 12 Transfusion Show forest plot | 19 | 2638 | Odds Ratio (M‐H, Random, 95% CI) | 0.58 [0.30, 1.10] |
| 12.1 LAVH versus AH | 5 | 539 | Odds Ratio (M‐H, Random, 95% CI) | 0.38 [0.11, 1.34] |
| 12.2 LH(a) versus AH | 8 | 641 | Odds Ratio (M‐H, Random, 95% CI) | 0.47 [0.17, 1.35] |
| 12.3 TLH versus AH | 2 | 161 | Odds Ratio (M‐H, Random, 95% CI) | 0.27 [0.03, 2.47] |
| 12.4 LH (method unspecified) versus AH | 3 | 1116 | Odds Ratio (M‐H, Random, 95% CI) | 0.91 [0.08, 9.85] |
| 12.5 LAVH versus minilaparotomy AH | 2 | 181 | Odds Ratio (M‐H, Random, 95% CI) | 1.38 [0.09, 20.52] |
| 13 Pelvic haematoma Show forest plot | 8 | 782 | Odds Ratio (M‐H, Fixed, 95% CI) | 0.75 [0.38, 1.47] |
| 13.1 LAVH versus AH | 3 | 276 | Odds Ratio (M‐H, Fixed, 95% CI) | 0.33 [0.05, 2.10] |
| 13.2 LH(a) versus AH | 4 | 406 | Odds Ratio (M‐H, Fixed, 95% CI) | 0.93 [0.44, 1.97] |
| 13.3 LAVH versus minilaparotomy AH | 1 | 100 | Odds Ratio (M‐H, Fixed, 95% CI) | 0.33 [0.01, 8.21] |
| 14 Unintended laparotomy Show forest plot | 2 | Odds Ratio (M‐H, Fixed, 95% CI) | Subtotals only | |
| 14.1 LAVH versus minilaparotomy AH | 2 | 181 | Odds Ratio (M‐H, Fixed, 95% CI) | 0.49 [0.08, 2.82] |
| 15 Length of hospital stay (days) Show forest plot | 11 | Mean Difference (IV, Random, 95% CI) | Subtotals only | |
| 15.1 LAVH versus AH | 4 | 466 | Mean Difference (IV, Random, 95% CI) | ‐2.64 [‐4.16, ‐1.12] |
| 15.2 LH(a) versus AH | 4 | 380 | Mean Difference (IV, Random, 95% CI) | ‐1.82 [‐2.34, ‐1.31] |
| 15.3 TLH versus AH | 2 | 161 | Mean Difference (IV, Random, 95% CI) | ‐2.53 [‐5.08, 0.01] |
| 15.4 LAVH versus minilaparotomy AH | 1 | 100 | Mean Difference (IV, Random, 95% CI) | ‐1.1 [‐1.20, ‐1.00] |
| 16 Vaginal cuff infection Show forest plot | 9 | 852 | Odds Ratio (M‐H, Fixed, 95% CI) | 1.43 [0.67, 3.04] |
| 16.1 LAVH versus AH | 3 | 396 | Odds Ratio (M‐H, Fixed, 95% CI) | 0.75 [0.17, 3.37] |
| 16.2 LH(a) versus AH | 6 | 456 | Odds Ratio (M‐H, Fixed, 95% CI) | 1.79 [0.73, 4.37] |
| 17 Wound/abdominal wall infection Show forest plot | 6 | 611 | Odds Ratio (M‐H, Fixed, 95% CI) | 0.29 [0.12, 0.71] |
| 17.1 LAVH versus AH | 1 | 81 | Odds Ratio (M‐H, Fixed, 95% CI) | 0.20 [0.01, 4.19] |
| 17.2 LH(a) versus AH | 4 | 259 | Odds Ratio (M‐H, Fixed, 95% CI) | 0.35 [0.12, 1.03] |
| 17.3 LH (method unspecified) versus AH | 1 | 190 | Odds Ratio (M‐H, Fixed, 95% CI) | 0.24 [0.03, 2.21] |
| 17.4 LAVH versus minilaparotomy AH | 1 | 81 | Odds Ratio (M‐H, Fixed, 95% CI) | 0.20 [0.01, 4.19] |
| 18 Urinary tract infection Show forest plot | 8 | 659 | Odds Ratio (M‐H, Fixed, 95% CI) | 1.04 [0.54, 2.00] |
| 18.1 LAVH versus AH | 1 | 80 | Odds Ratio (M‐H, Fixed, 95% CI) | 0.33 [0.01, 8.22] |
| 18.2 LH(a) versus AH | 5 | 339 | Odds Ratio (M‐H, Fixed, 95% CI) | 1.27 [0.55, 2.95] |
| 18.3 LH (method unspecified) versus AH | 2 | 240 | Odds Ratio (M‐H, Fixed, 95% CI) | 0.84 [0.26, 2.69] |
| 19 Chest infection Show forest plot | 3 | 294 | Odds Ratio (M‐H, Fixed, 95% CI) | 0.31 [0.07, 1.35] |
| 19.1 LH(a) versus AH | 2 | 104 | Odds Ratio (M‐H, Fixed, 95% CI) | 0.63 [0.10, 3.93] |
| 19.2 LH (method not specified) versus AH | 1 | 190 | Odds Ratio (M‐H, Fixed, 95% CI) | 0.11 [0.01, 2.01] |
| 20 Febrile episodes or unspecified infection Show forest plot | 16 | Odds Ratio (M‐H, Fixed, 95% CI) | Subtotals only | |
| 20.1 LAVH versus AH | 4 | 339 | Odds Ratio (M‐H, Fixed, 95% CI) | 0.25 [0.09, 0.73] |
| 20.2 LH(a) versus AH | 7 | 572 | Odds Ratio (M‐H, Fixed, 95% CI) | 0.55 [0.33, 0.90] |
| 20.3 TLH versus AH | 2 | 161 | Odds Ratio (M‐H, Fixed, 95% CI) | 0.36 [0.11, 1.21] |
| 20.4 LH (method unspecified) versus AH | 3 | 1116 | Odds Ratio (M‐H, Fixed, 95% CI) | 0.94 [0.65, 1.37] |
| 20.5 LAVH versus minilaparotomy AH | 1 | 81 | Odds Ratio (M‐H, Fixed, 95% CI) | 0.14 [0.01, 2.72] |
| 21 Thromboembolism Show forest plot | 3 | 1125 | Odds Ratio (M‐H, Fixed, 95% CI) | 0.89 [0.23, 3.39] |
| 21.1 TLH versus AH | 1 | 59 | Odds Ratio (M‐H, Fixed, 95% CI) | 0.38 [0.01, 9.76] |
| 21.2 LH (method unspecified) versus AH | 2 | 1066 | Odds Ratio (M‐H, Fixed, 95% CI) | 1.11 [0.24, 5.13] |
| 22 Wound dehiscence Show forest plot | 1 | Odds Ratio (M‐H, Fixed, 95% CI) | Subtotals only | |
| 22.1 LAVH versus minilaparotomy AH | 1 | 81 | Odds Ratio (M‐H, Fixed, 95% CI) | 3.15 [0.12, 79.69] |
| 23 Return to normal activities (descriptive data) Show forest plot | Other data | No numeric data | ||
| 24 Long‐term outcomes: quality of life (descriptive data) Show forest plot | Other data | No numeric data | ||
| 25 Operation time (descriptive data) Show forest plot | Other data | No numeric data | ||
| 26 Length of hospital stay (descriptive data) Show forest plot | Other data | No numeric data | ||
| 27 Pain relief (descriptive data) Show forest plot | Other data | No numeric data | ||
| 27.1 Pain scales | Other data | No numeric data | ||
| 27.2 Postoperative analgesics | Other data | No numeric data | ||
| 27.3 Recovery from pain (days) | Other data | No numeric data | ||
| 28 Cost (descriptive data) Show forest plot | Other data | No numeric data | ||
| Outcome or subgroup title | No. of studies | No. of participants | Statistical method | Effect size |
| 1 Return to normal activities (days) Show forest plot | 2 | 140 | Mean Difference (IV, Fixed, 95% CI) | ‐1.07 [‐4.21, 2.06] |
| 1.1 LAVH versus VH | 1 | 80 | Mean Difference (IV, Fixed, 95% CI) | ‐1.60 [‐5.11, 1.91] |
| 1.2 LH(a) versus VH | 1 | 60 | Mean Difference (IV, Fixed, 95% CI) | 1.0 [‐5.95, 7.95] |
| 2 Ureter injury Show forest plot | 2 | 594 | Odds Ratio (M‐H, Fixed, 95% CI) | 1.51 [0.06, 37.18] |
| 2.1 LAVH versus VH | 1 | 45 | Odds Ratio (M‐H, Fixed, 95% CI) | 0.0 [0.0, 0.0] |
| 2.2 TLH versus VH | 1 | 45 | Odds Ratio (M‐H, Fixed, 95% CI) | 0.0 [0.0, 0.0] |
| 2.3 LH (method unspecified) versus VH | 1 | 504 | Odds Ratio (M‐H, Fixed, 95% CI) | 1.51 [0.06, 37.18] |
| 3 Bladder injury Show forest plot | 7 | 895 | Odds Ratio (M‐H, Fixed, 95% CI) | 0.91 [0.32, 2.56] |
| 3.1 LAVH versus VH | 2 | 125 | Odds Ratio (M‐H, Fixed, 95% CI) | 0.33 [0.01, 8.22] |
| 3.2 LH(a) versus VH | 2 | 136 | Odds Ratio (M‐H, Fixed, 95% CI) | 2.98 [0.30, 29.43] |
| 3.3 TLH versus VH | 2 | 85 | Odds Ratio (M‐H, Fixed, 95% CI) | 0.32 [0.01, 8.26] |
| 3.4 LH (method unspecified) versus VH | 2 | 549 | Odds Ratio (M‐H, Fixed, 95% CI) | 0.83 [0.18, 3.79] |
| 4 Urinary tract (bladder or ureter) injury Show forest plot | 7 | 895 | Odds Ratio (M‐H, Fixed, 95% CI) | 1.00 [0.36, 2.75] |
| 4.1 LAVH versus VH | 2 | 125 | Odds Ratio (M‐H, Fixed, 95% CI) | 0.33 [0.01, 8.22] |
| 4.2 LH(a) versus VH | 2 | 136 | Odds Ratio (M‐H, Fixed, 95% CI) | 2.98 [0.30, 29.43] |
| 4.3 TLH versus VH | 2 | 85 | Odds Ratio (M‐H, Fixed, 95% CI) | 0.32 [0.01, 8.26] |
| 4.4 LH (method unspecified) versus VH | 2 | 549 | Odds Ratio (M‐H, Fixed, 95% CI) | 1.01 [0.23, 4.38] |
| 5 Bowel injury Show forest plot | 2 | 639 | Odds Ratio (M‐H, Fixed, 95% CI) | 0.0 [0.0, 0.0] |
| 5.1 LAVH versus VH | 1 | 45 | Odds Ratio (M‐H, Fixed, 95% CI) | 0.0 [0.0, 0.0] |
| 5.2 TLH versus VH | 1 | 90 | Odds Ratio (M‐H, Fixed, 95% CI) | 0.0 [0.0, 0.0] |
| 5.3 LH (method unspecified) versus VH | 1 | 504 | Odds Ratio (M‐H, Fixed, 95% CI) | 0.0 [0.0, 0.0] |
| 6 Vascular injury Show forest plot | 4 | 685 | Odds Ratio (M‐H, Fixed, 95% CI) | 1.58 [0.48, 5.27] |
| 6.1 LH(a) versus VH | 2 | 136 | Odds Ratio (M‐H, Fixed, 95% CI) | 2.89 [0.11, 74.15] |
| 6.2 LH (method unspecified) versus VH | 2 | 549 | Odds Ratio (M‐H, Fixed, 95% CI) | 1.42 [0.39, 5.22] |
| 7 Fistula Show forest plot | 1 | Odds Ratio (M‐H, Fixed, 95% CI) | Subtotals only | |
| 7.1 LH(a) versus VH | 1 | 56 | Odds Ratio (M‐H, Fixed, 95% CI) | 0.30 [0.01, 7.67] |
| 8 Urinary dysfunction Show forest plot | 1 | Odds Ratio (M‐H, Fixed, 95% CI) | Subtotals only | |
| 8.1 LAVH versus VH | 1 | 80 | Odds Ratio (M‐H, Fixed, 95% CI) | 3.08 [0.12, 77.80] |
| 9 Operation time (mins) Show forest plot | 9 | Mean Difference (IV, Random, 95% CI) | Subtotals only | |
| 9.1 LAVH versus VH | 5 | 377 | Mean Difference (IV, Random, 95% CI) | 33.60 [20.13, 47.07] |
| 9.2 LH(a) versus VH | 3 | 213 | Mean Difference (IV, Random, 95% CI) | 53.58 [43.67, 63.49] |
| 9.3 TLH versus VH | 1 | 60 | Mean Difference (IV, Random, 95% CI) | 17.30 [3.34, 31.26] |
| 10 Bleeding Show forest plot | 3 | 614 | Odds Ratio (M‐H, Fixed, 95% CI) | 1.55 [0.24, 10.09] |
| 10.1 LAVH versus VH | 2 | 65 | Odds Ratio (M‐H, Fixed, 95% CI) | 1.58 [0.06, 41.03] |
| 10.2 TLH versus VH | 1 | 45 | Odds Ratio (M‐H, Fixed, 95% CI) | 1.58 [0.06, 41.03] |
| 10.3 LH (method unspecified) versus VH | 1 | 504 | Odds Ratio (M‐H, Fixed, 95% CI) | 1.51 [0.06, 37.18] |
| 11 Transfusion Show forest plot | 8 | 1039 | Odds Ratio (M‐H, Fixed, 95% CI) | 1.60 [0.80, 3.18] |
| 11.1 LAVH versus VH | 4 | 273 | Odds Ratio (M‐H, Fixed, 95% CI) | 0.74 [0.16, 3.41] |
| 11.2 LH(a) versus VH | 3 | 217 | Odds Ratio (M‐H, Fixed, 95% CI) | 2.49 [0.63, 9.86] |
| 11.3 TLH versus VH | 1 | 45 | Odds Ratio (M‐H, Fixed, 95% CI) | 1.58 [0.06, 41.03] |
| 11.4 LH (method unspecified) versus VH | 1 | 504 | Odds Ratio (M‐H, Fixed, 95% CI) | 1.74 [0.63, 4.79] |
| 12 Pelvic haematoma Show forest plot | 4 | 308 | Odds Ratio (M‐H, Fixed, 95% CI) | 1.21 [0.36, 4.03] |
| 12.1 LAVH versus VH | 3 | 228 | Odds Ratio (M‐H, Fixed, 95% CI) | 1.70 [0.40, 7.26] |
| 12.2 LH(a) versus VH | 1 | 80 | Odds Ratio (M‐H, Fixed, 95% CI) | 0.49 [0.04, 5.60] |
| 13 Unintended laparotomy Show forest plot | 10 | 1160 | Odds Ratio (M‐H, Fixed, 95% CI) | 1.55 [0.76, 3.16] |
| 13.1 LAVH versus VH | 5 | 353 | Odds Ratio (M‐H, Fixed, 95% CI) | 4.33 [0.46, 40.61] |
| 13.2 LH(a) versus VH | 3 | 213 | Odds Ratio (M‐H, Fixed, 95% CI) | 6.11 [1.06, 35.21] |
| 13.3 TLH versus VH | 1 | 45 | Odds Ratio (M‐H, Fixed, 95% CI) | 1.58 [0.06, 41.03] |
| 13.4 LH (method unspecified) versus VH | 2 | 549 | Odds Ratio (M‐H, Fixed, 95% CI) | 0.67 [0.26, 1.74] |
| 14 Vaginal cuff infection Show forest plot | 4 | 276 | Odds Ratio (M‐H, Fixed, 95% CI) | 0.98 [0.22, 4.39] |
| 14.1 LAVH versus VH | 1 | 80 | Odds Ratio (M‐H, Fixed, 95% CI) | 1.0 [0.06, 16.56] |
| 14.2 LH(a) versus VH | 3 | 196 | Odds Ratio (M‐H, Fixed, 95% CI) | 0.97 [0.16, 5.73] |
| 15 Wound/abdominal wall infection Show forest plot | 2 | 170 | Odds Ratio (M‐H, Fixed, 95% CI) | 2.88 [0.31, 27.06] |
| 15.1 LAVH versus VH | 1 | 45 | Odds Ratio (M‐H, Fixed, 95% CI) | 2.72 [0.12, 60.29] |
| 15.2 LH(a) versus VH | 1 | 80 | Odds Ratio (M‐H, Fixed, 95% CI) | 3.08 [0.12, 77.80] |
| 15.3 TLH versus VH | 1 | 45 | Odds Ratio (M‐H, Fixed, 95% CI) | 0.0 [0.0, 0.0] |
| 16 Urinary tract infection Show forest plot | 3 | 230 | Odds Ratio (M‐H, Fixed, 95% CI) | 1.66 [0.40, 6.82] |
| 16.1 LAVH versus VH | 2 | 125 | Odds Ratio (M‐H, Fixed, 95% CI) | 1.02 [0.15, 6.89] |
| 16.2 LH(a) versus VH | 1 | 60 | Odds Ratio (M‐H, Fixed, 95% CI) | 3.10 [0.12, 79.23] |
| 16.3 TLH versus VH | 1 | 45 | Odds Ratio (M‐H, Fixed, 95% CI) | 2.72 [0.12, 60.29] |
| 17 Chest infection Show forest plot | 1 | Odds Ratio (M‐H, Fixed, 95% CI) | Subtotals only | |
| 17.1 LH(a) versus VH | 1 | 60 | Odds Ratio (M‐H, Fixed, 95% CI) | 0.19 [0.01, 4.06] |
| 18 Febrile episodes or unspecified infection Show forest plot | 9 | 1074 | Odds Ratio (M‐H, Fixed, 95% CI) | 0.80 [0.51, 1.24] |
| 18.1 LAVH versus VH | 4 | 253 | Odds Ratio (M‐H, Fixed, 95% CI) | 1.55 [0.49, 4.85] |
| 18.2 LH(a) versus VH | 3 | 196 | Odds Ratio (M‐H, Fixed, 95% CI) | 0.99 [0.28, 3.51] |
| 18.3 TLH versus VH | 2 | 121 | Odds Ratio (M‐H, Fixed, 95% CI) | 0.33 [0.06, 1.74] |
| 18.4 LH (method unspecified) versus VH | 1 | 504 | Odds Ratio (M‐H, Fixed, 95% CI) | 0.72 [0.41, 1.25] |
| 19 Thromboembolism Show forest plot | 2 | 564 | Odds Ratio (M‐H, Fixed, 95% CI) | 1.00 [0.15, 6.67] |
| 19.1 TLH versus VH | 1 | 60 | Odds Ratio (M‐H, Fixed, 95% CI) | 0.32 [0.01, 8.24] |
| 19.2 LH (method unspecified) versus VH | 1 | 504 | Odds Ratio (M‐H, Fixed, 95% CI) | 2.52 [0.12, 52.76] |
| 20 Length of hospital stay (days) Show forest plot | 7 | 525 | Mean Difference (IV, Random, 95% CI) | 0.88 [0.73, 1.03] |
| 20.1 LAVH versus VH | 4 | 308 | Mean Difference (IV, Random, 95% CI) | 0.91 [0.76, 1.06] |
| 20.2 LH(a) versus VH | 2 | 157 | Mean Difference (IV, Random, 95% CI) | 0.40 [‐0.42, 1.22] |
| 20.3 TLH versus VH | 1 | 60 | Mean Difference (IV, Random, 95% CI) | ‐0.5 [‐2.41, 1.41] |
| 21 Return to normal activities (descriptive data) Show forest plot | Other data | No numeric data | ||
| 22 Long‐term outcomes: quality of life (descriptive data) Show forest plot | Other data | No numeric data | ||
| 23 Operation time (descriptive data) Show forest plot | Other data | No numeric data | ||
| 24 Length of hospital stay (descriptive data) Show forest plot | Other data | No numeric data | ||
| 25 Pain relief (descriptive data) Show forest plot | Other data | No numeric data | ||
| 25.1 Pain scales | Other data | No numeric data | ||
| 25.2 Postoperative analgesics | Other data | No numeric data | ||
| 26 Cost (descriptive data) Show forest plot | Other data | No numeric data | ||
| Outcome or subgroup title | No. of studies | No. of participants | Statistical method | Effect size |
| 1 Return to normal activities (days) Show forest plot | 1 | Mean Difference (IV, Fixed, 95% CI) | Subtotals only | |
| 2 Intraoperative visceral injury (dichotomous) Show forest plot | 1 | Odds Ratio (M‐H, Fixed, 95% CI) | Subtotals only | |
| 2.1 Ureter injury | 1 | 100 | Odds Ratio (M‐H, Fixed, 95% CI) | 0.33 [0.01, 8.21] |
| 2.2 Vascular injury | 1 | 100 | Odds Ratio (M‐H, Fixed, 95% CI) | 1.0 [0.06, 16.44] |
| 2.3 Wound/abdominal wall infection | 1 | 100 | Odds Ratio (M‐H, Fixed, 95% CI) | 0.33 [0.01, 8.21] |
| 2.4 Wound dehiscence | 1 | 100 | Odds Ratio (M‐H, Fixed, 95% CI) | 0.33 [0.01, 8.21] |
| 3 Operation time Show forest plot | 2 | 152 | Mean Difference (IV, Random, 95% CI) | 44.09 [5.31, 82.88] |
| 4 Transfusion Show forest plot | 1 | Odds Ratio (M‐H, Fixed, 95% CI) | Subtotals only | |
| 5 Return to normal activities (descriptive data) Show forest plot | Other data | No numeric data | ||
| Outcome or subgroup title | No. of studies | No. of participants | Statistical method | Effect size |
| 1 Bladder injury Show forest plot | 1 | Odds Ratio (M‐H, Fixed, 95% CI) | Subtotals only | |
| 1.1 SP‐TLH versus TLH | 1 | 64 | Odds Ratio (M‐H, Fixed, 95% CI) | 3.51 [0.14, 89.42] |
| 2 Operation time (mins) Show forest plot | 2 | Mean Difference (IV, Fixed, 95% CI) | Totals not selected | |
| 2.1 SP‐LAVH versus LAVH | 1 | Mean Difference (IV, Fixed, 95% CI) | 0.0 [0.0, 0.0] | |
| 2.2 SP‐TLH versus TLH | 1 | Mean Difference (IV, Fixed, 95% CI) | 0.0 [0.0, 0.0] | |
| 3 Transfusion Show forest plot | 3 | 203 | Odds Ratio (M‐H, Fixed, 95% CI) | 1.37 [0.30, 6.26] |
| 3.1 SP‐LAVH versus LAVH | 2 | 139 | Odds Ratio (M‐H, Fixed, 95% CI) | 0.97 [0.16, 5.86] |
| 3.2 SP‐TLH versus TLH | 1 | 64 | Odds Ratio (M‐H, Fixed, 95% CI) | 3.51 [0.14, 89.42] |
| 4 Pelvic haematoma Show forest plot | 1 | Odds Ratio (M‐H, Fixed, 95% CI) | Subtotals only | |
| 4.1 SP‐LAVH versus LAVH | 1 | 100 | Odds Ratio (M‐H, Fixed, 95% CI) | 3.06 [0.12, 76.95] |
| 5 Wound/abdominal wall infection Show forest plot | 1 | Odds Ratio (M‐H, Fixed, 95% CI) | Subtotals only | |
| 5.1 SP‐LAVH versus LAVH | 1 | 100 | Odds Ratio (M‐H, Fixed, 95% CI) | 0.33 [0.01, 8.21] |
| 6 Febrile episodes or unspecified infection Show forest plot | 1 | Odds Ratio (M‐H, Fixed, 95% CI) | Subtotals only | |
| 6.1 SP‐TLH versus TLH | 1 | 64 | Odds Ratio (M‐H, Fixed, 95% CI) | 4.87 [0.93, 25.62] |
| 7 Postoperative ileus Show forest plot | 1 | Odds Ratio (M‐H, Fixed, 95% CI) | Subtotals only | |
| 7.1 SP‐TLH versus TLH | 1 | 64 | Odds Ratio (M‐H, Fixed, 95% CI) | 2.36 [0.20, 27.39] |
| 8 Length of hospital stay (days) Show forest plot | 1 | Mean Difference (IV, Fixed, 95% CI) | Subtotals only | |
| 8.1 SP‐LAVH versus LAVH | 1 | 100 | Mean Difference (IV, Fixed, 95% CI) | ‐0.20 [‐0.49, 0.09] |
| 9 Operation time (descriptive data) Show forest plot | Other data | No numeric data | ||
| 10 Length of hospital stay (descriptive data) Show forest plot | Other data | No numeric data | ||
| Outcome or subgroup title | No. of studies | No. of participants | Statistical method | Effect size |
| 1 Intraoperative visceral injury (dich) Show forest plot | 2 | Odds Ratio (M‐H, Fixed, 95% CI) | Subtotals only | |
| 1.1 Bladder injury | 2 | 161 | Odds Ratio (M‐H, Fixed, 95% CI) | 0.72 [0.06, 8.27] |
| 1.2 Ureter injury | 2 | 161 | Odds Ratio (M‐H, Fixed, 95% CI) | 3.03 [0.27, 34.52] |
| 1.3 Urinary tract (bladder or ureter) injury | 2 | 161 | Odds Ratio (M‐H, Fixed, 95% CI) | 1.5 [0.29, 7.83] |
| 1.4 Bowel injury | 2 | 161 | Odds Ratio (M‐H, Fixed, 95% CI) | 0.0 [0.0, 0.0] |
| 1.5 Vascular injury | 1 | 101 | Odds Ratio (M‐H, Fixed, 95% CI) | 1.48 [0.09, 24.27] |
| 1.6 Conversion to laparotomy | 2 | 164 | Odds Ratio (M‐H, Fixed, 95% CI) | 1.28 [0.21, 7.85] |
| 2 Long‐term complications (dich) Show forest plot | 1 | 202 | Odds Ratio (M‐H, Fixed, 95% CI) | 1.09 [0.54, 2.17] |
| 2.1 Dyspareunia | 1 | 101 | Odds Ratio (M‐H, Fixed, 95% CI) | 2.64 [0.59, 11.72] |
| 2.2 Orgasm (< 1 of 3) | 1 | 101 | Odds Ratio (M‐H, Fixed, 95% CI) | 0.84 [0.38, 1.86] |
| 3 Operation time (mins) Show forest plot | 1 | Mean Difference (IV, Fixed, 95% CI) | Subtotals only | |
| 4 Short‐term outcomes (dich) Show forest plot | 2 | Odds Ratio (M‐H, Random, 95% CI) | Totals not selected | |
| 4.1 Transfusion | 2 | Odds Ratio (M‐H, Random, 95% CI) | 0.0 [0.0, 0.0] | |
| 4.2 Vaginal cuff infection | 1 | Odds Ratio (M‐H, Random, 95% CI) | 0.0 [0.0, 0.0] | |
| 4.3 Abdominal wall/wound infection | 1 | Odds Ratio (M‐H, Random, 95% CI) | 0.0 [0.0, 0.0] | |
| 4.4 UTI | 1 | Odds Ratio (M‐H, Random, 95% CI) | 0.0 [0.0, 0.0] | |
| 4.5 Febrile episodes or unspecified infection | 2 | Odds Ratio (M‐H, Random, 95% CI) | 0.0 [0.0, 0.0] | |
| 5 Length of hospital stay (days) Show forest plot | 1 | Mean Difference (IV, Fixed, 95% CI) | Subtotals only | |
| Outcome or subgroup title | No. of studies | No. of participants | Statistical method | Effect size |
| 1 Operation time (descriptive data) Show forest plot | Other data | No numeric data | ||
| 2 Length of hospital stay (descriptive data) Show forest plot | Other data | No numeric data | ||