Cirugía para la pérdida de peso en adultos
Resumen
Antecedentes
La cirugía bariátrica (disminución del peso) se considera para la obesidad cuando han fracasado otros tratamientos. No están claros los efectos de los procedimientos bariátricos disponibles comparados entre sí y con el tratamiento médico. Ésta es una actualización de una revisión Cochrane publicada por primera vez en 2003 y actualizada más recientemente en 2009.
Objetivos
Evaluar los efectos de la cirugía bariátrica para el sobrepeso y la obesidad, incluido el control de las comorbilidades.
Métodos de búsqueda
Los estudios se obtuvieron a partir de búsquedas en numerosas bases de datos, complementadas con búsquedas en las listas de referencias y consultas con expertos en investigación de la obesidad. La fecha de la última búsqueda fue noviembre de 2013.
Criterios de selección
Ensayos controlados aleatorizados (ECA) que compararan intervenciones quirúrgicas con tratamiento no quirúrgico de la obesidad o el sobrepeso o que compararan diferentes procedimientos quirúrgicos.
Obtención y análisis de los datos
Un autor de la revisión extrajo los datos y un segundo los verificó. Dos autores de la revisión evaluaron el riesgo de sesgo de forma independiente y evaluaron la calidad general del estudio mediante el método GRADE.
Resultados principales
Se incluyeron 22 ensayos con 1798 participantes y los tamaños muestrales variaron entre 15 y 250. La mayoría de los estudios siguieron a los participantes durante 12, 24 o 36 meses; el seguimiento más largo fue de diez años. El riesgo de sesgo en todos los dominios de la mayoría de los ensayos fue incierto; sólo uno se consideró que tenía una ocultación de la asignación adecuada.
Los siete ECA que compararon la cirugía con intervenciones no quirúrgicas encontraron efectos beneficiosos de la cirugía sobre las medidas del cambio de peso al año y hasta los dos años de seguimiento. También se encontraron mejorías en algunos aspectos de la calidad de vida (CdV) relacionada con la salud (dos ECA) y la diabetes (cinco ECA). La calidad general de la evidencia fue moderada. Cinco estudios informaron datos sobre la mortalidad, no se produjeron muertes. Los eventos adversos graves (EAG) se informaron en cuatro estudios y variaron del 0% al 37% en los grupos de cirugía y del 0% al 25% en los grupos de ninguna cirugía. Entre el 2% y el 13% de los participantes necesitaron una reintervención en los cinco estudios que informaron estos datos.
Tres ECA encontraron que el baipás gástrico en Y de Roux laparoscópico (BGYRL) logró una pérdida de peso y una reducción en el índice de masa corporal (IMC) significativamente mayores hasta cinco años después de la cirugía en comparación con la banda gástrica ajustable laparoscópica (BGAL). La media del IMC al final del estudio fue menor después del BGYRL en comparación con la BGAL: diferencia de medias (DM) ‐5,2 kg/m² (intervalo de confianza [IC] del 95%: ‐6,4 a ‐4,0; p < 0,00001; 265 participantes; tres ensayos; evidencia de calidad moderada). La evidencia sobre la CdV y las comorbilidades fue de calidad muy baja. El procedimiento de BGYRL dio lugar a una duración mayor de la hospitalización en dos ECA (4/3,1 versus 2/1,5 días) y a un número mayor de complicaciones graves tardías (26,1% versus 11,6%) en un ECA. En un ECA la BGAL requirió tasas altas de reintervenciones para la extracción de la banda (nueve pacientes, 40,9%).
El BGYR abierto, el BGYRL y la gastrectomía en manga laparoscópica (GML) dieron lugar a pérdidas de peso o en el IMC, pero no hubo una visión consistente en cuanto a qué procedimiento fue mejor o peor en los siete ensayos incluidos. La DM fue ‐0,2 kg/m² (IC del 95%: ‐1,8 a 1,3); 353 participantes; seis ensayos; evidencia de calidad baja) a favor del BGYRL. No se encontraron diferencias estadísticamente significativas en la CdV (un ECA). Seis ECA informaron sobre la mortalidad y se produjo una muerte después del BGYRL. Un ECA informó los EAG, los cuales fueron mayores en el grupo de BGYRL (4,5%) que en el grupo de GML (0,9%). Las reintervenciones variaron del 6,7% al 24% en el grupo de BGYRL y del 3,3% al 34% en el grupo de GML. Los efectos sobre las comorbilidades, las complicaciones y los procedimientos quirúrgicos adicionales fueron neutrales, excepto por una mejoría en la enfermedad por reflujo gastroesofágico después del BGYRL (un ECA). Un ECA de personas con un IMC de 25 a 35 y diabetes tipo 2 encontró que el mini baipás gástrico laparoscópico dio lugar a una mayor pérdida de peso y a una mejoría de la diabetes en comparación con la GML y tuvo niveles similares de complicaciones.
Dos ECA encontraron que la derivación biliopancreática con cruce duodenal (DBCD) dio lugar a una mayor pérdida de peso que el BGYR en pacientes con obesidad mórbida. La pérdida media de IMC al final del estudio fue mayor luego de la DBCD: DM ‐7,3 kg/m² (IC del 95%: ‐9,3 a ‐5,4); p < 0,00001; 107 participantes; dos ensayos; evidencia de calidad moderada). La CdV fue similar en la mayoría de los dominios. En un estudio entre el 82% y el 100% de los participantes con diabetes presentaron niveles de HbA1c menores del 5% a los tres años después de la cirugía. El número de reintervenciones fue mayor en el grupo de DBCD (16,1% a 27,6%) que en el grupo de BGYRL (4,3% a 8,3%). Hubo una muerte en el grupo de DBCD.
Un ECA que comparó el baipás duodenoyeyunal laparoscópico con la gastrectomía en manga versus el BGYRL encontró que el IMC, la pérdida de peso excesiva y las tasas de remisión de la diabetes y la hipertensión fueron similares a los 12 meses de seguimiento (evidencia de calidad muy baja). No se informó sobre la CdV, los EAG ni las tasas de reintervención. No se produjeron muertes en ningún grupo.
Un ECA que comparó la gastrectomía en manga aislada laparoscópica (GMAL) versus la BGAL encontró una mejoría mayor en los desenlaces de la pérdida de peso después de la GMAL a los tres años de seguimiento (evidencia de calidad muy baja). No se informó sobre la CdV, la mortalidad ni los EAG. Hubo reintervenciones en el 20% del grupo de BGAL y en el 10% del grupo de GMAL.
Un ECA (no publicado) que comparó la imbricación gástrica laparoscópica con la GML no encontró diferencias estadísticamente significativas en la pérdida de peso entre los grupos (evidencia de calidad muy baja). No se informó sobre la CdV ni las comorbilidades. No se produjeron muertes. Dos participantes del grupo de imbricación gástrica requirieron una reintervención.
Conclusiones de los autores
La cirugía da lugar a una mejoría mayor en los desenlaces de la pérdida de peso y en las comorbilidades asociadas con el peso en comparación con las intervenciones no quirúrgicas, independientemente del tipo de procedimiento utilizado. Cuando se compararon entre sí, determinados procedimientos dieron lugar a una mayor pérdida de peso y a mejorías en las comorbilidades. Los desenlaces fueron similares entre el BGYR y la gastrectomía en manga, y ambos procedimientos presentaron mejores desenlaces que la banda gástrica ajustable. En las personas con un IMC muy alto, la derivación biliopancreática con cruce duodenal dio lugar a una mayor pérdida de peso que el BGYR. El baipás duodenoyeyunal con la gastrectomía en manga y el BGYR laparoscópico tuvieron desenlaces similares; sin embargo, estos datos se basan en un ensayo pequeño. La gastrectomía en manga aislada dio lugar a mejores desenlaces de pérdida de peso que la banda gástrica ajustable a los tres años de seguimiento. Este resultado se basó en un solo ensayo. Los desenlaces relacionados con el peso fueron similares entre la imbricación gástrica laparoscópica y la gastrectomía en manga laparoscópica en un ensayo. A través de todos los estudios las tasas de eventos adversos y las tasas de reintervención generalmente se informaron de forma deficiente. La mayoría de los ensayos realizó el seguimiento de los participantes durante sólo uno o dos años, por lo tanto, aún no se conocen los efectos a largo plazo de la cirugía.
PICO
Resumen en términos sencillos
Cirugía para la obesidad
Pregunta de la revisión
¿Cuáles son los efectos de la cirugía para la pérdida de peso (bariátrica) en adultos con obesidad o sobrepeso?
Antecedentes
La obesidad está asociada con muchos problemas de salud y un mayor riesgo de muerte. La cirugía bariátrica sólo se considera para la obesidad cuando han fracasado otros tratamientos. Se procuró comparar intervenciones quirúrgicas con intervenciones no quirúrgicas para la obesidad (como medicamentos, dieta y ejercicios) y comparar diferentes procedimientos quirúrgicos. La cirugía bariátrica se puede considerar para las personas con un índice de masa corporal (IMC = kg/m²) mayor de 40, o para las que presentan un IMC menor de 40 y enfermedades relacionadas con la obesidad como la diabetes.
Características de los estudios
Se incluyeron 22 estudios que compararon la cirugía con intervenciones no quirúrgicas o que compararon diferentes tipos de cirugía. En total, se asignaron 1496 participantes a cirugía y 302 a intervenciones no quirúrgicas. La mayoría de los estudios realizaron el seguimiento de los participantes por 12 a 36 meses y el seguimiento más largo fue de diez años. La mayoría de los participantes eran mujeres y, como promedio, entre 30 y 50 años de edad.
Resultados clave
Siete estudios compararon la cirugía con intervenciones no quirúrgicas. Debido a las diferencias en el diseño de los estudios, se decidió no generar un promedio de sus resultados. La dirección del efecto indicó que las personas que se sometieron a la cirugía lograron una mayor pérdida de peso al año o dos años después en comparación con las personas que no se sometieron a la cirugía. También se encontraron mejorías en la calidad de vida y la diabetes. No se produjeron muertes, las reintervenciones en los grupos de intervención quirúrgica variaron entre el 2% y el 13%, según se informó en cinco estudios.
Tres estudios determinaron que el baipás gástrico (BG) lograba una mayor pérdida de peso hasta cinco años después de la cirugía en comparación con la banda gástrica ajustable (BGA): el IMC al final de los estudios fue como promedio cinco unidades menos. El procedimiento de BG dio lugar a una mayor duración de la hospitalización y a un mayor número de complicaciones graves tardías. La BGA requirió altas tasas de reintervención para la extracción de la banda gástrica.
Siete estudios compararon el BG con la gastrectomía en manga (GM). En general, no hubo diferencias importantes en cuanto a la pérdida de peso, la calidad de vida, las comorbilidades ni las complicaciones, aunque la enfermedad por reflujo gastroesofágico mejoró en más pacientes tras el BG en un estudio. Se produjo una muerte en el grupo de BG. Se produjeron episodios adversos graves en el 5% del grupo de BG y en el 1% del grupo de GM, como se informó en un estudio. Dos estudios informaron que entre el 7% y el 24% de las personas con BG y entre el 3% y el 34% de las que recibieron GM requirieron reintervenciones.
Dos estudios determinaron que la derivación biliopancreática con cruce duodenal daba lugar a una mayor pérdida de peso que el BG después de dos o cuatro años en personas con un IMC relativamente alto. El IMC al final de los estudios fue como promedio siete unidades menos. Se produjo una muerte en el grupo de derivación biliopancreática. Las reintervenciones fueron mayores en el grupo de derivación biliopancreática (16% a 28%) que en el grupo de BG (4% a 8%).
Un estudio que comparó la derivación duodenoyeyunal con GM frente al BG determinó que los desenlaces de pérdida de peso y las tasas de remisión de la diabetes y la hipertensión fueron similares a los 12 meses de seguimiento. No se produjeron muertes en ninguno de los dos grupos y no se informaron las tasas de reintervención.
Un estudio determinó que el IMC se redujo en 10 unidades más después de la GM a los tres años de seguimiento en comparación con la BGA. Se realizaron reintervenciones en el 20% del grupo de BGA y en el 10% del grupo de GM.
Un estudio no encontró diferencias relevantes en los desenlaces de pérdida de peso tras la imbricación gástrica en comparación con la GM. No se produjeron muertes; el 17% de los participantes del grupo de imbricación gástrica requirieron una reintervención.
Calidad de la evidencia
A partir de la información disponible sobre los estudios, no fue posible evaluar si estaban bien diseñados. Los episodios adversos y las tasas de reintervención no se informaron de manera consistente en las publicaciones de los estudios. La mayoría de los estudios realizaron el seguimiento de los participantes durante sólo uno o dos años, por lo tanto, aún no se conocen los efectos a largo plazo de la cirugía.
Pocos estudios evaluaron los efectos de la cirugía bariátrica en el tratamiento de las comorbilidades en participantes con un IMC más bajo. Por lo tanto, hay una falta de evidencia sobre el uso de la cirugía bariátrica para el tratamiento de las comorbilidades en personas que tienen sobrepeso o que no satisfacen los criterios estándar para la cirugía bariátrica.
Actualidad de los datos
Esta evidencia está actualizada hasta noviembre de 2013.
Authors' conclusions
Summary of findings
| Surgery compared with no surgery for obesity | ||||||
| Patient or population: participants with obesity | ||||||
| Outcomes | No surgery | Surgery | Relative effect | No of participants | Quality of the evidence | Comments |
| BMI at study end [kg/m²] | See comment | See comment | Not estimablea | 582 | ⊕⊕⊕⊝ | The direction of the effect was consistently in favour of surgery |
| Health‐related quality of life | See comment | See comment | Not estimablea | 140 | ⊕⊕⊕⊝ | Improvements were seen in both studies for some aspects of health‐related quality of life but not others |
| Comobidities: diabetes | See comment | See comment | Not estimablea | 442 | ⊕⊕⊕⊝ | More people experienced remission of disease following surgery |
| Mortality Follow‐up: 12 to 24 months | See comment | See comment | Not estimablea | 478 (5) | ⊕⊕⊕⊝ | 5 of 7 studies reported data: no deaths occurred |
| Serious adverse events (SAEs) [%] Follow‐up: 12 to 24 months | See comment | See comment | Not estimablea | 438 (4) | ⊕⊝⊝⊝ | 4 of 7 studies reported data: SAEs ranged from 0% to 37% in the surgery group and from 0% to 25% in the no surgery group |
| Reoperations [%] Follow‐up: 12 to 24 months | See comment | See comment | Not estimablea | 470 (5) | ⊕⊝⊝⊝ | 5 studies reported data: 2% to 13% of participants in the surgery group underwent reoperations |
| *The basis for the assumed risk (e.g. the median control group risk across studies) is provided in footnotes. The corresponding risk (and its 95% confidence interval) is based on the assumed risk in the comparison group and the relative effect of the intervention (and its 95% CI). | ||||||
| GRADE Working Group grades of evidence | ||||||
| aStudies could not be pooled due to differences in participants, interventions (types of surgery), and comparators | ||||||
| Laparoscopic gastric bypass compared with laparoscopic adjustable gastric banding for obesity | ||||||
| Patient or population: participants with obesity | ||||||
| Outcomes | Illustrative comparative risks* (95% CI) | Relative effect | No of participants | Quality of the evidence | Comments | |
| Assumed risk | Corresponding risk | |||||
| Laparoscopic adjustable gastric banding | Laparoscopic gastric bypass | |||||
| BMI at study end [kg/m²] | The mean BMI at study end ranged across control groups from 36 to 37 | The mean BMI at study end in the intervention groups was 5.2 lower (6.4 to 4.0 lower) | ‐ | 265 | ⊕⊕⊕⊝ | ‐ |
| Health‐related quality of life | See comment | See comment | Not estimable | 250 | ⊕⊝⊝⊝ | Data not reported. Trial states that scores were comparable to US norms in both groups |
| Comorbidities:diabetes Follow‐up: 10 years | See comment | See comment | Not estimable | 51 | ⊕⊝⊝⊝ | Only one participant had diabetes at baseline, this was not observed after 5 years of follow‐up. |
| Mortality Follow‐up: 4 to 10 years | See comment | See comment | Not estimable | 301 (2) | ⊕⊕⊕⊝ | 2 studies reported data: 1 death was observed in the laparoscopic gastric bypass group |
| Serious adverse events (SAEs) | See comment | See comment | Not estimable | See comment | See comment | Not reported |
| Reoperations [%] Follow‐up: 4 to 10 years | See comment | See comment | Not estimable | 240 (2) | ⊕⊝⊝⊝ | 2 studies reported data: 12.6% to 28.6% vs 12.8% to 40.9% in the laparoscopic gastric bypass group vs laparoscopic adjustable gastric banding group, respectively |
| *The basis for the assumed risk (e.g. the median control group risk across studies) is provided in footnotes. The corresponding risk (and its 95% confidence interval) is based on the assumed risk in the comparison group and the relative effect of the intervention (and its 95% CI). | ||||||
| GRADE Working Group grades of evidence | ||||||
| aDowngraded by one level because of high or unclear risk of attrition bias | ||||||
| Laparoscopic gastric bypass compared with laparoscopic sleeve gastrectomy for obesity | ||||||
| Patient or population: participants with obesity | ||||||
| Outcomes | Illustrative comparative risks* (95% CI) | Relative effect | No of participants | Quality of the evidence | Comments | |
| Assumed risk | Corresponding risk | |||||
| Laparoscopic sleeve gastrectomy | Laparoscopic Roux‐en‐Y gastric bypass | |||||
| BMI at study end [kg/m²] | The mean BMI at study end ranged across control groups from 27 to 33 | The mean BMI at study end in the intervention groups was 0.2 lower (1.8 lower to 1.3 higher) | ‐ | 353 | ⊕⊕⊝⊝ | ‐ |
| Health‐related quality of life | See comment | See comment | ‐ | 217 | ⊕⊝⊝⊝ | Interim analysis showed no statistically significant differences between groups |
| Comorbidities: diabetes | See comment | See comment | Not estimable | 353 | ⊕⊕⊝⊝ | Diabetes was reported in different ways by the studies but no relevant difference between groups was found |
| Mortality Follow‐up: 12 to 36 months | See comment | See comment | Not estimable | 600 (6) | ⊕⊕⊕⊝ | 6 studies reported data: 1 death was observed in the laparoscopic Roux‐en‐Y gastric bypass group |
| Serious adverse events (SAEs) [%] Follow‐up: 12 months | See comment | See comment | Not estimable | 217 (1) | ⊕⊝⊝⊝ | 1 study reported data: 4.5% in the laparoscopic gastric bypass group and 0.9% in the laparoscopic sleeve gastrectomy group |
| Reoperations [%] Follow‐up: 12 months | See comment | See comment | Not estimable | 277 (2) | ⊕⊝⊝⊝ | 2 of 6 studies reported data: 6.7% to 23.6% in the laparoscopic gastric bypass group and 3.3% to 33.6% in the laparoscopic sleeve gastrectomy group |
| *The basis for the assumed risk (e.g. the median control group risk across studies) is provided in footnotes. The corresponding risk (and its 95% confidence interval) is based on the assumed risk in the comparison group and the relative effect of the intervention (and its 95% CI). | ||||||
| GRADE Working Group grades of evidence | ||||||
| aDowngraded by two levels because of inconsistency, imprecision and some trials showing attrition bias | ||||||
| Gastric bypass compared with biliopancreatic diversion with duodenal switch for obesity | ||||||
| Patient or population: participants with obesity | ||||||
| Outcomes | Illustrative comparative risks* (95% CI) | Relative effect | No of participants | Quality of the evidence | Comments | |
| Assumed risk | Corresponding risk | |||||
| Biliopancreatic diversion with duodenal switch | Gastric bypass | |||||
| BMI reduction at study end [kg/m²] | The mean BMI reduction at study end ranged across control groups from 23 to 25 | The mean BMI reduction at study end in the intervention groups was 7.3 lower (9.3 lower to 5.4 lower) | ‐ | 107 (2) | ⊕⊕⊕⊝ | ‐ |
| Health‐related quality of life Follow‐up: 24 months | See comment | See comment | Not estimable | 60 | ⊕⊝⊝⊝ | Only 1 of 8 SF‐36 domains showed a statistically significant difference in favour of gastric bypass |
| Comorbidities: diabetes | See comment | See comment | Not estimable | 60 | ⊕⊝⊝⊝ | Three years after surgery 82% to 100% of participants had an HbA1c < 5% |
| Mortality Follow‐up: 24 to 48 months | See comment | See comment | Not estimable | 107 (2) | ⊕⊕⊕⊝ | One death was observed in the open biliopancreatic diversion with duodenal switch group |
| Serious adverse events (SAEs) | See comment | See comment | Not estimable | See comment | See comment | Not reported |
| Reoperations [%] Follow‐up: 24 to 48 months | See comment | See comment | Not estimable | 107 (2) | ⊕⊝⊝⊝ | Both studies reported data: 4.3% to 16.1% vs 8.3% to 27.6% in the gastric bypass group vs biliopancreatic diversion with duodenal switch group, respectively |
| *The basis for the assumed risk (e.g. the median control group risk across studies) is provided in footnotes. The corresponding risk (and its 95% confidence interval) is based on the assumed risk in the comparison group and the relative effect of the intervention (and its 95% CI). | ||||||
| GRADE Working Group grades of evidence | ||||||
| aDowngraded by one level because of few trials and participants, and risk of 'other' bias | ||||||
| Laparoscopic gastric bypass compared with laparoscopic duodenojejunal bypass with sleeve gastrectomy for obesity | ||||||
| Patient or population: participants with obesity | ||||||
| Outcomes | Illustrative comparative risks* (95% CI) | Relative effect | No of participants | Quality of the evidence | Comments | |
| Assumed risk | Corresponding risk | |||||
| Laparoscopic duodenojejunal bypass with sleeve gastrectomy | Laparoscopic gastric bypass | |||||
| BMI at study end [kg/m²] | The mean BMI at study end in the control group was | The mean BMI at study end in the intervention group was 0.7higher (0.3 lower to 1.6 higher) | ‐ | 57 | ⊕⊝⊝⊝ | ‐ |
| Health‐related quality of life | See comment | See comment | Not estimable | See comment | See comment | |
| Comorbiditites: diabetes | See comment | See comment | Not estimable | 57 | ⊕⊝⊝⊝ | Reports no difference in complete or partial remission of diabetes in those with diabetes at baseline |
| Mortality | See comment | See comment | Not estimable | 57 | ⊕⊝⊝⊝ | No deaths in either group were reported |
| Serious adverse events (SAEs) | See comment | See comment | Not estimable | See comment | See comment | Not reported |
| Reoperations [%] | See comment | See comment | Not estimable | See comment | See comment | Not reported |
| *The basis for the assumed risk (e.g. the median control group risk across studies) is provided in footnotes. The corresponding risk (and its 95% confidence interval) is based on the assumed risk in the comparison group and the relative effect of the intervention (and its 95% CI). | ||||||
| GRADE Working Group grades of evidence | ||||||
| aDowngraded by three levels due to one trial only with few participants and unclear risk of bias across all domains | ||||||
| Laparoscopic adjustable gastric banding compared with laparoscopic isolated sleeve gastrectomy for obesity | ||||||
| Patient or population: participants with obesity | ||||||
| Outcomes | Illustrative comparative risks* (95% CI) | Relative effect | No of participants | Quality of the evidence | Comments | |
| Assumed risk | Corresponding risk | |||||
| Laparoscopic isolated sleeve gastrectomy | Laparoscopic adjustable gastric banding | |||||
| Reduction in BMI [kg/m²] | The mean reduction in BMI in the control group was | The mean reduction in BMI in the intervention group was | ‐ | 80 | ⊕⊝⊝⊝ | ‐ |
| Health‐related quality of life | See comment | See comment | Not estimable | See comment | See comment | Not reported |
| Comorbidities: diabetes | See comment | See comment | Not estimable | See comment | See comment | Not reported |
| Mortality | See comment | See comment | Not estimable | See comment | See comment | Not reported |
| Serious adverse events (SAEs) | See comment | See comment | Not estimable | See comment | See comment | Not reported |
| Reoperations [%] Follow‐up: mean 36 months | See comment | See comment | Not estimable | 80 (1) | ⊕⊝⊝⊝ | 20% in the laparoscopic gastric banding group and 10% in the laparoscopic isolated sleeve gastrectomy group |
| *The basis for the assumed risk (e.g. the median control group risk across studies) is provided in footnotes. The corresponding risk (and its 95% confidence interval) is based on the assumed risk in the comparison group and the relative effect of the intervention (and its 95% CI). | ||||||
| GRADE Working Group grades of evidence | ||||||
| aTrial reports median (range), P = 0.0004 | ||||||
| Laparaoscopic gastric imbrication compared with laparoscopic sleeve gastrectomy for obesity | ||||||
| Patient or population: participants with obesity | ||||||
| Outcomes | Illustrative comparative risks* (95% CI) | Relative effect | No of participants | Quality of the evidence | Comments | |
| Assumed risk | Corresponding risk | |||||
| Laparoscopic sleeve gastrectomy | Laparaoscopic gastric imbrication | |||||
| BMI at study end [kg/m²] | The mean BMI at study end in the control group was 32.1 | The mean BMI at study end in the intervention group was 4.8 higher (0.1 lower to 9.7 higher) | ‐ | 30 | ⊕⊝⊝⊝ | ‐ |
| Health‐related quality of life | See comment | See comment | Not estimable | See comment | See comment | Not reported |
| Comorbidities | See comment | See comment | Not estimable | See comment | See comment | Not reported |
| Mortality Follow‐up: mean 36 months | See comment | See comment | Not estimable | 30 | ⊕⊝⊝⊝ | No deaths occurred |
| Serious adverse events (SAEs) | See comment | See comment | Not estimable | See comment | See comment | Not reported |
| Reoperations [%] Follow‐up: mean 36 months | See comment | See comment | Not estimable | 30 | ⊕⊝⊝⊝ | 2 (16.7%) participants in the laparoscopic gastric imbrication group |
| *The basis for the assumed risk (e.g. the median control group risk across studies) is provided in footnotes. The corresponding risk (and its 95% confidence interval) is based on the assumed risk in the comparison group and the relative effect of the intervention (and its 95% CI). | ||||||
| GRADE Working Group grades of evidence | ||||||
| aDowngraded by three levels due to one trial only with few participants, and high risk of 'other' bias and unclear risk of bias across the other domains | ||||||
Background
Description of the condition
Obesity is defined as abnormal or excessive fat accumulation that may impair health, and studies suggest that, without intervention, reversal of obesity is uncommon.
The most commonly used measure for classifying obesity is the body mass index (BMI), calculated as body weight in kilograms divided by height in metres squared (kg/m2). In adults a desirable BMI is between 18.5 to 25 and overweight is between 25 to 30. Obesity is defined as BMI over 30, while severe or morbid obesity is defined as BMI over 40. A BMI of 30 is equivalent to a weight of 97.5 kg in a person 1.8 m tall or a weight of 77 kg in a person 1.6 m tall. However, different populations have different associations between BMI, percentage of body fat, and health risks, and a desirable BMI is lower in some Asian populations (WHO 2004).
Projections by the World Health Organization (WHO) indicated that globally in 2005 at least 400 million adults were obese (WHO 2006). In some countries, including the USA, UK, and Australia, the rates of obesity have more than doubled in the last 25 years (Lobstein 2007). In England, the prevalence of obesity in people aged 16 and over is 24.8% (NHS IC 2012) and the prevalence of morbid obesity is 2.5% (3.2% of women and 1.7% of men) (NHS IC 2012). In the US 6.6% of adults are morbidly obese (Sturm 2013).
Health consequences in adults
The predominant serious health consequences associated with obesity in adults include type 2 diabetes, cardiovascular disease, musculoskeletal disorders such as osteoarthritis, and certain cancers. Some of these health consequences may constitute the principal cause of death such as heart disease, stroke, some cancers; whilst others such as type 2 diabetes lead to a reduced life expectancy. Other important health consequences that have a negative impact on quality of life are obstructive sleep apnoea, infertility, obstetric complications and psychiatric comorbidity.
The WHO 2000 found that the relative risks of particular diseases in obese people, compared to lean people, are fairly similar throughout the world and have classified these into three broad categories: greatly increased risk (relative risk much greater than 3), including type 2 diabetes, dyslipidaemia, insulin resistance, breathlessness, sleep apnoea and gall bladder diseases; moderately increased risk (relative risk 2 to 3), including cardiovascular disease, hypertension osteoarthritis of the knees and hyperuricaemia and gout; and slightly increased risk (relative risk 1 to 2), including colon cancer, breast cancer in postmenopausal women, endometrial cancer, reproductive hormone abnormalities, polycystic ovary syndrome, impaired fertility, foetal defects, low back pain and risk of anaesthesia complications. A more detailed description of the health consequences of overweight and obesity can be found in Picot 2009.
Description of the intervention
Bariatric surgery for obesity is a major surgical intervention with a risk of significant early and late morbidity and of perioperative mortality. Contraindications for bariatric surgery include poor myocardial reserve, significant chronic obstructive airways disease or respiratory dysfunction, non‐compliance of medical treatment and psychological disorders of a significant degree. Many types of bariatric surgery require long‐term supplementation with vitamins and iron, and patients often have a very restricted liquid diet in the immediate weeks after surgery. Hospital stay is generally between two to seven days for most procedures, typically one to two days for sleeve gastrectomy, and zero to one day for gastric banding.
Surgery aims to reduce weight and maintain any loss through restriction of intake or malabsorption of food, or a combination of these. Several different surgical procedures have been used; this review will focus on the principal types of surgical procedure in current use. Of these, gastric bypass, sleeve gastrectomy and adjustable gastric banding are much more commonly performed than the others. These procedures are usually performed laparoscopically. Laparoscopic surgery has been a major advance in bariatric surgery and has decreased the time spent in hospital and the recovery time for the patient. Open procedures are commonly not routinely used unless there is a need for conversion during laparoscopic surgery. The following section briefly discusses these procedures and their complications, but does not provide a comprehensive discussion of the many variants of these procedures that have developed.
Gastric bypass
The Roux‐en‐Y and resectional gastric bypass procedures combine restriction and malabsorption techniques, creating both a small gastric pouch and a bypass that prevents the patient from absorbing all they have eaten. The Roux‐en‐Y procedure entails partition of the upper part of the stomach using surgical staples to create a small pouch (50 mL or less) with a small outlet (gastroenterostomy stoma) to the intestine that is attached to the pouch. The Roux‐en‐Y technique is used to avoid a loop gastroenterostomy and the bile reflux that may ensue. Adaptations of the procedure have been used to increase malabsorption and increase weight loss. Often a prosthetic band is used to stabilise the gastroenterostomy, preventing late stretching of the opening and improving long‐term weight control. It is technically possible to reverse a gastric bypass.
Complications associated with gastric bypass include failure of the staple partition, leaks at the junction of the stomach and small intestine, acute gastric dilatation, and delayed gastric emptying either spontaneously or secondary to a blockage. Other complications may occur following surgery including: vomiting caused by narrowing of the stoma due to scar tissue development, wound hernias and intestinal obstruction. Dumping syndrome can also occur (an adverse event caused by eating refined sugar, symptoms of which include rapid heart rate, nausea, tremor, faint feeling and diarrhoea). It is thought that the dumping syndrome aids weight loss by conditioning the patient against eating sweet foods. Nutritional deficiencies, such as calcium, vitamin D, vitamin B12, and some iron deficiency anaemias may occur, necessitating routine monitoring and supplementation where required.
Adjustable gastric banding
Adjustable gastric banding is the least invasive of the purely restrictive bariatric surgery procedures. It limits food intake by placing a constricting ring completely around the top end (fundus) of the stomach. While early bands were non‐adjustable, those used currently incorporate an inflatable balloon within their lining to allow adjustment of the size of the stoma to regulate food intake. Adjustment is undertaken without the need for surgery by adding or removing saline through a subcutaneous access port. As a restrictive procedure, gastric banding avoids the problems associated with malabsorptive techniques. Gastric banding is technically a reversible procedure.
Complications include those associated with the operative procedure: splenic injury, oesophageal injury, wound infection, band slippage, band erosion (or migration), reservoir deflation/leak, persistent vomiting, failure to lose weight and acid reflux. Some complications may result in a need for revisional or band‐removal surgery (Lee 2007).
Biliopancreatic diversion with duodenal switch
Biliopancreatic diversion with duodenal switch is a modification of the biliopancreatic diversion procedure, which is no longer commonly used. Biliopancreatic diversion is primarily a malabsorptive procedure. The standard procedure involves the removal of part of the stomach (a limited horizontal gastrectomy) to limit oral intake and induce weight loss. The gastric pouch that is created is larger than that of gastric bypass or the restrictive procedures, therefore allowing larger meals, and patients remain on a less restricted diet than would be the case following gastric bypass. Part of the small intestine is also bypassed (the malabsorptive component) by the construction of a long limb Roux‐en‐Y anastomosis with a short common ‘alimentary’ channel of 50 cm length. Biliopancreatic diversion is only a partially reversible procedure. The combination of biliopancreatic diversion with duodenal switch is an additional adaptation of the standard procedure. It has a sleeve gastrectomy rather than a horizontal gastrectomy.
Biliopancreatic diversion with duodenal switch tends to be used only with patients with 'superobesity' (usually meaning BMI > 50kg), due to the high rates of complications associated with it. Historically, biliopancreatic diversion alone resulted in the complication of postgastrectomy syndrome (including, for example, dumping syndrome, bile reflux, diarrhoea) in a high proportion of patients who underwent the operation. The duodenal switch adaptation was incorporated to address this, and the combined procedure has resulted in a decrease in the proportion of patients who experience this post‐operative complication. However, other complications are similar to biliopancreatic diversion and include nutritional deficiencies (particularly protein, calcium, zinc, iron and fat soluble vitamins), foul smelling stools and flatus. Nutritional monitoring and supplementation when required is needed. The most common complication is bowel obstruction. Biliopancreatic diversion with duodenal switch is associated with an approximately 1% operative mortality rate, which rises to 2.5% when the procedure is performed laparoscopically (Moshiri 2013).
Sleeve gastrectomy
For some patients who are at high risk from bariatric surgery a sleeve gastrectomy is considered. This was originally used as the first part of a two‐part surgical procedure, being followed at a later date by a conversion to either a gastric bypass or a duodenal switch. However, for some, enough weight is lost with the sleeve gastrectomy alone, and it is now increasingly used as a stand‐alone procedure. The sleeve gastrectomy divides the stomach vertically to reduce its size to about 25%. It leaves the pyloric valve at the bottom of the stomach intact which means that the stomach function and digestion are unaltered. After six to 12 months the stomach may have expanded and not restrict intake as much; this is when the gastric bypass can then be added if necessary. The sleeve gastrectomy is not reversible.
Complications are reduced as digestion is unaffected, however patients are at risk from leaking from the newly formed stomach or vomiting due to over‐eating. This operation is relatively quick to perform, which reduces the risk of complications.
Sleeve gastrectomy with duodenojejunal bypass
Duodenojejunal bypass has been used as an additional procedure with sleeve gastrectomy. The addition of it to sleeve gastrectomy was developed in an Asian population with the aim of investigating whether it could be used instead of Roux‐en‐Y gastric bypass. In Asian countries, there is a high rate of gastric cancer and therefore it is important that surgeons can examine the excluded stomach following Roux‐en‐Y gastric bypass to check for this, but doing so can result in complications. Sleeve gastrectomy does not involve exclusion of the stomach and represents an alternative procedure. However, due to concerns that sleeve gastrectomy may not result in long‐term weight loss (Kasama 2009) or be as effective as Roux‐en‐Y gastric bypass in treating co‐morbidities (Praveen Raj 2012c), investigators have added duodenojejunal bypass to the procedure. Duodenojejunal bypass involves bypassing the proximal small intestine, resulting in food moving directly to the more distal small intestine. It has been hypothesised that bypassing the proximal small intestine may also improve diabetes and glucose tolerance (Kasama 2009). Duodenojejual bypass (without sleeve gastrectomy) has been used for treating diabetes in non‐obese patients (Ferzli 2009); this is now the primary use for duodenojejunal bypass, with or without a sleeve.
Preliminary complications data from one study of 38 patients who underwent laparoscopic duodenojejunal bypass with sleeve gastrectomy showed that one patient had to have a reoperation due to internal herniation. Otherwise, there were no major or minor complications and no operative mortalities (Praveen Raj 2012c).
Gastric imbrication
Gastric imbrication (or gastric plication) is a relatively new laparoscopic procedure that reduces the stomach volume without removing any stomach tissue. The stomach is folded into itself and stitched to create a narrow tube shape, similar to that of laparoscopic sleeve gastrectomy procedure. However, unlike sleeve gastrectomy, imbrication does not involve any cutting or stapling and the stomach tissue is not removed.
How the intervention might work
As described earlier, surgical procedures for obesity aim to reduce weight and maintain any loss through restricting food intake or causing malabsorption of food or a combination of these. It is hoped that as a consequence eating behaviour is modified, with patients consuming smaller quantities of food more slowly. In addition to modifying eating habits, patients are encouraged to commit to daily exercise as part of a wider change in lifestyle.
Whilst the success of weight‐loss interventions are often expressed in terms of the amount of weight lost, improvements in health‐related quality of life and comorbidities are generally a more meaningful indication of success for individuals (Avenell 2006; Kral 2006; Lean 2006). A systematic review of the long‐term effects of obesity treatments on body weight, risk factors for disease, and disease (Avenell 2004), found that weight loss from surgical and non‐surgical interventions for people suffering from obesity was associated with a decreased risk of the development of diabetes, and a reduction in low‐density lipoprotein cholesterol, total cholesterol and blood pressure, in the long term. The effects of bariatric (weight loss) surgery on weight and type 2 diabetes have also been reviewed (Levy 2007). The authors reported that bariatric surgery not only led to weight reduction, but also that preoperative diabetes resolved post‐surgery in more than 75% of cases. A further systematic review of the long‐term weight loss effects on all‐cause mortality in overweight and obese populations (Poobalan 2007) concludes that there is some evidence that intentional weight loss has long‐term benefits on all‐cause mortality for women and more so for people with diabetes. However, the long‐term effects for men are not clear. Weight loss in obese patients with knee osteoarthritis has also been systematically reviewed and the results of meta‐analysis indicated that disability could be significantly improved when weight was reduced over 5.1%, or at the rate of greater than 0.24% reduction per week (Christensen 2007). Weight loss has not been found to have a beneficial effect on risk of stroke (Curioni 2006).
Why it is important to do this review
The current edition of the review is an update. The original version was published in 2003, Issue 2 (Colquitt 2003), and was updated in 2005, Issue 4 (Colquitt 2005), and again in 2009, Issue 2 (Colquitt 2009).
The prevalence of obesity (BMI greater than 30) and morbid obesity (BMI greater than 40) among adults is increasing. The previous versions of this review found that although surgery appeared effective in terms of weight change, there was limited evidence addressing the long‐term consequences and its influence on the health‐related quality of life of patients. The reviews identified a need for good quality randomised controlled trials (RCTs) comparing either surgery with non‐surgical interventions, or comparing one type of surgical procedure with another surgical procedure. Further key implications for research were the need for an assessment of outcomes over longer time periods (at least five years), inclusion of health‐related quality of life outcomes and a more standardised approach to measuring and reporting important adverse events. The previous version of this review also identified a need for trials that compare procedures which combine restrictive and malabsorption components such as gastric bypass with purely restrictive procedures, such as adjustable gastric banding. Since the previous review was conducted, some of the surgical procedures included are no longer used in clinical practice. In addition, surgery is now proposed to be used to control for comorbidities of excess weight, such as type 2 diabetes, as well as for weight‐loss outcomes alone.
An update of the review is therefore required that will include data from more recent trials, including any that may have assessed new bariatric surgical techniques. Certain interventions that were included in the previous version but are not in current use will be excluded from this update. Further details can be found in Differences between protocol and review.
Objectives
To assess the effects of bariatric (weight loss) surgery for overweight and obesity, including the control of comorbidities.
Methods
Criteria for considering studies for this review
Types of studies
Randomised controlled trials.
Short‐term weight loss is common, therefore studies were only included if they reported measurements after a minimum of one year.
Types of participants
Adults who are overweight or obese as defined by the study.
Types of interventions
-
Surgical procedures in current use, performed either as open procedures or laparoscopically.
Types of comparators
-
Non‐surgical treatment (usual care, no treatment or medical management, for example very low calorie diet).
-
Different surgical procedures in current use, performed either as open procedures or laparoscopically.
Exclusions
-
Comparisons of variations of surgical techniques rather than different procedures.
-
Comparisons of open versus laparoscopic procedures (of the same bariatric surgery procedure).
-
Procedures no longer in current use:
-
Jejunoileal bypass
-
Horizontal gastroplasty
-
Vertical banded gastroplasty or vertical gastroplasty (not banded)
-
Banded gastroplasty that is not adjustable
-
Banded gastric bypass
-
Biliopancreatic diversion (without duodenal switch)
-
Types of outcome measures
Primary outcomes
Studies were included if they reported one or more of the following outcomes after at least 12 months follow‐up.
-
Measures of weight change, fat content (for example, BMI) or fat distribution (for example, waist‐hip ratio).
-
Health‐related quality of life, measured using a validated instrument.
-
Obesity‐related comorbidities (for example, diabetes, hypertension).
Secondary outcomes
-
Mortality (perioperative and total).
-
Adverse events (for example, perioperative morbidity such as staple line breakdown and wound infection, gastrointestinal disturbances, reoperations).
-
Revision rates (reversal or conversions to normal or other procedures).
Search methods for identification of studies
Electronic searches
We searched the following sources from inception to the specified date.
-
The Cochrane Library (2013, Issue 4).
-
MEDLINE (until 12/11/2013).
-
EMBASE (until 12/11/2013).
-
PsycINFO (until 12/11/2013).
-
CINAHL (until 12/11/2013).
-
Web of Knowledge SCI‐EXPANDED, and CPCI‐S (until 12/11/2013).
-
Zetoc British Library (until 12/11/2013).
Databases of grey literature
-
BIOSIS (until 12/11/2013).
Ongoing trials
-
UK Clinical Research Network (until 6/11/13).
-
ClinicalTrials.gov (until 6/11/13).
-
Controlled‐trials.com (until 6/11/13).
-
WHO International Clinical Trials Registry Platform (WHO ICTRP) (until 6/11/13).
For detailed search strategies please see Appendix 1.
It was anticipated that additional key words of relevance might be identified during any of the electronic or other searches, and if this had been the case, the electronic search strategies would have been modified to incorporate these terms. There were, however, no additional key words added to the search strategy.
Studies published in any language were eligible.
Searching other resources
We contacted relevant experts to obtain additional references, unpublished trials, and any ongoing trials.
Reference lists
We examined the reference lists of relevant trials and systematic reviews identified.
Data collection and analysis
Selection of studies
For this update, two review authors (two of KP, GF, EL, JC) independently scanned the titles, abstract sections and keywords of every record retrieved. Full articles were retrieved for further assessment if the information given suggested that the study:
-
included adults with obesity;
-
compared surgery with another surgical procedure, medical management or no treatment;
-
assessed one or more relevant clinical outcome measures;
-
had a minimum duration of 12 months.
If there was any doubt regarding these criteria from the information given in the title and abstract, the full article was retrieved for clarification. Eligibility criteria were applied to the full article using a pre‐designed form by two review authors independently. Where differences in opinion existed, they were resolved by discussion with a third review author.The PRISMA (Preferred Reporting Items for Systematic reviews and Meta‐Analyses) flow‐chart of study selection is attached (Liberati 2009).
Data extraction and management
For studies that fulfilled the inclusion criteria, relevant population and intervention characteristics were extracted by one review author and checked by a second review author (any of KP, GF, EL, JC) using standard data extraction templates (for details see Characteristics of included studies; Table 1; Appendix 2; Appendix 3; Appendix 4; Appendix 5; Appendix 6; Appendix 7; Appendix 8; Appendix 9; Appendix 10) with any disagreements resolved by discussion, or if required by a third party. In the event of unclear information in an included trial, we contacted the primary author(s) of the article. See Appendix 11 for details.
| Intervention(s) and comparator(s) | Screened/eligible | Randomised | ITT | Finishing study | Randomised finishing study | Follow‐up | |
| (1) Angrisani 2007 | Laparoscopic Roux‐en‐Y gastric bypass | 24 | N/A | 21 | 87.5 | 10 years | |
| Laparoscopic adjustable gastric banding | 27 | N/A | 22a | 81.5 | |||
| total: | ‐ | 51 | N/A | 43 | 84.3 | ||
| (2) Aasheim 2009 | Laparoscopic Roux‐en‐Y gastric bypass | 31 | N/A | 31 | 100 | 2 years | |
| Laparoscopic biliopancreatic diversion with duodenal switch | 29 | N/A | 27 | 93.1 | |||
| total: | 64 | 60 | N/A | 58 | 96.7 | ||
| (3) Demerdash 2013 | Laparoscopic Roux‐en‐Y gastric bypass | ‐ | N/A | 16 | ‐ | 1 year | |
| Laparoscopic adjustable gastric band | ‐ | N/A | 18 | ‐ | |||
| total: | ‐ | 40 | 34 | 85 | |||
| (4) Dixon 2008 | Laparoscopic gastric banding in addition to the conventional therapy | 30 | 30 | 29 | 96.7 | 2 years | |
| Conventional therapy | 30 | 30 | 26 | 86.7 | |||
| total: | 158 | 60 | 60 | 55 | 91.7 | ||
| (5) Dixon 2012 | Laparoscopic adjustable gastric banding and lifestyle programme | 30 | 30 | 28 | 93.3 | 2 years | |
| 2‐year conventional weight loss programme and lifestyle programme | 30 | 30 | 26 | 86.7 | |||
| total: | 130 | 60 | 60 | 54 | 90 | ||
| (6) Hedberg 2012 | Open biliopancreatic diversion with duodenal switch | 24 | N/A | 21 | 87.5 | 4 years | |
| Open Roux‐en‐Y gastric bypass | 23 | N/A | 20 | 87 | |||
| total: | 99 | 47 | N/A | 41 | 87.2 | ||
| (7) Himpens 2006 | Laparoscopic gastric banding | 40 | ‐ | ‐ | ‐ | 3 years | |
| Laparascopic isolated sleeve gastrectomy | 40 | ‐ | ‐ | ‐ | |||
| total: | ‐ | 80 | N/A | ‐ | ‐ | ||
| (8) Ikramuddin 2013 | Laparoscopic Roux‐en‐Y gastric bypass + lifestyle programme with medical management | 60 | 60 | 57b | 95 | 1 year | |
| Lifestyle programme with medical management | 60 | 60 | 57b | 95 | |||
| total: | 2648 | 120 | 120 | 114 | 95 | ||
| (9) Karamanakos 2008 | Laparoscopic Roux‐en‐Y gastric bypass | 30 | N/A | 29 | 96.7 | 3 years | |
| Laparoscopic sleeve gastrectomy | 30 | N/A | 28 | 93.3 | |||
| total: | 60 | 60 | N/A | 57 | 95 | ||
| (10) Keidar 2013 | Laporoscopic Roux‐en‐Y gastric bypass | 22 | N/A | 19 | 86.4 | 1 year | |
| Laparoscopic sleeve gastrectomy | 19 | N/A | 18 | 94.7 | |||
| total: | ‐ | 41 | N/A | 37 | 90.2 | ||
| (11) Lee 2011 | Simplified laparoscopic mini‐gastric bypass with duodenum exclusion | 30 | 30 | 30 | 100 | 1 year | |
| Laparoscopic sleeve gastrectomy without duodenum exclusion | 30 | 30 | 30 | 100 | |||
| total: | 209 | 60 | 60 | 60 | 100 | ||
| (12) Liang 2013 | Usual care | 36 | N/A | 36 | 100 | 1 year | |
| Usual care + exenatide | 36 | N/A | 34 | 94.4 | |||
| Laparoscopic Roux‐en‐Y gastric bypass | 36 | N/A | 31 | 86.1 | |||
| total: | ‐ | 108 | N/A | 101 | 93.5 | ||
| (13) Mingrone 2012 | Gastric bypass | 20 | N/A | 19 | 95 | 2 years | |
| Medical therapy | 20 | N/A | 18 | 90 | |||
| total: | 72 | 40 | N/A | 37 | 92.5 | ||
| (14) Nguyen 2009 | Laparoscopic Roux‐en‐Y gastric bypass | 125 | N/A | 71 | 56.8 | 4 years | |
| Laparoscopic adjustable gastric banding | 125 | N/A | 30 | 24 | |||
| total: | ‐ | 250 | N/A | 101 | 40.4 | ||
| (15) Nogués 2010 | Laparascopic Roux‐en‐Y gastric bypass | 7 | 7 | 7 | 100 | 1 year | |
| Laparoscopic sleeve gastrectomy | 8 | 8 | 8 | 100 | |||
| total: | 30 | 15 | 15 | 15 | 100 | ||
| (16) O'Brien 2006 | Laparoscopic adjustable gastric band | 40 | N/A | 39 | 97.5 | 2 years | |
| Intensive non‐surgical programme | 40 | N/A | 40 | 100 | |||
| total: | 158 | 80 | N/A | 79 | 98.8 | ||
| (17) Paluszkiewicz 2012 | Open Roux‐en‐Y gastric bypass | 36 | ‐ | 35 | 97.2 | 1 year | |
| Laparoscopic sleeve gastrectomy | 36 | ‐ | 34 | 94.4 | |||
| total: | 86 | 72 | ‐ | 69 | 95.8 | ||
| (18) Peterli 2012 | Laparoscopic Roux‐en‐Y gastric bypass | 110 | N/A | N/A | N/A | 3 years | |
| Laparoscopic sleeve gastrectomy | 107 | N/A | N/A | N/A | |||
| total: | ‐ | 217c | N/A | N/Ad | N/A | ||
| (19) Praveen Raj 2012 | Laparoscopic duodenojejunal bypass with sleeve gastrectomy | 28 | ‐ | ‐ | ‐ | 1 year | |
| Laparoscopic Roux‐en‐Y gastric bypass | 29 | ‐ | ‐ | ‐ | |||
| total: | ‐ | 57 | ‐ | ‐ | ‐ | ||
| (20) Schauer 2012 | Intensive medical therapy alone | 50 | N/A | 41 | 82 | 1 year | |
| Intensive medical therapy plus laparoscopic Roux‐en‐Y gastric bypass | 50 | N/A | 50 | 100 | |||
| Intensive medical therapy plus laparoscopic sleeve gastrectomy | 50 | N/A | 49 | 98 | |||
| total: | 218 | 150 | N/A | 140 | 93.3 | ||
| (21) Sharma 2013 | Laparoscopic gastric imbrication | ‐ | 15 | N/A | 12 | 80 | 3 years |
| Laparoscopic sleeve gastrectomy | ‐ | 15 | N/A | 14 | 93.3 | ||
| total: | ‐ | 30 | N/A | 26 | 86.7 | ||
| (22) Vix 2013 | Laparoscopic Roux‐en‐Y gastric bypass | 45 | N/A | 44 | 97.8 | 1 year | |
| Laparoscopic sleeve gastrectomy | 55 | N/A | 48 | 87.3 | |||
| total: | 410 | 100 | N/A | 92e | 92 | ||
| Grand total | All surgical interventions | 1496 | |||||
| All non‐surgical comparators | 302 | ||||||
| All surgical interventions and non‐surgical comparators | 1798 | ||||||
"‐" denotes not reported
aNine patients with band removal excluded from analysis at 10 years (therefore 13 patients included at 10 years)
bData for missing patients were included in the ITT analysis using multiple imputation (statistical method specified)
cAuthors state that 225 patients were randomised, but 8 patients were excluded after randomisation
dTrial is ongoing, presented results were based on an interim analysis
eVix 2013 reported 8 were lost to follow‐up (1 laparoscopic Roux‐en‐Y gastric bypass, 7 laparoscopic sleeve gastrectomy) but also reported one per group was lost to follow‐up. Data extracted here are from first statement.
ITT: intention‐to‐treat; N/A: not applicable
Dealing with duplicate publications and companion papers
In the case of duplicate publications and companion papers of a primary study, we tried to maximise yield of information by simultaneous evaluation of all available data. In cases of differences, the original publication was given priority.
Assessment of risk of bias in included studies
For this update, two review authors (two of KP, GF, EL, JC) assessed the risk of bias of each included study independently. Disagreements were resolved by consensus, or by consultation with a third party.
Risk of bias was assessed using The Cochrane Collaboration's tool (Higgins 2011a; Higgins 2011b). The following criteria were used.
-
Random sequence generation (selection bias).
-
Allocation concealment (selection bias).
-
Blinding of outcome assessors (detection bias),
-
Blinding of participants on subjective outcomes (performance bias)
-
Incomplete outcome data for weight loss, quality of life (QoL), comorbidity (attrition bias).
-
Selective reporting (reporting bias).
-
Other bias.
The assessment of blinding of participants (performance bias) was made on studies reporting self‐reported outcomes (e.g. health‐related quality of life measures). Detection bias (blinding of outcome assessors) was assessed on any type of outcome. Attrition bias (incomplete outcome data) was evaluated for weight loss, health‐related QoL and comorbidity outcomes separately.
'Risk of bias' criteria were judged as 'low risk', 'high risk' or 'unclear risk' and individual bias items were evaluated as described in the Cochrane Handbook for Systematic Reviews of Interventions (Higgins 2011a). A 'Risk of bias' summary and a 'Risk of bias' graph are presented.
Measures of treatment effect
We expressed dichotomous data as risk ratios (RRs) with 95% confidence intervals (CIs). We expressed continuous data as mean differences (MD) with 95% CI.
Unit of analysis issues
We took into account the level at which randomisation occurred, such as cross‐over trials, cluster‐randomised trials (although none was identified) and multiple observations for the same outcome.
Dealing with missing data
We obtained relevant missing data from authors, if feasible, and evaluated important numerical data such as screened, eligible, randomised patients as well as intention‐to‐treat (ITT), as‐treated and per‐protocol (PP) populations. We investigated attrition rates, for example drop‐outs, losses to follow‐up and withdrawals, and critically appraised issues of missing data and imputation methods (e.g. last observation carried forward (LOCF)).
Assessment of heterogeneity
In the event of substantial clinical, methodological or statistical heterogeneity, we did not report study results as meta‐analytically pooled effect estimates.
We identified heterogeneity by visual inspection of the forest plots and by using a standard Chi2 test with a significance level of α = 0.1, in view of the low power of this test. We examined heterogeneity using the I2 statistic, which quantifies inconsistency across studies to assess the impact of heterogeneity on the meta‐analysis (Higgins 2002; Higgins 2003), where an I2 statistic of 75% or more indicates a considerable level of inconsistency (Higgins 2011a).
When we found heterogeneity, we attempted to determine potential reasons for it by examining individual study and subgroup characteristics.
We expected the following characteristics to introduce clinical heterogeneity.
-
Baseline BMI.
-
Presence of comorbidities at baseline.
Assessment of reporting biases
In cases of 10 studies or more for a given outcome, we intended to use funnel plots to assess small‐study effects. Due to several explanations for funnel plot asymmetry, we planned to interpret results carefully (Sterne 2011).
Data synthesis
Unless there was good evidence for homogeneous effects across studies, we planned primarily to summarise low‐risk of bias data by means of a random‐effects model (Wood 2008). In addition, we planned to perform statistical analyses according to the statistical guidelines referenced in the latest version of the Cochrane Handbook for Systematic Reviews of Interventions (Higgins 2011a).
Subgroup analysis and investigation of heterogeneity
We planned to carry out the following subgroup analysis where data allowed.
-
Obese (BMI 30 to 40), morbidly obese (BMI 40 to 50) or superobese (BMI greater than 50).
-
Sex.
-
Length of follow‐up: 12 to 24 months, 25 to 36 months, 37 to 48 months, 49 months or greater.
-
Type of surgical procedure.
Sensitivity analysis
We planned to perform sensitivity analyses in order to explore the influence of the following factors on effect sizes.
-
Restricting the analysis to published studies.
-
Restricting the analysis taking into account risk of bias, as specified at Assessment of risk of bias in included studies.
-
Restricting the analysis to very long or large studies to establish how much they dominate the results.
-
Restricting the analysis to studies using the following filters: diagnostic criteria, language of publication, source of funding (industry versus other), country.
We also planned to test the robustness of the results by repeating the analysis using different measures of effect size (RR, odds ratio (OR) etc.) and different statistical models (fixed‐effect and random‐effects models).
Results
Description of studies
Results of the search
Searches have been conducted for four previous versions of this review of bariatric surgery (Clegg 2002; Colquitt 2003; Colquitt 2005; Colquitt 2009); each version differs in the studies included as the review has evolved. In the 2009 version of the review there were 26 included studies. Three of these studies were non‐RCTs and have now been excluded from the review. Furthermore, 18 RCTs included in the 2009 version of the review that examined biliopancreatic diversion without duodenal switch, vertical banded gastroplasty, banded gastric bypass, or compared open versus laparoscopic procedures have been excluded from the review on advice from our expert advisory group, as these procedures and open surgery are no longer commonly used (see Differences between protocol and review). Five of the 26 studies included in the previous version are therefore included in the current review.
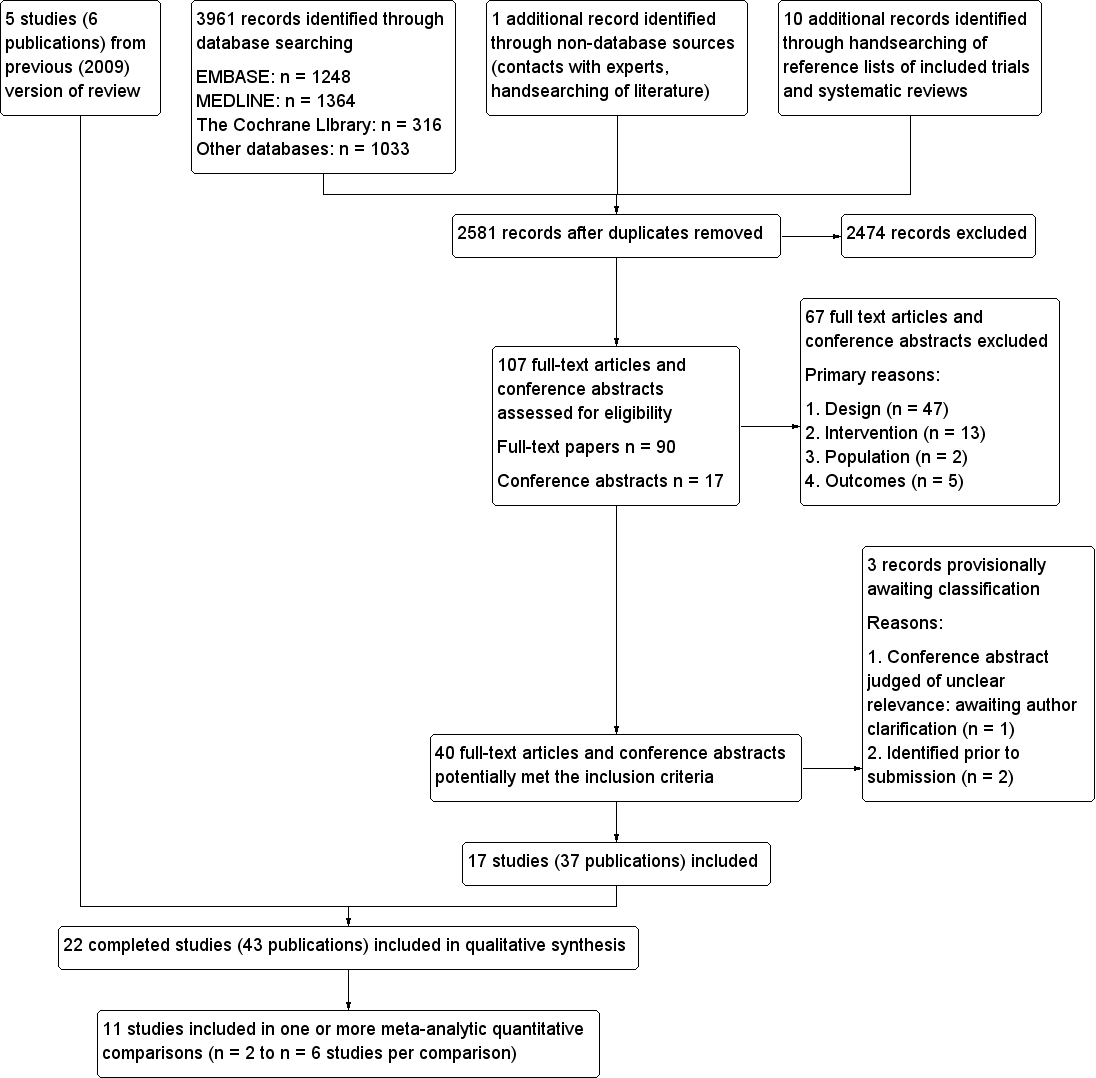
Update searches in November 2013 identified 2581 bibliographic records after removal of duplicates, of which 2474 were excluded and 107 full‐text articles and conference abstracts were retrieved for detailed examination. Of the 107 publications examined in detail, 67 were excluded and a further three abstracts are awaiting classification. The remaining 37 publications reported 17 RCTs which met the inclusion criteria (see Figure 1). Together with the five RCTs (reported in six publications) from the previous versions of the review, a total of 22 RCTs reported in 43 publications were therefore included.
Study flow diagram
Ongoing studies
Twelve RCTs which appear to meet the review's inclusion criteria were identified as being in progress at November 2013. The anticipated completion dates range from August 2013 (NCT01073020) to September 2021 (NCT01501201). Although the NCT01073020 study was due to be completed during 2013, it is considered as ongoing since results have not yet been reported.
Seven of the ongoing studies are recruiting patients with varying degrees of obesity who also have type 2 diabetes (NCT01486680; NCT01821508; NCT01047735; NCT01073020; NCT01778738; NCT01501201; NCT00432809) and one study is specifically excluding patients with diabetes (NCT01581801). Three are recruiting participants with varying degrees of obesity who may have other comorbidities (which may or may not include type 2 diabetes) (NCT01352403; ISRCTN 00786323; NCT01929850). The remaining ongoing study is recruiting obese participants with stage 3‐4 chronic kidney disease (NCT01053130). The NCT01929850 study is notable in that it is restricted specifically to under served minority women.
Of the 12 ongoing trials, four are comparing two different surgical procedures (ISRCTN 00786323; NCT01486680; NCT01778738; NCT01581801); five are comparing a surgical procedure against a non‐surgical procedure (medical therapy or lifestyle intervention) (NCT01352403; NCT01929850; NCT01821508; NCT01053130; NCT01501201) and three (three‐arm) trials are comparing two different surgical procedures and a non‐surgical procedure (NCT01047735; NCT01073020; NCT00432809).
The surgical procedures that are being compared in these RCTs are: laparoscopic sleeve gastrectomy (NCT01486680; NCT01929850; NCT01053130; NCT01581801; NCT00432809); laparoscopic Roux‐en‐Y gastric bypass (NCT01486680; NCT01047735; NCT01073020; NCT01581801; NCT01501201; NCT00432809); laparoscopic adjustable gastric banding (ISRCTN 00786323; NCT01047735; NCT01073020); laparoscopic gastric bypass (ISRCTN 00786323); Roux‐en‐Y gastric bypass (NCT01821508); gastric bypass (NCT01778738) and sleeve gastrectomy (NCT01778738).
Included studies
Participants
Of the studies that reported the participant inclusion criteria (Himpens 2006 did not report criteria),10 limited inclusion to participants with morbid obesity (Aasheim 2009; Demerdash 2013; Hedberg 2012; Mingrone 2012; Nguyen 2009; Nogués 2010; Paluszkiewicz 2012; Peterli 2012; Sharma 2013; Vix 2013). Where morbid obesity was described further, a definition of BMI greater than 40 was commonly used, often with the additional criterion of BMI greater than 35 or 37 with comorbid disease. Two of these studies focused on the upper end of the obesity continuum. Hedberg 2012 required participants to have a BMI greater than 48 and Aasheim 2009 included those with super‐obesity (BMI 50 to 60). Five further studies included participants with both obesity and morbid obesity (Angrisani 2007; Dixon 2012; Keidar 2013; Liang 2013; Praveen Raj 2012). Angrisani 2007 included participants with BMI greater than 35 and an upper limit of BMI of 50; Praveen Raj 2012 included participants with a BMI of greater than 37 or 32 with comorbid disease; Dixon 2012 included participants with a BMI of 35 to 55; Keidar 2013 included people with BMI greater than 35 and type 2 diabetes; and Liang 2013 included people with BMI greater than 28 and type 2 diabetes. Three other studies focused on the lower end of the obesity continuum. O'Brien 2006 included participants with a BMI of 30 to 35 and identifiable comorbidities. Dixon 2008 and Ikramuddin 2013 limited inclusion to people diagnosed with type 2 diabetes and a BMI of 30 to 40. A further two studies had lower BMI inclusion limits of 27 to 43 (Schauer 2012) and greater than 25 but less than 35 (Lee 2011). In both these studies, inclusion was also limited to participants with type 2 diabetes.
The individual study sample size ranged from 15 (Nogués 2010) to 250 (Nguyen 2009). The majority of participants in the studies were female in all but four studies (Dixon 2012 42%; Hedberg 2012 47%; Liang 2013 31%; Keidar 2013 46% female) and mean age ranged from 34 years in Karamanakos 2008 to 51 years in Liang 2013. Excluding the seven studies with inclusion criteria that focused on the upper and lower ends of the obesity continuum (Aasheim 2009; Dixon 2008; Hedberg 2012; Ikramuddin 2013; Lee 2011; O'Brien 2006; Schauer 2012), mean baseline BMI ranged from 37 in Himpens 2006 to 49 in Praveen Raj 2012. Mean baseline BMI in the study focusing on mild to moderate obesity was 34 in each group (O'Brien 2006), and was 37 in each group in one study focusing on type 2 diabetes (Dixon 2008) and 35 in the other study (Ikramuddin 2013). In the two studies with the lowest BMI inclusion criteria, the mean baseline BMI was 30 in Lee 2011 and 36 to 37 in each group in Schauer 2012. Hedberg 2012 focused on those with BMI greater than 48 and the mean BMI was 55 in each group of the study. In the study focusing on those with super obesity (BMI 50 to 60) (Aasheim 2009), the mean BMI in the included participants was 55 in both groups.
Baseline characteristics were similar between groups in most of the studies. There were some differences between groups at baseline in six studies (Aasheim 2009; Karamanakos 2008; Mingrone 2012; Nguyen 2009; Nogués 2010; Praveen Raj 2012; see Characteristics of included studies, Appendix 3 and Appendix 4).
Interventions
The included studies compared a variety of interventions, which are summarised in Characteristics of included studies and Appendix 2. Although these studies have been grouped according to the type of surgery for the purposes of this systematic review, there may be variations in surgical technique or procedure within the groupings. Seven RCTs compared surgery with non‐surgical interventions. The remaining RCTs compared different surgical procedures, including various types of gastric bypass, adjustable gastric banding, sleeve gastrectomy biliopancreatic diversion with duodenal switch, duodenojejunal bypass with sleeve gastrectomy, and gastric imbrication, performed with open or laparoscopic surgery. Gastric bypass (usually Roux‐en‐Y gastric bypass) and laparoscopic sleeve gastrectomy were the most commonly investigated procedures and formed the majority of the evidence base.
Outcomes
Several different measures of weight change were reported by the studies including BMI, weight loss, and excess weight loss. Some of the studies did not report measures of variability such as confidence intervals or standard deviations.
Health‐related quality of life was reported by five studies (Aasheim 2009; Dixon 2012; Nguyen 2009; O'Brien 2006; Peterli 2012) and comorbidities were reported by all but four studies (Demerdash 2013; Nguyen 2009; Sharma 2013; Vix 2013). A summary of outcomes reported by the included studies can be seen in Appendix 5.
Follow‐up
The minimum duration of follow‐up for inclusion in this review was 12 months, and most studies followed participants for 12, 24 or 36 months. The studies with the longest follow‐up periods were Hedberg 2012 (median of four years), Nguyen 2009 (mean of 4.2 years and 3.6 years in each group for the complications outcomes) and Angrisani 2007 (10 years). Some studies did not follow all participants for the reported length of time.
Country
Three studies were conducted in Australia (Dixon 2008; Dixon 2012; O'Brien 2006) and two studies were conducted in each of Sweden (Aasheim 2009 [also in Norway]; Hedberg 2012) USA (Nguyen 2009; Schauer 2012) and Italy (Angrisani 2007; Mingrone 2012). One study was conducted in each of Greece (Karamanakos 2008), Spain (Nogués 2010), Taiwan (Lee 2011), Belgium (Himpens 2006), India (Praveen Raj 2012), Switzerland (Peterli 2012), Poland (Paluszkiewicz 2012), China (Liang 2013), Egypt (Demerdash 2013), France (Vix 2013), India (Sharma 2013), and Israel (Keidar 2013). One study was conducted both in Taiwan and the USA (Ikramuddin 2013).
Excluded studies
After examination of 107 full‐text articles and conference abstracts, 67 were excluded. The publications were often excluded for more than one reason, but the most common reason for exclusion (in 47 of the 67 excluded publications) was that the study design did not meet the specified inclusion criteria (see Figure 1).
Studies awaiting classification
An eligibility decision could not be reached for one reference (see Characteristics of studies awaiting classification). This was a conference abstract comparing laparoscopic adjustable gastric banding against Roux‐en‐Y gastric bypass (Dadan 2011). It appeared to be potentially eligible for inclusion in the review, but was judged to be ‘unclear’ during the full text inclusion screening as it provided insufficient information for a judgement to be made. Authors have been contacted to obtain further information, and the status of this abstract will be reconsidered if sufficient information becomes available. Two additional relevant studies published only as abstracts were identified prior to submission of this updated review (Cesana 2013; Darabi 2013). Full details will be obtained and included in the next update of this review.
Risk of bias in included studies
A summary of review authors' judgements about risk of bias for the included RCTs can be seen in Figure 2 and Figure 3.
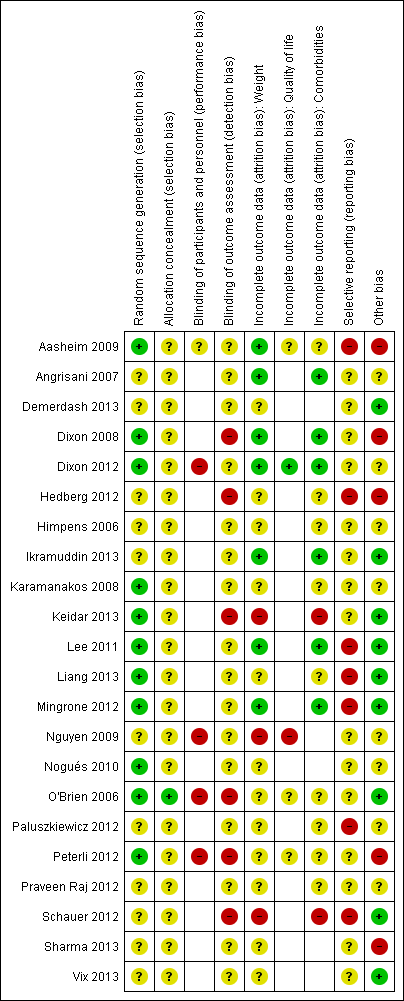
'Risk of bias' summary (blank cells indicate that the study did not report that particular outcome)
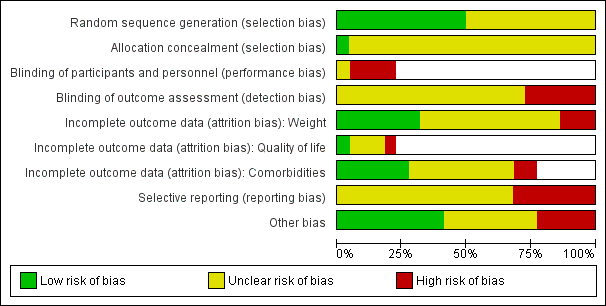
'Risk of bias' graph (blank cells indicate that the particular outcome was not investigated in some studies)
Allocation
Eleven RCTs described adequate allocation sequence generation (Aasheim 2009; Dixon 2008; Dixon 2012; Karamanakos 2008; Keidar 2013; Lee 2011; Liang 2013; Mingrone 2012; Nogués 2010; O'Brien 2006; Peterli 2012), and one had adequate concealment of allocation (O'Brien 2006). The method of allocation sequence generation and concealment was not reported by the remaining studies, therefore they were judged to be of uncertain risk of bias.
Blinding
Five RCTs assessed outcomes self‐reported by participants. In four of these studies participants were not blinded to the intervention received (Dixon 2012; Nguyen 2009; O'Brien 2006; Peterli 2012), and in one study blinding of participants was not reported or unclear (Aasheim 2009).
Only one RCT reported that outcome assessors were blinded to the intervention assignment, but as no details were given about the blinding method or whether it may have been broken, this was judged to be of unclear risk of bias (Karamanakos 2008). Outcome assessors were not blinded to the intervention assignments in six RCTs (Dixon 2008; Hedberg 2012; Keidar 2013; O'Brien 2006; Peterli 2012; Schauer 2012), therefore they were judged to be at high risk of bias. This information was not reported by the remaining RCTs.
Incomplete outcome data
Incomplete outcome data for weight loss were adequately addressed by seven RCTs (Aasheim 2009; Angrisani 2007; Dixon 2008; Dixon 2012; Ikramuddin 2013; Lee 2011; Mingrone 2012). Of the remaining 15 RCTs, 12 were judged to be at uncertain risk of bias and three at high risk of bias (Keidar 2013; Nguyen 2009; Schauer 2012).
Five RCTs assessed quality of life (Aasheim 2009; Dixon 2012; Nguyen 2009; O'Brien 2006; Peterli 2012). One RCT adequately addressed incomplete outcome data (Dixon 2012), three others were judged to be at uncertain risk of bias and one at high risk of bias (Nguyen 2009).
Comorbidities were assessed by 17 RCTs. Incomplete outcome data for co‐morbidities were adequately addressed by six studies (Angrisani 2007; Dixon 2008; Dixon 2012; Ikramuddin 2013; Lee 2011; Mingrone 2012). Two RCTs were judged to be at high risk of bias (Keidar 2013; Schauer 2012) but the remaining nine studies were judged to be of uncertain risk of bias (Aasheim 2009; Hedberg 2012; Himpens 2006; Karamanakos 2008; Liang 2013; O'Brien 2006; Paluszkiewicz 2012; Peterli 2012; Praveen Raj 2012).
Selective reporting
Seven studies (Aasheim 2009; Hedberg 2012; Lee 2011; Liang 2013; Mingrone 2012; Paluszkiewicz 2012; Schauer 2012) were judged not to be free of selective outcome reporting. The remaining studies were judged to be of uncertain risk of reporting bias.
Other potential sources of bias
Five RCTs were judged to be at high risk of bias from other potential sources (Aasheim 2009; Dixon 2008; Hedberg 2012; Peterli 2012; Sharma 2013). One used block randomisation in an unblinded trial (with either fixed block sizes or no reported details), which can mean it is possible to predict future assignments (Dixon 2008). Aasheim 2009 was judged to be at high risk of bias as the surgeons and multidisciplinary treatment teams were more experienced in one procedure (laparoscopic Roux‐en‐Y gastric bypass) than the other procedure (laparoscopic biliopancreatic diversion with duodenal switch), which may have impacted their results. Also, responses to a questionnaire item in a related publication were re‐categorised post‐hoc during analysis. Hedberg 2012 was judged to be at high risk of bias because the required sample size was not achieved due to patients declining randomisation because of their own preferences. Instead, an interim analysis of 47 patients showed significant differences between the two groups and the inclusion was stopped. It was also stated that for both groups after initial evaluations, abnormalities were treated before surgery. Peterli 2012 was judged to be at high risk of bias because the results presented were from an interim analysis that was not based on all the patients randomised. Sharma 2013 was judged to be at high risk of bias as the surgeons were reported as being less skilled in one of the interventions. No evidence bias from other sources was detected in nine RCTs (Demerdash 2013; Ikramuddin 2013; Keidar 2013; Lee 2011; Liang 2013; Mingrone 2012; O'Brien 2006; Schauer 2012; Vix 2013). The remaining RCTs were judged to be of uncertain risk of other potential sources of bias, because there was insufficient rationale or evidence that an identified problem will introduce bias.
Effects of interventions
See: Summary of findings for the main comparison Surgery compared with no surgery for obesity; Summary of findings 2 Laparoscopic gastric bypass compared with laparoscopic adjustable gastric banding for obesity; Summary of findings 3 Laparoscopic Roux‐en‐Y gastric bypass compared with laparoscopic sleeve gastrectomy for obesity; Summary of findings 4 Gastric bypass versus biliopancreatic diversion with duodenal switch (laparoscopic or open) for obesity; Summary of findings 5 Laparoscopic gastric bypass compared with laparoscopic duodenojejunal bypass with sleeve gastrectomy for obesity; Summary of findings 6 Laparoscopic adjustable gastric banding compared with laparoscopic isolated sleeve gastrectomy for obesity; Summary of findings 7 Laparaoscopic gastric imbrication compared with laparoscopic sleeve gastrectomy for obesity
1. Surgery versus non‐surgical interventions
Seven RCTs compared surgery with non‐surgical interventions; however, the participants, types of surgery and the comparators differed between the studies. Two RCTs (Dixon 2008; Dixon 2012) compared laparoscopic adjustable gastric banding with a conventional therapy group. One RCT (O'Brien 2006) compared laparoscopic adjustable gastric banding with an intensive medical programme. One RCT (Mingrone 2012) compared gastric bypass with medical therapy (a third arm in this RCT comprised biliopancreatic diversion without duodenal switch but this is not considered in the present review as it did not meet the inclusion criteria). Three RCTs compared laparoscopic Roux‐en‐Y gastric bypass to different non‐surgical interventions. One (Schauer 2012) included three arms and compared laparoscopic Roux‐en‐Y gastric bypass plus medical therapy, laparoscopic sleeve gastrectomy plus medical therapy, and medical therapy alone. One (Ikramuddin 2013) compared laparoscopic Roux‐en‐Y gastric bypass and a lifestyle programme with medical management versus the lifestyle programme with medical management alone. The final RCT (Liang 2013), included three arms and compared laparoscopic Roux‐en‐Y gastric bypass with usual care (diet, exercise and biochemical goals), and usual care with a pharmacological treatment (exenatide). For a summary of finding of major outcomes see summary of findings Table for the main comparison.
Primary outcomes
Measures of weight change, fat content or fat distribution
Meta‐analysis of weight loss outcomes for surgery versus non‐surgical interventions was considered inappropriate since the RCTs differed in the characteristics of their participants, interventions and comparators. Instead, outcomes are synthesised narratively below. Where data permit, mean differences (MD) in outcomes between surgery and non‐surgical study groups are displayed in forest plots.
Compared with non‐surgical interventions, surgery had a consistent effect on each of the outcome measures related to weight, regardless of the type of procedure. This can be seen in the data tables and forest plots as summarised in the bullet points here. A more detailed narrative description of each of the trials is also presented below.
-
The absolute mean BMI at follow‐up was reported by all seven RCTs, after one year (Ikramuddin 2013; Liang 2013; O'Brien 2006; Schauer 2012), 18 months (O'Brien 2006) and two years (Dixon 2008; Dixon 2012; Mingrone 2012; O'Brien 2006) (data are displayed in Analysis 1.1). In all seven RCTs the mean BMI was lower following surgery than following the non‐surgery therapy, however, statistical significance was not reported by Dixon 2008 or Dixon 2012. Five of these RCTs (Ikramuddin 2013; Liang 2013; Mingrone 2012; O'Brien 2006; Schauer 2012) provided sufficient data to display in a forest plot (Analysis 1.2). For Liang 2013, the comparison between the surgery versus usual care arm is displayed. The evidence was of moderate quality (GRADE).
-
Four of the RCTs reported mean BMI reduction after one year (Schauer 2012) or after two years (Dixon 2008; Dixon 2012; Mingrone 2012) (data are displayed in Analysis 1.3). In all these RCTs, BMI was reduced to a greater degree following the surgical intervention than the non‐surgical therapy. However, statistical analysis of the differences between groups was only reported by Schauer 2012 (P < 0.001 for each surgical procedure compared to medical therapy alone).
-
Absolute weight in kilograms at follow‐up was reported by four RCTs after one year (Ikramuddin 2013, O'Brien 2006; Schauer 2012), 18 months (O'Brien 2006) and two years (Dixon 2012; O'Brien 2006) (data are displayed in Analysis 1.4 and in a forest plot Analysis 1.5). In all four RCTs, weight was statistically significantly lower following surgery than the non‐surgical therapy (P < 0.001 for all comparisons or demonstrated by 95% confidence intervals (CI)).
-
Three RCTs reported weight loss in kilograms, after one year (Schauer 2012) or two years (Dixon 2008; Dixon 2012) (data are displayed in Analysis 1.6 and in a forest plot Analysis 1.7). In all three RCTs weight loss was statistically significantly greater following surgery than non‐surgical therapy (P < 0.001 for all comparisons).
-
Five RCTs reported weight change as the percentage of initial weight loss, after 12 months (Ikramuddin 2013) or after two years of follow‐up (Dixon 2008; Dixon 2012; Mingrone 2012; O'Brien 2006) (data are displayed in Analysis 1.8 and in a forest plot Analysis 1.9). Percentage of initial weight loss was consistently higher in the surgical intervention group than in the non‐surgical therapy group, with the differences being statistically significant (P < 0.001 for all comparisons), where reported.
-
Four RCTs reported weight change as the percentage of excess weight loss, after one year (O'Brien 2006; Schauer 2012) and two years (Dixon 2008; Mingrone 2012; O'Brien 2006) (data are displayed in Analysis 1.10). Percentage of excess weight loss was consistently higher in the surgical intervention groups than in the non‐surgical therapy groups, with the differences being statistically significant (P < 0.001 for all comparisons where reported). Two of these RCTs (Mingrone 2012; O'Brien 2006) provided sufficient data to display in a forest plot (Analysis 1.11).
-
Six of the RCTs reported information on other changes related to weight (data are displayed in Analysis 1.12). The outcomes included waist circumference (Dixon 2008; Dixon 2012; Ikramuddin 2013; Mingrone 2012; Schauer 2012), waist‐hip ratio (Dixon 2008; Schauer 2012), neck circumference (Dixon 2012), and the proportion of patients achieving excess weight loss or achieving satisfactory weight loss (O'Brien 2006). Most outcome measures favoured surgery, with statistically significant differences where reported. The exception to this was waist to hip ratio at 12 months (laparoscopic Roux‐en‐Y gastric bypass versus no surgery, P = 0.12, Schauer 2012) and change in neck circumference at two years (Dixon 2012).
The following paragraphs provide a more detailed description of the trials summarised above.
In a comparison of laparoscopic adjustable gastric banding with non‐surgical interventions in people with a BMI ranging from 30 to 35 and identifiable co‐morbidities, O'Brien 2006 reported a statistically significant (P < 0.001) difference in the weight of participants at 12, 18 and 24 months. While people in the laparoscopic adjustable gastric banding group consistently lost weight during the two‐year follow‐up, those in the non‐surgical group increased in weight, despite an initial loss of weight at six months. The differences in weight change were reflected in their respective BMIs, with statistically significant (P < 0.001) differences beyond the six‐month follow‐up. Participants in the laparoscopic adjustable gastric banding group experienced a decrease in their BMI from 33.7 at baseline to 26.4 at two years compared with a decrease from a BMI of 33.5 at baseline to 31.5 at two years for those in the non‐surgical group. By two years people receiving laparoscopic adjustable gastric banding had lost 87.2% of excess weight, statistically significantly (P < 0.001) more than the 21.8% lost by people in the non‐surgical group. Of those people with laparoscopic adjustable gastric banding, 98% had achieved a satisfactory weight loss (greater than 25% of excess weight loss) at two years, compared to 35% of people in the non‐surgical group.
Dixon 2008, who assessed the effectiveness of laparoscopic adjustable gastric banding and conventional therapy on obese people (BMI 30 to 40) diagnosed with type 2 diabetes at two years follow‐up, found a statistically significantly (P < 0.001) greater mean percentage weight loss following laparoscopic adjustable gastric banding (20.0%) compared with conventional therapy (1.4%). This equated to a statistically significant (P < 0.001) difference in mean weight loss with those receiving laparoscopic adjustable gastric banding losing an additional 19.6 kg. The change in weight resulted in a reduction in the mean BMI for people in the laparoscopic adjustable gastric banding group from 36.9 to 29.5, while those in the conventional therapy group declined from a BMI of 37.1 to 36.6. Dixon 2008 reported that the loss of weight represented a loss of 62.5% of excess weight (using BMI 25 as ideal weight) for people with the laparoscopic adjustable gastric banding and 4.3% for people receiving conventional therapy. Similar benefits were noted on measures of waist circumference and waist‐hip ratio for those in the laparoscopic adjustable gastric banding group compared to the conventional therapy group.
In a comparison of laparoscopic adjustable gastric banding with a conventional weight‐loss programme in obese people (BMI 35 to 55) who had a confirmed diagnosis of obstructive sleep apnoea, Dixon 2012 reported a statistically significant difference in weight loss (kg) at two years, in favour of laparoscopic adjustable gastric banding (P < 0.001). The proportion of weight lost at two years was also seen to be statistically significantly different between the two groups, in favour of surgery (P < 0.001). BMI at two years was reported for the two study groups but no statistical analyses were presented for this outcome. Similarly, waist circumference and neck circumference values at two years were reported. The change in waist circumference between the two groups was seen to favour laparoscopic adjustable gastric banding (P = 0.01) at two years, however. The change in neck circumference between the two groups was not statistically significantly different (P = 0.10).
Ikramuddin 2013 compared laparoscopic Roux‐en‐Y gastric bypass and a lifestyle programme with medical management versus the lifestyle programme with medical management alone in obese people (BMI 30 to 39.9) with type 2 diabetes and inadequate glycaemic control. The study found a BMI difference at 12 months follow‐up of ‐5.5 kg/m2 (95% CI ‐6.8 to ‐4.2) favouring the surgical intervention. There was also lower weight, a greater proportion of weight change and a lower waist circumference at 12 months in those undergoing the surgical intervention compared with the lifestyle programme.
In a three‐arm RCT, Liang 2013 compared laparoscopic Roux‐en‐Y gastric bypass with a usual care group and a usual care plus exenatide in those with a BMI greater than 28 together with type 2 diabetes and hypertension. At 12 months, gastric bypass led to a statistically significantly lower BMI than usual care (P < 0.01); gastric bypass also led to a statistically significantly lower BMI at 12 months compared with usual care and exenatide (P < 0.05), although the difference was smaller. No other weight‐related outcomes were reported in this RCT.
In a three‐arm RCT, Mingrone 2012 compared both gastric bypass and biliopancreatic diversion with a medical therapy group in those with a BMI of 35 or more and with type 2 diabetes (the biliopancreatic diversion arm was excluded from this review). In this trial, gastric bypass was found to result in a statistically significantly (P < 0.001) greater percentage of weight loss and excess weight loss, and waist circumference was lower at two years than those treated with medical therapy only. This was similarly reflected in the participants’ BMI, which was statistically significantly lower in the gastric surgery group (mean 29.3) compared to the medical therapy group (mean 43.1) (P < 0.001). Changes from baseline values were also presented for BMI and waist circumference but these were not analysed statistically.
Schauer 2012 compared both intensive medical therapy plus laparoscopic Roux‐en‐Y gastric bypass, and intensive medical therapy plus laparoscopic sleeve gastrectomy, against intensive medical therapy alone in participants with type 2 diabetes and a BMI of 27 to 43. In this RCT, both surgical procedures resulted in statistically significant greater weight loss at 12 months than medical therapy alone on all the measures used (change in weight in kilograms, BMI, waist circumference, waist‐hip ratio and percentage of excess weight lost).
Health‐related quality of life
Two of the seven RCTs that compared surgical and non‐surgical interventions reported validated measures of health‐related quality of life (Dixon 2012; O'Brien 2006). The quality of the evidence was moderate.
O'Brien 2006 compared short form health survey (SF‐36) domain scores at two years follow‐up for people undergoing laparoscopic adjustable gastric banding and non‐surgical therapy (Analysis 1.13). Statistically significantly higher scores were reported for five of the eight domains for laparoscopic adjustable gastric banding compared to the non‐surgical group.
Dixon 2012 also reported outcomes at two years on the SF‐36, reporting both the individual domains and the component summary scores (Analysis 1.13). Statistically significant greater improvements from baseline SF‐36 scores were reported for two (role‐physical, general health) of the eight domains for laparoscopic adjustable gastric banding compared to the conventional weight‐loss programme. On the physical component score a statistically significant difference in improvement between groups was seen in favour of laparoscopic adjustable gastric banding (P = 0.04); however, on the mental component summary score there was no statistically significant difference between the two treatment groups (P = 0.92).
Obesity‐related comorbidities
All seven of the RCTs that compared surgical and non‐surgical interventions reported effects of the interventions on comorbidities, although the types of comorbidities reported differed between the RCTs. Meta‐analysis of comorbidity outcomes was not feasible due to differences between the RCTs in the way comorbidity outcomes were reported. Instead, comorbidity outcomes are summarised narratively below.
Five of the RCTs reported diabetes‐related outcomes (patients with diabetes remission, diabetes medication or specified levels of glycosylated haemoglobin) (Dixon 2008; Ikramuddin 2013; Liang 2013; Mingrone 2012; Schauer 2012) (data are displayed in Analysis 1.14). The quality of the evidence was moderate. Each of these trials specifically included participants who had type 2 diabetes at baseline. Dixon 2008 reported that remission of type 2 diabetes after two years was statistically significantly (P < 0.001) higher following laparoscopic adjustable gastric banding (73%) than conventional therapy (13%) (RR 5.5; 95% CI 2.2 to 14.00). At two years follow‐up a greater proportion of those receiving laparoscopic adjustable gastric banding no longer required diabetes medication compared to conventional therapy (change from baseline 83% versus 15%, respectively, not tested for statistical significance). There were similar improvements from baseline to two years follow‐up for those in the laparoscopic adjustable gastric banding group compared to the conventional therapy group in their use of metformin (86.3% versus 30.8%), other hypoglycaemics (27.6% versus 3.2%), and insulin (3.4% versus 11.5%), although these differences between the groups were also not tested for statistical significance. Ikramuddin 2013 reported that at 12 months, 44% of those in the laparoscopic Roux‐en‐Y gastric bypass group had a glycosylated haemoglobin level of < 6% compared with 9% in the lifestyle programme with medical management group (see Analysis 1.14 for details). The proportion with a glycosylated haemoglobin level < 7% at 12 months was also greater in the surgically treated group than those treated with the lifestyle programme (75% versus 32% respectively, see Analysis 1.14). Liang 2013 reported a greater proportion of people with diabetes remission in the laparoscopic Roux‐en‐Y gastric bypass group (90%) than the usual care group (0%) or usual care and exenatide therapy group (0%). Mingrone 2012 reported that after two years, 75% of those in the gastric bypass group but none of those in the medical therapy group were classed as having a diabetes remission (P < 0.001). All participants in the gastric bypass group discontinued pharmacological treatment for diabetes within 15 days, although it is unclear if this analysis is based on the intention‐to‐treat (ITT) population. Schauer 2012 reported that proportionally more participants in the laparoscopic Roux‐en‐Y gastric bypass plus intensive medical therapy and laparoscopic sleeve gastrectomy plus intensive medical therapy groups achieved a glycosylated haemoglobin level of ≤ 6% at 12 months than patients in the intensive medical therapy alone group (42%, 37% and 12%, respectively; P = 0.002 for gastric bypass versus medical therapy alone; P = 0.008 for sleeve gastrectomy versus medical therapy alone). Proportionally more patients in the surgery groups than in the medical therapy alone group achieved a glycosylated haemoglobin level of ≤ 6% and also were not using any diabetes medications (42%, 27% and none, respectively; P < 0.001 for gastric bypass versus medical therapy alone and for sleeve gastrectomy versus medical therapy alone). A higher proportion of patients in the gastric bypass and sleeve gastrectomy groups were taking no diabetes medications than in the medical therapy alone group (78%, 51% and none, respectively; P < 0.05 for gastric bypass versus medical therapy alone and for sleeve gastrectomy versus medical therapy alone).
Two RCTs reported use of hypertension medication (Dixon 2008; Mingrone 2012) (data are displayed in Analysis 1.15). Dixon 2008 reported improvements from baseline to two years follow‐up for those in the laparoscopic adjustable gastric banding group compared to the conventional therapy group in their use of anti‐hypertensives (49.3% versus 0%) although these differences between the groups were not tested for statistical significance. Mingrone 2012 reported that the proportions of participants with a reduction/discontinuation of antihypertensive therapies were 80% in the laparoscopic adjustable gastric banding group and 70% in the conventional therapy group, but no analyses were undertaken on these data. Ikramuddin 2013 found no difference in the proportion of people with systolic blood pressure < 130 mmgHg (odds ratio (OR) 1.7, 95% CI 0.6 to 4.6).
Four RCTs reported on the metabolic syndrome, although definitions of this differed (Dixon 2008; Dixon 2012; O'Brien 2006; Schauer 2012) (data are displayed in Analysis 1.16). Dixon 2008 reported that a greater proportion of people undergoing laparoscopic adjustable gastric banding than conventional therapy did not have metabolic syndrome after two years (70% versus 13%, P < 0.001). Dixon 2012 reported that after two years the proportion of participants who had metabolic syndrome relative to those with metabolic syndrome at baseline was lower (53%) in the laparoscopic adjustable gastric banding group than the conventional therapy group (92%), with the changes from baseline (‐47% and ‐8% respectively) differing significantly between the groups (P = 0.005). O'Brien 2006 reported that both study groups had a similar proportion of patients with metabolic syndrome at baseline (37.5%), but after two years the proportion with metabolic syndrome differed significantly between the groups, being 2.7% in the laparoscopic adjustable gastric banding group and 24% in the intensive medical programme group (P = 0.006). Schauer 2012 found that after one year, a higher proportion of patients in the gastric bypass and sleeve gastrectomy groups than in the medical therapy alone group experienced a resolution of metabolic syndrome (65.2%, 58.7% and 35.1%, respectively; P = 0.01 for gastric bypass versus medical therapy alone and P = 0.03 for sleeve gastrectomy versus medical therapy alone).
Two RCTs reported lipid normalisation or use of lipid medication (Dixon 2008; Mingrone 2012) (data are displayed in Analysis 1.17). Dixon 2008 reported improvements from baseline to two years follow‐up for those in the laparoscopic adjustable gastric banding group compared to the conventional therapy group in their use of lipid‐lowering agents (27.6% versus 3.9%) although the difference between the groups was not tested for statistical significance. Mingrone 2012 reported that the proportion of participants with normalisation of lipids after two years was significantly higher in the gastric bypass group than the medical therapy group, for total cholesterol (100% versus 27.3%; P < 0.001), high density lipoprotein (HDL) cholesterol (100% versus 11.1%; P < 0.005) and triglycerides (85.7% versus 0%; P < 0.001). Ikramuddin 2013 reported no difference in the proportion with low density lipoprotein (LDL) cholesterol < 100 mg/dL at 12 months (OR 1.6, 95% CI 0.7 to 3.8).
One RCT reported the effects of the interventions on sleep (Dixon 2012) (data are displayed in Analysis 1.18). Dixon 2012 compared laparoscopic adjustable gastric banding with conventional weight‐loss therapy in obese people with sleep apnoea. The proportion of participants that achieved a diagnosis of ‘mild’ obstructive sleep apnoea after two years was statistically significantly higher in those treated with laparoscopic adjustable gastric banding (27%) compared with conventional therapy (7%) (P = 0.04). One participant in the conventional therapy group and none in the laparoscopic adjustable gastric banding group achieved remission of sleep apnoea. The proportion who were adherent to continuous positive airway pressure after two years was also reported but did not differ significantly between the study groups.
Secondary outcomes
Adverse events, mortality and revision rates
All seven of the RCTs that compared surgical and non‐surgical interventions reported complications and additional operative procedures, although these were defined differently in each RCT, precluding meta‐analysis. A narrative summary of each study is provided below.
Dixon 2008 reported several adverse events among people in the laparoscopic adjustable gastric banding group (n = 30), including a superficial wound infection (one patient), gastric pouch enlargement requiring revisional surgery (two patients), eating difficulties and persistent regurgitation requiring band removal (one patient), post‐operative febrile episode (one patient), minor hypoglycaemic episode (one patient), and gastrointestinal tract intolerance to metformin (one patient). People in the conventional therapy group (n = 30) suffered minor adverse events associated with their medication which resolved following discontinuation of treatment, including gastrointestinal problems (two patients), persistent diarrhoea with metformin (one patient), and vasculitic rash (one patient). Other adverse events included multiple hypoglycaemic episodes (one patient), angina and a transient cerebral ischaemic episode requiring admission to hospital (one patient) and intolerance to very low‐calorie meal replacement (two patients). Dixon 2008 noted that the mean procedure time for placement of the laparoscopic adjustable gastric banding was 54 minutes and that 80% of patients were kept in hospital for only one day.
Dixon 2012 reported the number of participants with adverse events, serious adverse events and minor adverse events, and the total number of adverse events, serious adverse events and minor adverse events for those in the laparoscopic adjustable gastric banding group and the conventional weight‐loss programme group, although rates were not compared statistically. There were 14 people with adverse events in total in the laparoscopic adjustable gastric banding group and 13 in the conventional weight‐loss programme group. Frequency of serious adverse events was the same (17%) in both treatment groups, with five events being recorded in each of the two groups. Serious events in the surgically treated group were cholecystitis with pancreatitis, pouch dilation requiring repositioning, pneumonia, severe headaches and strangulated umbilical hernia. Serious adverse events in the conventional therapy group were acute abdomen, asthma, cardiac and renal failure, angina and peri‐anal abscess and fistula. Minor adverse events were experienced by 40% of the participants in the laparoscopic adjustable gastric banding group compared with 30% of participants in the conventional therapy group. There were no deaths in either group. Five participants in each group were hospitalised during follow‐up.
Ikramuddin 2013 reported there were four early serious adverse events in the laparoscopic Roux‐en‐Y gastric bypass group but no events in the lifestyle programme group. The events were two anastomotic leaks, one wound infection and one wound hernia. There were six late complications of surgery, including stricture (n = 2) and small bowel obstruction (n = 2). In total, there were 22 serious adverse events in the surgical group compared with 15 in the non‐surgical group. Revisional surgery was undertaken on one patient in the surgical intervention group but there were no conversions to other surgical interventions for weight loss. Selected minor adverse events related to diabetes or the procedure were reported to be higher in the surgical group than the non‐surgical group although this was not tested for statistical significance (45 versus 18 for the two groups respectively). Iron deficiency was observed in 13 (22%) of those treated with gastric bypass and vitamin D deficiency in 4 (7%). In people in the lifestyle programme there were no cases of iron deficiency and 5 (8%) cases of vitamin D deficiency. No deaths occurred.
Few data are reported on complications and adverse events in the study by Liang 2013 where it is reported that there were no serious adverse events or deaths in any of the three treatment groups.
Mingrone 2012 reported no operative deaths from gastric bypass, and reported low numbers of late complications (three in the gastric bypass group). Two participants in the medical therapy group had persistent diarrhoea associated with metformin use.
O'Brien 2006 found a higher proportion of adverse events among those people in the non‐surgical therapy group (58%, n = 31) than in the laparoscopic adjustable gastric banding group (18%, n = 39). For those receiving non‐surgical therapy the most common adverse events were intolerance to orlistat (26%), acute cholecystitis (13%), the need for operative interventions (13%) and intolerance to very low calorie diet (3%). Adverse events reported by people in the laparoscopic adjustable gastric banding group included operative interventions (13%), laparoscopic revision (prolapse or posterior) (10%), 5 mm port site infection (2.6%), and acute cholecystitis (2.6%). Loss to follow‐up was higher in the non‐surgical group (16%) compared to laparoscopic adjustable gastric banding group (2.6%) (but reasons not given).
In the RCT that compared laparoscopic Roux‐en‐Y gastric bypass and laparoscopic sleeve gastrectomy (each in addition to intensive medical therapy) with intensive medical therapy alone in patients with type 2 diabetes and a BMI of 27 to 43 (Schauer 2012), there were no deaths in any group. Proportionally more patients who underwent gastric bypass (22%, n = 11) were hospitalised due to a serious adverse event than patients who underwent sleeve gastrectomy (8%, n = 4) or medical therapy alone (9%, n = 4). More patients in the gastric bypass group (n = 3) than in the sleeve gastrectomy (n = 1) and medical therapy alone (n = 0) groups also underwent reoperation. However, proportionally more patients who underwent sleeve gastrectomy (80%, n = 39) and medical therapy alone (81%, n = 35) had a hypoglycaemic episode during the 12 months following surgery than patients who underwent gastric bypass (56%, n = 28) (P values not reported).
2. Comparisons of different surgical procedures: laparoscopic gastric bypass versus laparoscopic adjustable gastric banding
Three RCTs (Angrisani 2007; Demerdash 2013; Nguyen 2009) compared laparoscopic Roux‐en‐Y gastric bypass with laparoscopic adjustable gastric banding. The Demerdash 2013 study had follow‐up of 12 months with a sample size of 34 participants. Two of the studies were relatively long‐term studies; Angrisani 2007 reported five year outcomes for 51 participants and 10‐year outcomes for 34 of these, and the Nguyen 2009 study randomised 250 participants and had four years follow‐up. It should be noted that in the Nguyen 2009 RCT, the proportion of drop‐outs immediately after randomisation was relatively large (11% to 31%) and unbalanced across the study groups, leading us to classify this study as being at high risk of attrition bias, whilst the Angrisani 2007 and Demerdash 2013 RCTs were classified as being mostly at unclear risk of bias. The percentage excess weight lost was specified as the primary, powered outcome in the RCT by Nguyen 2009. The Angrisani 2007 and Demerdash 2013 RCTs did not report whether any outcomes were powered statistically nor whether any outcomes were designated as primary. For a summary of finding of major outcomes see summary of findings Table 2.
Primary outcomes
Measures of weight change, fat content or fat distribution
BMI showed a consistent pattern in all three RCTs, being lower in the laparoscopic Roux‐en‐Y gastric bypass group at all the follow‐up assessments, despite the pre‐surgery BMI having initially been higher in the laparoscopic Roux‐en‐Y gastric bypass group than the LAGB group in the Nguyen 2009 RCT (data are displayed in Analysis 2.1). When these trials were pooled in a meta‐analysis, the mean end‐of‐study BMI was lower following laparoscopic Roux‐en‐Y gastric bypass compared with laparoscopic adjustable gastric banding (MD ‐5.2 kg/m² (95% CI ‐6.4 to ‐4.0); P < 0.00001; 265 participants; 3 trials; moderate quality evidence; Analysis 2.2). No statistical heterogeneity was evident (Chi² = 0.18, P = 0.91, I2 = 0%).
Only the Angrisani 2007 RCT reported patients’ mean weight at follow‐up and this was lower in the laparoscopic Roux‐en‐Y gastric bypass group than the laparoscopic adjustable gastric banding group at all follow‐up assessments (P < 0.001 at five years, and P = 0.002 at 10 years, data are displayed in Analysis 2.3).
In two RCTs (Angrisani 2007; Nguyen 2009) the percentage excess weight loss was consistently larger in the laparoscopic Roux‐en‐Y gastric bypass group than the laparoscopic adjustable gastric banding group at all follow‐up assessments (data are displayed in Analysis 2.4). When these trials were combined in a meta‐analysis, mean end‐of‐study percentage excess weight lost was significantly higher following laparoscopic Roux‐en‐Y gastric bypass compared with laparoscopic adjustable gastric banding (MD 23.0% (95% CI 13.6 to 32.5) ; P < 0.00001; 135 participants; 2 trials; Analysis 2.5). No statistical heterogeneity was evident (Chi² = 0.00, P = 0.99, I2 = 0%).
Two RCTs (Angrisani 2007; Nguyen 2009) were consistent in reporting that the proportion of patients who experienced failure of weight‐loss treatment was lower in the laparoscopic Roux‐en‐Y gastric bypass group than the laparoscopic adjustable gastric banding group (statistical significance was reported only by Angrisani 2007 (P < 0.001)), although the RCTs each used different definitions of treatment failure (the need for conversion to another bariatric procedure due to failure of weight loss, or having less than 20% excess weight loss (Nguyen 2009); or having a BMI > 35 at five‐year follow‐up Angrisani 2007) (data are displayed in Analysis 2.6). Demerdash 2013 reported that the proportion of body weight decreased at 12 months was greater in the laparoscopic Roux‐en‐Y gastric bypass group than the laparoscopic adjustable gastric banding group (P = 0.025).
Health‐related quality of life
Health‐related quality of life was assessed only in the Nguyen 2009 RCT. The SF‐36 instrument was employed but only limited results were presented and this outcome was considered at high risk of bias due to incomplete reporting. The only relevant information reported was that all the eight domains of the SF‐36 that were assessed at 12 months post‐surgery had scores comparable to US norms in both study groups. The quality of the evidence was very low.
Obesity‐related comorbidities
The Nguyen 2009 and Demerdash 2013 RCTs did not specifically assess the impact of the two procedures on weight‐related comorbidities. In the Angrisani 2007 RCT, baseline rates of comorbidities were low with two participants in the laparoscopic Roux‐en‐Y gastric bypass group having hyperlipidaemia, one hypertension, and one type 2 diabetes. In the laparoscopic adjustable gastric banding group, three participants had hypertension and one sleep apnoea at baseline. The authors reported that after five years there was resolution of the diabetes, and hyperlipidaemia (in the laparoscopic Roux‐en‐Y gastric bypass group) and sleep apnoea (in the laparoscopic adjustable gastric banding group), and those that were followed up after 10 years (5 of 8) were still in remission. The quality of the evidence for diabetes was very low.
Secondary outcomes
Adverse events, mortality and revision rates
Two of the RCTs (Angrisani 2007; Nguyen 2009) that compared laparoscopic gastric bypass against laparoscopic adjustable gastric banding reported complications and additional operative procedures, although these were defined differently in each RCT, precluding meta‐analysis. A narrative summary of each study is provided below.
One death was reported in the Nguyen 2009 RCT eight months after surgery in the laparoscopic Roux‐en‐Y gastric bypass group, but was not considered related to the bariatric treatment. No deaths occurred during the Angrisani 2007 RCT.
Both RCTs reported that mean length of hospital stay was significantly longer in the laparoscopic Roux‐en‐Y gastric bypass group than the laparoscopic adjustable gastric banding group (4 versus 2 days, P < 0.05, Angrisani 2007; and 3.1 versus 1.5 days, P < 0.01, Nguyen 2009). The proportion of patients requiring intensive care unit stay was reported only by Nguyen 2009 (2.7% in the laparoscopic Roux‐en‐Y gastric bypass group compared to 1.2% in the laparoscopic adjustable gastric banding group; difference not statistically significant), whilst Angrisani 2007 mentioned that a patient in the laparoscopic Roux‐en‐Y gastric bypass group required an intensive care unit stay of 40 days. In the Nguyen 2009 RCT, the proportion of patients requiring reoperations within 30 days was larger in the laparoscopic Roux‐en‐Y gastric bypass group (5.4% compared to 1.2%) whilst the proportion requiring late reoperations was smaller in the laparoscopic Roux‐en‐Y gastric bypass group (7.2% compared to 11.6%) (differences not statistically significant; P ≥ 0.05). In the Angrisani 2007 RCT the proportions of patients requiring reoperations were 28.6% (6 patients) in the laparoscopic Roux‐en‐Y gastric bypass group (cholecystectomy (4), internal hernia (1), incisional hernia (1)), and 40.9% (9 patients) in the laparoscopic adjustable gastric banding group (all band removal: 4 due to unsatisfactory weight loss and had other bariatric procedures (2 Roux‐en‐Y gastric bypass, 2 biliopancreatic diversion); 5 had no further procedures, 1 for band erosion 3 for pouch dilation, 1 for untreatable reflux symptoms)) (Appendix 9). Nguyen 2009 reported that in the laparoscopic Roux‐en‐Y gastric bypass group 6 readmissions were required within 30 days after surgery compared to none in the laparoscopic adjustable gastric banding group (P = 0.04).
Complications were classified in the Nguyen 2009 RCT in four groups according to time (early/late) and severity (major/minor) (Appendix 8). Overall, there were significantly more complications in the laparoscopic Roux‐en‐Y gastric bypass group than the laparoscopic adjustable gastric banding group (45% versus 17.4%; P < 0.01), with the differences being statistically significant for early minor complications (15.3% versus 4.7%; P = 0.02), late minor complications (13.5% versus 0%; P < 0.01), and late major complications (26.1% versus 11.6%; P = 0.01) (group differences for early major complications were not significant; P ≥ 0.05). The most frequent early major complication was gastrointestinal obstruction (laparoscopic Roux‐en‐Y gastric bypass 3.6% versus laparoscopic adjustable gastric banding 1.2%) whilst the most frequent late major complication was anastomotic stricture, which affected only laparoscopic Roux‐en‐Y gastric bypass patients (15.3%). The most frequent of the minor complications were early wound infection and late marginal ulcer, which occurred only in the laparoscopic Roux‐en‐Y gastric bypass group and affected 6.3% and 8.1% of the patients respectively.
Two (8.4%) early complications requiring surgery were reported by Angrisani 2007 in the laparoscopic Roux‐en‐Y gastric bypass group (one posterior pouch leak intraoperatively causing conversion to open surgery, one sepsis caused by jejunal perforation (sutured and intestine resected). No early complications requiring surgery were noted in the laparoscopic adjustable gastric banding group.
3. Comparisons of different surgical procedures: gastric bypass versus sleeve gastrectomy
Eight trials are discussed in this section. Six RCTs (Karamanakos 2008; Keidar 2013; Nogués 2010; Peterli 2012; Schauer 2012;Vix 2013) compared laparoscopic Roux‐en‐Y gastric bypass with laparoscopic sleeve gastrectomy, one RCT (Paluszkiewicz 2012) compared open Roux‐en‐Y gastric bypass with laparoscopic sleeve gastrectomy and one RCT (Lee 2011) compared simplified laparoscopic mini‐gastric bypass with duodenum exclusion against laparoscopic sleeve gastrectomy without duodenum exclusion. Two studies included participants with lower BMIs than the other studies. Schauer 2012 limited inclusion to patients with BMI 27 to 43 and type 2 diabetes, however the mean BMIs at baseline (Appendix 3) in this study suggest the majority of participants were obese.The study by Lee 2011 included patients with a BMI of between 25 to 35 and poorly controlled type 2 diabetes. Due to differences in the surgical procedures and participants, Lee 2011 is considered separately below and not combined in the meta‐analyses. When interpreting the findings of these studies it should be kept in mind that the sample sizes were relatively small in the laparoscopic Roux‐en‐Y gastric bypass versus laparoscopic sleeve gastrectomy comparisons by Nogués 2010 (7 to 8 participants per group), and that the Peterli 2012 study was considered to be at high risk of bias since the outcomes reported were from an interim analysis that was not based on all patients randomised in an ongoing trial. The trial by Keidar 2013 was assessed as being of high risk of detection bias (outcome assessors not blinded to treatment), and attrition bias (higher rates of drop‐out in one arm) for weight and comorbidity outcomes. Only one of these studies specified that they were powered statistically for weight or BMI outcomes (Peterli 2012). For a summary of finding of major outcomes see summary of findings Table 3.
Primary outcomes
Measures of weight change, fat content or fat distribution
Six of the seven RCTs that compared laparoscopic Roux‐en‐Y gastric bypass against laparoscopic sleeve gastrectomy (Karamanakos 2008; Keidar 2013; Nogués 2010; Peterli 2012; Schauer 2012) or open Roux‐en‐Y gastric bypass against laparoscopic sleeve gastrectomy (Paluszkiewicz 2012) reported BMI at one or three years after surgery (data are displayed in Analysis 3.1). Results from Karamanakos 2008; Keidar 2013 and Paluszkiewicz 2012 favoured sleeve gastrectomy, whilst the other trials favoured gastric bypass. However, differences were statistically significant in only one of the studies, with BMI 4.3 units lower in the laparoscopic Roux‐en‐Y gastric bypass group one year after surgery (P = 0.01, Nogués 2010). Overall, mean BMI at study end was non‐significantly lower following gastric bypass compared with sleeve gastrectomy: MD ‐0.2 kg/m² (95% CI ‐1.8 to 1.3); P = 0.78; 353 participants; 6 trials; low quality evidence; Analysis 3.2. Substantial statistical heterogeneity was present (Chi2 = 14.60, P = 0.001, I2 = 66%).
Two trials (Nogués 2010; Schauer 2012) reported a greater reduction in BMI following gastric bypass, but this was statistically significant in only one of these trials (P = 0.03; Analysis 3.3). The pooled mean BMI reduction at 12 months was non‐significantly greater following laparoscopic Roux‐en‐Y gastric bypass compared with laparoscopic sleeve gastrectomy (MD 1.8 kg/m² (95% CI ‐0.34 to 3.93); P = 0.10; 114 participants; 2 trials; Analysis 3.4). Although some statistical heterogeneity was present (Chi2 = 1.55, P = 0.21, I2 = 35%), the direction of the effect was consistent in these two trials.
Five studies (Keidar 2013;Nogués 2010; Peterli 2012; Schauer 2012;Paluszkiewicz 2012) reported the final weight one year after surgery, and one study also reported it at two and three years after surgery (Peterli 2012) (data are displayed in Analysis 3.5). None of these studies found that the final weight differed significantly between Roux‐en‐Y gastric bypass and sleeve gastrectomy at any time point. There was no statistically significant difference in pooled end of study mean weight: MD 1.2 kg/m² (95% CI ‐2.0 to 4.5); P = 0.46; 293 participants; five trials Analysis 3.6. No statistical heterogeneity was present (Chi2 = ,3.72 P = 0.45, I2 = 0%).
Three of the studies reported absolute weight loss one year after surgery (Karamanakos 2008; Nogués 2010; Schauer 2012). Weight loss ranged from 29.4 to 45.3 kg in the laparoscopic Roux‐en‐Y gastric bypass group and 25.1 to 43.6 kg in the sleeve gastrectomy group (data are displayed in Analysis 3.7). In Nogués 2010 mean weight loss after one year was significantly greater in the Roux‐en‐Y gastric bypass group by 13 kg (P = 0.015), however mean pre‐operative weight was already significantly higher in the Roux‐en‐Y gastric bypass group by 7.8 kg (P = 0.025). The pooled mean weight loss after one year was non‐significantly greater following Roux‐en‐Y gastric bypass compared with sleeve gastrectomy: MD 4.1 kg/m² (95% CI ‐3.31 to 11.49); 146 participants; 3 trials; Analysis 3.8. Considerable statistical heterogeneity was present (Chi2 = 8.23, P = 0.02, I2 = 76%).
The percentage excess weight lost was reported by five RCTs (Analysis 3.9), two of which reported non‐statistically significant results favouring gastric bypass (Paluszkiewicz 2012; Schauer 2012). Two trials reported results favouring sleeve gastrectomy (Karamanakos 2008; Vix 2013), one of which reported non‐statistically significant results (Vix 2013) and the remaining trial found greater percentage excess weight loss following sleeve gastrectomy that approached statistical significance at 1 and 2 years post‐surgery (P = 0.05). By three years the difference was not statistically significant (P = 0.13, Karamanakos 2008).
The excess percentage of BMI lost was reported in three studies and did not differ significantly between the study groups, either at one year (Peterli 2012; Vix 2013), two years (Peterli 2012), or three years post‐surgery (Karamanakos 2008; Peterli 2012) (data are displayed in Analysis 3.10). Paluszkiewicz 2012 and Karamanakos 2008 reported no statistically significant difference in the proportion of patients with greater than 50% excess weight loss at 12 months (Analysis 3.10). The same outcome was reported for two years and three years post‐surgery in the Karamanakos 2008 study where results were also not statistically significant. Other outcomes reported in these studies include percentage body fat, percentage fat mass, percentage fat‐free mass and waist circumference at 12 months (Keidar 2013) and waist circumference and waist‐ hip ratio at 12 months (Schauer 2012). Results can be seen in Analysis 3.10.
Lee 2011 examined the weight‐loss effects of simplified laparoscopic mini‐gastric bypass with duodenum exclusion compared to laparoscopic sleeve gastrectomy without duodenum exclusion at 12 months after surgery among patients with a BMI of > 25 to < 35 and who had poorly controlled type 2 diabetes. At 12 months, the mini‐gastric bypass group had a statistically significant lower mean BMI (22.8 (standard deviation (SD) 2.2) versus 24.4 (SD 2.4); P = 0.009; Analysis 3.1), lower mean weight (60.7 kg (SD 10.1 kg) versus 65.7 kg (SD 7.9 kg); P = 0.03; Analysis 3.5), greater mean percentage of weight loss (23.3% versus 19.9%, P = 0.02; Analysis 3.10), and smaller waist circumference (79.7 cm (SD 7.4 cm) versus 85.3 cm (SD 5.7 cm); P = 0.002) (Analysis 3.10) than the sleeve gastrectomy group. The mean percentage of excess weight loss was higher in the mini‐gastric bypass group than the laparoscopic sleeve gastrectomy group, but this difference was not statistically significant (94.4% (SD 33.1) versus 76.3% (SD 38.9), P = 0.06) (Analysis 3.9).
Health‐related quality of life
Only one of the RCTs that compared gastric bypass with sleeve gastrectomy reported health‐related quality of life outcomes (Peterli 2012). In their interim analysis, Peterli 2012 found that health‐related quality of life, assessed using the Gastrointestinal Quality of Life Index (GIQLI), did not statistically significantly differ between groups one year after surgery (data are displayed in Analysis 3.11). The quality of the evidence was very low.
Obesity‐related comorbidities
Comparisons of comorbidities across these RCTs are limited because the studies tended to report different outcomes. Diabetes‐related outcomes are displayed in Analysis 3.12. Karamanakos 2008 reported the number of cases of diabetes that "resolved" (term used by publication) following surgery. In this study, five patients in each study group had diabetes, and four cases in each group resolved. Keidar 2013 reported the proportion of patients with normal fasting glucose and glycosylated haemoglobin at 12 months, which were reported as 31% in the gastric bypass group and 47% in the sleeve gastrectomy group. The study also reported the proportion with impaired fasting glucose and normal glycosylated haemoglobin, the use of oral hypoglycaemic medication and insulin (see Analysis 3.12). No analysis of statistical differences between groups were reported for any of these outcomes. Nogués 2010 reported normalisation of insulin resistance in patients who fulfilled criteria for insulin resistance at baseline and also withdrawal of diabetic medication among a subgroup of patients who had diabetes at baseline, but neither of these outcomes differed notably between the study groups (no statistical analysis was reported). Peterli 2012 found no statistically significant differences between interventions (P ≥ 0.05) in the proportion of patients who discontinued medication for type 2 diabetes (67.9% versus 57.7%, respectively) or experienced diabetes improvement (28.6% versus 42.3%, respectively). Paluszkiewicz 2012 also reported no statistically significant difference in the proportion of people who had type 2 diabetes at baseline and experienced resolution at 12 months (gastric bypass: 9 of 14 (64.3%) versus sleeve gastrectomy: 4 of 10 (40%)). Schauer 2012, who limited inclusion to people with type 2 diabetes, reported the proportion of people with HbA1c 6% or below and found that this did not differ between groups. The proportion of participants taking no diabetes medications at 12 months appeared to be higher in the laparoscopic Roux‐en‐Y gastric bypass group compared with the laparoscopic sleeve gastrectomy group but no P value was reported. The quality of the evidence for diabetes was low.
Three RCTs reported resolution or improvement of hypertension at 12 months (Paluszkiewicz 2012; Peterli 2012) or at three years (Karamanakos 2008). However, none of these outcomes differed significantly between the Roux‐en‐Y gastric bypass and sleeve gastrectomy groups (data are displayed in Analysis 3.13).
Four RCTs reported outcomes related to dyslipidaemia (data are displayed in Analysis 3.14). The outcomes included resolution or improvement of high‐density lipoprotein and triglycerides three years after surgery relative to pre‐specified thresholds (Karamanakos 2008), resolution of dyslipidaemia at 12 months (Paluszkiewicz 2012), improvement or cure of dyslipidaemia after one year (Peterli 2012) and abnormal triglycerides at 12 months (Vix 2013). The frequency of resolution of dyslipidaemia after 12 months was statistically significantly higher following laparoscopic Roux‐en‐Y gastric bypass (41.9%) than following laparoscopic sleeve gastrectomy (16.1%) (P < 0.05, Paluszkiewicz 2012), but none of the other lipidaemia‐related outcomes differed significantly between the study groups.
One RCT reported metabolic syndrome (data are displayed in Analysis 3.15). The proportion with resolution of metabolic syndrome after one year did not differ statistically significantly between the study groups (Schauer 2012).
Two RCTs reported obstructive sleep apnoea (data are displayed in Analysis 3.16). The proportions of patients experiencing resolution or improvement after one year did not differ significantly between the laparoscopic Roux‐en‐Y gastric bypass and laparoscopic sleeve gastrectomy study groups in either of the two RCTs (Karamanakos 2008; Peterli 2012).
Other co‐morbidities that were reported in the RCTs were the frequency of resolution, improvement or new onset of gastro‐oesophageal reflux disease (Karamanakos 2008; Peterli 2012), improvement or cure of back/joint pain, hyperuricaemia, and depression (Peterli 2012), and resolution or improvement of degenerative arthritis and menstrual irregularities (Karamanakos 2008) (data are displayed in Analysis 3.17). Among these outcomes, only one differed significantly between the study groups: Peterli 2012 found that proportionally more patients who underwent laparoscopic Roux‐en‐Y gastric bypass than laparoscopic sleeve gastrectomy experienced remission or improvement in existing pre‐operative gastro‐oesophageal reflux disease (76.5% versus 50%; P = 0.008). Karamanakos 2008, however, found no difference in this outcome, with resolution or improvement occurring in all patients in both groups.
All of the patients in Lee 2011 had poorly controlled type 2 diabetes and the aim of the trial was to examine the effects of simplified laparoscopic mini‐gastric bypass with duodenum exclusion compared with laparoscopic sleeve gastrectomy without duodenum exclusion in treating type 2 diabetes. The primary outcome was the proportion of patients who achieved remission of type 2 diabetes. Nearly all the patients who underwent gastric bypass achieved remission (93%) compared to 47% of patients who underwent laparoscopic sleeve gastrectomy (P = 0.02). Successful treatment of diabetes (for definition see Analysis 3.12) was achieved in significantly more participants in the gastric bypass group (57%) than the sleeve gastrectomy group (0%) (P < 0.001). Furthermore, proportionally fewer patients in the gastric bypass group than in the sleeve gastrectomy group had metabolic syndrome at 12 months (6.6% (n = 2) versus 60.0% (n = 18), P < 0.001) (Analysis 3.15). However, the authors did not report the proportion of patients in each group with metabolic syndrome at baseline, so it is unclear whether or not this difference was due to the surgical procedures or baseline imbalances between groups.
Secondary outcomes
Adverse events, mortality and revision rates
Four of the six RCTs that compared laparoscopic Roux‐en‐Y gastric bypass against laparoscopic sleeve gastrectomy explicitly reported mortality. Karamanakos 2008, Keidar 2013 and Schauer 2012 stated that no deaths occurred in either group during the study and Peterli 2012 stated that there was one death in the laparoscopic Roux‐en‐Y gastric bypass group and none in the laparoscopic sleeve gastrectomy group.
Four RCTs comparing laparoscopic procedures provided some information about complications and additional operative procedures. Nogués 2010 reported that there were no complications during or after surgery in either study group, with no further details or definitions given.
Karamanakos 2008 reported that there were no conversions to open surgery and no intraoperative and post‐operative complications. Karamanakos 2008 reported that both the laparoscopic Roux‐en‐Y gastric bypass and laparoscopic sleeve gastrectomy groups had the same numbers of early major post‐operative complications (2/30; 7%) and late major post‐operative complications (1/30; 3%) and that neither group experienced any dysphagia or obstruction at any time or required any conversions from laparoscopic to open surgery. The early major complications that occurred were intestinal obstruction and enterocutaneous fistula in the laparoscopic Roux‐en‐Y gastric bypass group (both revised by open surgery); and, in the laparoscopic sleeve gastrectomy group, gastric obstruction (revised by reoperation and supplemental gastric resection) and leakage at the cardio‐oesophageal junction (managed with intravenous (IV) antibiotics and drainage). The late major complications were ileus obstruction in the laparoscopic Roux‐en‐Y gastric bypass group (managed conservatively) and abdominal abscess in the laparoscopic sleeve gastrectomy group (managed by drainage and antibiotics).
Peterli 2012 reported one surgical conversion in each group and that similar numbers of patients in the laparoscopic Roux‐en‐Y gastric bypass and laparoscopic sleeve gastrectomy groups underwent additional operations (26 (23.6%) versus 36 (33.6%), P = 0.09). Similar proportions of patients in the laparoscopic Roux‐en‐Y gastric bypass and laparoscopic sleeve gastrectomy groups experienced a complication within 30 days of surgery (17.2% versus 8.4%, P = 0.067). Eleven laparoscopic Roux‐en‐Y gastric bypass patients had a major complication compared with two laparoscopic sleeve gastrectomy patients (P value not provided). Five patients in the laparoscopic Roux‐en‐Y gastric bypass group (4.5%) and one patient in the laparoscopic sleeve gastrectomy group had a severe complication requiring reoperation (P = 0.21). Other reported complications one year after surgery in the Peterli 2012 study were severe gastro‐oesophageal reflux disease symptoms (two patients in the laparoscopic sleeve gastrectomy group), anastomotic ulcer at the gastro‐enterostomy (one patient in the laparoscopic Roux‐en‐Y gastric bypass group) and stricture requiring endoscopic dilatation (one patient in the laparoscopic Roux‐en‐Y gastric bypass group). One year after surgery, none of the patients underwent further surgery for insufficient weight loss or internal hernia.
Schauer 2012 reported the proportion of patients with serious adverse events who required hospitalisation (22% following laparoscopic Roux‐en‐Y gastric bypass and 8% following laparoscopic sleeve gastrectomy); the most commonly reported serious adverse events were requirement for intravenous infusion for dehydration, reoperation, blood transfusions, gastro‐intestinal leak and arrhythmias. Other adverse events were also reported, the most common event was a hypoglycaemic episode, which occurred in 56% of participants treated with laparoscopic Roux‐en‐Y gastric bypass and 80% of participants treated with laparoscopic sleeve gastrectomy. No statistical analyses were reported for differences between groups.
Three of the RCTs reported micronutrient deficiencies. In the Peterli 2012 RCT, within one year after surgery, similar proportions of patients in the laparoscopic Roux‐en‐Y gastric bypass and laparoscopic sleeve gastrectomy groups experienced micronutrient deficiency (24.5% versus 26.2%, P value not reported). The authors stated that the most frequent deficiency was vitamin D. Vitamin B12 deficiency occurred in 15 laparoscopic Roux‐en‐Y gastric bypass and 7 laparoscopic sleeve gastrectomy patients (P < 0.12). Karamanakos 2008 also reported the proportions of patients in each group who had a range of nutritional deficiencies three years after surgery. Of these, vitamin B12 deficiency was more frequent in the laparoscopic Roux‐en‐Y gastric bypass group (24%) than the laparoscopic sleeve gastrectomy group (4%), but this difference was not statistically significant (P = 0.05). Vix 2013 reported that the proportion of participants with vitamin D deficiency was lower in those treated with sleeve gastrectomy than those undergoing gastric bypass (48% versus 82% respectively, no P value reported). Baseline rates of vitamin D deficiency were 84.6% and 85.7% for the two groups, respectively.
The single RCT that compared open Roux‐en‐Y gastric bypass against laparoscopic sleeve gastrectomy reported that no deaths occurred in either group during the study (Paluszkiewicz 2012). Both groups had similar lengths of hospital stay (median six days) and frequencies of ‘early morbidity’ (< 30 days after surgery: leak, bleeding, venous thrombosis, wound infection, wound fluid collection) (Roux‐en‐Y gastric bypass 16.6%, laparoscopic sleeve gastrectomy 19.4%). Both groups also had similar overall frequencies of ‘late morbidity’ (≥30 days after surgery: incisional hernia, cholelithiasis, serum iron deficiency, serum vitamin B12 deficiency) (both groups 61.1%). The most notable differences between groups, none of which were statistically significant, were: reoperations were required in two laparoscopic sleeve gastrectomy patients (reasons reported) but not in any Roux‐en‐Y gastric bypass patients; there were three major complications in the laparoscopic sleeve gastrectomy group but none in the Roux‐en‐Y gastric bypass group; and vitamin B12 deficiency affected more patients in the Roux‐en‐Y gastric bypass group (30.6%) than the laparoscopic sleeve gastrectomy group (13.8%).
Lee 2011 reported that there were no deaths in either the simplified laparoscopic mini‐gastric bypass with duodenum exclusion or laparoscopic sleeve gastrectomy without duodenum exclusion groups. One patient in each group experienced a complication that required hospitalisation for “conservative treatment” and three patients in each group (10%) experienced minor complications. There were no major complications among patients who underwent either surgical procedure.
4. Comparisons of different surgical procedures: gastric bypass versus biliopancreatic diversion with duodenal switch (laparoscopic or open)
One RCT (Hedberg 2012) compared open Roux‐en‐Y gastric bypass against open biliopancreatic diversion with duodenal switch in patients with a BMI greater than 48, and another RCT (Aasheim 2009) compared laparoscopic Roux‐en‐Y gastric bypass against laparoscopic biliopancreatic diversion with duodenal switch in patients with a BMI of 50 to 60. Both trials had a high risk of selective reporting and 'other' bias.
Primary outcomes
Measures of weight change, fat content or fat distribution
Mean BMI was lower two years following biliopancreatic diversion with duodenal switch than following Roux‐en‐Y gastric bypass (BMI 30.1 (95% CI 28.5 to 31.7) versus BMI 37.5 (95% CI 36.0 to 39.1)) in Aasheim 2009. Both studies found that biliopancreatic diversion with duodenal switch resulted in a greater BMI reduction than gastric bypass (data are displayed in Analysis 4.2): mean 23.2 (SD 6.9) BMI units versus mean 16.2 (SD 4.9) BMI units at four years, P < 0.001 (Hedberg 2012); and mean 24.8 (95% CI 23.0 to 26.5) versus mean 17.3 (95% CI 15.7 to 19.0) at two years, P < 0.001 (Aasheim 2009), respectively. The pooled end‐of‐study mean BMI loss was statistically significantly lower in the gastric bypass group than the biliopancreatic diversion with duodenal switch group (MD ‐7.3 kg/m² (95% CI ‐9.3 to ‐5.4; P < 0.00001; 107 participants; 2 trials; moderate quality evidence; Analysis 4.3).
Percentage of excess BMI loss was also consistently lower in the gastric bypass group (data are displayed in Analysis 4.4). In the Hedberg 2012 RCT, the mean percentage excess BMI loss after four years was 80% (SD 15%) and 51% (SD 23%) in the biliopancreatic diversion and gastric bypass groups, respectively (P < 0.001). In the Aasheim 2009 RCT, the mean percentage excess BMI loss after one year was 74.8% (SD 11.2%) and 54.4% (SD 12.8%) in the biliopancreatic diversion and gastric bypass groups, respectively (P < 0.001). The end‐of study pooled mean percentage excess BMI loss was statistically significantly lower following gastric bypass than following biliopancreatic diversion with duodenal switch (MD ‐23% (95% CI ‐31 to ‐15); P < 0.00001; 107 participants; 2 trials; Analysis 4.5). Additionally, Hedberg 2012 reported that proportionally fewer patients in the biliopancreatic diversion with duodenal switch group failed to achieve a greater than 50% loss of excess BMI (4.8% versus 40.0%, P < 0.001) (Analysis 4.9).
Of the two RCTs, only Aasheim 2009 reported weight outcomes in kilograms. The absolute weight at one and two years was higher in the gastric bypass group than the biliopancreatic diversion group (statistical analysis of differences between groups not reported, Analysis 4.6). After two years the biliopancreatic diversion group had lost more weight than the gastric bypass group (‐73.5 kg (95% CI ‐79.0 to ‐68.1)) compared to ‐50.6 kg (95% CI ‐55.8 to ‐45.4), P < 0.001) (Analysis 4.7). After two years, the percentage of body weight loss was lower in the gastric bypass group (statistical analysis of differences between groups not reported, Analysis 4.8).
Other outcomes related to weight loss were reported only by Aasheim 2009 (data are displayed in Analysis 4.9). Between baseline and two years, the biliopancreatic diversion with duodenal switch group showed greater mean improvements than the gastric bypass group in waist circumference, hip circumference and sagittal diameter (P < 0.001 for all comparisons). There was no statistically significant difference between the procedures in the percentage of weight lost as fat‐free mass at two years (mean between‐group difference 1.0 percentage points (95% CI ‐2.4 to 4.4); P = 0.54). At two years, none of the patients who underwent biliopancreatic diversion with duodenal switch had a BMI of 40 or more compared to 26% of patients who underwent gastric bypass (P = 0.006).
Health‐related quality of life
Health‐related quality of life was measured in the Aasheim 2009 RCT only, using the Norwegian and Swedish versions of the SF‐36 (data are displayed in Analysis 4.10). The only statistically significant difference between groups in improvement in health‐related quality of life between baseline and two years was that patients who underwent biliopancreatic diversion with duodenal switch reported less improvement in bodily pain than patients who underwent gastric bypass (mean improvement: 8.6 (95% CI ‐2 to 19.2) points versus 28.8 (95% CI 18.9 to 38.8) points, P = 0.003). No statistically significant difference between groups in mean change from baseline on the obesity‐related problems scale was reported by Aasheim 2009 (Analysis 4.11). The quality of the evidence was very low .
Obesity‐related comorbidities
Both RCTs provided limited information on the effects of the weight‐loss interventions on comorbidities related to either diabetes (Hedberg 2012) or sleep (Aasheim 2009). Hedberg 2012 reported that at three years after surgery all patients (100%) in the biliopancreatic diversion with duodenal switch group had an HbA1c level of less than 5% compared to 82% of patients who had undergone gastric bypass (P value not reported) (Analysis 4.12). Medication use was measured in a patient self‐report questionnaire at ≥ 2 years after surgery, but Hedberg 2012 has not reported these data. Aasheim 2009 reported there were no statistically significant differences between the procedures in the number of patients reporting snoring and sleep apnoea symptoms (P > 0.05 for all reported symptoms) at two years (detailed questionnaire data reported but not tabulated here). The authors reported that the numbers of patients in the whole sample using antihypertensive drugs, insulin and lipid‐lowering therapy with statins reduced after surgery, but they did not provide a breakdown of medication use by treatment group. The quality of the evidence for diabetes was very low.
Secondary outcomes
Adverse events, mortality and revision rates
In the Hedberg 2012 RCT using open surgery, there was one death in the biliopancreatic diversion with duodenal switch group, due to pulmonary embolism, and none in the gastric bypass group (P = 0.511) (Appendix 7). Aasheim 2009 reported no deaths in patients undergoing either procedure laparoscopically (Appendix 7). Hedberg 2012 reported that two patients in the biliopancreatic diversion with duodenal switch group and one in the gastric bypass group underwent reoperation (P = 0.516) for suspected perioperative leaks (with negative findings for the patient who underwent gastric bypass). None of the patients in either group received revisional surgery. Aasheim 2009 found that similar numbers of patients in the gastric bypass and biliopancreatic diversion with duodenal switch groups underwent reoperation in the perioperative period of up to 30 days after surgery (two versus one, P = 1.000) and between the end of the perioperative period and one year post‐surgery (none versus three, P = 0.107). Three patients in the gastric bypass compared to seven patients in the biliopancreatic diversion with duodenal switch groups underwent a new surgical procedure between the end of the perioperative period and two years follow‐up, but this difference was not statistically significant (P = 0.155).
Hedberg 2012 reported that in the biliopancreatic diversion with duodenal switch group, one patient (4%) was readmitted to hospital for cholecystitis and three (13%) for incisional hernia repair. In the gastric bypass group, one patient (4%) was readmitted to hospital for abdominal pain and two (9%) for incisional hernia. Aasheim 2009 reported that similar numbers of patients in each group were readmitted to hospital during the perioperative period (4 patients in each group, P = 1.000), and between the end of the perioperative period and two years after surgery (7 patients in the gastric bypass group versus 16 patients in the biliopancreatic diversion with duodenal switch group, P = 0.28).
Surgery complications reported in Hedberg 2012 are shown in Appendix 9. Aasheim 2009 found that the number of patients with complications during the perioperative period or late complications were similar between groups. Aasheim 2009 found that the proportion of patients who experienced adverse events between surgery and two years follow‐up was higher in the biliopancreatic diversion with duodenal switch group than the gastric bypass group (62% (n = 18) versus 32% (n = 10), P = 0.021), with a variety of adverse events reported in each group (see Appendix 10).
5. Comparisons of different surgical procedures: laparoscopic gastric bypass versus laparoscopic duodenojejunal bypass with sleeve gastrectomy
One RCT with an uncertain risk of bias across all domains compared laparoscopic duodenojejunal bypass with sleeve gastrectomy against laparoscopic Roux‐en‐Y gastric bypass (Praveen Raj 2012).
Primary outcomes
Measures of weight change, fat content or fat distribution
At 12 months follow‐up there were no statistically significant differences in BMI (Analysis 5.1), excess weight loss Analysis 5.2), or percentage excess weight loss (Analysis 5.3) between laparoscopic duodenojejunal bypass with sleeve gastrectomy and laparoscopic Roux‐en‐Y gastric bypass. The quality of the evidence was very low.
Health‐related quality of life
Health‐related quality of life was not assessed by Praveen Raj 2012.
Obesity‐related comorbidities
At baseline, 20 (71%) of participants in the laparoscopic duodenojejunal bypass with sleeve gastrectomy group and 16 (55%) in the laparoscopic Roux‐en‐Y gastric bypass group had diabetes. There were no statistically significant differences between groups in the proportion with a ‘complete remission’ or an ‘improvement’ in diabetes (Analysis 5.4). The study appeared to use different criteria for an improvement in diabetes in each arm, which may have a bearing on the results seen. Hypertension was seen in 36% and 41% of participants in the two groups respectively at baseline. There were no statistically significant differences between the two surgical procedures in the proportions of participants in the categories ‘remission’, ‘improvement’ or ‘no improvement’ of hypertension (Analysis 5.4). However, the timing of the assessment of these comorbidities was not stated in the trial publication. (Analysis 5.4). The quality of the evidence for diabetes was very low.
Secondary outcomes
Adverse events, mortality and revision rates
No deaths in either group were reported in the RCT by Praveen Raj 2012. One adverse event was reported in the laparoscopic duodenojejunal bypass with sleeve gastrectomy group only. This was an internal herniation through the retrocolic window one month after surgery. It is unclear if any other adverse events were measured or monitored during the study.
6. Comparisons of different surgical procedures: laparoscopic adjustable gastric banding versus laparoscopic isolated sleeve gastrectomy
One RCT (Himpens 2006) with an uncertain risk of bias across all domains compared laparoscopic adjustable gastric banding with laparoscopic isolated sleeve gastrectomy.
Primary outcomes
Measures of weight change, fat content or fat distribution
Himpens 2006 reported that the reduction in BMI was statistically significantly greater in participants in the laparoscopic isolated sleeve gastrectomy group than the laparoscopic adjustable gastric banding group three years after surgery (27.5 versus 18, P < 0.0004, Analysis 6.1). Weight loss (three years: 29.5 kg versus 17 kg, P < 0.0001, Analysis 6.2) and the proportion of excess weight loss at one year (57.7% versus 41.4%, P = 0.0004) and three years after surgery (66% versus 48%, P = 0.0025) (Analysis 6.3) were also statistically significantly improved in laparoscopic isolated sleeve gastrectomy participants in comparison to the laparoscopic adjustable gastric banding participants. All of these data were presented by the trial authors as medians and ranges, so care should be taken when interpreting the results. The quality of the evidence was very low.
Health‐related quality of life
Quality of life was not assessed by Himpens 2006.
Obesity‐related comorbidities
At baseline, gastro‐oesophageal reflux disease requiring drug therapy with proton pump inhibitors was a problem for 15% (6/40) of the laparoscopic adjustable gastric banding participants and 20% (8/40) of the participants in the laparoscopic isolated sleeve gastrectomy group. After one year, gastro‐oesophageal reflux disease had resolved in 83% and 75% of these participants in the two groups respectively, and this remained the same at three years (statistical significance was not reported) (Analysis 6.4). In those without gastro‐oesophageal reflux disease at baseline, no statistically significant differences in rates of appearance of gastro‐oesophageal reflux disease between the intervention groups were observed at one year (laparoscopic adjustable gastric banding 3/34 (8.8%), versus laparoscopic isolated sleeve gastrectomy 7/32 (21.8%), P = not significant (ns)) or three years [(laparoscopic adjustable gastric banding 7/34 (20.5%) versus laparoscopic isolated sleeve gastrectomy 1/32 (3.1%), P = ns).
Secondary outcomes
Adverse events, mortality and revision rates
No early postoperative complications were seen in the laparoscopic adjustable gastric banding group of the Himpens 2006 RCT. Two participants in the laparoscopic isolated sleeve gastrectomy group (5%) had an early post operative complication; both required revisional surgery and in one this was a total gastrectomy due to gastric ischaemia (Appendix 9). Late complications requiring surgery were observed in the laparoscopic adjustable gastric banding participants, with three pouch dilations (treated with band removal in two and conversion to Roux‐en‐Y gastric bypass in one); one gastric erosion (treated with Roux‐en‐Y gastric bypass) and three disconnections of the port (treated with reconnection). There were no late complications requiring surgery in the laparoscopic isolated sleeve gastrectomy group. Complications not requiring surgery that were observed at one and three years can be seen in Appendix 10. There appeared to be higher frequencies of complications in the laparoscopic adjustable gastric banding group than in the laparoscopic isolated sleeve gastrectomy group but this is based on observation of the data only, as no statistical analysis was undertaken.
In addition, two participants in each group had ‘insufficient weight loss’ noted as a complication in the Himpens 2006 study. The two participants in the laparoscopic adjustable gastric banding group were converted to Roux‐en‐Y gastric bypass and the two participants in the laparoscopic isolated sleeve gastrectomy group were converted to laparoscopic duodenal switch.
7. Comparisons of different surgical procedures: laparoscopic gastric imbrication versus laparoscopic sleeve gastrectomy
One unpublished RCT (Sharma 2013) with a high risk of 'other' bias compared laparoscopic gastric imbrication with laparoscopic sleeve gastrectomy.
Primary outcomes
Measures of weight change, fat content or fat distribution
Sharma 2013 reported that there were no statistically significant differences in mean BMI (Analysis 7.1) or excess weight loss (Analysis 7.2) between those treated with laparoscopic gastric imbrication and those treated with laparoscopic sleeve gastrectomy at 12 months or at 3 years. The quality of the evidence was very low (GRADE).
Health‐related quality of life
Health‐related quality of life was not assessed by Sharma 2013.
Obesity‐related comorbidities
Comorbidities were not reported by Sharma 2013.
Secondary outcomes
Adverse events, mortality and revision rates
No major complications were seen in the laparoscopic sleeve gastrectomy group of the Sharma 2013 trial. In the laparoscopic gastric imbrication group, two (16.7%) of participants had major complications requiring reoperation (Appendix 9), one of which was a conversion to a sleeve gastrectomy (Appendix 9). However, the authors noted that the surgeons were less experienced in this procedure.
Discussion
Summary of main results
Surgery versus non‐surgical interventions
Seven randomised controlled trials (RCTs) (one with a low risk of selection bias and six of uncertain risk of selection bias) were included. Regardless of the surgical intervention used or the type of participants included, all studies found statistically significant benefits on measures of weight change compared with no surgery at one to two years follow‐up. One RCT found more improvement in five of eight domains of the SF‐36 following laparoscopic adjustable gastric banding compared with no surgery, and one other found more improvement in two of the eight domains, but in only one of the two component scores (physical health). The RCTs of people with type 2 diabetes found significantly higher remission of the disease following surgery than conventional therapy or diet only. The effects of surgery on hypertension and lipids were less clear. All four of the RCTs reporting metabolic syndrome found significantly fewer people with the syndrome after surgery. One RCT of people with obstructive sleep apnoea found the proportion who achieved ‘mild’ sleep apnoea at follow‐up was higher in the laparoscopic adjustable gastric banding group than the conventional therapy group. All seven RCTs reported adverse events from surgery (e.g. operative interventions, revisional surgery, port site infection) and from conventional therapy (e.g. intolerance to medication, acute cholecystitis, need for operative intervention, gastrointestinal problems). Adverse events also occurred in the non‐surgery groups.
Comparisons of different surgical procedures
Laparoscopic gastric bypass versus laparoscopic adjustable gastric banding
Three RCTs with uncertain risk of bias compared laparoscopic Roux‐en‐Y gastric bypass against laparoscopic adjustable gastric banding and showed that laparoscopic Roux‐en‐Y gastric bypass achieved significantly greater weight loss and BMI reduction up to five years after surgery compared to laparoscopic adjustable gastric banding. The laparoscopic Roux‐en‐Y gastric bypass procedure resulted in greater duration of hospitalisation and, in one RCT, a greater number of late major complications when compared with laparoscopic adjustable gastric banding. In another RCT, a high proportion of the laparoscopic adjustable gastric banding group required reoperation for band removal. The reliability of outcomes from one of the RCTs may be questionable because relatively large and unbalanced proportions of patients dropped out from each study group after randomisation.
Gastric bypass versus sleeve gastrectomy
Laparoscopic or open Roux‐en‐Y gastric bypass and laparoscopic sleeve gastrectomy all led to losses of weight and/or BMI but the seven included studies did not provide a clear and consistent picture as to which procedure was better or worse for achieving loss of weight or BMI. Overall, no statistically significant difference was found between the procedures. All studies had a high or uncertain risk of bias, generally with small sample sizes, limited duration of follow‐up and other methodological limitations.
Only one of the RCTs that compared Roux‐en‐Y gastric bypass with sleeve gastrectomy reported health‐related quality of life outcomes (Peterli 2012). This study found similar health‐related quality of life scores one year after surgery in both surgical groups. One death occurred in one of the four studies that reported mortality, and this was in the laparoscopic Roux‐en‐Y gastric bypass group (Peterli 2012). Comorbidities, complications and additional surgical procedures were reported in different ways in the different RCTs but they did not differ significantly between the surgery groups, except for improvement in pre‐existing gastro‐oesophageal reflux disease, which improved in proportionally more patients in the laparoscopic Roux‐en‐Y gastric bypass than laparoscopic sleeve gastrectomy group in the Peterli 2012 RCT.
The one RCT (Lee 2011) that compared simplified laparoscopic mini‐gastric bypass with duodenum exclusion against laparoscopic sleeve gastrectomy, found that gastric bypass may be superior to laparoscopic sleeve gastrectomy for weight loss and treating diabetes in patients with type 2 diabetes and a BMI of > 25 to < 35, whilst resulting in similar levels of complications. The risk of attrition bias in this study was judged to be low, but the risk of selection bias was uncertain and the risk of reporting bias was high.
Gastric bypass versus biliopancreatic diversion with duodenal switch
Two RCTs found that biliopancreatic diversion with duodenal switch resulted in greater weight loss than Roux‐en‐Y gastric bypass in people with a very high BMI. Limited comorbidity data were reported. In one RCT, biliopancreatic diversion with duodenal switch was associated with more improvement in HbA1c levels; in the other RCT, patient self‐reported sleep apnoea symptoms were similar between groups at two years. Adverse event rates, however, were higher with biliopancreatic diversion with duodenal switch and patients who underwent this procedure also experienced less improvement in the bodily pain domain of health‐related quality of life two years after surgery than patients who underwent gastric bypass. Hedberg 2012 had a high risk of performance bias, detection bias, reporting bias and other bias. Aasheim 2009 had a high risk of reporting bias and other bias.
Laparoscopic gastric bypass versus laparoscopic duodenojejunal bypass with sleeve gastrectomy
In one small RCT with an uncertain risk of bias, BMI and excess weight loss at 12 months follow‐up were similar between laparoscopic duodenojejunal bypass with sleeve gastrectomy and laparoscopic Roux‐en‐Y gastric bypass. Rates of remission of diabetes and hypertension were also similar between groups.
Laparoscopic adjustable gastric banding versus laparoscopic isolated sleeve gastrectomy
On measures of weight, participants undergoing laparoscopic isolated sleeve gastrectomy showed more improvement than participants undergoing laparoscopic adjustable gastric banding in a single RCT with an uncertain risk of bias. Early complications requiring surgery only occurred in the laparoscopic isolated sleeve gastrectomy group whilst late complications requiring surgery only occurred in the laparoscopic adjustable gastric banding group.
Laparoscopic gastric imbrication versus laparoscopic sleeve gastrectomy
One small unpublished RCT with a high risk of bias found no significant differences in weight‐loss outcomes between laparoscopic gastric imbrication versus laparoscopic sleeve gastrectomy. Health‐related quality of life and comorbidities were not reported.
Overall completeness and applicability of evidence
All 22 RCTs included in this review examined one or more of the currently most commonly performed bariatric surgery procedures in practice: gastric bypass, sleeve gastrectomy and adjustable gastric banding. The majority compared surgical with non‐surgical procedures (seven RCTs) or gastric bypass with sleeve gastrectomy (eight RCTs). The evidence‐base for comparisons of other surgical procedures was more limited, with only one to three RCTs available, making it difficult to draw conclusions about the relative effectiveness of some procedures.
The majority of participants included in the trials were women, and, on average, participants were in their early 30s to early 50s and were morbidly obese. However, greater benefit may occur among younger adults who have a longer period to accrue benefit, if weight loss and effects on comorbidity are maintained. Few studies included participants aged over 60 years so the findings may not be generalisable to older adults. Furthermore, expert opinion indicates the patient populations included in the studies may not fully represent those seen in clinical practice, because many focused on low risk patients, and, until recently in the UK, much surgery was performed on more unwell and generally more obese patients with more advanced complications.
Part of the objective of the review was to examine the effects of bariatric surgery on the control of obesity‐related comorbidities. Eighteen RCTs measured changes in comorbidities post‐surgery, but they differed in the conditions examined. Diabetes‐related outcomes and hypertension were most commonly assessed. However, there was variation in how studies measured and reported outcomes, making it difficult to compare findings. For example, measures of diabetes‐related outcomes included remission or improvement in diabetes or insulin resistance, use of diabetes medications, and the proportion of patients achieving specified HbA1c or fasting plasma glucose levels. Some studies used the term 'resolved' regarding type 2 diabetes (e.g. Angrisani 2007 and Liang 2013), however it should be noted that type 2 diabetes does not 'resolve'; it may go into remission but recurrence is fairly common over time. These studies also did not report the criteria used for defining ‘resolution’, making it uncertain how relevant the results are to clinical practice. Fewer RCTs examined sleep apnoea, metabolic syndrome, dyslipidaemia or normalisation of lipid profiles, gastroesophageal reflux disease (GERD), degenerative arthritis, menstrual irregularities, back or joint pain, hyperuricaemia, or depression, so there is currently only limited evidence for whether or not surgery is effective in treating these conditions. None of the studies examined longer‐term complications of diabetes, which are important treatment outcomes.
Few RCTs assessed the effectiveness of bariatric surgery in treating comorbidities in patients with a lower BMI. There is therefore a lack of evidence for the use of bariatric surgery in treating comorbidities in patients who are overweight or who do not meet standard criteria for bariatric surgery.
Only five of the RCTs included in this review reported any assessment of health‐related quality of life issues. It is therefore difficult to make any judgment about the impact of weight‐loss interventions on the health‐related quality of an obese person’s daily life.
An important question concerning interventions used in managing weight loss is whether the procedure offers a long‐lasting effect. Expert opinion suggests that follow‐up should consider outcomes beyond five years. The follow‐up period in all but one of the studies in this review ranged between one and four years, and was particularly short in the studies comparing surgery versus medical management. Only one study examined outcomes at 10 years post‐surgery (Angrisani 2007). Therefore, the longer‐term impact of surgery on weight loss or comorbidities is unclear. The short duration of the RCTs also meant that the impact of late complications (such as gastric ulcers, stomal stenosis and erosions, and band slippage) and the need for revisional surgery are likely to have been underestimated.
Expert opinion indicates that there are little data on outcomes with optimal treatment of control groups in the studies comparing surgery with non‐surgical interventions. They may therefore overestimate the benefits of surgery.
It was beyond the remit of this research to assess the impact of pre‐and post‐intervention education, counselling and support on the outcomes of the interventions. However, the majority of the studies included in this review did not provide such details which may be important for understanding patient compliance to the lifestyle and diet modifications that are necessary for successful weight‐loss maintenance.
Quality of the evidence
The review identified 22 relevant RCTs that included a total of 1798 participants, with seven RCTs comparing surgery to non‐surgical interventions (618 participants) and 15 RCTs comparing different surgical procedures (1180 participants). Many of the RCTs had an uncertain risk of bias as the reporting was unclear. Just one RCT reported adequate allocation concealment and was therefore at low risk of selection bias. The majority of studies did not mention whether outcomes assessors were blinded to intervention assignments. The reporting of incomplete outcome data for weight loss, health‐related quality of life or co‐morbidity was either unclear or judged to be of high risk of bias for most of the studies.
The overall quality of evidence was assessed using GRADE.
The quality of evidence for the comparison of surgery versus surgery was moderate. Quality was downgraded due to serious limitations in design or execution of the included RCTs (risk of bias).
The quality of evidence for the comparison of laparoscopic gastric bypass versus laparoscopic adjustable gastric banding was moderate (BMI outcome) or very low (health‐related quality of life and diabetes outcomes). Quality was downgraded due to serious or very serious limitations in design or execution of the included RCTs (risk of bias), serious imprecision for diabetes outcomes, and suspected reporting bias for both health‐related quality of life and diabetes outcomes.
The quality of evidence for the comparison of laparoscopic gastric bypass versus laparoscopic sleeve gastrectomy was low (BMI and diabetes outcomes) or very low (health‐related quality of life outcome). Quality was downgraded due to limitations in design or execution of the included RCTs (risk of bias), serious inconsistency in the BMI outcome, serious imprecision in health‐related quality of life and diabetes outcomes and suspected reporting bias in health‐related quality of life outcomes.
The quality of evidence for the comparison of gastric bypass versus biliopancreatic diversion with duodenal switch was moderate (BMI outcome) or very low (health‐related quality of life and diabetes outcomes). Quality was downgraded due to serious limitations in design or execution of the included RCTs (risk of bias), and serious imprecision and suspected reporting bias in health‐related quality of life and diabetes outcomes.
The quality of evidence for the comparisons of: laparoscopic gastric bypass versus laparoscopic duodenojejunal bypass with sleeve gastrectomy; laparoscopic adjustable gastric banding versus laparoscopic isolated sleeve gastrectomy; and laparoscopic gastric imbrication versus laparoscopic sleeve gastrectomy, was very low. Each of these comparisons was assessed by only one RCT, and quality was downgraded due to serious limitations in study design or execution of the included RCTs (risk of bias), serious imprecision and suspected reporting bias.
Potential biases in the review process
A strength of this review was that we carried out a comprehensive search of the literature, including one database of grey literature, minimising the risk of bias in study selection. A further strength was that we were able to perform meta‐analysis for some comparisons and outcomes. However, only one study was available for some comparisons, for example laparoscopic adjustable gastric banding versus laparoscopic isolated sleeve gastrectomy, precluding meta‐analysis. Even when the same procedures were compared by more than one RCT, limitations in the literature often prevented us from proceeding with meta‐analysis: there were often differences in the outcomes reported or the patient groups and interventions (in the case of the studies comparing surgery with non‐surgical interventions).
Overall, 11 of the 15 studies comparing different surgical procedures were included in one or more meta‐analytic quantitative comparisons, with two to six studies included in each comparison. Due to the small number of studies included in the meta‐analyses, only limited conclusions can be drawn from them. The small number of studies in each meta‐analysis also made it unfeasible for us to explore subgroup effects (e.g. BMI category or gender effects) or to conduct sensitivity analyses (e.g. to explore the impact of the quality or funding source on outcomes). We were also unable to assess publication biases due to the low number of studies available for each of the comparisons.
Deaths, adverse events and some complications are generally rare events and therefore it is not likely that evidence presented here provides reliable estimates of the incidence of these events since most of the RCTs were of a limited size and duration. Adverse events were also reported in a variety of ways across studies, making it difficult to compare between studies. Often no standard definitions or classification systems were used and it was unclear how comprehensive recording and reporting was. Deaths and reoperations were not reported in seven and eight, respectively, of the included studies. This may have led to an underestimate of some of the more frequently encountered complications such as failure of gastric bands, e.g. due to band slip or erosion, complications that usually necessitate band removal.
Within the review, types of surgery were broadly classified into types of procedures. Limited attention is given to the numerous modifications developed by different clinicians within these categories. We have also not investigated the impact of surgical team experience on outcomes, which may have affected the results of some studies, particularly those investigating newer procedures. We did, however, consider this to be an ‘other source’ of potential bias in the 'Risk of bias' assessments, and have therefore reported where this was the case when studies have made this information available.
Agreements and disagreements with other studies or reviews
In accordance with the previous version of this systematic review (Colquitt 2009), we found that surgery results in greater weight loss, reductions in some comorbidities and improvements in some aspects of health‐related quality of life than conventional treatment – this conclusion still holds when considering only the bariatric procedures currently in use in clinical practice in this updated review. The findings of other recent systematic reviews of RCTs and observational studies concur that surgery results in greater short‐term weight loss (Chan 2013; Gloy 2013; Moldovan 2011) and improvement in comorbidities (Chan 2013; Gloy 2013) than conventional treatment. High quality RCTs of the long‐term effects of surgery compared to conventional treatment, however, are still lacking. The wider literature suggests that conventional treatment may not be successful in promoting longer‐term beneficial outcomes. Data from the Swedish Obese Subjects (SOS) study (Sjöström 2013) – a large, prospective, controlled trial – indicates that at 10 to 20 years, surgery results in greater weight loss, lower overall mortality and reduced incidence of comorbidities than usual care, with the highest level of weight loss achieved at two years post‐surgery and some regains thereafter before overall weight loss stabilises at eight to 10 years. Another systematic review suggests weight‐management programmes result in small weight reductions in overweight and obese adults, but weight regain often occurs in the long term (Loveman 2011).
The number of RCTs comparing different surgical procedures has increased since our last review (Colquitt 2009), particularly those comparing sleeve gastrectomy and gastric bypass, but the evidence‐base remains limited meaning that again, few conclusions can be drawn about the relative effectiveness of different procedures from direct evidence. A network meta‐analysis by Padwal 2011a indicates that for weight loss, diversionary procedures are the most effective, followed by diversionary/restrictive procedures, with restrictive procedures resulting in the least weight loss. Other systematic reviews, including those incorporating non‐RCT evidence (O'Brien 2013b), support our finding that adjustable gastric banding results in less weight loss than gastric bypass, while resulting in fewer adverse effects (Padwal 2011b), but higher revision rates (O'Brien 2013), and that biliopancreatic diversion with duodenal switch results in more weight loss than gastric bypass (O'Brien 2013b). The RCT evidence in our review currently provides no clear indication about whether different procedures may have different benefits in improving comorbidities, although there is some indication from a systematic review of RCTs and observational studies (Meijer 2011) that proportionally more patients treated with Roux‐en‐Y gastric bypass experience reversal of diabetes than those treated with adjustable gastric banding.
In our review, the number of deaths reported by the included studies within the surgical trial arms ranged from 0% (none) to 4.2%, with the majority of studies reporting that no deaths occurred. Gloy 2013 similarly found in a recent systematic review of 11 studies comparing surgery with no surgery that no deaths occurred after surgery. However, due to the number of RCTs not reporting whether or not deaths occurred in our review, it remains uncertain if the RCT evidence is accurately capturing mortality rates. A systematic review and meta‐analysis of mortality in bariatric surgery, which included RCT and non‐RCT evidence, reported that total mortality at 30 days or less was 0.28% (95% CI 0.22 to 0.34) with restrictive operations having the lowest mortality (Buchwald 2007).
In line with our previous review (Colquitt 2009), we found there is still a need for RCTs to examine outcomes over longer‐time periods (at least five years), to include quality of life outcomes and use a more standardised approach to measuring and reporting important adverse events. We have identified and described relevant trials that were in progress as of November 2013. Of 12 ongoing studies identified, seven include people with varying degrees of obesity who also have type 2 diabetes and will contribute to the evidence of the effects of surgery in this group. Unfortunately only one of the 12 studies plans to follow patients for five years, therefore, evidence on the long‐term effects of surgery remains an unmet need.

Study flow diagram

'Risk of bias' summary (blank cells indicate that the study did not report that particular outcome)

'Risk of bias' graph (blank cells indicate that the particular outcome was not investigated in some studies)
| Study | Outcome | Surgery | No surgery | P value |
| Dixon 2008 | BMI at 2 years, mean | 29.5 | 36.6 | |
| Dixon 2008 | ||||
| Dixon 2008 | ||||
| Dixon 2012 | BMI at 2 years, mean | 36.6 | 42.3 | |
| Dixon 2012 | ||||
| Dixon 2012 | ||||
| Ikramuddin 2013 | BMI at 12 months, mean (SD) | 25.8 (3.5) | 31.6 (3.7) | Difference ‐5.5 (95% CI ‐6.8 to ‐4.2) |
| Ikramuddin 2013 | ||||
| Ikramuddin 2013 | ||||
| Liang 2013 | BMI at 12 months. mean (SD): LRYGB v no surgery | 24.51 (0.91) | 30.38 (1.66) | P < 0.01 |
| Liang 2013 | BMI at 12 months, mean (SD): LRYGB v no surgery + exenatide | 24.51 (0.91) | 26.84 (1.21) | P < 0.05 |
| Liang 2013 | ||||
| Mingrone 2012 | BMI at 2 years, mean (SD) | 29.31 (2.64) | 43.07 (6.44) | P < 0.001 |
| Mingrone 2012 | ||||
| Mingrone 2012 | ||||
| O'Brien 2006 | BMI at 12 months (mean (95% CI) | 27.0 (26.2 to 27.8) | 29.9 (29.1 to 30.8) | P < 0.001 |
| O'Brien 2006 | BMI at 18 months (mean (95% CI) | 26.7 (25.9 to 27.5) | 30.9 (30.0 to 31.8) | P < 0.001 |
| O'Brien 2006 | BMI at 24 months (mean (95% CI) | 26.4 (25.6 to 27.2) | 31.5 (30.6 to 32.4) | P < 0.001 |
| Schauer 2012 | BMI at 12 months, mean (SD): LYRGB | 26.8 (3.2) | 34.4 (3.7) | P < 0.001 |
| Schauer 2012 | BMI at 12 months, mean (SD): LSG | 27.2 (3.5) | 34.4 (3.7) | P < 0.001 |
| Schauer 2012 | ||||
Comparison 1 Surgery versus non‐surgery, Outcome 1 Mean BMI [kg/m2].

Comparison 1 Surgery versus non‐surgery, Outcome 2 Mean BMI at study end.
| Study | Outcome | Surgery | No surgery | P‐value |
| Dixon 2008 | Reduction in BMI at 2 years, mean | 7.4 | 0.5 | |
| Dixon 2008 | ||||
| Dixon 2012 | BMI loss at 2 years, mean | 9.7 | 1.5 | |
| Dixon 2012 | ||||
| Mingrone 2012 | BMI change from baseline at 2 years, mean (SD) | ‐33.31 (7.88) | ‐4.73 (6.37) | |
| Mingrone 2012 | ||||
| Schauer 2012 | BMI reduction at 12 months, mean (SD): LRYGB | ‐10.2 (3.1) | ‐1.9 (2.9) | P < 0.001 |
| Schauer 2012 | BMI reduction at 12 months, mean (SD): LSG | ‐9.0 (2.7) | ‐1.9 (2.9) | |
Comparison 1 Surgery versus non‐surgery, Outcome 3 BMI reduction.
| Study | Outcome | Surgery | No surgery | P‐value |
| Dixon 2012 | Weight at 2 years, kg, mean (95% CI) | 107 (99 to 116) | 121.8 (113 to 129) | ‐ |
| Dixon 2012 | ||||
| Dixon 2012 | ||||
| Ikramuddin 2013 | Weight at 12 mo, mean (SD) | 73.0 (13.6) | 90.1 (17.0) | Difference ‐16.0 (95% CI ‐21.1 to ‐10.8) |
| Ikramuddin 2013 | ||||
| Ikramuddin 2013 | ||||
| O'Brien 2006 | Weight at 12 months, kg, (mean (95% CI)) | 76.3 (74.1 to 78.5) | 85.3 (83.0 to 87.5) | P < 0.001 |
| O'Brien 2006 | Weight at 18 months, kg, (mean (95% CI)) | 75.2 (73.1 to 77.4) | 87.7 (79.9 to 83.0) | P < 0.001 |
| O'Brien 2006 | Weight at 24 months, kg, (mean (95% CI)) | 74.5 (72.4 to 76.7) | 89.5 (80.5 to 83.6) | P < 0.001 |
| Schauer 2012 | Weight at 12 months, kg, mean (SD): LRYGB | 77.3 (13.0) | 99.0 (16.4) | P < 0.001 |
| Schauer 2012 | Weight at 12 months, kg, mean (SD): LSG | 75.5 (12.9) | 99.0 (16.4) | P < 0.001 |
| Schauer 2012 | ||||
Comparison 1 Surgery versus non‐surgery, Outcome 4 Weight [kg].

Comparison 1 Surgery versus non‐surgery, Outcome 5 Mean weight at study end.
| Study | Outcome | Surgery | No surgery | P value |
| Dixon 2008 | Weight loss at 2 years, mean (SD) | ‐21.1 (10.5) | ‐1.5 (5.4) | Difference ‐19.6 (‐23.8, ‐15.2); P < 0.001 |
| Dixon 2008 | ||||
| Dixon 2012 | Weight loss at 2 years, mean (95% CI) | ‐27.8 (‐34.7 to ‐20.9) | ‐5.1 (‐9.3 to ‐0.8) | ‐22.7 (‐31.1 to ‐14.3); P < 0.001 |
| Dixon 2012 | ||||
| Schauer 2012 | Weight loss at 12 months, mean (SD): LRYGB | ‐29.4 (8.9) | ‐5.4 (8.0) | P < 0.001 |
| Schauer 2012 | Weight loss at 12 months, mean (SD): LSG | ‐25.1 (8.5) | ‐5.4 (8.0) | P < 0.001 |
Comparison 1 Surgery versus non‐surgery, Outcome 6 Weight loss [kg].

Comparison 1 Surgery versus non‐surgery, Outcome 7 Weight loss at study end.
| Study | Outcome | Surgery | No surgery | P‐value |
| Dixon 2008 | % Initial weight loss at 2 years, mean (SD) | 20.0 (9.4) | 1.4 (4.9) | P < 0.001 |
| Dixon 2012 | Weight loss at 2 years, %, mean (95% CI) | 20.6 (15.4 to 25.7) | 2.9 (0.6 to 7.3) | P < 0.001 |
| Ikramuddin 2013 | % weight change at 12 mo, mean (SD) | ‐26.1 (8.7) | ‐7.9 (7.8) | Difference ‐17.5 (95% CI ‐20.7 to ‐14.2) |
| Mingrone 2012 | Weight loss at 2 years, % (SD) | ‐33.31 (7.88) | ‐4.74 (6.37) | P < 0.001 |
| O'Brien 2006 | % of initial weight lost at 2 years (mean (95% CI)) | 21.6 (19.3 to 23.9) | 5.5 (3.2 to 7.9) | |
Comparison 1 Surgery versus non‐surgery, Outcome 8 Initial weight loss [%].

Comparison 1 Surgery versus non‐surgery, Outcome 9 Initial weight loss at study end.
| Study | Outcome | Surgery | No surgery | P‐value |
| Dixon 2008 | % Excess weight loss at 2 years | 62.5 | 4.3 | |
| Dixon 2008 | ||||
| Mingrone 2012 | % Excess weight lost at 2 years, (SD) | 68.08 (12.70) | 9.29 (12.94) | P < 0.001 |
| Mingrone 2012 | ||||
| O'Brien 2006 | % Excess weight lost at 12 months (mean (95% CI)) | 78.6 (69.2 to 88.1) | 41.1 (31.2 to 50.9) | P < 0.001 |
| O'Brien 2006 | % Excess weight lost at 2 years (mean (95% CI)) | 87.2 (77.7 to 96.6) | 21.8 (11.9 to 31.6) | P < 0.001 |
| Schauer 2012 | % Excess weight lost at 12 months, median (interquartile range): LRYGB | 88 (72, 101) | 13 (0.8, 23) | P < 0.001 |
| Schauer 2012 | % Excess weight lost at 12 months, median (interquartile range): LSG | 81 (65, 97) | 13 (0.8, 23) | P < 0.001 |
Comparison 1 Surgery versus non‐surgery, Outcome 10 Excess weight loss [%].

Comparison 1 Surgery versus non‐surgery, Outcome 11 % excess weight loss at study end.
| Study | Outcome | Surgery | No surgery | P value |
| Dixon 2008 | Waist to hip ratio at 2 years, cm, mean (SD) | 0.90 (0.06) | 0.95 (0.08) | Difference in change ‐0.05 (95% CI ‐0.07 to ‐0.007); P = 0.02 |
| Dixon 2008 | Waist circumference at 2 years, cm, mean (SD) | 95.8 (10.3) | 112.7 (10.3) | Difference (in change) ‐13.9 (95% CI ‐19.0 to ‐8.7); P < 0.001 |
| Dixon 2008 | ||||
| Dixon 2008 | ||||
| Dixon 2008 | ||||
| Dixon 2008 | ||||
| Dixon 2008 | ||||
| Dixon 2008 | ||||
| Dixon 2012 | Waist circumference at 2 years, cm, mean (95% CI) | 119.8 (112 to 126) | 124 (119 to 128) | Not reported |
| Dixon 2012 | Change in waist circumference, baseline to 2 years, cm, mean (95% CI) | ‐18.1 (‐12.7 to ‐23.6) | ‐2.9 (‐5.6 to 0.0) | ‐15.2 (‐21.1 to ‐9.33); P = 0.01 |
| Dixon 2012 | Neck circumference at 2 years, cm, mean (95% CI) | 42 (39.1 to 45) | 44.6 (6.0) | Not reported |
| Dixon 2012 | Change in neck circumference, baseline to 2 years, cm, mean (95% CI) | ‐5.2 (‐8.3 to ‐2.07) | ‐1.8 (‐3.3 to ‐0.23) | ‐3.4 (‐7.5 to 0.65); P = 0.10 |
| Dixon 2012 | ||||
| Dixon 2012 | ||||
| Dixon 2012 | ||||
| Dixon 2012 | ||||
| Ikramuddin 2013 | Waist circumference, cm, at 12 mo, mean (SD) | 90 (11) | 105 (11) | Difference ‐15 (95% CI ‐18 to ‐11) |
| Ikramuddin 2013 | ||||
| Ikramuddin 2013 | ||||
| Ikramuddin 2013 | ||||
| Ikramuddin 2013 | ||||
| Ikramuddin 2013 | ||||
| Ikramuddin 2013 | ||||
| Ikramuddin 2013 | ||||
| Mingrone 2012 | Waist, cm at 2 years, mean (SD) | 98.58 (13.06) | 116.33 (12.14) | P < 0.001 |
| Mingrone 2012 | Waist, cm change from baseline at 2 years, mean (SD) | ‐19.91 (8.44) | ‐7.69 (7.80) | |
| Mingrone 2012 | ||||
| Mingrone 2012 | ||||
| Mingrone 2012 | ||||
| Mingrone 2012 | ||||
| Mingrone 2012 | ||||
| Mingrone 2012 | ||||
| O'Brien 2006 | Proportion achieving excess weight loss (> 50%) at 2 years (%) | 33/39 (85%) | 8/31 (26%) | P < 0.001 |
| O'Brien 2006 | Proportion achieving satisfactory weight loss (> 25%) at 2 years (%) | 39/40 (98%) | 14/40 (35%) | P < 0.001 |
| O'Brien 2006 | ||||
| O'Brien 2006 | ||||
| O'Brien 2006 | ||||
| O'Brien 2006 | ||||
| O'Brien 2006 | ||||
| O'Brien 2006 | ||||
| Schauer 2012 | Waist at 12 months, cm, mean (SD): LRYGB | 93.4 (9.0) | 108.8 (10.8) | P < 0.001 |
| Schauer 2012 | Waist at 12 months, cm, mean (SD): LSG | 93.5 (8.8) | 108.8 (10.8) | P < 0.001 |
| Schauer 2012 | Change in waist at 12 months, cm, mean (SD): LRYGB | ‐23.0 (8.3) | ‐4.1 (8.5) | P < 0.001 |
| Schauer 2012 | Change in waist at 12 months, cm, mean (SD): LSG | 20.1 (9.0) | ‐4.1 (8.5) | P < 0.001 |
| Schauer 2012 | Waist:hip ratio at 12 months, mean (SD): LRYGB | 0.91 (0.06) | 0.93 (0.08) | P = 0.12 |
| Schauer 2012 | Waist:hip ratio at 12 months, mean (SD): LSG | 0.92 (0.07) | 0.93 (0.08) | P = 0.07 |
| Schauer 2012 | Change in waist:hip ratio at 12 months, mean (SD): LRYGB | ‐0.05 (0.06) | ‐0.01 (0.04) | P < 0.001 |
| Schauer 2012 | Change in waist:hip ratio at 12 months, mean (SD): LSG | ‐0.05 (0.07) | ‐0.01 (0.04) | P = 0.02 |
Comparison 1 Surgery versus non‐surgery, Outcome 12 Other weight change data.
| Study | SF‐36 scores | Surgery | No surgery | Mean (95% CI) of between‐group differences; P value |
| Dixon 2012 | Physical function, mean change at 2 years (95% CI) | 29.6 (16.1 to 43.2) | 12.8 (1.4 to 24.2) | 16.8 (‐3.4 to 37); P = 0.1 |
| Dixon 2012 | Physical Role, mean change at 2 years (95% CI) | 39.2 (17.3 to 61.2) | 5.7 (‐12.9 to 24.3) | 33.5 (2.2 to 64.8); P = 0.04 |
| Dixon 2012 | Bodily Pain, mean change at 2 years (95% CI) | 14.6 (4.7 to 24.5) | 7.2 (0.8 to 13.7) | 7.4 (‐6.5 to 21.2); P = 0.29 |
| Dixon 2012 | General Health, mean change at 2 years (95% CI) | 30 (20.8 to 39.1) | 11.6 (2.3 to 20.8) | 18.4 (3.6 to 33.2); P = 0.02 |
| Dixon 2012 | Vitality, mean change at 2 years (95% CI) | 22.5 (13.4 to 31.7) | 5.2 (‐5.7 to 16.0) | 17.3 (0.4 to 34.3); P = 0.05 |
| Dixon 2012 | Social Functioing, mean change at 2 years (95% CI) | 16.3 (2.4 to 30.3) | 5.7 (‐5.0 to 16.4) | 10.6 (‐9.1 to 30.3); P = 0.29 |
| Dixon 2012 | Emotional Role, mean change at 2 years (95% CI) | 20.5 (‐3.3 to 44.3) | 4.9 (‐12.0 to 21.9) | 15.6 (‐19.7 to 50.9); P = 0.38 |
| Dixon 2012 | Mental Health, mean change at 2 years (95% CI) | 9.1 (‐0.3 to 18.4) | 4.8 (‐4.6 to 14.1) | 4.3 (‐10.5 to 19.0); P = 0.57 |
| Dixon 2012 | Physical Component summary score, mean change at 2 years (95% CI) | 12.6 (7.3 to 17.9) | 3.4 (‐1.6 to 8.4) | 9.3 (0.5 to 18.0); P = 0.04 |
| Dixon 2012 | Mental Component summary score, mean change at 2 years (95% CI) | 0.5 (‐3.0 to 4.0) | 0.8 (‐2.2 to 3.8) | ‐0.3 (‐5.3 to 4.8); P = 0.92 |
| O'Brien 2006 | Physical function at 2 years, mean | 90 | 87 | P < 0.05 |
| O'Brien 2006 | Physical Role at 2 years, mean | 92 | 70 | P < 0.05 |
| O'Brien 2006 | Pain at 2 years, mean | 83 | 78 | P = ns |
| O'Brien 2006 | General Health at 2 years, mean | 73 | 68 | P < 0.05 |
| O'Brien 2006 | Vitality at 2 years, mean | 66 | 57 | P < 0.05 |
| O'Brien 2006 | Social Functioning at 2 years, mean | 85 | 81 | P = ns |
| O'Brien 2006 | Emotional Role at 2 years, mean | 92 | 72 | P < 0.05 |
| O'Brien 2006 | Mental Health at 2 years, mean | 76 | 72 | P = ns |
| O'Brien 2006 | ||||
| O'Brien 2006 | ||||
Comparison 1 Surgery versus non‐surgery, Outcome 13 Health‐related quality of life.
| Study | Outcome | Surgery | No surgery | P value |
| Dixon 2008 | Remission of type 2 diabetes at 2‐years | 22/30 (73%) | 4/30 (13%) | RR 5.5 (95% CI 2.2 to 14.0); P < 0.001 |
| Dixon 2008 | No diabetes medication at baseline | 2/29 (6.9%) | 4/26 (15.4%) | |
| Dixon 2008 | No diabetes medication at baseline at 2 years | 26/29 (89.7%) | 8/26 (30.8%) | |
| Dixon 2008 | ||||
| Ikramuddin 2013 | % with fasting glucose <100 mg/dl at 12 months, n (%) | 25 (44) | 7 (14) | OR 5.8 (95% CI 2.1 to 15.9) |
| Ikramuddin 2013 | % with HbA1c < 6.0% at 12 months, n (%) | 25 (44) | 5 (9) | OR 7.9 (95% CI 2.7 to 23.4) |
| Ikramuddin 2013 | % with HbA1c < 7.0% at 12 months, n (%) | 43 (75) | 18 (32) | OR 6.0 (95% CI 2.6 to 13.9) |
| Ikramuddin 2013 | ||||
| Liang 2013 | Diabetes remission at 12 months: LRYGB v no surgery | 28/31 (90%) | 0/36 (0%) | |
| Liang 2013 | Diabetes remission at 12 months: LRYGB v no surgery + exenatide | 28/31 (90%) | 0/34 (0%) | |
| Liang 2013 | ||||
| Liang 2013 | ||||
| Mingrone 2012 | Diabetes remission at 2 years, n/N (%) | 15/20 (75%) | 0/18 (0%) | P < 0.001 |
| Mingrone 2012 | ||||
| Mingrone 2012 | ||||
| Mingrone 2012 | ||||
| Schauer 2012 | Glycosylated haemoglobin ≤6% at 12 months, n (%): LRYGB | 21 (42) | 5 (12) | P = 0.002 |
| Schauer 2012 | Glycosylated haemoglobin ≤6% at 12 months, n (%): LSG | 18 (37) | 5 (12) | P = 0.008 |
| Schauer 2012 | n (%) of patients taking no diabetes medications: LRYGB | 38 (78) | 0 | P < 0.05 |
| Schauer 2012 | n (%) of patients taking no diabetes medications: LSG | 25 (51) | 0 | p < 0.05 |
Comparison 1 Surgery versus non‐surgery, Outcome 14 Comorbitidies: diabetes.
| Study | Outcome | Surgery | No surgery | P value |
| Dixon 2008 | Antihypertensive agents at baseline, n/N (%) | 20/29 (70%) | 15/26 (57.7%) | |
| Dixon 2008 | Antihypertensive agents at 2 years, n/N (%) | 6/29 (20.7%) | 15/26 (57.7%) | |
| Ikramuddin 2013 | % with systolic BP < 130 mm Hg at 12 months, n (%) | 48 (84) | 44 (79) | OR 1.7 (95% CI 0.6 to 4.6) |
| Ikramuddin 2013 | ||||
| Mingrone 2012 | Reduction/discontinuation of antihypertensive therapy, % | 80 | 70 | |
| Mingrone 2012 | ||||
Comparison 1 Surgery versus non‐surgery, Outcome 15 Comorbitidies: hypertension.
| Study | Outcome | Surgery | No surgery | P value |
| Dixon 2008 | Metabolic syndrome (NOT meeting criteria) at baseline 2 yrs, n (%) | 1 (3%) | 1 (3%) | |
| Dixon 2008 | Metabolic syndrome (NOT meeting criteria) at 2 years, n (%) | 21 (70%) | 4 (13%) | P < 0.001 |
| Dixon 2008 | ||||
| Dixon 2012 | Metabolic syndrome at baseline, n/N | 19/30 | 24/30 | |
| Dixon 2012 | Metabolic syndrome at 2 years, n/N (% of baseline) | 10/19 (53) | 22/24 (92) | |
| Dixon 2012 | Change in metabolic syndrome, baseline to 2 years, n (%) | ‐9 (47) | ‐2 (8) | P = 0.005 |
| O'Brien 2006 | Metabolic syndrome at baseline, n/N (%) | 15/40 (37.5%) | 15/40 (37.5%) | |
| O'Brien 2006 | Metabolic syndrome at 2 years, n/N (%) | 1/39 (2.7%) | 8/33 (24%) | P = 0.006 |
| O'Brien 2006 | ||||
| Schauer 2012 | Resolution of metabolic syndrome at 12 months, n (%): LRYGB | 30 (65.2) | 13 (35.1) | P = 0.01 |
| Schauer 2012 | Resolution of metabolic syndrome at 12 months, n (%): LSG | 27 (58.7) | 13 (35.1) | P = 0.03 |
| Schauer 2012 | ||||
Comparison 1 Surgery versus non‐surgery, Outcome 16 Comorbitidies: metabolic syndrome.
| Study | Outcome | Surgery | No surgery | P value |
| Dixon 2008 | Lipid lowering agents at baseline, n/N (%) | 12/29 (41.4%) | 8/26 (30.8%) | |
| Dixon 2008 | Lipid lowering agents at 2‐years, n/N (%) | 4/29 (13.8%) | 7/26 (26.9%) | |
| Dixon 2008 | ||||
| Ikramuddin 2013 | % with LDL cholesterol < 100 mg/dl at 12 months, n (%) | 45 (79) | 38 (70) | OR 1.6 (95% CI 0.7 to 3.8) |
| Ikramuddin 2013 | ||||
| Ikramuddin 2013 | ||||
| Mingrone 2012 | Total cholesterol normalisation at 2 years, % | 100 | 27.3 | P < 0.001 |
| Mingrone 2012 | HDL cholesterol normalisation at 2 years, % | 100 | 11.1 | P < 0.005 |
| Mingrone 2012 | Triglyceride normalisation at 2 years, % | 85.7 | 0 | P < 0.001 |
Comparison 1 Surgery versus non‐surgery, Outcome 17 Comorbitidies: Lipids.
| Study | Outcome | Surgery | No surgery | P value |
| Dixon 2012 | CPAP initiated, n/N (%) | 28/30 (93) | 25/30 (83) | Stated not significant |
| Dixon 2012 | CPAP adherent at 2 years, n/N (%) | 14/28 (50) | 18/25 (72) | Stated not significant |
| Dixon 2012 | Achieved mild OSA at 2 years, n/N (%) | 8/30 (27) | 2/30 (7) | P = 0.04 |
| Dixon 2012 | Achieved OSA remission at 2 years, n/N (%) | 0/0 (0) | 1/30 (3) | Not reported |
Comparison 1 Surgery versus non‐surgery, Outcome 18 Comorbitidies: Sleep.
| Study | Outcome | LRYGB | LAGB | P value |
| Angrisani 2007 | Mean BMI at 12‐months | 35.4 | 38.7 |
|
| Angrisani 2007 | Mean BMI at 36‐months | 29.1 | 35.6 |
|
| Angrisani 2007 | Mean BMI at 5‐years (range 60‐66 months) | 29.8 | 34.9 | P < 0.001 |
| Angrisani 2007 | Mean BMI at 10‐years (range 120‐130 months) | 30.4 (5) | 36.5 (7) | P = 0.003 |
| Demerdash 2013 | Mean (SD) BMI at 12 months | 32.0 (2.8) | 37.1 (1.6) | P = 0.0013 |
| Demerdash 2013 | ||||
| Demerdash 2013 | ||||
| Demerdash 2013 | ||||
| Nguyen 2009 | Mean BMI, 1 year | 31.6 | 37.3 | P < 0.05 |
| Nguyen 2009 | Mean BMI, 2 years | 30.6 | 35.8 | P < 0.05 |
| Nguyen 2009 | Mean BMI, 3 years | 30.8 | 35.8 | P < 0.05 |
| Nguyen 2009 | Mean (SD) BMI, 4 years | 30.5 (5.5) | 35.7 (8.1) | P < 0.05 |
Comparison 2 Laparoscopic gastric bypass versus laparoscopic adjustable gastric banding, Outcome 1 Mean BMI [kg/m2].

Comparison 2 Laparoscopic gastric bypass versus laparoscopic adjustable gastric banding, Outcome 2 Mean BMI at study end.
| Study | Outcome, mean (SD) | LRYGB | LAGB | P value |
| Angrisani 2007 | Mean weight, kg at 12‐months | 92.8 | 102.4 |
|
| Angrisani 2007 | Mean weight, kg at 36‐months | 83.5 | 98.7 |
|
| Angrisani 2007 | Mean weight, kg at 5‐years (range 60‐66 months) | 84 | 97.9 | P < 0.001 |
| Angrisani 2007 | Mean weight, kg (SD) at 10‐years (range 120‐130 months) | 83.2 (18) | 101.3 (22) | P = 0.002 |
Comparison 2 Laparoscopic gastric bypass versus laparoscopic adjustable gastric banding, Outcome 3 Mean weight [kg].
| Study | Outcome | LRYGB | LAGB | P value |
| Angrisani 2007 | % EWL at 12‐months | 51.3 | 34.7 |
|
| Angrisani 2007 | % EWL at 36‐months | 67.3 | 47.3 |
|
| Angrisani 2007 | % EWL at 5‐years (range 60‐66 months) | 66.6 | 47.5 | P < 0.001 |
| Angrisani 2007 | % EWL at 10‐years (range 120‐130 months) | 69.0 (29) | 45.9 (27) | P = 0.03 |
| Nguyen 2009 | Mean (SD) % EWL, 1 year | 64.3 ( ‐ ) (n=111) | 36.5 ( ‐ ) (n=86) | P < 0.05 |
| Nguyen 2009 | Mean (SD) % EWL, 2 years | 68.9 (16.1) (n=94) | 41.8 (20) (n=79) | P < 0.05 |
| Nguyen 2009 | Mean (SD) % EWL, 3 years | 67.5 (16.9) (n=81) | 41.5 (21.4) (n=62) | P < 0.05 |
| Nguyen 2009 | Mean (SD) % EWL, 4 years | 68.4 (19.5) (n=71) | 45.4 (27.6) (n=30) | P < 0.05 |
Comparison 2 Laparoscopic gastric bypass versus laparoscopic adjustable gastric banding, Outcome 4 Excess weight loss [%].
![Comparison 2 Laparoscopic gastric bypass versus laparoscopic adjustable gastric banding, Outcome 5 Excess weight loss at study end [%].](/es/cdsr/doi/10.1002/14651858.CD003641.pub4/media/CDSR/CD003641/image_n/nCD003641-CMP-002-05.png)
Comparison 2 Laparoscopic gastric bypass versus laparoscopic adjustable gastric banding, Outcome 5 Excess weight loss at study end [%].
| Study | Outcome | LRYGB | LAGB | P value |
| Angrisani 2007 | Weight loss failure (BMI > 35) at 5‐years | 1/24 (4.2%) | 9/26 (34.6%) | P < 0.001 |
| Angrisani 2007 | BMI <30 at 5‐years | 15/24 (62.5%) | 3/26 (11.5%) | P < 0.001 |
| Angrisani 2007 | Proportion with EWL <=25% at 10 years | 1/21 (4.7%) | 4/13 (30.8%) | |
| Angrisani 2007 | Proportion with EWL 25% to 50% at 10 years | 4/21 (19.1%) | 3/13 (23%) | |
| Angrisani 2007 | Proportion with EWL >=50% at 10 years | 16/21 (76.2) | 6/13 (46.2%) | |
| Angrisani 2007 | ||||
| Demerdash 2013 | % body weight decrease at 12 months, mean (SD) | 31.5 (19.58) | 26.25 (22.13) | P = 0.025 |
| Demerdash 2013 | ||||
| Demerdash 2013 | ||||
| Demerdash 2013 | ||||
| Demerdash 2013 | ||||
| Demerdash 2013 | ||||
| Nguyen 2009 | Weight loss <20% (poor/failure) [%] (time of assessment unknown) | 0.0 | 16.7 | |
| Nguyen 2009 | Weight loss 20‐39.9% (adequate) [%] (time of assessment unknown) | 5.1 | 33.3 | |
| Nguyen 2009 | Weight loss 40‐59.9% (good) [%] (time of assessment unknown) | 30.8 | 34.6 | |
| Nguyen 2009 | Weight loss 60‐79.9% (excellent) [%] (time of assessment unknown) | 51.3 | 11.5 | |
| Nguyen 2009 | Weight loss >80% (exceptional) [%] (time of assessment unknown) | 12.8 | 3.8 | |
| Nguyen 2009 | Treatment failure, including patients lost to follow up classified as failures [%] (time of assessment unknown) | 15.3 | 23.3 | |
Comparison 2 Laparoscopic gastric bypass versus laparoscopic adjustable gastric banding, Outcome 6 Other weight change data.
| Study | Outcome | RYGB | LSG | P value |
| Karamanakos 2008 | BMI at 3 years, mean (SD) | 31.3 (3.9) | 29.6 (4.1) | P = 0.11 |
| Karamanakos 2008 | ||||
| Karamanakos 2008 | ||||
| Keidar 2013 | BMI at 12 months | 31.4 (4.2) | 30.4 (3.8) | ns |
| Keidar 2013 | ||||
| Keidar 2013 | ||||
| Lee 2011 | BMI at 12 months, mean (SD) | 22.8 (2.2) | 24.4 (2.4) | P = 0.009 |
| Lee 2011 | ||||
| Lee 2011 | ||||
| Nogués 2010 | BMI at 12 months, mean (SD) | 26.2 (2.6) | 30.5 (2.6) | P = 0.01 |
| Nogués 2010 | ||||
| Nogués 2010 | ||||
| Paluszkiewicz 2012 | BMI at 12 months, mean (SD) | 33.8 (5.4) | 32.8 (5.6) | ns |
| Paluszkiewicz 2012 | ||||
| Paluszkiewicz 2012 | ||||
| Peterli 2012 | BMI at 12 months, mean (SD) | 29.9 (4.8) (n=109) | 30.7 (5.0) (n=107) | P = 0.25 |
| Peterli 2012 | BMI at 2 years, mean (SD) | 30.1 (5.7) (n=52) | 31.1 (4.7) (n=60) | P = 0.28 |
| Peterli 2012 | BMI at 3 years, mean (SD) | 31.7 (6.7 (n=32) | 32.5 (5.6) (n=38) | P = 0.56 |
| Schauer 2012 | BMI at 12 months, mean (SD) | 26.8 (3.2) | 27.2 (3.5) | P = 0.61 |
| Schauer 2012 | ||||
| Schauer 2012 | ||||
Comparison 3 Laparoscopic gastric bypass versus laparoscopic sleeve gastrectomy, Outcome 1 Mean BMI [kg/m2].

Comparison 3 Laparoscopic gastric bypass versus laparoscopic sleeve gastrectomy, Outcome 2 Mean BMI at study end.
| Study | Outcome | RYGB | LSG | P‐value |
| Nogués 2010 | BMI change at 12 months, mean (SD) | ‐16.8 (4.1) | ‐13.0 (3.6) | NS |
| Schauer 2012 | BMI change at 12 months, mean (SD) | ‐10.2 (3.1) | ‐9.0 (2.7) | P = 0.03 |
Comparison 3 Laparoscopic gastric bypass versus laparoscopic sleeve gastrectomy, Outcome 3 BMI reduction.

Comparison 3 Laparoscopic gastric bypass versus laparoscopic sleeve gastrectomy, Outcome 4 BMI reduction at 12 months.
| Study | Outcomes | RYGB | LSG | P value |
| Keidar 2013 | Weight kg at 12 months | 87.8 (14.1) | 84.1 (11.8) | ns |
| Keidar 2013 | ||||
| Keidar 2013 | ||||
| Lee 2011 | Weight kg at 12 months, mean (SD) | 60.7 (10.1) | 65.7 (7.9) | P = 0.03 |
| Lee 2011 | ||||
| Lee 2011 | ||||
| Nogués 2010 | weight at 12 months, kg, mean (SD) | 71.4 (8.2) | 76.5 (8.2) | NS |
| Nogués 2010 | ||||
| Nogués 2010 | ||||
| Paluszkiewicz 2012 | Weight at 12 months, kg, mean (SD) | 96.8 (17.4) | 91.7 (17.4) | ns |
| Paluszkiewicz 2012 | ||||
| Paluszkiewicz 2012 | ||||
| Peterli 2012 | Weight at 12 months, kg, mean (SD) | 84.7 (16.8) (n=110) | 86.9 (16.9) (n=107) | P = 0.34 |
| Peterli 2012 | Weight at 2 years, kg, mean (SD) | 85.8 (17.9) (n=52) | 87.3 (14.8) (n=60) | P = 0.61 |
| Peterli 2012 | Weight at 3 years, kg, mean (SD) | 90.3 (21.0) (n=32) | 91.3 (18.1) (n=38) | P = 0.83 |
| Schauer 2012 | Weight at 12 months, kg, mean (SD) | 77.3 (13.0) | 75.5 (12.9) | P = 0.50 |
| Schauer 2012 | ||||
| Schauer 2012 | ||||
Comparison 3 Laparoscopic gastric bypass versus laparoscopic sleeve gastrectomy, Outcome 5 Mean weight [kg].

Comparison 3 Laparoscopic gastric bypass versus laparoscopic sleeve gastrectomy, Outcome 6 Mean weight at study end.
| Study | Outcome | RYGB | LSG | P value |
| Karamanakos 2008 | Weight loss at 12 months, mean (SD) | 40.0 (8.3) | 43.6 (11.7) | P = 0.322 |
| Nogués 2010 | weight loss at 12 months, mean (SD) | 45.3 (9.1) | 32.4 (8.7) | P = 0.015 |
| Schauer 2012 | weight loss at 12 months, mean (SD) | 29.4 (8.9) | 25.1 (8.5) | P = 0.02 |
Comparison 3 Laparoscopic gastric bypass versus laparoscopic sleeve gastrectomy, Outcome 7 Weight loss [kg].

Comparison 3 Laparoscopic gastric bypass versus laparoscopic sleeve gastrectomy, Outcome 8 Mean weight loss at 12 months.
| Study | Outcome | RYGB | LSG | P value |
| Karamanakos 2008 | % EWL at 12 months | 65.6 | 72.9 | P = 0.05 |
| Karamanakos 2008 | % EWL at 2 years | 65.3 | 73.2 | P = 0.05 |
| Karamanakos 2008 | % EWL at 3 years | 62.1 | 68.5 | P = 0.13 |
| Lee 2011 | % EWL at 12 months, mean (SD) | 94.4 (33.1) | 76.3 (38.9) | P = 0.06 |
| Lee 2011 | ||||
| Lee 2011 | ||||
| Paluszkiewicz 2012 | % EWL at 12 months | 64.2 | 37.6 | ns |
| Paluszkiewicz 2012 | ||||
| Paluszkiewicz 2012 | ||||
| Schauer 2012 | % EWL, median (interquartile range) | 88 (72, 101) | 81 (65, 97) | P = 0.32 |
| Schauer 2012 | ||||
| Schauer 2012 | ||||
| Vix 2013 | % EWL at 12 months, mean | 80.38 | 82.97 | P ≥ 0.05 |
| Vix 2013 | ||||
| Vix 2013 | ||||
Comparison 3 Laparoscopic gastric bypass versus laparoscopic sleeve gastrectomy, Outcome 9 Excess weight loss [%].
| Study | Outcome | RYGB | LSG | P value |
| Karamanakos 2008 | achieved >50% of EWL 1 year post‐surgery [%] | 83 | 93 | P = 0.42 |
| Karamanakos 2008 | achieved >50% of EWL 2 years post‐surgery [%] | 83 | 87 | P = 0.9 |
| Karamanakos 2008 | achieved >50% of EWL 3 years post‐surgery [%] | 77 | 83 | P = 0.74 |
| Karamanakos 2008 | % excess BMI lost at 3 years | 61.4 | 68.2 | P = 0.12 |
| Karamanakos 2008 | ||||
| Karamanakos 2008 | ||||
| Karamanakos 2008 | ||||
| Keidar 2013 | % weight loss from baseline, mean (SD) | 25.9 (5.4) | 28.4 (5.9) | ns |
| Keidar 2013 | % body fat at 12 months, mean (SD) | 30.0 (6.4) | 31.5 (8.3) | ns |
| Keidar 2013 | Fat mass (kg) at 12 months, mean (SD) | 25.7 (5.1) | 26.5 (8.7) | ns |
| Keidar 2013 | % Fat mass change from baseline, mean (SD) | 23.7 (8.7) | 24.2 (9.6) | ns |
| Keidar 2013 | Fat‐free mass (kg) at 12 months, mean (SD) | 61.5 (13.5) | 56.8 (9.7) | ns |
| Keidar 2013 | % Fat‐free mass change from baseline, mean (SD) | 6.9 (6.1) | 9.1 (6.3) | ns |
| Keidar 2013 | Waist (cm) at 12 months, mean (SD) | 100.9 (10.4) | 98.6 (9.3) | ns |
| Lee 2011 | % Weight loss at 12 months | 23.3 | 19.9 | P = 0.02 |
| Lee 2011 | Waist circumference cm at 12 months, mean (SD) | 79.7 (7.4) | 85.3 (5.7) | P = 0.002 |
| Lee 2011 | ||||
| Lee 2011 | ||||
| Lee 2011 | ||||
| Lee 2011 | ||||
| Lee 2011 | ||||
| Paluszkiewicz 2012 | % EWL > 50%, n (%) at 12 months | 28 (77.8) | 27 (75) | ns |
| Paluszkiewicz 2012 | ||||
| Paluszkiewicz 2012 | ||||
| Paluszkiewicz 2012 | ||||
| Paluszkiewicz 2012 | ||||
| Paluszkiewicz 2012 | ||||
| Paluszkiewicz 2012 | ||||
| Peterli 2012 | % excess BMI loss at 12 months, mean (SD) | 76.6 (21.0) (n=109) | 72.3 (22.0) (n=107) | P = 0.14 |
| Peterli 2012 | % excess BMI loss at 2 years, mean (SD) | 77.0 (21.7) (n=52) | 69.1 (22.0) (n=60) | P = 0.06 |
| Peterli 2012 | % excess BMI loss at 3 years, mean (SD) | 72.8 (21.2) (n=32) | 63.3 (23.3) (n=38) | P= 0.08 |
| Peterli 2012 | ||||
| Peterli 2012 | ||||
| Peterli 2012 | ||||
| Peterli 2012 | ||||
| Schauer 2012 | Waist circumference cm at 12 months, mean (SD) | 93.4 (9.0) | 93.5 (8.8) | P = 0.96 |
| Schauer 2012 | Waist circumference change from baseline, mean (SD) | ‐23.0 (8.3) | ‐20.1 (9.0) | P = 0.11 |
| Schauer 2012 | Waist:hip ratio at 12 months, mean (SD) | 0.91 (0.06) | 0.92 (0.07) | P = 0.71 |
| Schauer 2012 | Waist:hip ratio change from baseline, mean (SD) | ‐0.05 (0.06) | ‐0.05 (0.07) | P = 0.68 |
| Schauer 2012 | ||||
| Schauer 2012 | ||||
| Schauer 2012 | ||||
| Vix 2013 | % excess BMI loss at 12 months, mean | 71.79 | 70.62 | P ≥ 0.05 |
| Vix 2013 | ||||
| Vix 2013 | ||||
| Vix 2013 | ||||
| Vix 2013 | ||||
| Vix 2013 | ||||
| Vix 2013 | ||||
Comparison 3 Laparoscopic gastric bypass versus laparoscopic sleeve gastrectomy, Outcome 10 Other weight change data.
| Study | Outcome | RYGB | LSG | P value |
| Peterli 2012 | GIQLI score, baseline, mean (SD) | 98.8 (17.4) | 99.0 (20.5) | P ≥ 0.05 |
| Peterli 2012 | GIQLI score at 12 months, mean | 128 | 127 | P ≥ 0.05 |
Comparison 3 Laparoscopic gastric bypass versus laparoscopic sleeve gastrectomy, Outcome 11 Health related quality of life.
| Study | Outcome | RYGB | LSG | P value |
| Karamanakos 2008 | Resolution or improvement of type 2 diabetes, n (%), at 3 years | 4/5 (80) | 4/5 (80) | P > 0.05 |
| Karamanakos 2008 | Resolution or improvement of impaired glucose tolerance, n (%) at 3 years | 5/5 (100) | 5/5 (100) | P > 0.05 |
| Karamanakos 2008 | ||||
| Karamanakos 2008 | ||||
| Keidar 2013 | Normal fasting glucose and HbA1c at 12 months, n (%) | 5/16 (31) | 7/15 (47) | |
| Keidar 2013 | Impaired fasting glucose with normal HbA1c at 12 months, n (%) | 4/16 (25) | 7/15 (47) | |
| Keidar 2013 | Oral hypoglycaemic use at 12 months, n (%) | 8/19 (42) | 3/18 (17) | |
| Keidar 2013 | Insulin use at 12 months, n (%) | 2/19 (11) | 1/18 (6) | |
| Lee 2011 | Remission of diabetes mellitus (HbA1c < 6.5%) at 12 months, n (%) | 28 (93) | 14 (47) | P = 0.02 |
| Lee 2011 | Successful treatment of diabetes mellitus (HbA1c < 7%, LDL‐C < 100 mg/dL, and triglycerides < 150 mg/dL at 12 months, n (%) | 17 (57) | 0 (0) | P < 0.001 |
| Lee 2011 | ||||
| Lee 2011 | ||||
| Nogués 2010 | Withdrawal of use of diabetic medication among a subgroup of patients with diabetes at baseline (n/N), at 12 months | 2/2 | 2/2 | |
| Nogués 2010 | Normalisation of insulin resistance (HOMA‐IR) in patients who fulfilled criteria for insulin resistance at baseline (n/N), at 12 months | 6/6 | 3/4 | |
| Nogués 2010 | ||||
| Nogués 2010 | ||||
| Paluszkiewicz 2012 | Resolution of type 2 diabetes at 12 months, n (%) | 9/14 (64.3) | 4/10 (40) | ns |
| Paluszkiewicz 2012 | ||||
| Paluszkiewicz 2012 | ||||
| Paluszkiewicz 2012 | ||||
| Peterli 2012 | Discontinued medication for type 2 diabetes, % at 1 year | 67.9 | 57.7 | P ≥ 0.05 |
| Peterli 2012 | Type 2 diabetes cured, % at 1 year | 67.9 | 57.7 | ns |
| Peterli 2012 | Type 2 diabetes improved, % at 1 year | 28.6 | 42.3 | ns |
| Peterli 2012 | ||||
| Schauer 2012 | Glycosylated haemoglobin at 12 months ≤ 6%, n (%) | 21 (42) | 18 (37) | P = 0.59 |
| Schauer 2012 | n (%) of patients taking no diabetes medications at 12 months | 38 (78) | 25 (51) | |
| Schauer 2012 | ||||
| Schauer 2012 | ||||
Comparison 3 Laparoscopic gastric bypass versus laparoscopic sleeve gastrectomy, Outcome 12 Comorbidities: diabetes.
| Study | Outcome | RYGB | LSG | P value |
| Karamanakos 2008 | Resolution or improvement of hypertension at 3 years, n (%) | 3/5 (60) | 3/4 (75) | P > 0.05 |
| Karamanakos 2008 | ||||
| Paluszkiewicz 2012 | Resolution of hypertension at 12 months, n (%) | 11/30 (36.7) | 8/25 (32) | ns |
| Paluszkiewicz 2012 | ||||
| Peterli 2012 | Hypertension cured, % at 1 year | 33.0 | 33.0 | ns |
| Peterli 2012 | Hypertension improved, % at 1 year | 62.0 | 57.0 | ns |
Comparison 3 Laparoscopic gastric bypass versus laparoscopic sleeve gastrectomy, Outcome 13 Comorbidities: hypertension.
| Study | Outcome | RYGB | LSG | P value |
| Karamanakos 2008 | Resolution or improvement of HDL < threshold at 3 years | 4/4 (100) | 2/3 (67) | P > 0.05 |
| Karamanakos 2008 | Resolution or improvement of LDL > threshold at 3 years | 9/10 (90) | 6/8 (75) | P > 0.05 |
| Karamanakos 2008 | Resolution or improvement of triglycerides > threshold at 3 years | 5/5 (100) | 2/3 (67) | P > 0.05 |
| Paluszkiewicz 2012 | Resolution of dysplipidaemia at 12 months, n (%) | 13/31 (41.9) | 5/31 (16.1) | P < 0.05 |
| Paluszkiewicz 2012 | ||||
| Paluszkiewicz 2012 | ||||
| Peterli 2012 | Dyslipidaemia cured, % at 1 year | 47.0 | 26.0 | ns |
| Peterli 2012 | Dyslipidaemia improved, % at 1 year | 50.0 | 59.0 | ns |
| Peterli 2012 | ||||
| Vix 2013 | Abnormal triglycerides at baseline, n (%) | 8 (17.8) | 15 (27.3) | |
| Vix 2013 | Abnormal triglycerides at 12 months, n (%) | 0 (0) | 0 (0) | |
| Vix 2013 | ||||
Comparison 3 Laparoscopic gastric bypass versus laparoscopic sleeve gastrectomy, Outcome 14 Comorbidities: dyslipidaemia.
| Study | Outcome | RYGB | LSG | P value |
| Lee 2011 | Metabolic syndrome at 12 months, n (%) | 2 (6.6) | 18 (60.0) | P < 0.001 |
| Schauer 2012 | Resolution of metabolic syndrome at 12 months, n (%) | 30 (65.2) | 27 (58.7) | P = 0.52 |
Comparison 3 Laparoscopic gastric bypass versus laparoscopic sleeve gastrectomy, Outcome 15 Comorbidities: metabolic syndrome.
| Study | Outcome | RYGB | LSG | P value |
| Karamanakos 2008 | Resolution or improvement of obstructive sleep apnoea at 3 years, n/N (%) | 2/3 (67) | 4/6 (67) | P > 0.05 |
| Karamanakos 2008 | ||||
| Peterli 2012 | Obstructive sleep apnoea syndrome cured, [%] at 1 year | 33.0 | 52.0 | ns |
| Peterli 2012 | Obstructive sleep apnoea syndrome improved, [%] at 1 year | 67.0 | 45.0 | ns |
Comparison 3 Laparoscopic gastric bypass versus laparoscopic sleeve gastrectomy, Outcome 16 Comorbidities: sleep.
| Study | Outcome | RYGB | LSG | P value |
| Karamanakos 2008 | Resolution or improvement of GERD at 3 years, n/N (%) | 5/5 (100) | 2/2 (100) | P > 0.05 |
| Karamanakos 2008 | Resolution or improvement of degenerative arthritis at 3 years, n/N (%) | 5/6 (83) | 4/5 (80) | P > 0.05 |
| Karamanakos 2008 | Resolution or improvement of menstrual irregularities at 3 years, n/N (%) | 7/7 (100) | 7/7 (100) | P > 0.05 |
| Karamanakos 2008 | ||||
| Karamanakos 2008 | ||||
| Karamanakos 2008 | ||||
| Karamanakos 2008 | ||||
| Karamanakos 2008 | ||||
| Peterli 2012 | New‐onset GERD, %, at 1 year | 4 | 12.5 | P = 0.12 |
| Peterli 2012 | GERD cured or improved, % at 1 year | 76.5 | 50 | P = 0.008 |
| Peterli 2012 | Back/joint pain cured, % at 1 year | 17.0 | 22.0 | ns |
| Peterli 2012 | Back/joint pain improved, % at 1 year | 71.0 | 67.0 | ns |
| Peterli 2012 | Hyperuricaemia cured, % at 1 year | 62.5 | 55.0 | ns |
| Peterli 2012 | Hyperuricaemia improved, % at 1 year | 37.5 | 45.0 | ns |
| Peterli 2012 | Depression cured, % at 1 year | 6.0 | 17.0 | ns |
| Peterli 2012 | Depression improved at 1 year | 83.0 | 78.0 | ns |
Comparison 3 Laparoscopic gastric bypass versus laparoscopic sleeve gastrectomy, Outcome 17 Comorbidities: other co‐morbidities.
| Study | Outcome | RYGB | BPD+switch | P value |
| Aasheim 2009 | BMI at 1 year, mean (SD) | 38.5 (4.0) | 32.5 (3.2) | P < 0.001 |
| Aasheim 2009 | BMI at 2 years, mean (95 % CI) | 37.5 (36.0 to 39.1) | 30.1 (28.5 to 31.7) | |
Comparison 4 Gastric bypass versus biliopancreatic diversion with duodenal switch, Outcome 1 Mean BMI [kg/m2].
| Study | Outcome | RYGB | BPD+switch | P value |
| Aasheim 2009 | BMI reduction at 1 year, mean (SD) | 16.3 (4.3) | 22.8 (4.7) | P < 0.001 |
| Aasheim 2009 | BMI reduction at 2 years, mean (95% CI) | 17.3 (15.7 to 19.0) | 24.8 (23.0 to 26.5) | Mean between‐group difference, 7.44 (95% CI 5.24 to 9.64); P < 0.001 |
| Hedberg 2012 | BMI reduction at 4 years, mean (SD) | 16.2 (4.9) | 23.2 (6.9) | |
| Hedberg 2012 | ||||
Comparison 4 Gastric bypass versus biliopancreatic diversion with duodenal switch, Outcome 2 Mean BMI reduction.

Comparison 4 Gastric bypass versus biliopancreatic diversion with duodenal switch, Outcome 3 Mean BMI reduction at study end.
| Study | Outcome | RYGB | BPD+switch | P value |
| Aasheim 2009 | % excess BMI lost at 1 year, mean (SD) | 54.4 (12.8) | 74.8 (11.2) | P < 0.001 |
| Hedberg 2012 | % excess BMI lost at 4 years, mean (SD) | 51 (23) | 80 (15) | P < 0.001 |
Comparison 4 Gastric bypass versus biliopancreatic diversion with duodenal switch, Outcome 4 Excess BMI loss [%].

Comparison 4 Gastric bypass versus biliopancreatic diversion with duodenal switch, Outcome 5 Excess BMI loss at study end.
| Study | Outcome | RYGB | BPD+switch | P value |
| Aasheim 2009 | Weight at 1 year, kg, mean (95% CI) | 110 (104 to 115) | 89.4 (84.1 to 94.8) | |
| Aasheim 2009 | Weight at 2 years, kg, mean (95% CI) | 111 (106 to 117) | 88.3 (82.6 to 93.9) | |
Comparison 4 Gastric bypass versus biliopancreatic diversion with duodenal switch, Outcome 6 Mean weight [kg].
| Study | Outcome | RYGB | BPD+switch | P value |
| Aasheim 2009 | Weight loss at 2 years, kg, mean (95% CI) | ‐50.6 (‐55.8 to ‐45.4) | ‐73.5 (‐79.0 to ‐68.1) | Mean between‐group change (95% CI): 23.0 (16.2 to 29.7); P < 0.001 |
Comparison 4 Gastric bypass versus biliopancreatic diversion with duodenal switch, Outcome 7 Weight loss in kg.
| Study | Outcome | RYGB | BPD+switch | P value |
| Aasheim 2009 | % of body weight loss at 2 years, mean (95% CI) | 31.2 (29.2 to 33.2) | 44.8 (42.8 to 46.8) | |
Comparison 4 Gastric bypass versus biliopancreatic diversion with duodenal switch, Outcome 8 Body weight loss [%].
| Study | Outcome | RYGB | BPD+switch | P value |
| Aasheim 2009 | Waist circumference at 1 year, cm, mean (95% CI) | 120 (116 to 123) | 105 (102 to 109) | |
| Aasheim 2009 | Waist circumference at 2 years, cm, mean (95% CI) | 115 (111 to 119) | 100 (96.0 to 104) | |
| Aasheim 2009 | Change in waist circumference at 2 years, cm, mean (95% CI) | ‐36.7 (‐41.0 to ‐32.4) | ‐51.5 (‐56.0 to ‐47.0) | Mean between‐group change (95% CI): 14.8 (9.29 to 20.3); P < 0.001 |
| Aasheim 2009 | Hip circumference at 1 year, cm, mean (95% CI) | 127 (124 to 130) | 116 (113 to 119) | |
| Aasheim 2009 | Hip circumference at 2 years, cm, mean (95% CI) | 124 (120 to 127) | 110 (106 to 113) | |
| Aasheim 2009 | Change in hip circumference at 2 years, cm, mean (95% CI) | ‐31.7 (‐35.7 to ‐27.8) | ‐45.6 (‐49.7 to ‐41.6) | Mean between‐group change (95% CI): 13.9 (9.07 to 18.8); P< 0.001 |
| Aasheim 2009 | Saggital diameter at 1 year, cm, mean (95% CI) | 25.9 (24.7 to 27.1) | 23.1 (21.8 to 24.3) | |
| Aasheim 2009 | Saggital diameter at 2 years, cm, mean (95% CI) | 24.5 (23.3 to 25.6) | 21.7 (20.6 to 22.8) | |
| Aasheim 2009 | Change in sagital diameter at 2 years, cm, mean (95% CI) | ‐11.8 (‐13.0 to ‐10.6) | ‐14.6 (‐15.8 to ‐13.4) | Mean between‐group change (95% CI): 2.78 (1.24 to 4.32); P < 0.001 |
| Hedberg 2012 | Failure to achieve > 50% of excess BMI loss, %, mean | 40.0 | 4.8 | P < 0.001 |
| Hedberg 2012 | ||||
| Hedberg 2012 | ||||
| Hedberg 2012 | ||||
| Hedberg 2012 | ||||
| Hedberg 2012 | ||||
| Hedberg 2012 | ||||
| Hedberg 2012 | ||||
| Hedberg 2012 | ||||
Comparison 4 Gastric bypass versus biliopancreatic diversion with duodenal switch, Outcome 9 Other weight change data.
| Study | SF‐36 domain | LRYGB | BPD+switch | Mean between group difference (CI); P value |
| Aasheim 2009 | Physical functioning change from baseline at 24 months, mean (95% CI) | 36.0 (27.9 to 44.0) | 32.9 (24.6 to 41.3) | 3.04 (‐5.45 to 11.5); P = 0.48 |
| Aasheim 2009 | Role limitations due to physical health problems change from baseline at 24 months, mean (95% CI) | 32.7 (20.3 to 45.0) | 22.3 (9.38 to 35.2) | 10.4 (‐3.51 to 24.3); P = 0.143 |
| Aasheim 2009 | Bodily pain change from baseline at 24 months, mean (95% CI) | 28.8 (18.9 to 38.8) | 8.63 (‐1.98 to 19.2) | 20.2 (6.71 to 33.7); P = 0.003 |
| Aasheim 2009 | General health perceptions change from baseline at 24 months, mean (95% CI) | 29.3 (21.2 to 37.4) | 27.0 (18.4 to 35.6) | 2.33 (‐8.24 to 12.9); P = 0.67 |
| Aasheim 2009 | Vitality change from baseline at 24 months, mean (95% CI) | 20.4 (11.3 to 29.4) | 19.9 (10.3 to 29.4) | 0.49 (‐11.4 to 12.4); P = 0.94 |
| Aasheim 2009 | Social functioning change from baseline at 24 months, mean (95% CI) | 14.6 (2.77 to 26.4) | 18.5 (6.12 to 30.9) | ‐3.92 (‐17.8 to 9.93); P = 0.58 |
| Aasheim 2009 | Role limitations due to emotional problems change from baseline at 24 months, mean (95% CI) | 12.6 (1.85 to 23.3) | 10.9 (‐0.47 to 22.3) | 1.67 (‐12.5 to 15.8); P = 0.82 |
| Aasheim 2009 | General mental health change from baseline at 24 months, mean (95% CI) | 4.09 (‐3.40 to 11.6) | 7.89 (‐0.06 to 15.8) | ‐3.80 (‐13.8 to 6.21); P = 0.46 |
Comparison 4 Gastric bypass versus biliopancreatic diversion with duodenal switch, Outcome 10 Health‐related quality of life: SF‐36.
| Study | Obesity‐related problems scale score | LRYGB | BPD+switch | Mean between group difference (CI); P value |
| Aasheim 2009 | Baseline, mean (95% CI) | 59.2 (50.3 to 68.1) | 61.4 (52.2 to 70.7) | Not reported |
| Aasheim 2009 | Mean change from baseline at 2 years, mean (95% CI) | ‐27.7 (‐37.1 to ‐18.3) | ‐32.5 (‐42.2 to ‐22.8) | 4.81 (‐8.69 to 18.3); P = 0.23 |
Comparison 4 Gastric bypass versus biliopancreatic diversion with duodenal switch, Outcome 11 Health‐related quality of life: Obesity‐related problems scale.
| Study | Outcome | RYGB | BPD+switch | P value |
| Hedberg 2012 | HbA1c < 5% at 3 years post‐surgery, % | 82 | 100 | ‐ |
Comparison 4 Gastric bypass versus biliopancreatic diversion with duodenal switch, Outcome 12 Co‐morbidities: diabetes.
| Study | Outcome | LRYGB | LDJB+SG | P value |
| Praveen Raj 2012 | Mean BMI at 12 months (SD) | 28.84 (1.57) | 28.19 (2.14) | P = 0.194 |
Comparison 5 Laparoscopic gastric bypass versus laparoscopic duodenojejunal bypass with sleeve gastrectomy, Outcome 1 Mean BMI [kg/m2].
| Study | Outcome | LRYGB | LDJB+SG | P value |
| Praveen Raj 2012 | Excess weight loss at 12 months, kg, mean (SD) | 53.21 (6.04) | 51.40 (8.37) | P = 0.303 |
Comparison 5 Laparoscopic gastric bypass versus laparoscopic duodenojejunal bypass with sleeve gastrectomy, Outcome 2 Excess weight loss [kg].
| Study | Outcome | LRYGB | LDJB+SG | P value |
| Praveen Raj 2012 | % EWL at 12 months, mean (SD) | 79.98 (4.77) | 81.94 (9.51) | P = 0.326 |
Comparison 5 Laparoscopic gastric bypass versus laparoscopic duodenojejunal bypass with sleeve gastrectomy, Outcome 3 Excess weight loss [%].
| Study | Outcome | LRYGB | LDJB+SG | P value |
| Praveen Raj 2012 | Complete remission of type 2 diabetes, n (%) at 12 months | 13/16 (81) | 16/20 (80) | ns |
| Praveen Raj 2012 | Improvement in type 2 diabetes, n (%) at 12 months | 3/16 (19) | 4/20 (20) | ns |
| Praveen Raj 2012 | Remission of hypertension, n (%) at 12 months | 9/12 (75) | 8/10 (80) | ns |
| Praveen Raj 2012 | Improvement in hypertension, n (%) at 12 months | 2/12 (17) | 0/10 | ns |
| Praveen Raj 2012 | No improvement in hypertension, n (%) at 12 months | 1/12 (8) | 2/10 (20) | ns |
Comparison 5 Laparoscopic gastric bypass versus laparoscopic duodenojejunal bypass with sleeve gastrectomy, Outcome 4 Comorbidites.
| Study | Outcome | LAGB | LISG | P value |
| Himpens 2006 | BMI decrease at 1 year, median (range) | 15.5 (5 to 39) | 25 (0 to 45) | P < 0.0001 |
| Himpens 2006 | BMI decrease at 3 years, median (range) | 18 (0 to 39) | 27.5 (0 to 48) | P = 0.0004 |
Comparison 6 Laparoscopic adjustable gastric banding versus laparoscopic isolated sleeve gastrectomy, Outcome 1 BMI decrease.
| Study | Outcome | LAGB | LISG | P value |
| Himpens 2006 | Weight loss at 1 year, kg, median (range) | 14 (‐5 to 38) | 26 (0 to 46) | P < 0.0001 |
| Himpens 2006 | Weight loss at 3 years, kg, median (range) | 17 (0 to 40) | 29.5 (1 to 48) | P < 0.0001 |
Comparison 6 Laparoscopic adjustable gastric banding versus laparoscopic isolated sleeve gastrectomy, Outcome 2 Weight loss [kg].
| Study | Outcome | LAGB | LISG | P value |
| Himpens 2006 | % EWL at 1 year, median (range) | 41.4 (‐11.8 to 130.5) | 57.7 (0 to 125.5) | P = 0.0004 |
| Himpens 2006 | % EWL at 3 years, median (range) | 48 (0 to 124.8) | 66 (‐3.1 to 152.4) | P = 0.0025 |
Comparison 6 Laparoscopic adjustable gastric banding versus laparoscopic isolated sleeve gastrectomy, Outcome 3 Excess weight loss [%].
| Study | Outcome | LAGB | LISG | P value |
| Himpens 2006 | Resolution of GERD, % | 83 | 75 | |
Comparison 6 Laparoscopic adjustable gastric banding versus laparoscopic isolated sleeve gastrectomy, Outcome 4 Comorbidities: other.
| Study | Outcome | Gastric imbrication | Sleeve gastrectomy | P value |
| Sharma 2013 | BMI, mean (SD) at 12 months | 35.3 (6.1) | 32.5 (5.8) | |
| Sharma 2013 | BMI, mean (SD) at 3 years | 36.9 (7.7) | 32.1 (5.9) | |
Comparison 7 Laparaoscopic gastric imbrication versus laparoscopic sleeve gastrectomy, Outcome 1 Mean BMI [kg/m2].
| Study | Outcome | Gastric imbrication | Sleeve gastrectomy | P value |
| Sharma 2013 | Excess weight loss (unit unclear) at 12 months, mean (SD) | 42.1 (13.0) | 53.8 (19.5) | |
| Sharma 2013 | Excess weight loss (unit unclear) at 3 years, mean (SD) | 39.5 (14.4) | 50.0 (20.3) | |
Comparison 7 Laparaoscopic gastric imbrication versus laparoscopic sleeve gastrectomy, Outcome 2 Excess weight loss.
| Surgery compared with no surgery for obesity | ||||||
| Patient or population: participants with obesity | ||||||
| Outcomes | No surgery | Surgery | Relative effect | No of participants | Quality of the evidence | Comments |
| BMI at study end [kg/m²] | See comment | See comment | Not estimablea | 582 | ⊕⊕⊕⊝ | The direction of the effect was consistently in favour of surgery |
| Health‐related quality of life | See comment | See comment | Not estimablea | 140 | ⊕⊕⊕⊝ | Improvements were seen in both studies for some aspects of health‐related quality of life but not others |
| Comobidities: diabetes | See comment | See comment | Not estimablea | 442 | ⊕⊕⊕⊝ | More people experienced remission of disease following surgery |
| Mortality Follow‐up: 12 to 24 months | See comment | See comment | Not estimablea | 478 (5) | ⊕⊕⊕⊝ | 5 of 7 studies reported data: no deaths occurred |
| Serious adverse events (SAEs) [%] Follow‐up: 12 to 24 months | See comment | See comment | Not estimablea | 438 (4) | ⊕⊝⊝⊝ | 4 of 7 studies reported data: SAEs ranged from 0% to 37% in the surgery group and from 0% to 25% in the no surgery group |
| Reoperations [%] Follow‐up: 12 to 24 months | See comment | See comment | Not estimablea | 470 (5) | ⊕⊝⊝⊝ | 5 studies reported data: 2% to 13% of participants in the surgery group underwent reoperations |
| *The basis for the assumed risk (e.g. the median control group risk across studies) is provided in footnotes. The corresponding risk (and its 95% confidence interval) is based on the assumed risk in the comparison group and the relative effect of the intervention (and its 95% CI). | ||||||
| GRADE Working Group grades of evidence | ||||||
| aStudies could not be pooled due to differences in participants, interventions (types of surgery), and comparators | ||||||
| Laparoscopic gastric bypass compared with laparoscopic adjustable gastric banding for obesity | ||||||
| Patient or population: participants with obesity | ||||||
| Outcomes | Illustrative comparative risks* (95% CI) | Relative effect | No of participants | Quality of the evidence | Comments | |
| Assumed risk | Corresponding risk | |||||
| Laparoscopic adjustable gastric banding | Laparoscopic gastric bypass | |||||
| BMI at study end [kg/m²] | The mean BMI at study end ranged across control groups from 36 to 37 | The mean BMI at study end in the intervention groups was 5.2 lower (6.4 to 4.0 lower) | ‐ | 265 | ⊕⊕⊕⊝ | ‐ |
| Health‐related quality of life | See comment | See comment | Not estimable | 250 | ⊕⊝⊝⊝ | Data not reported. Trial states that scores were comparable to US norms in both groups |
| Comorbidities:diabetes Follow‐up: 10 years | See comment | See comment | Not estimable | 51 | ⊕⊝⊝⊝ | Only one participant had diabetes at baseline, this was not observed after 5 years of follow‐up. |
| Mortality Follow‐up: 4 to 10 years | See comment | See comment | Not estimable | 301 (2) | ⊕⊕⊕⊝ | 2 studies reported data: 1 death was observed in the laparoscopic gastric bypass group |
| Serious adverse events (SAEs) | See comment | See comment | Not estimable | See comment | See comment | Not reported |
| Reoperations [%] Follow‐up: 4 to 10 years | See comment | See comment | Not estimable | 240 (2) | ⊕⊝⊝⊝ | 2 studies reported data: 12.6% to 28.6% vs 12.8% to 40.9% in the laparoscopic gastric bypass group vs laparoscopic adjustable gastric banding group, respectively |
| *The basis for the assumed risk (e.g. the median control group risk across studies) is provided in footnotes. The corresponding risk (and its 95% confidence interval) is based on the assumed risk in the comparison group and the relative effect of the intervention (and its 95% CI). | ||||||
| GRADE Working Group grades of evidence | ||||||
| aDowngraded by one level because of high or unclear risk of attrition bias | ||||||
| Laparoscopic gastric bypass compared with laparoscopic sleeve gastrectomy for obesity | ||||||
| Patient or population: participants with obesity | ||||||
| Outcomes | Illustrative comparative risks* (95% CI) | Relative effect | No of participants | Quality of the evidence | Comments | |
| Assumed risk | Corresponding risk | |||||
| Laparoscopic sleeve gastrectomy | Laparoscopic Roux‐en‐Y gastric bypass | |||||
| BMI at study end [kg/m²] | The mean BMI at study end ranged across control groups from 27 to 33 | The mean BMI at study end in the intervention groups was 0.2 lower (1.8 lower to 1.3 higher) | ‐ | 353 | ⊕⊕⊝⊝ | ‐ |
| Health‐related quality of life | See comment | See comment | ‐ | 217 | ⊕⊝⊝⊝ | Interim analysis showed no statistically significant differences between groups |
| Comorbidities: diabetes | See comment | See comment | Not estimable | 353 | ⊕⊕⊝⊝ | Diabetes was reported in different ways by the studies but no relevant difference between groups was found |
| Mortality Follow‐up: 12 to 36 months | See comment | See comment | Not estimable | 600 (6) | ⊕⊕⊕⊝ | 6 studies reported data: 1 death was observed in the laparoscopic Roux‐en‐Y gastric bypass group |
| Serious adverse events (SAEs) [%] Follow‐up: 12 months | See comment | See comment | Not estimable | 217 (1) | ⊕⊝⊝⊝ | 1 study reported data: 4.5% in the laparoscopic gastric bypass group and 0.9% in the laparoscopic sleeve gastrectomy group |
| Reoperations [%] Follow‐up: 12 months | See comment | See comment | Not estimable | 277 (2) | ⊕⊝⊝⊝ | 2 of 6 studies reported data: 6.7% to 23.6% in the laparoscopic gastric bypass group and 3.3% to 33.6% in the laparoscopic sleeve gastrectomy group |
| *The basis for the assumed risk (e.g. the median control group risk across studies) is provided in footnotes. The corresponding risk (and its 95% confidence interval) is based on the assumed risk in the comparison group and the relative effect of the intervention (and its 95% CI). | ||||||
| GRADE Working Group grades of evidence | ||||||
| aDowngraded by two levels because of inconsistency, imprecision and some trials showing attrition bias | ||||||
| Gastric bypass compared with biliopancreatic diversion with duodenal switch for obesity | ||||||
| Patient or population: participants with obesity | ||||||
| Outcomes | Illustrative comparative risks* (95% CI) | Relative effect | No of participants | Quality of the evidence | Comments | |
| Assumed risk | Corresponding risk | |||||
| Biliopancreatic diversion with duodenal switch | Gastric bypass | |||||
| BMI reduction at study end [kg/m²] | The mean BMI reduction at study end ranged across control groups from 23 to 25 | The mean BMI reduction at study end in the intervention groups was 7.3 lower (9.3 lower to 5.4 lower) | ‐ | 107 (2) | ⊕⊕⊕⊝ | ‐ |
| Health‐related quality of life Follow‐up: 24 months | See comment | See comment | Not estimable | 60 | ⊕⊝⊝⊝ | Only 1 of 8 SF‐36 domains showed a statistically significant difference in favour of gastric bypass |
| Comorbidities: diabetes | See comment | See comment | Not estimable | 60 | ⊕⊝⊝⊝ | Three years after surgery 82% to 100% of participants had an HbA1c < 5% |
| Mortality Follow‐up: 24 to 48 months | See comment | See comment | Not estimable | 107 (2) | ⊕⊕⊕⊝ | One death was observed in the open biliopancreatic diversion with duodenal switch group |
| Serious adverse events (SAEs) | See comment | See comment | Not estimable | See comment | See comment | Not reported |
| Reoperations [%] Follow‐up: 24 to 48 months | See comment | See comment | Not estimable | 107 (2) | ⊕⊝⊝⊝ | Both studies reported data: 4.3% to 16.1% vs 8.3% to 27.6% in the gastric bypass group vs biliopancreatic diversion with duodenal switch group, respectively |
| *The basis for the assumed risk (e.g. the median control group risk across studies) is provided in footnotes. The corresponding risk (and its 95% confidence interval) is based on the assumed risk in the comparison group and the relative effect of the intervention (and its 95% CI). | ||||||
| GRADE Working Group grades of evidence | ||||||
| aDowngraded by one level because of few trials and participants, and risk of 'other' bias | ||||||
| Laparoscopic gastric bypass compared with laparoscopic duodenojejunal bypass with sleeve gastrectomy for obesity | ||||||
| Patient or population: participants with obesity | ||||||
| Outcomes | Illustrative comparative risks* (95% CI) | Relative effect | No of participants | Quality of the evidence | Comments | |
| Assumed risk | Corresponding risk | |||||
| Laparoscopic duodenojejunal bypass with sleeve gastrectomy | Laparoscopic gastric bypass | |||||
| BMI at study end [kg/m²] | The mean BMI at study end in the control group was | The mean BMI at study end in the intervention group was 0.7higher (0.3 lower to 1.6 higher) | ‐ | 57 | ⊕⊝⊝⊝ | ‐ |
| Health‐related quality of life | See comment | See comment | Not estimable | See comment | See comment | |
| Comorbiditites: diabetes | See comment | See comment | Not estimable | 57 | ⊕⊝⊝⊝ | Reports no difference in complete or partial remission of diabetes in those with diabetes at baseline |
| Mortality | See comment | See comment | Not estimable | 57 | ⊕⊝⊝⊝ | No deaths in either group were reported |
| Serious adverse events (SAEs) | See comment | See comment | Not estimable | See comment | See comment | Not reported |
| Reoperations [%] | See comment | See comment | Not estimable | See comment | See comment | Not reported |
| *The basis for the assumed risk (e.g. the median control group risk across studies) is provided in footnotes. The corresponding risk (and its 95% confidence interval) is based on the assumed risk in the comparison group and the relative effect of the intervention (and its 95% CI). | ||||||
| GRADE Working Group grades of evidence | ||||||
| aDowngraded by three levels due to one trial only with few participants and unclear risk of bias across all domains | ||||||
| Laparoscopic adjustable gastric banding compared with laparoscopic isolated sleeve gastrectomy for obesity | ||||||
| Patient or population: participants with obesity | ||||||
| Outcomes | Illustrative comparative risks* (95% CI) | Relative effect | No of participants | Quality of the evidence | Comments | |
| Assumed risk | Corresponding risk | |||||
| Laparoscopic isolated sleeve gastrectomy | Laparoscopic adjustable gastric banding | |||||
| Reduction in BMI [kg/m²] | The mean reduction in BMI in the control group was | The mean reduction in BMI in the intervention group was | ‐ | 80 | ⊕⊝⊝⊝ | ‐ |
| Health‐related quality of life | See comment | See comment | Not estimable | See comment | See comment | Not reported |
| Comorbidities: diabetes | See comment | See comment | Not estimable | See comment | See comment | Not reported |
| Mortality | See comment | See comment | Not estimable | See comment | See comment | Not reported |
| Serious adverse events (SAEs) | See comment | See comment | Not estimable | See comment | See comment | Not reported |
| Reoperations [%] Follow‐up: mean 36 months | See comment | See comment | Not estimable | 80 (1) | ⊕⊝⊝⊝ | 20% in the laparoscopic gastric banding group and 10% in the laparoscopic isolated sleeve gastrectomy group |
| *The basis for the assumed risk (e.g. the median control group risk across studies) is provided in footnotes. The corresponding risk (and its 95% confidence interval) is based on the assumed risk in the comparison group and the relative effect of the intervention (and its 95% CI). | ||||||
| GRADE Working Group grades of evidence | ||||||
| aTrial reports median (range), P = 0.0004 | ||||||
| Laparaoscopic gastric imbrication compared with laparoscopic sleeve gastrectomy for obesity | ||||||
| Patient or population: participants with obesity | ||||||
| Outcomes | Illustrative comparative risks* (95% CI) | Relative effect | No of participants | Quality of the evidence | Comments | |
| Assumed risk | Corresponding risk | |||||
| Laparoscopic sleeve gastrectomy | Laparaoscopic gastric imbrication | |||||
| BMI at study end [kg/m²] | The mean BMI at study end in the control group was 32.1 | The mean BMI at study end in the intervention group was 4.8 higher (0.1 lower to 9.7 higher) | ‐ | 30 | ⊕⊝⊝⊝ | ‐ |
| Health‐related quality of life | See comment | See comment | Not estimable | See comment | See comment | Not reported |
| Comorbidities | See comment | See comment | Not estimable | See comment | See comment | Not reported |
| Mortality Follow‐up: mean 36 months | See comment | See comment | Not estimable | 30 | ⊕⊝⊝⊝ | No deaths occurred |
| Serious adverse events (SAEs) | See comment | See comment | Not estimable | See comment | See comment | Not reported |
| Reoperations [%] Follow‐up: mean 36 months | See comment | See comment | Not estimable | 30 | ⊕⊝⊝⊝ | 2 (16.7%) participants in the laparoscopic gastric imbrication group |
| *The basis for the assumed risk (e.g. the median control group risk across studies) is provided in footnotes. The corresponding risk (and its 95% confidence interval) is based on the assumed risk in the comparison group and the relative effect of the intervention (and its 95% CI). | ||||||
| GRADE Working Group grades of evidence | ||||||
| aDowngraded by three levels due to one trial only with few participants, and high risk of 'other' bias and unclear risk of bias across the other domains | ||||||
| Intervention(s) and comparator(s) | Screened/eligible | Randomised | ITT | Finishing study | Randomised finishing study | Follow‐up | |
| (1) Angrisani 2007 | Laparoscopic Roux‐en‐Y gastric bypass | 24 | N/A | 21 | 87.5 | 10 years | |
| Laparoscopic adjustable gastric banding | 27 | N/A | 22a | 81.5 | |||
| total: | ‐ | 51 | N/A | 43 | 84.3 | ||
| (2) Aasheim 2009 | Laparoscopic Roux‐en‐Y gastric bypass | 31 | N/A | 31 | 100 | 2 years | |
| Laparoscopic biliopancreatic diversion with duodenal switch | 29 | N/A | 27 | 93.1 | |||
| total: | 64 | 60 | N/A | 58 | 96.7 | ||
| (3) Demerdash 2013 | Laparoscopic Roux‐en‐Y gastric bypass | ‐ | N/A | 16 | ‐ | 1 year | |
| Laparoscopic adjustable gastric band | ‐ | N/A | 18 | ‐ | |||
| total: | ‐ | 40 | 34 | 85 | |||
| (4) Dixon 2008 | Laparoscopic gastric banding in addition to the conventional therapy | 30 | 30 | 29 | 96.7 | 2 years | |
| Conventional therapy | 30 | 30 | 26 | 86.7 | |||
| total: | 158 | 60 | 60 | 55 | 91.7 | ||
| (5) Dixon 2012 | Laparoscopic adjustable gastric banding and lifestyle programme | 30 | 30 | 28 | 93.3 | 2 years | |
| 2‐year conventional weight loss programme and lifestyle programme | 30 | 30 | 26 | 86.7 | |||
| total: | 130 | 60 | 60 | 54 | 90 | ||
| (6) Hedberg 2012 | Open biliopancreatic diversion with duodenal switch | 24 | N/A | 21 | 87.5 | 4 years | |
| Open Roux‐en‐Y gastric bypass | 23 | N/A | 20 | 87 | |||
| total: | 99 | 47 | N/A | 41 | 87.2 | ||
| (7) Himpens 2006 | Laparoscopic gastric banding | 40 | ‐ | ‐ | ‐ | 3 years | |
| Laparascopic isolated sleeve gastrectomy | 40 | ‐ | ‐ | ‐ | |||
| total: | ‐ | 80 | N/A | ‐ | ‐ | ||
| (8) Ikramuddin 2013 | Laparoscopic Roux‐en‐Y gastric bypass + lifestyle programme with medical management | 60 | 60 | 57b | 95 | 1 year | |
| Lifestyle programme with medical management | 60 | 60 | 57b | 95 | |||
| total: | 2648 | 120 | 120 | 114 | 95 | ||
| (9) Karamanakos 2008 | Laparoscopic Roux‐en‐Y gastric bypass | 30 | N/A | 29 | 96.7 | 3 years | |
| Laparoscopic sleeve gastrectomy | 30 | N/A | 28 | 93.3 | |||
| total: | 60 | 60 | N/A | 57 | 95 | ||
| (10) Keidar 2013 | Laporoscopic Roux‐en‐Y gastric bypass | 22 | N/A | 19 | 86.4 | 1 year | |
| Laparoscopic sleeve gastrectomy | 19 | N/A | 18 | 94.7 | |||
| total: | ‐ | 41 | N/A | 37 | 90.2 | ||
| (11) Lee 2011 | Simplified laparoscopic mini‐gastric bypass with duodenum exclusion | 30 | 30 | 30 | 100 | 1 year | |
| Laparoscopic sleeve gastrectomy without duodenum exclusion | 30 | 30 | 30 | 100 | |||
| total: | 209 | 60 | 60 | 60 | 100 | ||
| (12) Liang 2013 | Usual care | 36 | N/A | 36 | 100 | 1 year | |
| Usual care + exenatide | 36 | N/A | 34 | 94.4 | |||
| Laparoscopic Roux‐en‐Y gastric bypass | 36 | N/A | 31 | 86.1 | |||
| total: | ‐ | 108 | N/A | 101 | 93.5 | ||
| (13) Mingrone 2012 | Gastric bypass | 20 | N/A | 19 | 95 | 2 years | |
| Medical therapy | 20 | N/A | 18 | 90 | |||
| total: | 72 | 40 | N/A | 37 | 92.5 | ||
| (14) Nguyen 2009 | Laparoscopic Roux‐en‐Y gastric bypass | 125 | N/A | 71 | 56.8 | 4 years | |
| Laparoscopic adjustable gastric banding | 125 | N/A | 30 | 24 | |||
| total: | ‐ | 250 | N/A | 101 | 40.4 | ||
| (15) Nogués 2010 | Laparascopic Roux‐en‐Y gastric bypass | 7 | 7 | 7 | 100 | 1 year | |
| Laparoscopic sleeve gastrectomy | 8 | 8 | 8 | 100 | |||
| total: | 30 | 15 | 15 | 15 | 100 | ||
| (16) O'Brien 2006 | Laparoscopic adjustable gastric band | 40 | N/A | 39 | 97.5 | 2 years | |
| Intensive non‐surgical programme | 40 | N/A | 40 | 100 | |||
| total: | 158 | 80 | N/A | 79 | 98.8 | ||
| (17) Paluszkiewicz 2012 | Open Roux‐en‐Y gastric bypass | 36 | ‐ | 35 | 97.2 | 1 year | |
| Laparoscopic sleeve gastrectomy | 36 | ‐ | 34 | 94.4 | |||
| total: | 86 | 72 | ‐ | 69 | 95.8 | ||
| (18) Peterli 2012 | Laparoscopic Roux‐en‐Y gastric bypass | 110 | N/A | N/A | N/A | 3 years | |
| Laparoscopic sleeve gastrectomy | 107 | N/A | N/A | N/A | |||
| total: | ‐ | 217c | N/A | N/Ad | N/A | ||
| (19) Praveen Raj 2012 | Laparoscopic duodenojejunal bypass with sleeve gastrectomy | 28 | ‐ | ‐ | ‐ | 1 year | |
| Laparoscopic Roux‐en‐Y gastric bypass | 29 | ‐ | ‐ | ‐ | |||
| total: | ‐ | 57 | ‐ | ‐ | ‐ | ||
| (20) Schauer 2012 | Intensive medical therapy alone | 50 | N/A | 41 | 82 | 1 year | |
| Intensive medical therapy plus laparoscopic Roux‐en‐Y gastric bypass | 50 | N/A | 50 | 100 | |||
| Intensive medical therapy plus laparoscopic sleeve gastrectomy | 50 | N/A | 49 | 98 | |||
| total: | 218 | 150 | N/A | 140 | 93.3 | ||
| (21) Sharma 2013 | Laparoscopic gastric imbrication | ‐ | 15 | N/A | 12 | 80 | 3 years |
| Laparoscopic sleeve gastrectomy | ‐ | 15 | N/A | 14 | 93.3 | ||
| total: | ‐ | 30 | N/A | 26 | 86.7 | ||
| (22) Vix 2013 | Laparoscopic Roux‐en‐Y gastric bypass | 45 | N/A | 44 | 97.8 | 1 year | |
| Laparoscopic sleeve gastrectomy | 55 | N/A | 48 | 87.3 | |||
| total: | 410 | 100 | N/A | 92e | 92 | ||
| Grand total | All surgical interventions | 1496 | |||||
| All non‐surgical comparators | 302 | ||||||
| All surgical interventions and non‐surgical comparators | 1798 | ||||||
| "‐" denotes not reported aNine patients with band removal excluded from analysis at 10 years (therefore 13 patients included at 10 years) ITT: intention‐to‐treat; N/A: not applicable | |||||||
| Outcome or subgroup title | No. of studies | No. of participants | Statistical method | Effect size |
| 1 Mean BMI [kg/m2] Show forest plot | Other data | No numeric data | ||
| 2 Mean BMI at study end Show forest plot | 5 | Mean Difference (IV, Random, 95% CI) | Totals not selected | |
| 3 BMI reduction Show forest plot | Other data | No numeric data | ||
| 4 Weight [kg] Show forest plot | Other data | No numeric data | ||
| 5 Mean weight at study end Show forest plot | 4 | Mean Difference (IV, Random, 95% CI) | Totals not selected | |
| 6 Weight loss [kg] Show forest plot | Other data | No numeric data | ||
| 7 Weight loss at study end Show forest plot | 3 | 260 | Mean Difference (IV, Random, 95% CI) | 21.27 [18.93, 23.61] |
| 8 Initial weight loss [%] Show forest plot | Other data | No numeric data | ||
| 9 Initial weight loss at study end Show forest plot | 5 | Mean Difference (IV, Random, 95% CI) | Totals not selected | |
| 10 Excess weight loss [%] Show forest plot | Other data | No numeric data | ||
| 11 % excess weight loss at study end Show forest plot | 2 | Mean Difference (IV, Random, 95% CI) | Totals not selected | |
| 12 Other weight change data Show forest plot | Other data | No numeric data | ||
| 13 Health‐related quality of life Show forest plot | Other data | No numeric data | ||
| 14 Comorbitidies: diabetes Show forest plot | Other data | No numeric data | ||
| 15 Comorbitidies: hypertension Show forest plot | Other data | No numeric data | ||
| 16 Comorbitidies: metabolic syndrome Show forest plot | Other data | No numeric data | ||
| 17 Comorbitidies: Lipids Show forest plot | Other data | No numeric data | ||
| 18 Comorbitidies: Sleep Show forest plot | Other data | No numeric data | ||
| Outcome or subgroup title | No. of studies | No. of participants | Statistical method | Effect size |
| 1 Mean BMI [kg/m2] Show forest plot | Other data | No numeric data | ||
| 2 Mean BMI at study end Show forest plot | 3 | 265 | Mean Difference (IV, Random, 95% CI) | ‐5.21 [‐6.39, ‐4.03] |
| 3 Mean weight [kg] Show forest plot | Other data | No numeric data | ||
| 4 Excess weight loss [%] Show forest plot | Other data | No numeric data | ||
| 5 Excess weight loss at study end [%] Show forest plot | 2 | 135 | Mean Difference (IV, Random, 95% CI) | 23.02 [13.56, 32.48] |
| 6 Other weight change data Show forest plot | Other data | No numeric data | ||
| Outcome or subgroup title | No. of studies | No. of participants | Statistical method | Effect size |
| 1 Mean BMI [kg/m2] Show forest plot | Other data | No numeric data | ||
| 2 Mean BMI at study end Show forest plot | 6 | 353 | Mean Difference (IV, Random, 95% CI) | ‐0.23 [‐1.78, 1.33] |
| 3 BMI reduction Show forest plot | Other data | No numeric data | ||
| 4 BMI reduction at 12 months Show forest plot | 2 | 114 | Mean Difference (IV, Random, 95% CI) | 1.79 [‐0.34, 3.93] |
| 5 Mean weight [kg] Show forest plot | Other data | No numeric data | ||
| 6 Mean weight at study end Show forest plot | 5 | 293 | Mean Difference (IV, Random, 95% CI) | 1.23 [‐2.03, 4.48] |
| 7 Weight loss [kg] Show forest plot | Other data | No numeric data | ||
| 8 Mean weight loss at 12 months Show forest plot | 3 | 146 | Mean Difference (IV, Random, 95% CI) | 4.09 [‐3.31, 11.49] |
| 9 Excess weight loss [%] Show forest plot | Other data | No numeric data | ||
| 10 Other weight change data Show forest plot | Other data | No numeric data | ||
| 11 Health related quality of life Show forest plot | Other data | No numeric data | ||
| 12 Comorbidities: diabetes Show forest plot | Other data | No numeric data | ||
| 13 Comorbidities: hypertension Show forest plot | Other data | No numeric data | ||
| 14 Comorbidities: dyslipidaemia Show forest plot | Other data | No numeric data | ||
| 15 Comorbidities: metabolic syndrome Show forest plot | Other data | No numeric data | ||
| 16 Comorbidities: sleep Show forest plot | Other data | No numeric data | ||
| 17 Comorbidities: other co‐morbidities Show forest plot | Other data | No numeric data | ||
| Outcome or subgroup title | No. of studies | No. of participants | Statistical method | Effect size |
| 1 Mean BMI [kg/m2] Show forest plot | Other data | No numeric data | ||
| 2 Mean BMI reduction Show forest plot | Other data | No numeric data | ||
| 3 Mean BMI reduction at study end Show forest plot | 2 | 107 | Mean Difference (IV, Random, 95% CI) | ‐7.34 [‐9.25, ‐5.43] |
| 4 Excess BMI loss [%] Show forest plot | Other data | No numeric data | ||
| 5 Excess BMI loss at study end Show forest plot | 2 | 107 | Mean Difference (IV, Random, 95% CI) | ‐23.38 [‐31.40, ‐15.36] |
| 6 Mean weight [kg] Show forest plot | Other data | No numeric data | ||
| 7 Weight loss in kg Show forest plot | Other data | No numeric data | ||
| 8 Body weight loss [%] Show forest plot | Other data | No numeric data | ||
| 9 Other weight change data Show forest plot | Other data | No numeric data | ||
| 10 Health‐related quality of life: SF‐36 Show forest plot | Other data | No numeric data | ||
| 11 Health‐related quality of life: Obesity‐related problems scale Show forest plot | Other data | No numeric data | ||
| 12 Co‐morbidities: diabetes Show forest plot | Other data | No numeric data | ||
| Outcome or subgroup title | No. of studies | No. of participants | Statistical method | Effect size |
| 1 Mean BMI [kg/m2] Show forest plot | Other data | No numeric data | ||
| 2 Excess weight loss [kg] Show forest plot | Other data | No numeric data | ||
| 3 Excess weight loss [%] Show forest plot | Other data | No numeric data | ||
| 4 Comorbidites Show forest plot | Other data | No numeric data | ||
| Outcome or subgroup title | No. of studies | No. of participants | Statistical method | Effect size |
| 1 BMI decrease Show forest plot | Other data | No numeric data | ||
| 2 Weight loss [kg] Show forest plot | Other data | No numeric data | ||
| 3 Excess weight loss [%] Show forest plot | Other data | No numeric data | ||
| 4 Comorbidities: other Show forest plot | Other data | No numeric data | ||
| Outcome or subgroup title | No. of studies | No. of participants | Statistical method | Effect size |
| 1 Mean BMI [kg/m2] Show forest plot | Other data | No numeric data | ||
| 2 Excess weight loss Show forest plot | Other data | No numeric data | ||