Momento óptimo para el reemplazo del equipo de administración intravascular
Resumen
Antecedentes
La venoclisis (equipo de administración) conectada a los catéteres venosos y arteriales puede contribuir a la bacteriemia y a otras infecciones. La tasa de infección se puede aumentar o reducir con el reemplazo regular de los equipos de administración. Esta revisión fue publicada originalmente en 2005 y se actualizó en 2012.
Objetivos
El objetivo de esta revisión fue identificar cualquier relación entre la frecuencia en la que se reemplazan los equipos de administración y las tasas de colonización microbiana, infección y muerte.
Métodos de búsqueda
Se realizaron búsquedas en el Registro Cochrane Central de Ensayos Controlados (Cochrane Central Register of Controlled Trials) (CENTRAL) (The Cochrane Library 2012, número 6), MEDLINE (1950 hasta junio de 2012), CINAHL (1982 hasta junio de 2012), EMBASE (1980 hasta junio de 2012), listas de referencias de los ensayos identificados y bibliografías de revisiones publicadas. La búsqueda original se realizó en febrero de 2004. También se estableció contacto con investigadores de este tema. No se aplicaron restricciones de idioma.
Criterios de selección
Se incluyeron todos los ensayos clínicos aleatorios o controlados sobre la frecuencia de reemplazo del equipo de administración de los catéteres venosos o arteriales en participantes hospitalizados.
Obtención y análisis de los datos
Dos revisores evaluaron todos los estudios potencialmente relevantes. Los desacuerdos entre los dos revisores se resolvieron mediante discusión con un tercer revisor. Se obtuvieron datos de siete resultados: infección relacionada con el catéter; infección relacionada con la infusión; colonización microbiana de la infusión; colonización microbiana del catéter; bacteriemia por todas las causas; mortalidad; y costo. Se agruparon los resultados de los estudios que compararon diferentes frecuencias de reemplazo del equipo de administración, por ejemplo, se agruparon los estudios que compararon el reemplazo ≥ cada 96 horas versus cada 72 horas con los estudios que compararon el reemplazo ≥ cada 48 horas versus cada 24 horas.
Resultados principales
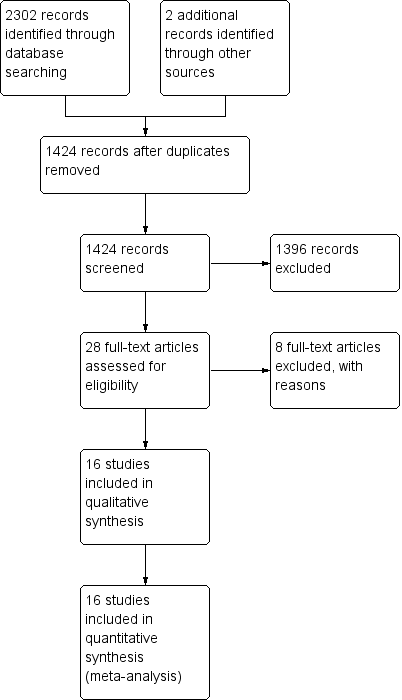
Para esta actualización de la revisión se identificaron 26 estudios, diez de los cuales se excluyeron; seis no cumplieron los criterios de inclusión y cuatro no informaron datos utilizables. Se extrajeron datos de las 18 referencias restantes (16 estudios) con 5001 participantes: los diseños de los estudios incluyeron poblaciones de neonatos y adultos, equipos de administración arteriales y venosos, nutrición parenteral, emulsiones de lípidos e infusiones cristaloides. En su mayoría los estudios tuvieron un riesgo de sesgo moderado a alto o no describieron adecuadamente los métodos que utilizaron para disminuir el sesgo. En ninguno de los ensayos incluidos fue posible cegar al personal debido a la naturaleza de la intervención.
No se encontraron pruebas de diferencias en la bacteriemia ni la infección micótica relacionadas con el catéter o con la infusión con el reemplazo más frecuente del equipo de administración en la comparación general o a cualquier intervalo de tiempo (cociente de riesgos [CR] 1,06; intervalo de confianza [IC] del 95%: 0,67 a 1,69; CR 0,67; IC del 95%: 0,27 a 1,70). El reemplazo poco frecuente del equipo de administración redujo la tasa de bacteriemia (CR 0,73; IC del 95%: 0,54 a 0,98). No hubo pruebas de diferencias en la colonización del catéter ni la colonización de la infusión con el reemplazo más frecuente del equipo de administración (CR 1,08; IC del 95%: 0,94 a 1,24; CR 1,15; IC del 95%: 0,70 a 1,86; respectivamente). Pruebas marginales indicaron que el reemplazo poco frecuente del equipo de administración aumentó la tasa de mortalidad sólo dentro de la población neonatal (CR 1,84; IC del 95%: 1,00 a 3,36). No hubo pruebas de interacciones entre (la falta de) los efectos de la frecuencia de reemplazo del equipo de administración y los subgrupos analizados: nutrición parenteral o emulsiones de lípidos versus infusiones que no incluían la nutrición parenteral o las emulsiones de lípidos; participantes adultos versus neonatales; y catéteres arteriales versus venosos.
Conclusiones de los autores
Algunas pruebas indican que los equipos de administración que no contienen lípidos, sangre o productos derivados de la sangre pueden permanecer insertados durante intervalos de hasta 96 horas sin aumentar el riesgo de infección. Otras pruebas indican que la mortalidad aumentó dentro de la población neonatal con el reemplazo poco frecuente del equipo de administración. Sin embargo, muchas de las pruebas obtenidas se derivaron de estudios de calidad baja a moderada.
PICO
Resumen en términos sencillos
Momento óptimo para el reemplazo del equipo de administración intravascular
La venoclisis (equipo de administración) conectada a los catéteres venosos y arteriales puede contribuir a la bacteriemia. La tasa de infección se puede aumentar o reducir mediante el reemplazo programado de los equipos de administración.
El objetivo de esta revisión fue identificar cualquier asociación entre la frecuencia en la que se reemplazaron los equipos de administración y las tasas de colonización microbiana, bacteriemia y muerte.
Se hicieron búsquedas en bases de datos (CENTRAL, MEDLINE, CINAHL y EMBASE) hasta junio de 2012. Se identificaron 16 estudios con 5001 participantes para inclusión en esta revisión actualizada. No hay pruebas que indiquen que la bacteriemia fue más o menos probable con cambios más frecuentes, aunque la calidad de los ensayos incluidos fue baja a moderada. Algunas pruebas indican que la mortalidad aumentó en los neonatos que recibían nutrición parenteral cuando el reemplazo del equipo de administración fue menos frecuente.
Authors' conclusions
Summary of findings
| Primary analysis: less versus more frequent for intravenous administration set replacement | ||||||
| Patient or population: patients with intravenous administration set replacement | ||||||
| Outcomes | Illustrative comparative risks | Relative effect | No. of participants | Quality of the evidence | Comments | |
| Assumed risk | Corresponding risk | |||||
| More frequent AS replacement | Less frequent AS replacement | |||||
| Catheter‐related BSI as defined using criteria specified by Maki 2006; Mermel 2009; and O'Grady 2002 | 33 of 932 participants (3.5%) developed a catheter‐related BSI | 35 of 862 participants (4.1%) developed a catheter‐related BSI | RR 1.06 (0.66 to 1.68) | 1794 (8 studies) | ⊕⊕⊝⊝ | |
| Infusate‐related BSI as defined using criteria specified by O'Grady 2002 | 9 of 945 participants (0.95%) developed an infusate‐related BSI | 11 of 902 participants (1.2%) developed an infusate‐related BSI | RR 0.69 | 1847 | ⊕⊕⊝⊝ | |
| Infusate colonization any positive quantitative culture of infusate | 27 infusates, of a total of 808 (3.3%), were colonized | 29 infusates, of a total of 741 (3.9%), were colonized | RR 1.15 | 1549 | ⊕⊕⊝⊝ | |
| Catheter colonization any positive semiquantitative or quantitative culture from the distal catheter segment | 240 catheters, of a total of 717 (33.4%), were colonized | 266 catheters, of a total of 731 (36.4%), were colonized | RR 1.08 | 1448 | ⊕⊕⊕⊝ | |
| All‐cause BSI any positive blood culture drawn from a peripheral vein taken whilst the IVD is in situ, or within 48 hours of removal (O'Grady 2002) | 82 of 1135 participants (7.2%) developed a BSI from any cause | 69 of 1162 participants (5.9%) developed a BSI from any cause | RR 0.82 | 2297 | ⊕⊕⊝⊝ | |
| Mortality | 11 of 303 neonatal ICU participants died (3.6%) during their admission to the hospital | 77 of 1052 neonatal ICU participants died (7.3%) during their admission to the hospital | RR 1.85 | 1355 | ⊕⊕⊝⊝ | |
| CI: confidence interval; RR: risk ratio. | ||||||
| GRADE Working Group grades of evidence: | ||||||
| aThe proportion of information from studies at high or unclear risk of bias is sufficient to affect the interpretation of results. | ||||||
Background
Description of the condition
Intravascular catheters are plastic tubes inserted into a vein for the purpose of monitoring pressure, sampling blood or delivering fluid, nutrition and medication, or into an artery for the purpose of monitoring pressure or flow. Catheters are usually connected to an administration set that is an assembly of some or all of the following: tubing, fluid containers, pressure monitoring transducers, blood sampling ports, measuring burettes and extension tubing. Intravascular catheters break the skin and are the single most important cause of healthcare‐acquired bloodstream infection. About 250,000 to 500,000 catheter‐related infections occur each year in the United States alone, and 5000 cases are reported in Australia (Collignon 1994; Maki 2006). Bacteraemias and fungaemias are associated with increased mortality and substantially increased hospital stay by up to 20 days and costs by US$56,000 per episode (Al‐Rawajfah 2012; Maki 2006; Renaud 2001; Soufir 1999).
The type of catheter, infusate and patient may affect the rate and incidence of bloodstream infection. A systematic review of observational studies by Maki 2006 reported that rates and incidences of catheter‐related infection were lowest with peripheral intravenous catheters (0.1%, 0.5 per 1000 catheter‐days) and midline catheters (0.4%, 0.2 per 1000 catheter‐days), and that higher rates were seen with short‐term uncuffed and central venous catheters that do not have antimicrobial impregnation (4.4%, 2.7 per 1000 catheter‐days). Arterial catheters used for haemodynamic monitoring (0.8%, 1.7 per 1000 catheter‐days) and peripherally inserted central catheters (2.4%, 2.1 per 1000 catheter‐days) posed similar risks for those with short‐term conventional central catheters. Medicated, cuffed and tunnelled dual‐lumen central catheters were associated with considerably lower rates of catheter‐related infection.
Description of the intervention
Clinicians traditionally schedule administration set replacement every three or four days. Each replacement costs nursing time and up to US$275 for equipment (Rickard 2001). The frequency of set replacement has gradually fallen since 1971, as supporting research has been published.
How the intervention might work
Scheduled replacement of administration sets, contaminated through clinical use, may prevent patient infection. Catheter‐related bacteraemias (bacterial infections of the blood) are thought to stem from one of four sources: skin bacteria colonizing the catheter on or after insertion; administration fluid contaminated before connection to the patient; colonization of the hub connecting the catheter to the administration set; or bacteria contaminating the catheter (O'Grady 2011). Bacteraemias within seven days of catheter insertion probably arise from the patient's skin, after which time bacteraemias from hub contamination become more common (Crump 2000). Contaminated fluid and seeding via the blood are thought to be rare. Bacteria and fungi require time to reproduce and spread (Crump 2000), thus more frequent scheduled administration set replacement may prevent infection. However, the contact of clinicians during the scheduled administration set replacement provides an opportunity for contamination, supporting a counter‐argument for infrequent changes (O'Malley 1994).
The rate of infusate microbial colonization and the subsequent rate of bacteraemia or fungaemia (fungal infection of the blood) may be higher if the infusate supports microbial proliferation. Parenteral nutrition, with its high glucose content, has been associated with higher rates of catheter‐related infection in retrospective and prospective cohort studies (Ishizuka 2008; Moro 1994; Mulloy 1991; Perlman 2007). The schedule for set replacement that minimizes infection might be different for lipid emulsion infusates (e.g. propofol, vitalipid), as they are particularly well suited to the growth of a wide range of micro‐organisms (Gilbert 1986; Scott 1985; Sherertz 1992; Shiro 1995).
Why it is important to do this review
Intravascular catheters are associated with infection, which in turn may cause death (Renaud 2001; Soufir 1999) and significant cost (Al‐Rawajfah 2012). Less frequent administration set replacement saves nursing time and money and may not affect the rates of infection and death, or it might even reduce them. The Centers for Disease Control and Prevention (CDC) currently recommends that sets used to administer fluids (other than lipid, blood or blood products) should be routinely changed no more often than every 96 hours (O'Grady 2011).
An earlier version of this systematic review-'Timing of intravenous administration set changes: a systematic review'-was published in Infection Control and Hospital Epidemiology (Gillies 2004) and in the Cochrane Database of Systematic Reviews 2005, Issue 4 (Gillies 2005). This current update was done to evaluate more recent studies. The aim of this updated systematic review was to ascertain the optimal interval for replacement of administration sets, that is, the frequency with the lowest rate of infection.
Objectives
The objective of this review was to identify any relationship between the frequency with which administration sets are replaced and rates of microbial colonization, infection and death.
Methods
Criteria for considering studies for this review
Types of studies
We included all randomized controlled trials (RCT) and controlled clinical trials (CCTs) that allocated the frequency of administration set replacement. CCTs refer to studies in which the method of allocation is not considered strictly random (Lefebvre 2011).
Types of participants
We included hospitalized participants of any age who had a central or peripheral venous or arterial catheter in situ.
Types of interventions
We included studies that compared the frequency of intravascular administration set replacement.
Types of outcome measures
Primary outcomes
-
The rate of catheter‐related bloodstream infection, as defined by one of three criteria: bacteraemia or fungaemia with at least one positive blood culture from a peripheral vein, with no other identifiable source of infection other than the catheter, plus a positive semiquantitative (> 15 colony‐forming units (cfu)) or quantitative (>1 03 cfu) device culture, with the same organism (species and antibiogram) isolated from the device and blood (Maki 2006; O'Grady 2002); or two blood cultures (one drawn from the catheter and one from a peripheral vein) that grow the same organism, with the catheter colony count three‐fold the peripheral colony count, or with the catheter culture growing at least 2 hours before the peripheral culture; or two quantitative blood cultures drawn from two catheter lumens in which the colony counts differ three‐fold (Mermel 2009).
-
The rate of infusate‐related bloodstream infection: isolation of the same organism from a quantitative culture of the infusate and from separate percutaneous blood cultures, with no other identifiable source of infection (O'Grady 2002).
Secondary outcomes
-
Catheter‐related bloodstream infection per 1000 patient‐days: as previously defined but restricted to the first catheter per participant.
-
Infusate‐related bloodstream infection per 1000 patient‐days: as previously defined but restricted to the first catheter per participant.
-
Infusate colonization: any positive quantitative culture of infusate.
-
Catheter colonization: any positive semiquantitative or quantitative culture from the catheter tip (e.g. distal catheter segment).
-
All‐cause bloodstream infection (bacteraemia or fungaemia): any positive blood culture drawn from a peripheral vein taken with the catheter in situ or within 48 hours of removal (O'Grady 2002).
-
Mortality.
-
Cost.
Definitions
-
Administration set: tubing from the spike entering the fluid container to the hub of the catheter (Pearson 1996).
-
Central catheter: includes tunnelled and non‐tunnelled central venous catheters, central arterial catheters (pulmonary arterial and left atrial catheters), peripherally inserted central venous catheters and implanted subcutaneous intravascular devices (O'Grady 2011).
-
Parenteral nutrition: the infusion of basic nutrients through the venous system, with or without the infusion of lipids.
-
Peripheral catheter: a short catheter inserted into the veins or arteries (O'Grady 2011).
Search methods for identification of studies
Electronic searches
We searched the following.
-
The Cochrane Central Register of Controlled Trials (CENTRAL), (The Cochrane Library, Issue 6, 2012) (Appendix 1).
-
MEDLINE (via Ovid) (1950 to June 2012) (Appendix 2).
-
EMBASE (via Ovid) (1980 to June 2012) (Appendix 3).
-
CINAHL (EBSCO host) (1982 to June 2012) (Appendix 4).
We increased the specificity of the topic search by combining it with the Cochrane Randomized Controlled Trial Search Strategy (Higgins 2011). No restrictions were applied for language, date of publication or study setting.
Searching other resources
We manually checked the reference lists of relevant studies and published reviews to identify trials missed by the electronic search strategy. We used the names of researchers known to have published on the topic as search terms. We contacted primary authors of identified trials to ask for more information, if required. We searched for ongoing trials at http://www.controlled‐trials.com; http://www.clinicaltrials.gov.
Data collection and analysis
Selection of studies
Two review authors (CMR, MLC) assessed all potentially relevant references for inclusion in the review. The PRISMA flow chart (Liberati 2009) illustrates the results of our search and the studies we selected (see Figure 1). We eliminated irrelevant studies. We resolved any disagreements regarding the selection of studies through consensus or, if necessary, by consultation with a third member of the review team (AD).
Data extraction and management
For this updated review, we developed and piloted a data extraction form, using the template provided by the Cochrane Anaesthesia Review Group (CARG). Two members of the 2012 review team (CMR, MLC) used the data extraction form to independently extract methodological and outcome data from each newly identified study (Covey 1988; Luskin 1986; McLane 1998). As only newly identified studies required data extraction, CMR did not extract data for the study that she coauthored (Rickard 2004). The pair then met to compare results. Differences were resolved by consensus or by referral to a third member of the review team.
Assessment of risk of bias in included studies
Two review authors (CMR, MLC, or AD) independently used the Cochrane Collaboration tool to assess risk of bias (Higgins 2011) in all included studies. This tool addresses six specific domains: sequence generation, allocation concealment, blinding, incomplete outcome data, selective outcome reporting and other issues that may potentially bias the study. Blinding and completeness of outcome data were assessed for each outcome separately. CMR did not assess for risk of bias the study that she coauthored (Rickard 2004). A risk of bias table was completed for each eligible study. Disagreements between review authors were resolved by consensus or by referral to a third review author. We attempted to contact investigators of included trials to resolve ambiguities. Assessment of risk of bias is discussed within the text and is presented as a 'Risk of bias summary figure' (see Figure 2), which cross‐tabulates judgements by study, and a 'Risk of bias summary graph' (see Figure 3), which summarizes judgements by domain.

Risk of bias summary: review authors' judgements about each risk of bias item for each included study.
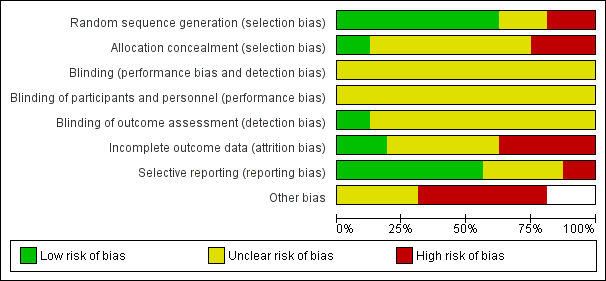
Risk of bias graph: review authors' judgements about each risk of bias item presented as percentages across all included studies.
Measures of treatment effect
We entered outcome data into RevMan 5.1 to generate meta‐analytical data and graphs. To generate clinically informative comparisons, we pragmatically divided time periods of administration set change into three different frequencies of administration set replacement (24 hours vs ≥ 48 hours; 48 hours vs ≥ 72 hours; 72 hours vs ≥ 96 hours). Event rates for binary outcomes (e.g. infection rates) were presented as risk ratios (RRs) and 95% confidence intervals (CIs). For continuous outcomes, we calculated differences in means with 95% CIs. For outcomes displaying incidence over a specified time period, we planned on calculating hazard ratios (HRs) with standard errors (SEs). We calculated pooled estimates for each outcome using a random‐effects model, chosen because of the substantial clinical heterogeneity noted between trials.
Unit of analysis issues
Three studies reported outcomes per administration set rather than per participant (deMoissac 1998; Maki 1987; Snydman 1987). One study (Fox 1999) reported outcomes per infusate sample. In future updates of this review, those studies that used administration sets as the unit of analysis will be included in a sensitivity analysis.
Dealing with missing data
All authors of included studies were emailed to ask for further information and clarification of key aspects of their study methods. Ten contact authors for fifteen of the studies responded (Blight 1998; Buxton 1979; Covey 1988; deMoissac 1998; Fox 1999; Gorbea 1984; Luskin 1986; McLane 1998; Rickard 2004; Sitges‐Serra 1985). One author was able to provide some information regarding study methods but was unable to provide further individual participant data (Blight 1998). Only one author (Rickard 2004) provided further information on both study methods and individual participant data. The remaining authors were unable to provide any study data (Blight 1998; Buxton 1979; Covey 1988; deMoissac 1998; Fox 1999; Gorbea 1984; Luskin 1986; Sitges‐Serra 1985).
Assessment of heterogeneity
We assessed evidence of statistical and clinical heterogeneity by visually inspecting the model, performing a Chi2 test and reviewing the I2 statistic (Deeks 2011). The Chi2 test examines the percentage of total variation across studies caused by heterogeneity rather than by chance. We planned to investigate heterogeneity (P < 0.10; I2 > 50%).
Assessment of reporting biases
We intended to use a funnel plot to identify small‐study effects, but studies were insufficient to allow this (Egger 1997). Any asymmetry of the funnel plot may indicate possible publication bias. We intended to explore other reasons for asymmetry, such as selection bias, methodological quality, heterogeneity, artefact or chance, as described in Section 10 of the Cochrane Handbook for Systematic Reviews of Interventions (Higgins 2011).
Data synthesis
We performed a meta‐analysis when sufficient data were obtained from two or more studies that were similar in terms of population, intervention, comparison and outcomes.
Subgroup analysis and investigation of heterogeneity
We pre‐specified four subgroup analyses. These included the following.
-
Central versus peripheral catheters (catheter site).
-
Parenteral nutrition and/or lipid emulsions versus infusates not involving parenteral nutrition and/or lipid emulsions (type of infusate).
-
Neonatal (within 28 days of birth) versus adult participants (older than 16 years) age group.
-
Arterial versus venous catheters (vascular access).
Proof of differences between groups was obtained by using the method described in Deeks 2011 via RevMan 5.1 and by using fixed‐effect analyses based on the inverse‐variance method to determine risk ratios and associated 95% confidence intervals. Meta‐regression was not used as fewer than 10 studies were included in the meta‐analysis (Deeks 2011).
Sensitivity analysis
We intended to include in a sensitivity analysis studies that did not describe the method of randomization and quasi‐randomized studies (e.g. participants allocated by date of birth). If no substantive differences were noted within the primary outcomes, we intended to include these studies in the final analysis. If a substantive difference was identified, we planned to include only studies that clearly described methods of randomization. Results of the sensitivity analysis would be described within the text. We did not undertake a sensitivity analysis because insufficient studies reported primary outcome events.
Results
Description of studies
Results of the search
We identified 2087 references: we included 16 and excluded 10 studies. Figure 1 contains the PRISMA study flow diagram (Liberati 2009).
Included studies
Sixteen studies with 5001 participants met our 2012 inclusion criteria (see also 'Characteristics of included studies'): Blight 1998; Buxton 1979; Covey 1988; deMoissac 1998; Fox 1999; Gorbea 1984; Jakobsen 1986; Josephson 1985; Luskin 1986; Maki 1987; Matlow 1999; McLane 1998; Raad 2001; Rickard 2004; Sitges‐Serra 1985; Snydman 1987. We found an additional three studies from the previous version of the review because we broadened the inclusion criteria to include administration sets connected to peripheral arterial catheters (Covey 1988; Luskin 1986; McLane 1998).
We identified two additional references as duplicate publications of Maki 1987 and Raad 2001.
We collected data for seven outcomes and for three different frequencies of administration set replacement. We included five studies that reported data from participants with central catheters (Blight 1998; deMoissac 1998; Raad 2001; Rickard 2004; Sitges‐Serra 1985) and three that reported data from participants with peripheral catheters (Buxton 1979; Jakobsen 1986; Josephson 1985). In our 2012 update, we added three studies that reported data from participants with arterial lines (Covey 1988; Luskin 1986; McLane 1998).
We included data from three studies in which participants received parenteral nutrition (Fox 1999; Matlow 1999; Sitges‐Serra 1985). We excluded the data from the Raad study (Raad 2001), which combined data for participants receiving parenteral nutrition with data for participants receiving blood: The study authors could not provide separate data for participants receiving parenteral nutrition. Participants in three studies did not receive parenteral nutrition (Buxton 1979; Josephson 1985; Snydman 1987). Rickard 2004 reported separate data for participants who did and did not receive parenteral nutrition. No study singularly examined the use of different types of lipid emulsions such as vitalipid or propofol given separately.
Of the 16 included studies, four stipulated that participants had to be adults (Gorbea 1984; McLane 1998; Sitges‐Serra 1985; Snydman 1987), and two reported data for neonates only (Fox 1999; Matlow 1999). The other studies may have included neonates but did not provide separate data for neonates.
Excluded studies
We excluded one study because it did not address the review question (Robertson 1991). We excluded four studies because the participants were not randomly or systematically allocated (Band 1979; Cohen 1989; O'Malley 1994; Robathan 1995). We excluded four studies because of inadequate data (Alothman 1996; Chen 2000; Franceschi 1989; Trautmann 1997). Attempts were made to contact these authors for further information, but none could be obtained. In agreement with the previous version of this review, we excluded one further study because it defined catheter colonization as fever and positive tip culture, and catheter‐related bloodstream infection as fever and positive (but heterogeneous) blood and catheter cultures (Powell 1985). Please see the 'Characteristics of excluded studies' table for more information.
Risk of bias in included studies
Figure 2 and Figure 3 present overall risk of bias. The characteristics of individual studies are summarized in the 'Characteristics of included studies' table.
Allocation
Sequence generation
Of the 16 included studies, 10 described an adequate method of sequence generation (Blight 1998; Buxton 1979; deMoissac 1998; Fox 1999; Josephson 1985; Luskin 1986; Matlow 1999; McLane 1998; Raad 2001; Rickard 2004).
Allocation concealment
An adequate method of allocation concealment was reported in only two studies (Matlow 1999; McLane 1998).
Blinding
Blinding of personnel and participants
No study blinded personnel or participants.
Blinding of outcome assessor
Two studies blinded the outcome assessor (Luskin 1986; Rickard 2004): Both blinded laboratory or microbiology personnel, and a medical rater was also blinded in Rickard 2004.
Incomplete outcome data
Three studies reported complete outcome data (Fox 1999; Gorbea 1984; Rickard 2004). Seven studies (Covey 1988; deMoissac 1998; Jakobsen 1986; Maki 1987; Raad 2001; Sitges‐Serra 1985; Snydman 1987) provided incomplete outcome data.
Selective reporting
All of the included studies provided information on all of the outcomes that were pre‐specified in the paper (protocols were not available for any of the studies). Neither of our primary outcome measures was reported by all studies.
Other potential sources of bias
None of the studies was supported by manufacturer sponsorship. Seven studies described systematic differences between intervention and control groups other than the intervention (Covey 1988; deMoissac 1998; Gorbea 1984; Luskin 1986; McLane 1998; Sitges‐Serra 1985; Snydman 1987). Unit of analysis problems in four studies were reported per administration set rather than per participant (deMoissac 1998; Fox 1999; Luskin 1986; Maki 1987). A questionable randomization technique was used by Matlow 1999, in that the study randomly assigned approximately 10% of neonates a second time if a gap in administration set usage was noted. The outcomes reported by Matlow 1999 were analysed according to the first allocated intervention; however, interpretation of results is confounded by allocation to subsequent interventions.
Effects of interventions
Overall Findings
The main results are displayed in 'summary of findings Table for the main comparison'.
1.1 Catheter‐related bloodstream infection
No evidence showed an effect of the frequency of administration set replacement on catheter‐related bloodstream infection (RR 1.06, 95%CI 0.67 to 1.69; Analysis 1.1). Only eight studies reported this outcome, and the rate of catheter‐related infection was zero in five of these.
1.2 Infusate‐related bloodstream infection
No evidence revealed an effect of the frequency of administration set replacement on infusate‐related bloodstream infection (RR 0.67, 95% CI 0.27 to 1.70; Analysis 1.2).
Catheter‐related and infusate‐related bloodstream infections per 1000 days
We contacted all authors for data on this outcome. Only one study (Rickard 2004) provided data: The incidence of catheter‐related bloodstream infection was zero in both groups.
1.3 Catheter colonization
No evidence suggested an effect of the frequency of administration set replacement on infusate colonization (RR 1.08, 95% CI 0.94 to 1.24;Analysis 1.3).
1.4 Infusate colonization
No evidence indicated an effect of the frequency of administration set replacement on infusate colonization (RR 1.15, 95% CI 0.70 to 1.86; Analysis 1.4).
1.5 All‐cause bloodstream infection
Some evidence showed that less frequent replacement of administration sets reduced the rate of bloodstream infection from any cause (RR 0.72, 95% CI 0.54 to 0.98; Analysis 1.5). The point estimates of effect were less than one for all subcomparisons (24 hours vs ≥ 48 hours; 48 hours vs ≥ 72 hours; 72 hours vs ≥ 96 hours; I2 = 0%). The reduction in infection in one study, published in abstract form, was statistically significant (Blight 1998).
1.6 Mortality
Some evidence indicated that less frequent replacement of administration sets increased the mortality rate within the neonatal population (RR 1.84, 95% CI 1.00 to 3.36; Analysis 1.6). Two studies of critically ill neonates given parenteral nutrition contributed to this result. One compared administration set replacement every 24 hours versus every 48 hours in 166 neonates (Fox 1999), and the other compared replacement every 24 hours versus every 72 hours in 1189 neonates (Matlow 1999). The composite result was dominated by Matlow 1999 (96% statistical weight). The risk of bias for mortality was not high, unlike the risk of bias for microbial sampling, which was undermined by a clinically significant imbalance in the weight of sampled neonates in the two groups.
Costs
We were unable to perform an economic analysis because of lack of data.
Subgroup Analyses
Catheter site
No data were available on any outcome from studies that recruited only participants with peripheral catheters.
2.1 Type of infusate
The only outcome that we could analyse for this subgroup was catheter‐related bloodstream infection, for which no evidence revealed an interaction between type of infusate and outcome (RR 0.8, 95% CI 0.21 to 3.01, P = 0.65; Analysis 2.1).
3.1 Age group
The only outcome that we could analyse for this subgroup was infusate‐related bloodstream infection, for which no evidence showed an interaction between age group and outcome (RR 0.65, 95% CI 0.29 to 1.46, P = 0.30; Analysis 3.1).
4.1 Vascular access
The only outcome that we could analyse for this subgroup was infusate‐related bloodstream infection, for which no evidence suggested an interaction between vascular access and outcome (RR 0.65, 95% CI 0.29 to 1.46, P = 0.31; Analysis 4.1). This result was identical to that seen in the age subgroup.
Outcomes were statistically homogeneous, with I2 < 10%. We did not investigate statistical heterogeneity, as studies were insufficient.
Discussion
Summary of main results
Decreasing the frequency of administration set changes from 24 hours to intervals of ≥ 48 hours, from 48 hours to ≥ 72 hours, or from 72 hours to ≥ 96 hours did not appear to increase the incidence of catheter‐related bacteraemia or catheter colonization (see summary of findings Table for the main comparison). It should be noted however, that power might not have been adequate to identify a clinically significant difference in the incidence of catheter‐related bloodstream infection in the 24 to ≥ 48 hour and 48 to ≥ 72 hour comparisons. The incidence of catheter‐related bacteraemia was 2% in the control group for the 24 to ≥ 48 hour comparison and 5% for the 48 to ≥ 72 hour and 72 to ≥ 96 hour comparisons. For a power of 0.8, 435 participants per group would be required to show an absolute difference of 5% in the incidence of catheter‐related bloodstream infection compared with the control group. The total number of participants was 143 for the 24 to ≥ 48 hour comparison, 298 for the 48 to ≥ 72 hour comparison and 1353 for the 72 to ≥ 96 hour comparison. Therefore power was probably adequate only for detecting a difference of 5% or more in the 72 to ≥ 96 hour comparison.
Although infusate colonization was identified in all cases where it was recorded as an outcome, only one study (Fox 1999), which reported data from neonates receiving parenteral nutrition in a neonatal intensive care unit, identified any cases of infusate‐related bacteraemia. Therefore the infusate colonization identified in most of these studies did not seem to result in bacteraemia.
It is difficult to draw conclusions regarding the risk of infection when administration sets contain parenteral nutrition and/or lipid emulsions. Although subgroup analyses of participants who received parenteral nutrition and/or lipid emulsions did not appear to differ from those of participants who were not given parenteral nutrition and/or lipid emulsions, or from the overall findings, few studies reported the incidence of bacteraemia in participants receiving parenteral nutrition or lipid emulsions (Fox 1999; Rickard 2004; Sitges‐Serra 1985). In addition, the number of participants in these studies was small, with the largest study reporting data for 148 participants (Fox 1999).
Evidence in relation to administration sets that contain fat emulsions is even weaker than for administration sets that contain parenteral nutrition. Apart from studies by Fox 1999, Matlow 1999 and Rickard 2004, which did include lipid emulsions, it was not clear whether the other studies included lipid emulsions in the parenteral nutrition administered to participants. It is notable that mortality risk was significantly increased when data from these two studies were pooled. However, at this stage, no evidence suggests that it is safe to extend the period of changing administration sets that contain lipids beyond an interval of 24 hours, which is generally accepted as best practice.
Although death was cited as a reason for a participant to be lost to follow‐up in two of the included studies (Blight 1998; Gorbea 1984), the death rate per group was reported in only two studies (Fox 1999; Matlow 1999). Some evidence suggests that less frequent replacement of administration sets increased mortality rate within the critically ill neonate population. When the outcome of mortality was examined, the composite result was dominated by Matlow 1999 (96% statistical weight), who used randomization techniques that may have been prone to bias. Investigators randomly assigned approximately 10% of neonates a second time, if a gap in administration set usage was noted. Mortality outcomes reported by Matlow 1999 were the result of the first random assignment; however, interpretation of results is confounded by allocation to subsequent interventions. The possibility that mortality might be increased with infrequent replacements, despite less bloodstream infection, should be of interest to researchers, clinicians and patients; however, current research has been conducted only within the neonatal population. Researchers would need to control for increased frequency of attendance by clinicians, which accompanies increased frequency of administration set replacement.
Overall completeness and applicability of evidence
Most of the studies included in this updated systematic review addressed either or both of the review's most important outcomes: catheter‐related and infusate‐related bacteraemia. However, some other outcomes, including mortality and costs, were poorly reported.
Of the 16 included studies, nine were conducted in an intensive care unit (Blight 1998; Covey 1988; Fox 1999; Gorbea 1984; Luskin 1986; Matlow 1999; McLane 1998; Rickard 2004; Snydman 1987). Two studies specifically included participants with cancer (deMoissac 1998; Raad 2001), and five studies (Buxton 1979; Jakobsen 1986; Josephson 1985; Maki 1987; Sitges‐Serra 1985) collected data from participants in a variety of settings. A particularly high rate of catheter‐related bacteraemia was reported in the study by Blight 1998 and of infusate‐related bacteraemia in the study by Fox 1999. As both of these studies were performed in intensive care units, it is possible that the high rate of infection was result of the severity of illness in these participants. However, findings in these studies were the same as in the overall analysis. The mortality meta‐analysis included only studies within the neonatal population.
Quality of the evidence
Risk of bias was difficult to assess in most of the studies because of poor reporting. It was not possible to blind personnel to the duration of administration sets, and this is a potential source of bias. However, blinding of outcome assessors for the primary outcomes was feasible but was adequately achieved and reported by only two of the studies (Luskin 1986; Rickard 2004). Allocation concealment was adequately achieved and reported by only two studies (Matlow 1999; McLane 1998). None of the trials disclosed receiving partial or full manufacturer sponsorship.
Potential biases in the review process
Clearly described procedures were followed to prevent potential bias in the review process. CMR was an author of one of the studies reviewed (Rickard 2004) but did not partake in any critique or data extraction for that study. A careful literature search was conducted, and the methods used are transparent and reproducible. None of the review authors has reported any conflict of interest.
To provide clinically informative comparisons, time periods of administration set change were pragmatically divided into three different frequencies of administration set replacement (24 hours versus ≥ 48 hours, 48 hours vs ≥ 72 hours, 72 hours vs ≥ 96 hours). An alternative technique would have been to use time ratios as the method of division of time periods, to highlight relative risks. Because bacteria and fungi require time for reproduction and spread, use of the time ratio technique would be in line with microbiological principles. However, investigators in the studies included in this review did not follow time ratios when choosing their interventional and control groups, thereby excluding this form of comparison.
Agreements and disagreements with other studies or reviews
The previous version of this review (Gillies 2005) also cautiously advocated changing intravascular administration sets that do not contain lipid emulsions, blood or blood products at an interval of up to 96 hours, having concluded that this does not affect the risk of catheter‐related or infusate‐related bacteraemia in participants with central or peripheral catheters. We now cautiously extend this finding to peripheral arterial catheters. The CDC advocates that intravascular administration sets used to administer fluids other than lipid emulsions, blood or blood products should be routinely changed no more frequently than every 96 hours (O'Grady 2011), and our review agrees with these recommendations. No evidence suggests that administration sets containing lipid emulsions should be changed less frequently than every 24 hours, as recommended by the CDC (O'Grady 2011).


Risk of bias summary: review authors' judgements about each risk of bias item for each included study.

Risk of bias graph: review authors' judgements about each risk of bias item presented as percentages across all included studies.

Comparison 1 Primary analysis: less versus more frequent, Outcome 1 Catheter‐related bloodstream infection.

Comparison 1 Primary analysis: less versus more frequent, Outcome 2 Infusate‐related bloodstream infection.

Comparison 1 Primary analysis: less versus more frequent, Outcome 3 Catheter colonization.

Comparison 1 Primary analysis: less versus more frequent, Outcome 4 Infusate colonization.

Comparison 1 Primary analysis: less versus more frequent, Outcome 5 All‐cause bloodstream infection.

Comparison 1 Primary analysis: less versus more frequent, Outcome 6 Mortality.

Comparison 2 Subgroup infusate: less versus more frequent, Outcome 1 Catheter‐related bloodstream infection.

Comparison 3 Subgroup age: less versus more frequent, Outcome 1 Infusate‐related bloodstream infection.

Comparison 4 Subgroup access: less versus more frequent, Outcome 1 Infusate‐related bloodstream infection.
| Primary analysis: less versus more frequent for intravenous administration set replacement | ||||||
| Patient or population: patients with intravenous administration set replacement | ||||||
| Outcomes | Illustrative comparative risks | Relative effect | No. of participants | Quality of the evidence | Comments | |
| Assumed risk | Corresponding risk | |||||
| More frequent AS replacement | Less frequent AS replacement | |||||
| Catheter‐related BSI as defined using criteria specified by Maki 2006; Mermel 2009; and O'Grady 2002 | 33 of 932 participants (3.5%) developed a catheter‐related BSI | 35 of 862 participants (4.1%) developed a catheter‐related BSI | RR 1.06 (0.66 to 1.68) | 1794 (8 studies) | ⊕⊕⊝⊝ | |
| Infusate‐related BSI as defined using criteria specified by O'Grady 2002 | 9 of 945 participants (0.95%) developed an infusate‐related BSI | 11 of 902 participants (1.2%) developed an infusate‐related BSI | RR 0.69 | 1847 | ⊕⊕⊝⊝ | |
| Infusate colonization any positive quantitative culture of infusate | 27 infusates, of a total of 808 (3.3%), were colonized | 29 infusates, of a total of 741 (3.9%), were colonized | RR 1.15 | 1549 | ⊕⊕⊝⊝ | |
| Catheter colonization any positive semiquantitative or quantitative culture from the distal catheter segment | 240 catheters, of a total of 717 (33.4%), were colonized | 266 catheters, of a total of 731 (36.4%), were colonized | RR 1.08 | 1448 | ⊕⊕⊕⊝ | |
| All‐cause BSI any positive blood culture drawn from a peripheral vein taken whilst the IVD is in situ, or within 48 hours of removal (O'Grady 2002) | 82 of 1135 participants (7.2%) developed a BSI from any cause | 69 of 1162 participants (5.9%) developed a BSI from any cause | RR 0.82 | 2297 | ⊕⊕⊝⊝ | |
| Mortality | 11 of 303 neonatal ICU participants died (3.6%) during their admission to the hospital | 77 of 1052 neonatal ICU participants died (7.3%) during their admission to the hospital | RR 1.85 | 1355 | ⊕⊕⊝⊝ | |
| CI: confidence interval; RR: risk ratio. | ||||||
| GRADE Working Group grades of evidence: | ||||||
| aThe proportion of information from studies at high or unclear risk of bias is sufficient to affect the interpretation of results. | ||||||
| Outcome or subgroup title | No. of studies | No. of participants | Statistical method | Effect size |
| 1 Catheter‐related bloodstream infection Show forest plot | 8 | 1794 | Risk Ratio (M‐H, Random, 95% CI) | 1.06 [0.67, 1.69] |
| 1.1 48 hours or more versus 24 hours | 2 | 143 | Risk Ratio (M‐H, Random, 95% CI) | 1.08 [0.07, 16.95] |
| 1.2 72 hours or more versus 48 hours | 3 | 298 | Risk Ratio (M‐H, Random, 95% CI) | 0.80 [0.21, 3.01] |
| 1.3 96 hours or more versus 72 hours | 3 | 1353 | Risk Ratio (M‐H, Random, 95% CI) | 1.10 [0.67, 1.83] |
| 2 Infusate‐related bloodstream infection Show forest plot | 10 | 1419 | Risk Ratio (M‐H, Random, 95% CI) | 0.67 [0.27, 1.70] |
| 2.1 48 hours or more versus 24 hours | 4 | 341 | Risk Ratio (M‐H, Random, 95% CI) | 0.58 [0.25, 1.35] |
| 2.2 72 hours or more versus 48 hours | 6 | 1078 | Risk Ratio (M‐H, Random, 95% CI) | 3.20 [0.13, 77.10] |
| 3 Catheter colonization Show forest plot | 4 | 1448 | Risk Ratio (M‐H, Random, 95% CI) | 1.07 [0.93, 1.22] |
| 3.1 48 hours or more versus 24 hours | 1 | 182 | Risk Ratio (M‐H, Random, 95% CI) | 0.81 [0.52, 1.26] |
| 3.2 72 hours or more versus 48 hours | 2 | 198 | Risk Ratio (M‐H, Random, 95% CI) | 1.28 [0.81, 2.03] |
| 3.3 96 hours or more versus 72 hours | 3 | 1068 | Risk Ratio (M‐H, Random, 95% CI) | 1.11 [0.85, 1.44] |
| 4 Infusate colonization Show forest plot | 8 | 1549 | Risk Ratio (M‐H, Random, 95% CI) | 1.10 [0.68, 1.79] |
| 4.1 48 hours or more versus 24 hours | 4 | 793 | Risk Ratio (M‐H, Random, 95% CI) | 1.06 [0.62, 1.82] |
| 4.2 72 hours or more versus 48 hours | 3 | 328 | Risk Ratio (M‐H, Random, 95% CI) | 2.23 [0.29, 17.01] |
| 4.3 96 hours or more versus 72 hours | 1 | 428 | Risk Ratio (M‐H, Random, 95% CI) | 1.02 [0.28, 3.75] |
| 5 All‐cause bloodstream infection Show forest plot | 6 | 2297 | Risk Ratio (M‐H, Random, 95% CI) | 0.73 [0.54, 0.98] |
| 5.1 48 hours or more versus 24 hours | 3 | 871 | Risk Ratio (M‐H, Random, 95% CI) | 0.84 [0.48, 1.48] |
| 5.2 72 hours or more versus 48 hours | 2 | 657 | Risk Ratio (M‐H, Random, 95% CI) | 0.71 [0.18, 2.88] |
| 5.3 96 hours or more versus 72 hours | 1 | 769 | Risk Ratio (M‐H, Random, 95% CI) | 0.69 [0.48, 0.99] |
| 6 Mortality Show forest plot | 2 | 1355 | Risk Ratio (M‐H, Random, 95% CI) | 1.84 [1.00, 3.36] |
| 6.1 48 hours or more versus 24 hours (neonatal population only) | 2 | 1355 | Risk Ratio (M‐H, Random, 95% CI) | 1.84 [1.00, 3.36] |
| Outcome or subgroup title | No. of studies | No. of participants | Statistical method | Effect size |
| 1 Catheter‐related bloodstream infection Show forest plot | 4 | 804 | Risk Ratio (IV, Fixed, 95% CI) | 0.80 [0.21, 3.01] |
| 1.1 PN | 2 | 64 | Risk Ratio (IV, Fixed, 95% CI) | 1.25 [0.12, 12.91] |
| 1.2 Non‐PN | 3 | 740 | Risk Ratio (IV, Fixed, 95% CI) | 0.65 [0.13, 3.23] |
| Outcome or subgroup title | No. of studies | No. of participants | Statistical method | Effect size |
| 1 Infusate‐related bloodstream infection Show forest plot | 6 | 689 | Risk Ratio (IV, Fixed, 95% CI) | 0.65 [0.29, 1.46] |
| 1.1 Adults | 5 | 541 | Risk Ratio (IV, Fixed, 95% CI) | 3.20 [0.13, 77.10] |
| 1.2 Neonates | 1 | 148 | Risk Ratio (IV, Fixed, 95% CI) | 0.58 [0.25, 1.35] |
| Outcome or subgroup title | No. of studies | No. of participants | Statistical method | Effect size |
| 1 Infusate‐related bloodstream infection Show forest plot | 11 | 1844 | Risk Ratio (IV, Fixed, 95% CI) | 0.65 [0.29, 1.46] |
| 1.1 Arterial | 3 | 216 | Risk Ratio (IV, Fixed, 95% CI) | 3.20 [0.13, 77.10] |
| 1.2 Venous | 8 | 1628 | Risk Ratio (IV, Fixed, 95% CI) | 0.58 [0.25, 1.35] |