Cycle regimens for frozen‐thawed embryo transfer
Abstract
Background
Among subfertile couples undergoing assisted reproductive technology (ART), pregnancy rates following frozen‐thawed embryo transfer (FET) treatment cycles have historically been found to be lower than following embryo transfer undertaken two to five days following oocyte retrieval. Nevertheless, FET increases the cumulative pregnancy rate, reduces cost, is relatively simple to undertake and can be accomplished in a shorter time period than repeated in vitro fertilisation (IVF) or intracytoplasmic sperm injection (ICSI) cycles with fresh embryo transfer. FET is performed using different cycle regimens: spontaneous ovulatory (natural) cycles; cycles in which the endometrium is artificially prepared by oestrogen and progesterone hormones, commonly known as hormone therapy (HT) FET cycles; and cycles in which ovulation is induced by drugs (ovulation induction FET cycles). HT can be used with or without a gonadotrophin releasing hormone agonist (GnRHa). This is an update of a Cochrane review; the first version was published in 2008.
Objectives
To compare the effectiveness and safety of natural cycle FET, HT cycle FET and ovulation induction cycle FET, and compare subtypes of these regimens.
Search methods
On 13 December 2016 we searched databases including Cochrane Gynaecology and Fertility's Specialised Register, CENTRAL, MEDLINE, Embase, PsycINFO and CINAHL. Other search sources were trials registers and reference lists of included studies.
Selection criteria
We included randomized controlled trials (RCTs) comparing the various cycle regimens and different methods used to prepare the endometrium during FET.
Data collection and analysis
We used standard methodological procedures recommended by Cochrane. Our primary outcomes were live birth rates and miscarriage.
Main results
We included 18 RCTs comparing different cycle regimens for FET in 3815 women. The quality of the evidence was low or very low. The main limitations were failure to report important clinical outcomes, poor reporting of study methods and imprecision due to low event rates. We found no data specific to non‐ovulatory women.
1. Natural cycle FET comparisons
Natural cycle FET versus HT FET
No study reported live birth rates, miscarriage or ongoing pregnancy.
There was no evidence of a difference in multiple pregnancy rates between women in natural cycles and those in HT FET cycle (odds ratio (OR) 2.48, 95% confidence interval (CI) 0.09 to 68.14, 1 RCT, n = 21, very low‐quality evidence).
Natural cycle FET versus HT plus GnRHa suppression
There was no evidence of a difference in rates of live birth (OR 0.77, 95% CI 0.39 to 1.53, 1 RCT, n = 159, low‐quality evidence) or multiple pregnancy (OR 0.58, 95% CI 0.13 to 2.50, 1 RCT, n = 159, low‐quality evidence) between women who had natural cycle FET and those who had HT FET cycles with GnRHa suppression. No study reported miscarriage or ongoing pregnancy.
Natural cycle FET versus modified natural cycle FET (human chorionic gonadotrophin (HCG) trigger)
There was no evidence of a difference in rates of live birth (OR 0.55, 95% CI 0.16 to 1.93, 1 RCT, n = 60, very low‐quality evidence) or miscarriage (OR 0.20, 95% CI 0.01 to 4.13, 1 RCT, n = 168, very low‐quality evidence) between women in natural cycles and women in natural cycles with HCG trigger. However, very low‐quality evidence suggested that women in natural cycles (without HCG trigger) may have higher ongoing pregnancy rates (OR 2.44, 95% CI 1.03 to 5.76, 1 RCT, n = 168). There were no data on multiple pregnancy.
2. Modified natural cycle FET comparisons
Modified natural cycle FET (HCG trigger) versus HT FET
There was no evidence of a difference in rates of live birth (OR 1.34, 95% CI 0.88 to 2.05, 1 RCT, n = 959, low‐quality evidence) or ongoing pregnancy (OR 1.21, 95% CI 0.80 to 1.83, 1 RCT, n = 959, low‐quality evidence) between women in modified natural cycles and those who received HT. There were no data on miscarriage or multiple pregnancy.
Modified natural cycle FET (HCG trigger) versus HT plus GnRHa suppression
There was no evidence of a difference between the two groups in rates of live birth (OR 1.11, 95% CI 0.66 to 1.87, 1 RCT, n = 236, low‐quality evidence) or miscarriage (OR 0.74, 95% CI 0.25 to 2.19, 1 RCT, n = 236, low‐quality evidence) rates. There were no data on ongoing pregnancy or multiple pregnancy.
3. HT FET comparisons
HT FET versus HT plus GnRHa suppression
HT alone was associated with a lower live birth rate than HT with GnRHa suppression (OR 0.10, 95% CI 0.04 to 0.30, 1 RCT, n = 75, low‐quality evidence). There was no evidence of a difference between the groups in either miscarriage (OR 0.64, 95% CI 0.37 to 1.12, 6 RCTs, n = 991, I2 = 0%, low‐quality evidence) or ongoing pregnancy (OR 1.72, 95% CI 0.61 to 4.85, 1 RCT, n = 106, very low‐quality evidence).
There were no data on multiple pregnancy.
4. Comparison of subtypes of ovulation induction FET
Human menopausal gonadotrophin(HMG) versus clomiphene plus HMG
HMG alone was associated with a higher live birth rate than clomiphene combined with HMG (OR 2.49, 95% CI 1.07 to 5.80, 1 RCT, n = 209, very low‐quality evidence). There was no evidence of a difference between the groups in either miscarriage (OR 1.33, 95% CI 0.35 to 5.09,1 RCT, n = 209, very low‐quality evidence) or multiple pregnancy (OR 1.41, 95% CI 0.31 to 6.48, 1 RCT, n = 209, very low‐quality evidence).
There were no data on ongoing pregnancy.
Authors' conclusions
This review did not find sufficient evidence to support the use of one cycle regimen in preference to another in preparation for FET in subfertile women with regular ovulatory cycles. The most common modalities for FET are natural cycle with or without HCG trigger or endometrial preparation with HT, with or without GnRHa suppression. We identified only four direct comparisons of these two modalities and there was insufficient evidence to support the use of either one in preference to the other.
PICO
Plain language summary
Cycle regimens for frozen‐thawed embryo transfer
Review question: Cochrane review authors investigated different regimens used for preparing the uterus (womb) for transferring frozen‐thawed embryos to the uterus in women undergoing assisted reproductive technology (ART) to become pregnant.
Background
In subfertile women undergoing ART, eggs are collected from the ovaries and fertilised by sperm in a laboratory (in vitro fertilisation or IVF). Some or all embryos may be frozen, to be thawed and transferred to the womb at a later stage. This is called frozen‐thawed embryo transfer (or FET).
Women with regular spontaneous periods (menstrual cycles) may be offered a range of cycle regimens to prepare the womb lining for FET. Alternatively, FET can be carried out after spontaneous ovulation (release of an egg) in a natural cycle. This is called natural cycle FET.
Women with irregular cycles are either not ovulating or are ovulating randomly. Therefore, natural cycle FET is not suitable for them. These women can be offered either ovulation induction with fertility drugs or hormone therapy (HT) to prepare them for FET.
The most common regimens for FET are natural cycle with or without HCG (human chorionic gonadrotophin) trigger, or endometrial preparation with HT with or without a gonadotrophin‐releasing hormone agonist (GnRHa) to temporarily suppress ovarian function.
We conducted this review to find out if a particular FET regimen is more effective or safer than others. Our main outcomes were live birth rates and miscarriage rates per woman.
Study characteristics
We included 18 randomized controlled trials with 3815 women. The trials were conducted in Belgium, France, Israel, Italy, Iran, Singapore, the Netherlands and the UK. The evidence is current to 2 December 2016.
Key results
This review did not find sufficient evidence to support the use of one cycle regimen in preference to another in preparation for FET in subfertile women with regular ovulatory cycles. The most common modalities for FET are natural cycle with or without HCG trigger or endometrial preparation with HT, with or without GnRHa suppression. We identified only four direct comparisons of these two modalities and there was insufficient evidence to support the use of either one in preference to the other. We found no evidence specific to non‐ovulatory women.
Quality of the evidence
The evidence was of low or very low quality. The main limitations were failure to report important clinical outcomes, poor reporting of study methods and unclear findings due to lack of data.
Authors' conclusions
Summary of findings
| Natural cycle FET versus HT FET | ||||||
| Population: subfertile women | ||||||
| Outcomes | Illustrative comparative risks* (95% CI) | Relative effect | No of participants | Quality of the evidence | Comments | |
| Assumed risk | Corresponding risk | |||||
| HT FET | Natural cycle FET | |||||
| Live birth rate per woman | No data available | Not estimable | ‐ | |||
| Miscarriage rate per woman | No data available | Not estimable | ‐ | |||
| Ongoing pregnancy rate per woman | No data available | Not estimable | ‐ | |||
| Multiple pregnancy rate per woman | See comment | OR 2.48 | 21 | ⊕⊝⊝⊝ | No events in the control group | |
| *The basis for the assumed risk (e.g. the median control group risk across studies) is provided in footnotes. The corresponding risk (and its 95% confidence interval) is based on the assumed risk in the comparison group and the relative effect of the intervention (and its 95% CI). | ||||||
| GRADE Working Group grades of evidence | ||||||
| 1Downgraded one level for serious risk of bias: study at unclear risk of bias in all domains. | ||||||
| Natural cycle FET versus HT + GnRHa suppression FET | ||||||
| Population: subfertile women | ||||||
| Outcomes | Illustrative comparative risks* (95% CI) | Relative effect | No of participants | Quality of the evidence | Comments | |
| Assumed risk | Corresponding risk | |||||
| HT + GnRHa FET | Natural cycle FET | |||||
| Live birth rate per woman | 316 per 1000 | 262 per 1000 | OR 0.77 | 159 | ⊕⊕⊝⊝ | Only 46 events |
| Miscarriage rate per woman | No data available | Not estimable | ‐ | |||
| Ongoing pregnancy rate per woman | No data available | Not estimable | ‐ | |||
| Multiple pregnancy rate per woman | 63 per 1000 | 38 per 1000 | OR 0.58 | 159 | ⊕⊕⊝⊝ | Only 8 events |
| *The basis for the assumed risk (e.g. the median control group risk across studies) is provided in footnotes. The corresponding risk (and its 95% confidence interval) is based on the assumed risk in the comparison group and the relative effect of the intervention (and its 95% CI). | ||||||
| GRADE Working Group grades of evidence | ||||||
| 1Downgraded two levels due to very serious imprecision: single study, few events, confidence interval compatible with benefit in either group or with no effect. | ||||||
| Natural cycle FET versus other regimens for primary or secondary subfertility | ||||||
| Population: subfertile women | ||||||
| Outcomes | Illustrative comparative risks* (95% CI) | Relative effect | No of participants | Quality of the evidence | Comments | |
| Assumed risk | Corresponding risk | |||||
| Modified natural cycle FET (HCG trigger) | Natural cycle FET | |||||
| Live birth rate per woman | 267 per 1000 | 167 per 1000 | OR 0.55 | 60 | ⊕⊝⊝⊝ | Only 13 events |
| Miscarriage rate per woman | 24 per 1000 | 5 per 1000 | OR 0.20 | 168 | ⊕⊝⊝⊝ | Only 2 events |
| Ongoing pregnancy rate per woman | 107 per 1000 | 226 per 1000 | OR 2.44 | 168 | ⊕⊝⊝⊝ | Only 28 events |
| Multiple pregnancy per woman | No data available | |||||
| *The basis for the assumed risk is the mean control group risk across studies. The corresponding risk (and its 95% confidence interval) is based on the assumed risk in the comparison group and the relative effect of the intervention (and its 95% CI). | ||||||
| GRADE Working Group grades of evidence | ||||||
| 1One other study compared natural cycle FET versus natural cycle plus human menopausal gonadotrophin, but did not report any per‐woman data. | ||||||
| Modified natural cycle FET (HCG trigger) versus HT FET | ||||||
| Population: subfertile women | ||||||
| Outcomes | Illustrative comparative risks* (95% CI) | Relative effect | No of participants | Quality of the evidence | Comments | |
| Assumed risk | Corresponding risk | |||||
| HT FET | Modified natural cycle FET (HCG trigger) | |||||
| Live birth rate per woman | 88 per 1000 | 114 per 1000 | OR 1.34 | 959 | ⊕⊕⊝⊝ | |
| Miscarriage rate per woman | No data available | Not estimable | ‐ | |||
| Ongoing pregnancy rate per woman | 97 per 1000 | 115 per 1000 | OR 1.21 | 959 | ⊕⊕⊝⊝ | |
| Multiple pregnancy rate per woman | No data available | Not estimable | ‐ | |||
| *The basis for the assumed risk (e.g. the median control group risk across studies) is provided in footnotes. The corresponding risk (and its 95% confidence interval) is based on the assumed risk in the comparison group and the relative effect of the intervention (and its 95% CI). | ||||||
| GRADE Working Group grades of evidence | ||||||
| 1Downgraded one level due to serious risk of bias: high attrition rate, unclear risk of allocation concealment | ||||||
| Modified natural cycle FET (HCG trigger) versus HT + GnRHa FET | ||||||
| Population: subfertile women | ||||||
| Outcomes | Illustrative comparative risks* (95% CI) | Relative effect | No of participants | Quality of the evidence | Comments | |
| Assumed risk | Corresponding risk | |||||
| HT + GnRHa FET | Modified natural cycle FET (HCG trigger) | |||||
| Live birth rate per woman | 398 per 1000 | 423 per 1000 | OR 1.11 | 236 | ⊕⊕⊝⊝ | |
| Miscarriage rate per woman | 68 per 1000 | 51 per 1000 | OR 0.74 | 236 | ⊕⊕⊝⊝ | |
| Ongoing pregnancy rate | No data available | Not estimable | ‐ | |||
| Multiple pregnancy rate per woman | No data available | Not estimable | ‐ | |||
| *The basis for the assumed risk is the mean control group risk across studies. The corresponding risk (and its 95% confidence interval) is based on the assumed risk in the comparison group and the relative effect of the intervention (and its 95% CI). | ||||||
| GRADE Working Group grades of evidence | ||||||
| 1Downgraded one level due to serious risk of bias: study at unclear risk of in most domains of bias (allocation concealment, blinding, selective reporting and other sources of bias). | ||||||
| HT FET versus other regimens for primary or secondary subfertility | ||||||
| Population: women with primary or secondary subfertility | ||||||
| Outcomes | Illustrative comparative risks* (95% CI) | Relative effect | No of participants | Quality of the evidence | Comments | |
| Assumed risk | Corresponding risk | |||||
| HT + GnRHa FET | HT FET | |||||
| Live birth rate per woman | 742 per 1000 | 223 per 1000 | OR 0.10 | 75 | ⊕⊕⊝⊝ | Only 33 events |
| Miscarriage rate per woman | 48 per 1000 | 31 per 1000 | OR 0.64 | 991 | ⊕⊕⊝⊝ | ‐ |
| Ongoing pregnancy rate per woman | 132 per 1000 | 207 per 1000 | OR 1.72 | 106 | ⊕⊝⊝⊝ | Only 18 events |
| Multiple pregnancy rate per woman | No data available | |||||
| *The basis for the assumed risk is the mean control group risk across studies. The corresponding risk (and its 95% confidence interval) is based on the assumed risk in the comparison group and the relative effect of the intervention (and its 95% CI). | ||||||
| GRADE Working Group grades of evidence | ||||||
| 1Downgraded one level due to serious imprecision: single study, few events. | ||||||
| HMG FET versus clomiphene + HMG FET | ||||||
| Population: subfertile women | ||||||
| Outcomes | Illustrative comparative risks* (95% CI) | Relative effect | No of participants | Quality of the evidence | Comments | |
| Assumed risk | Corresponding risk | |||||
| Clomiphene+ HMG FET | HMG FET | |||||
| Live birth rate per woman | 84 per 1000 | 186 per 1000 | OR 2.49 | 209 | ⊕⊝⊝⊝ | Only 26 events |
| Miscarriage rate per woman | 37 per 1000 | 49 per 1000 | OR 1.33 | 209 | ⊕⊝⊝⊝ | Only 9 events |
| Ongoing pregnancy rate per woman | No data available | Not estimable | ‐ | |||
| Multiple pregnancy rate per woman | 28 per 1000 | 39 per 1000 | OR 1.41 | 209 | ⊕⊝⊝⊝ | Only 7 events |
| *The basis for the assumed risk (e.g. the median control group risk across studies) is provided in footnotes. The corresponding risk (and its 95% confidence interval) is based on the assumed risk in the comparison group and the relative effect of the intervention (and its 95% CI). | ||||||
| GRADE Working Group grades of evidence | ||||||
| 1Downgraded one level for serious risk of bias: study at unclear risk of bias in all domains. | ||||||
Background
Description of the condition
For subfertile couples undergoing assisted reproductive technology (ART), embryo transfer can be performed with either fresh or frozen‐thawed embryos. Pregnancy rates following frozen‐thawed embryo transfer (FET) treatment cycles have historically been found to be lower than following fresh embryo transfer. Nevertheless, FET increases the cumulative pregnancy rate, reduces cost and is relatively simple to undertake. Moreover, it can be accomplished in a shorter time period than repeated in vitro fertilisation (IVF) or intracytoplasmic sperm injection (ICSI) cycles accompanied by fresh embryo transfer.
Description of the intervention
FET has been carried out using a variety of cycle regimens; spontaneous ovulatory cycles (natural cycle), cycles in which the endometrium is artificially prepared by oestrogen and progesterone hormones and is called hormone therapy (HT) cycle, and cycles in which ovulation is induced by drugs (ovulation induction cycle).
For FET to be successful the age of the embryos after thawing has to be synchronised with the age of the endometrium on the day of embryo transfer. Thus, endometrial receptivity and synchronisation between embryonic and endometrial development are important factors in the process of embryo implantation.
Natural cycle
Performing FET in a monitored natural cycle has the advantage that no medications are used, making such cycles preferable to many women. It is only feasible for women with regular ovulatory cycles, however, even in women with regular menstrual cycles, ovulation may not always occur and the timing of FET can also be problematic. Monitoring of the cycle requires several pelvic ultrasound scans to confirm follicular development and to time the commencement of urine testing for detection of the luteinising hormone (LH) surge. In addition, a further scan for ultrasonic evidence of ovulation may be required. Spontaneous endometrial development in the follicular phase is affected by age, and this may be a contributing factor in the lower pregnancy rate in older women (Sher 1991). To avoid some of these problems, ovulation induction agents, such as tamoxifen, clomiphene citrate, gonadotrophins or a combination of clomiphene and gonadotrophins have been employed (Mandelbaum 1987). However, even with their use, cycle cancellation rates can be high.
Hormone therapy cycle (with or without gonadotrophin‐releasing hormone agonist)
An alternative method for establishing an endometrium receptive to implantation is an artificial, hormonally‐controlled cycle (HT) using sequentially administered exogenous oestrogen and progesterone. Such a regimen was first used in women without ovarian function receiving embryos derived from donor oocytes (Lutjen 1984). In women with remaining ovarian function, a gonadotrophin‐releasing hormone agonist (GnRHa) was used to temporarily suppress ovarian function and render the woman functionally agonadal prior to inducing an artificial cycle with oestrogen and progesterone. Using such a regimen, implantation and pregnancy rates in donor oocyte recipients with retained ovarian function were similar to those in recipients without ovarian function (Borini 1995; Flamigni 1993; Pados 1992). However, these cycles are more expensive, and the GnRHa can have adverse effects and delay the resumption of spontaneous ovulation if FET fails. A simplified regimen, retaining the benefits but reducing cost and adverse effects and consisting of exogenous oestrogen and progesterone only (without a GnRHa), has also been used in women with remaining ovarian function (Jaroudi 1991; Lelaidier 1992). With this approach, the initiation of orally administered exogenous oestrogen on day one of the cycle prevents follicular recruitment by suppressing follicle‐stimulating hormone (FSH) and consequently spontaneous ovulation is avoided. Estradiol implants have also been shown to suppress the hypothalamic pituitary ovarian axis resulting in adequate endometrial preparation in women with retained ovarian function (Ben‐Nun 1997).
The advantage of hormone regimens is a high level of control and flexibility in the timing of transfer. The length of the follicular phase can be varied without detriment to implantation or pregnancy rates (Leeton 1991; Navot 1989), and the cycle cancellation rate is low. However, cost is greater, particularly if a GnRHa is used. Fixed regimens of oestrogen and progesterone may be inadequate for proper endometrial development in certain circumstances. In women with functioning ovaries, the possibility has been expressed that stimulatory factors of embryonic origin (such as human chorionic gonadotrophins) could lead to the production of ovarian substances (e.g. androgens or certain peptides) with an effect on endometrial quality. If a pregnancy occurs, oestrogen and progesterone must be continued until placental autonomy is established to replace the absent corpus luteum.
Most artificial cycle protocols mimic the natural cycle, but the active substances used and routes of delivery of oestrogen and progesterone vary. Oestrogen may be administered in the form of oral tablets, transdermal patches, subcutaneous implants and vaginal rings or tablets. Progesterone may be given in the form of oral tablets, intramuscular injections and intravaginal suppositories or rings (Devroey 1998).
Ovulation induction cycle
Theoretically, ovulation induction can be offered to women with irregular or anovulatory cycles undergoing FET. The possible advantage is to induce ovulation with natural LH surge and semi‐natural endometrial development. The development of a corpus luteum with production of natural oestrogen and progesterone helps support the luteal phase and early pregnancy without the need of exogenous HT. The use of clomiphene can be associated with an anti‐oestrogenic effect on the endometrium. Other ovulation induction agents include oral anti‐oestrogens such as tamoxifen and aromatase inhibitors such as letrozole. Drawbacks of ovulation induction cycles include drug exposure and its possible adverse effects, and risks including high cancellation rate due to under or over response, the cost of gonadotrophins, the need for intense monitoring and the limited flexibility in connection with FET timing. For these reasons and in the absence of evidence supporting any benefit compared to other cycle regimens, most centres do not use ovulation induction.
How the intervention might work
All methods of endometrial preparation aim to achieve a state of the endometrium that will be receptive to replaced frozen‐thawed embryos. The natural ovulatory cycle is the most physiological method. Using oestrogen and progesterone preparations as HT aims to prepare the endometrium in two stages. The first phase is using oestrogen preparations mimicking the follicular phase of a natural cycle. Following that progesterone preparations are added to oestrogen to mimic the luteal phase. Another method is the use of clomiphene tablets or human menopausal gonadotrophins (HMG) to induce ovulation and build up the endometrium.
Why it is important to do this review
Early studies reported pregnancy rates in artificial cycles to be equivalent to those obtained after FET in spontaneous ovulatory cycles, with low cancellation rates (de Ziegler 1990; Frydman 1988; Meldrum 1989; Schmidt 1989; Troup 1991). Some subsequent studies (often containing small numbers) reported better outcomes in artificial than in natural cycles (Davies 1991; Mausher 1991), while others found no difference (Irianni 1992; Sathanandan 1991). However, concern about the adequacy of the various replacement regimens and the possibility of higher rates of early pregnancy loss has also been expressed (Lelaidier 1992). Therefore, uncertainty remains as to which type of cycle regimen is superior and many fertility clinics use a mixture of protocols for FET. The clinical effectiveness of the different approaches can only be determined by randomized controlled trials (RCTs) comparing the three cycle regimens (natural, HT and ovulation induction).
This review aimed to compare the outcome of FET in an artificial HT cycle or an ovulation‐induction cycle with that of a monitored, natural cycle. The findings may be of interest to subfertile couples embarking on ART treatment, as well as practitioners and healthcare providers offering ART. This is the first update of a review first published in 2008, which included seven RCTs (1120 women) and concluded that there was insufficient evidence to support the use of one intervention in preference to another (Ghobara 2008).
Objectives
To compare the effectiveness and safety of natural cycle FET, HT cycle FET and ovulation induction cycle FET, and compare subtypes of these regimens.
Methods
Criteria for considering studies for this review
Types of studies
We considered published and unpublished RCTs for inclusion in this review. We excluded non‐randomised studies and quasi‐randomised trials (e.g. studies with evidence of inadequate sequence generation such as alternate days, participant numbers, etc.) as they are associated with a high risk of bias.
Types of participants
Couples/women undergoing FET as treatment for primary or secondary subfertility, irrespective of the indication for embryo freezing (supernumerary embryos obtained following fresh embryo transfer, elective embryo freezing as a result of ovarian hyperstimulation syndrome or for other reasons).
The participants may be of two main groups:
-
women with spontaneous ovulatory cycles;
-
women with anovulatory cycles
Types of interventions
Trials comparing any of the following cycle regimens regardless of the route of administration or drug‐containing regimen were eligible for inclusion:
-
natural ovulatory FET cycle versus HT FET cycle or other FET regimens
-
modified natural cycle FET (e.g. natural cycle with the use of HCG trigger) versus HT FET or other FET regimens
-
HT FET cycle versus HT plus GnRHa suppression or other FET cycle regimen
-
comparison of subtypes of ovulation induction FET using clomiphene, HMG, FSH or any combination of these drugs.
We excluded trials comparing FET cycle regimens with placebo only; however, trials comparing at least two FET cycle regimens with each other and with a placebo were eligible for inclusion.
Types of outcome measures
Primary outcomes
1. Live birth rate per woman, defined as delivery of a live fetus after 24 completed weeks of gestational age.
2. Miscarriage rate per woman.
Secondary outcomes
3. Ongoing pregnancy rate per woman, defined as evidence of a gestational sac with fetal heart motion at 12 weeks, confirmed with ultrasound.
4. Clinical pregnancy rate per woman, defined as evidence of a gestational sac, confirmed by ultrasound.
5. Other adverse events (adverse events were not grouped as composite measure but were rather analyzed separately):
a. ectopic pregnancy rate per woman;
b. multiple pregnancy rate per woman.
6. Cycle cancellation rate per woman.
7. Endometrial thickness during FET cycle.
8. Number of centre visits to monitor FET cycle.
Additional outcomes not appropriate for statistical pooling
Data per cycle or per transfer are not appropriate for pooling, because of what statisticians refer to as 'unit of analysis errors'. Simple group comparison tests for categorical data require that observations are statistically independent. The use of multiple observations per participant leads to unpredictable bias in the estimate of treatment difference (Vail 2003). Where we were unable to obtain per‐woman data for any of our outcomes of interest with multiple cycles or transfers per woman, we reported data in an additional table.
Search methods for identification of studies
We searched for all published and unpublished RCTs comparing the various cycle regimens without language restriction and in consultation with Cochrane Gynaecology and Fertility's Information Specialist.
The search was performed on titles, abstracts and keywords of the listed articles. When required, we contacted the study authors to obtain additional information.
Electronic searches
We searched the following electronic databases.
-
Cochrane Gynaecology and Fertility (CGF) Specialised Register of Controlled Trials from inception to 13 December 2016 (Appendix 1)
-
The Cochrane Central Register of Sudies (CENTRAL CRSO) searched 13 December 2016 (Appendix 2)
-
MEDLINE from inception to 13 December 2016 (Appendix 3)
-
Embase from inception to 13 December 2016 (Appendix 4)
-
PsycINFO from inception to 13 December 2016 (Appendix 5)
-
CINAHL from inception to 13 December 2016 (Appendix 6)
We combined the MEDLINE search with the Cochrane Highly Sensitive Search Strategy for identifying RCTs which appears in the Cochrane Handbook of Systematic Reviews of Interventions (Chapter 6; Lefebvre 2011). The Embase, PsycINFO and CINAHL searches were combined with trial filters developed by the Scottish Intercollegiate Guidelines Network (SIGN).
We searched the following electronic sources.
-
Trials registers for ongoing and registered trials:
-
the World Health Organization (WHO) International Clinical Trials Registry Platform (ICTRP), searched to 13th December 2016;
-
ClinicalTrials.gov, searched to 13th December 2016.
-
-
DARE (Database of Abstracts of Review of Effects) in the Cochrane Library (for reference lists from relevant non‐Cochrane reviews), date of last search 13th December 2016.
-
Web of Science, searched to 13th December 2016.
-
LILACS, for trials from the Portuguese and Spanish‐speaking world, date of last search 13th December 2016.
-
OpenGrey for unpublished literature from Europe, searched to 13th December 2016.
-
PubMed and Google Scholar (for recent trials not yet indexed in MEDLINE), searched 13th December 2016.
Searching other resources
We handsearched reference lists of articles retrieved by the search and contacted experts in the field to obtain additional data. We also handsearched relevant journals and conference abstracts that are not covered in the CGF specialized register, in liaison with the Information Specialist.
The searches were conducted using the Cochrane Highly Sensitive Search Strategy as outlined in the Cochrane Handbook for Systematic Reviews of Interventions (Lefebvre 2011), and the following MeSH terms in combination:
-
cryopreservation
-
freezing
-
embryo
-
pre‐embryo
-
frozen or cryopreserved embryo transfer
-
embryo replacement
-
frozen or cryopreserved embryo transfer
-
frozen or cryopreserved embryo replacement.
We searched citation lists of relevant publications, reviews and included studies.
We searched relevant conference abstract books including the European Society of Human Reproduction and Embryology, the American Society for Reproductive Medicine, the British Fertility Society, the British Congress of Obstetrics and Gynaecology, the World Congress of In Vitro Fertilisation and Human Reproductive Genetics, and the Fertility Society of Australia in liaison with the CGF Information Specialist, and contacted we experts in the field seeking additional data.
Data collection and analysis
Selection of studies
After an initial screen of titles and abstracts retrieved by the searches, we retrieved the full texts of all potentially eligible studies. Two review authors (TG and RA) independently examined these full‐text articles for compliance with the inclusion criteria and selected studies eligible for inclusion in the review. We contacted study investigators as required, to clarify study eligibility. We resolved disagreements on study eligibility by discussion or by involving a third review author (TAG). We documented the selection process with a PRISMA flow chart (Figure 1; Moher 2009).

Study flow diagram
Data extraction and management
Two review authors (TG and RA) independently extracted data from eligible studies using a data extraction form designed and pilot‐tested by the review authors. We resolved any disagreements by discussion or by involving a third review author (TAG). Data extracted included study characteristics and outcome data. The review authors collated multiple reports of the same study, so that each study rather than each report was the unit of interest, and such studies were given a single study ID with multiple references.
We sent correspondence to study investigators to request further data on methods or results, or both, as required.
Assessment of risk of bias in included studies
Two review authors independently assessed the included studies for risk of bias using the Cochrane 'Risk of bias' assessment tool to assess: selection (random sequence generation and allocation concealment); performance (blinding of participants and personnel); detection (blinding of outcome assessors); attrition (incomplete outcome data); reporting (selective reporting); and other bias such as difference in participants' baseline characteristics, embryo quality, participants' number of visits and number of days until LH‐HCG surge (Higgins 2011a). We resolved disagreements by discussion or by involving a third review author. We described all judgements fully and present the conclusions, which were incorporated into the interpretation of review findings, in the 'Risk of bias' tables, and Figure 2 and Figure 3.
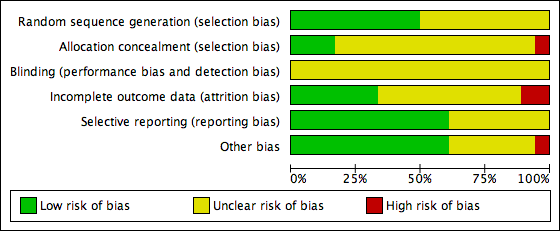
Risk of bias graph: review authors' judgements about each risk of bias item presented as percentages across all included studies

Risk of bias summary: review authors' judgements about each risk of bias item for each included study
We took care to search for within‐trial selective reporting, such as trials failing to report obvious outcomes, or reporting them in insufficient detail to allow inclusion. We sought published protocols where possible and compared the outcomes between the protocol and the final published study. Where identified studies failed to report any of the primary outcomes (e.g. live birth), but did report interim outcomes, we undertook informal assessment by comparing the interim values to those reported in studies that also reported the primary outcomes to detect whether there were any similarities between them.
Measures of treatment effect
For dichotomous data (e.g. live birth rates), we used the numbers of events in the control and intervention groups of each study to calculate Mantel‐Haenszel odds ratios (OR). For continuous data (e.g. endometrial thickness), where studies reported exactly the same outcomes we calculated mean differences (MDs) between treatment groups. We presented 95% confidence intervals (CI) for all outcomes. We compared the magnitude and direction of effect reported by studies with how they are presented in the review, taking account of legitimate differences.
Unit of analysis issues
The primary analysis was per woman randomized. We briefly summarized data that did not allow valid analysis (e.g. 'per cycle' data), entered them in additional tables and did not use them in meta‐analyses. We counted multiple live births (e.g. twins or triplets) as one live birth event. We planned to include only first‐phase data from cross‐over trials. However, we included no cross‐over trial in this review.
Where studies reported only 'per cycle' or 'per embryo transfer' data and there were multiple cycles or transfers per woman, we contacted authors of such studies and requested data 'per woman'. Where 'per woman' data could not be obtained following correspondence with the study authors, we summarized findings in additional tables as noted above.
Dealing with missing data
We analyzed the data on an intention‐to‐treat basis as far as possible and attempted to obtain missing data from the trial authors. The primary outcomes (e.g. live birth) were assumed not to have occurred in participants without a reported outcome. For other outcomes, we analyzed only the available data.
If studies reported sufficient detail to calculate MDs but no information on associated standard deviation (SD), we assumed the outcome to have an SD equal to the highest SD from other studies within the same analysis.
Assessment of heterogeneity
We assessed whether the clinical and methodological characteristics of the included studies were sufficiently similar for meta‐analysis to provide a clinically meaningful summary. We assessed statistical heterogeneity using the I2 statistic (Higgins 2003). An I2 greater than 50% indicated substantial heterogeneity (Deeks 2011).
Assessment of reporting biases
In view of the difficulty of detecting and correcting for publication bias and other reporting biases, the review authors minimised the potential impact of these biases by ensuring a comprehensive search for eligible studies and avoiding duplication of data. Where there were 10 or more studies in an analysis, we planned to use funnel plots to explore the possibility of small‐study effects (a tendency for estimates of the intervention effect to be more beneficial in smaller studies). However, we did not generate a funnel plot for any of the analyses as none of them included 10 or more studies.
Data synthesis
For studies that were sufficiently similar, we planned to combine the data using a fixed‐effect model in the following comparisons:
Natural cycle FET comparisons
-
Natural cycle versus HT
-
Natural cycle versus HT + GnRHa
-
Natural cycle versus HMG
-
Natural cycle versus modified natural cycle (HCG‐induced)
Modified natural cycle FET comparisons
-
Modified natural cycle (HCG induced) versus HT
-
Modified natural cycle versus HT + GnRHa
HT FET comparisons
-
HT versus HT + GnRHa
-
HT versus FSH
-
HT versus HT + HCG
Comparisons of subtypes of ovulation‐induction FET.
-
HMG versus clomiphene + HMG
-
HT plus GnRHa versus clomiphene
An increase in the odds of a particular outcome, which may be beneficial (e.g. live birth) or detrimental (e.g. adverse effects) was displayed graphically in the meta‐analyses to the right of the centre line and a decrease in the odds of an outcome to the left of the centre line.
Subgroup analysis and investigation of heterogeneity
We planned no subgroup analyses.
We took any statistical heterogeneity into account when interpreting the results, especially where there was any variation in the direction of effect.
Sensitivity analysis
We conducted sensitivity analyses for the primary outcomes to determine whether the conclusions were robust to arbitrary decisions made regarding eligibility and analysis. These analyses included consideration of whether the review conclusions would have differed if:
-
we had used a random‐effects (RE) model;
-
the summary effect measure had been risk ratio (RR) rather than OR.
Overall quality of the body of evidence: 'Summary of findings' table
We prepared 'Summary of findings' tables for the review's main comparisons:
-
natural cycle FET versus HT FET;
-
natural cycle FET versus HT plus GnRHa suppression FET;
-
modified natural cycle FET versus HT FET; and
-
modified natural cycle FET versus HT plus GnRHa suppression.
We prepared additional 'Summary of findings' tables for three other comparisons:
-
natural cycle FET versus modified natural cycle FET (HCG trigger);
-
HT FET versus HT plus GnRHa suppression; and
-
HMG FET versus clomiphene plus HMG FET.
We used GRADEPro GDT (GRADEPro GDT 2014) and Cochrane methods (Schünemann 2011). These tables evaluated the overall quality of the body of evidence for the main review outcomes (live birth, miscarriage, ongoing pregnancy and multiple pregnancy), using GRADE criteria (study limitations (i.e. risk of bias), consistency of effect, imprecision, indirectness and publication bias). Judgements about evidence quality (high, moderate, low or very low) were made by two review authors working independently, with disagreements resolved by discussion. Our judgements were justified, documented, and incorporated into reporting of results for each outcome.
Results
Description of studies
Results of the search
The search retrieved 622 articles, of which 65 studies were potentially eligible and we retrieved the full texts. Eighteen studies (22 reports) met our inclusion criteria. We excluded 42 studies (43 reports). See Characteristics of included studies and Characteristics of excluded studies tables. The PRISMA flow chart in Figure 2 illustrates the flow of literature through the search and assessment process.
We added 11 new studies in this update (Azimi Nekoo 2015; Davar 2007; Eftekhar 2012; Fatemi 2010; Greco 2016; Groenewoud 2016; Karimzadeh 2012; Mounce 2015; Peeraer 2015; Ramos 2007; Weissman 2011).
Included studies
Design and setting
All 18 included studies were parallel‐design RCTs (Azimi Nekoo 2015; Cattoli 1994; Dal Prato 2002; Davar 2007; Eftekhar 2012; El‐Toukhy 2004; Fatemi 2010; Greco 2016; Groenewoud 2016; Karimzadeh 2012; Loh 2001; Mounce 2015; Peeraer 2015; Ramos 2007; Simon 1998; Van Der Auwera 1994; Weissman 2011; Wright 2006). One of the included studies was a three‐arm trial comparing three different cycle regimens: HT plus GnRHa, HT FET and clomiphene FET (Loh 2001). Sixteen of the trials were conducted in a single centre; the remaining two trials were conducted in two or more ART centres (Groenewoud 2016; Azimi Nekoo 2015). The included RCTs were undertaken in Belgium (Fatemi 2010; Peeraer 2015; Van Der Auwera 1994), France (Wright 2006), Iran (Azimi Nekoo 2015; Davar 2007; Eftekhar 2012; Karimzadeh 2012), Israel (Simon 1998; Weissman 2011), Italy (Cattoli 1994; Dal Prato 2002; Greco 2016), the Netherlands (Groenewoud 2016), Singapore (Loh 2001), Spain (Ramos 2007) and the UK (El‐Toukhy 2004; Mounce 2015). The studies were published between 1994 and 2016.
Participants
The studies included 3815 subfertile women undergoing FET. Their ages ranged across studies from 19 to 45 years. Thirteen of the studies included women with functional ovaries or regular ovulatory cycles; in five studies, the ovulatory status of the women was not reported.
All the RCTs assessed women using embryos originating from their own oocytes. Participants used embryos resulting from either IVF or ICSI treatment.
Interventions
Natural cycle FET comparisons
-
Natural cycle FET versus HT FET (2 RCTs)(Cattoli 1994; Karimzadeh 2012)
-
Natural cycle FET versus HT plus GnRHa suppression FET (1 RCT) (Mounce 2015)
-
Natural cycle FET versus HMG FET (1 RCT) (Peeraer 2015)
-
Natural cycle FET versus modified natural cycle FET (HCG trigger) (2 RCTs) (Fatemi 2010; Weissman 2011)
Modified natural cycle FET comparisons
-
Modified natural cycle FET (HCG trigger) versus HT FET (1 RCT) (Groenewoud 2016)
-
Modified natural cycle FET versus HT plus GnRHa suppression FET (1 RCT) (Greco 2016)
HT FET comparisons
-
HT FET versus HT plus GnRHa suppression FET (7 RCTs) (Azimi Nekoo 2015; Dal Prato 2002; Davar 2007; El‐Toukhy 2004; Loh 2001; Ramos 2007; Simon 1998)
-
HT FET versus FSH ovulation induction (Wright 2006)
-
HT FET versus HT plus HCG supplement FET (Eftekhar 2012)
Comparisons of subtypes of ovulation‐induction FET.
-
HMG FET versus clomiphene plus HMG FET (Van Der Auwera 1994)
-
HT plus GnRHa versus clomiphene (Loh 2001),
We found no RCTs of other ovulation induction agents such as oral anti‐oestrogens (e.g. tamoxifen) or aromatase inhibitors (e.g. letrozole).
Outcomes
The trials reported the following outcomes:
-
live birth rate per woman (El‐Toukhy 2004; Greco 2016; Groenewoud 2016; Mounce 2015; Van Der Auwera 1994; Weissman 2011);
-
miscarriage rate per woman (Azimi Nekoo 2015; Dal Prato 2002; Davar 2007; El‐Toukhy 2004; Fatemi 2010; Greco 2016; Ramos 2007; Simon 1998; Van Der Auwera 1994);
-
ongoing pregnancy rate per woman (Fatemi 2010; Groenewoud 2016; Simon 1998);
-
clinical pregnancy rate per woman (Azimi Nekoo 2015; Cattoli 1994; Dal Prato 2002; Davar 2007; El‐Toukhy 2004; Fatemi 2010; Greco 2016; Groenewoud 2016; Mounce 2015; Simon 1998; Weissman 2011; Wright 2006);
-
multiple pregnancy rate per woman (Cattoli 1994; Mounce 2015; Van Der Auwera 1994);
-
cycle cancellation rate per woman (Dal Prato 2002; El‐Toukhy 2004; Groenewoud 2016; Simon 1998; Wright 2006);
-
endometrial thickness (Dal Prato 2002; El‐Toukhy 2004; Greco 2016; Groenewoud 2016; Simon 1998; Wright 2006);
-
number of centre visits to monitor FET cycle (Fatemi 2010; Weissman 2011);
-
clinical pregnancy rate per cycle (Loh 2001);
-
miscarriage rate per clinical pregnancy (El‐Toukhy 2004).
None of the studies reported ectopic pregnancy.
In four studies, outcome data were either not reported (Eftekhar 2012) or reported in forms that could not be analyzed (per embryo transfer: Karimzadeh 2012; Peeraer 2015 or per cycle: Loh 2001, and the numbers of transfers and cycles were not equivalent to the numbers of women randomized). Thus, three studies reported their outcome data in a form that could not be included in meta‐analyses (Karimzadeh 2012; Loh 2001; Peeraer 2015) (see Table 1; Table 2; Table 3; Table 4; Table 5; Table 6).
| Study | Intervention (number of embryo transfer) | Control (number of embryo transfer) | Live birth rate | P value |
| Natural cycle FET (n = 332) | HMG FET (n = 340) | 32/332 vs 45/340 | n/s |
FET: frozen‐thawed embryo transfer; HMG: human menopausal gonadotrophin; n/s: not significant.
| Study | Intervention (number of embryo transfer) | Control (number of embryo transfer) | Miscarriage rate | P value |
| Natural cycle FET | HT FET | 41.7% vs 22.2% | n/s |
FET: frozen‐thawed embryo transfer; HT: hormone therapy; n/s: not significant.
| Study | Intervention (number of embryo transfer) | Control (number of embryo transfer) | Ongoing pregnancy rate | P value |
| Natural cycle FET | HT FET | 24.1% vs 21.9% | n/s |
FET: frozen‐thawed embryo transfer; HT: hormone therapy; n/s: not significant.
| Study | Intervention (number of cycles) | Control (number of cycles) | Clinical pregnancy rate | P value |
| Clomiphene‐induced ovulation (n = 35) | HT (n = 52) | 3/35 vs 5/52 | n/s | |
| Clomiphene‐induced ovulation (n = 32) | HT plus GnRHa trigger (n = 37) | 2/32 vs 6/37 | n/s |
GnRHa: gonadotrophin releasing hormone agonist; HT: hormone therapy; n/s: not significant.
| Study | Intervention (number of embryo transfer) | Control (number of embryo transfer) | Clinical pregnancy rate | P value |
| Natural cycle FET | HT FET | 27.6% vs 25% | n/s |
FET: frozen‐thawed embryo transfer; HT: hormone therapy; n/s: not significant.
| Study | Intervention (number of cycles/embryo transfer) | Control (number of cycles/embryo transfer) | Endometrial thickness | P value |
| Clomiphene‐induced ovulation (n = 67) | HT alone or HT plus GnRHa suppression (n = 37) | 9.7 vs 9.8 | n/s | |
| Natural cycle FET (n = 332) | HMG FET (n = 340) | 8.9 vs 8.9 | n/s |
FET: frozen‐thawed embryo transfer; GnRHa: gonadotrophin releasing hormone agonist; HMG: human menopausal gonadotrophin; HT: hormone therapy; n/s: not significant.
Excluded studies
We excluded 42 studies for the following reasons:
-
thirty‐four were not true RCTs (Al‐Shawaf 1993; Awonuga 1996; Bals‐Pratsch 1999; Belaisch‐Allart 1994; Benfer 1994; Chen 2007; de Ziegler 1990; Dolan 1991; Dor 1991; Gelbaya 2006; Givens 2007; Gonzalez 1992; Imthurn 1996; Jaroudi 1991; Kawamura 2007; Lelaidier 1992; Lelaidier 1995; Loh 1999; Lornage 1990; Mausher 1991; Morozov 2007; Oehninger 2000; Pattinson 1992; Queenan 1994; Queenan 1997; Sathanandan 1991; Schmidt 1989; Shiotani 2006; Simon 1999; Spandorfer 2004; Tanos 1996; Wada 1992; Yee 1995; Yishai 2001);
-
seven studies did not use interventions relevant to the review (Davar 2015; Elhelw 2008; Garrisi 1991; Groenewoud 2015; Page 2005; Taskin 2002; Yu 2015);
-
one study did not report the number of participants randomized to, or analyzed in, each treatment group (Lee 2008).
Risk of bias in included studies
Details of the quality criteria of the relevant studies can be found in the Characteristics of included studies table.
Allocation
Sequence generation
Nine studies reported using computer‐generated randomization and we judged them to be at low risk of bias (Azimi Nekoo 2015; Davar 2007; Eftekhar 2012; El‐Toukhy 2004; Fatemi 2010; Greco 2016; Groenewoud 2016; Mounce 2015; Weissman 2011). Nine studies did not report the randomization method and we judged them to be at unclear risk of bias (Cattoli 1994; Dal Prato 2002; Karimzadeh 2012; Loh 2001; Peeraer 2015; Ramos 2007; Simon 1998; Van Der Auwera 1994; Wright 2006).
Allocation concealment
Concealment of allocation was adequate in three studies using sealed envelopes ; Loh 2001; Peeraer 2015; Weissman 2011). The allocation concealment was unclear in 14 studies (Azimi Nekoo 2015; Cattoli 1994; Davar 2007; Dal Prato 2002; Eftekhar 2012; El‐Toukhy 2004; Greco 2016; Groenewoud 2016; Karimzadeh 2012; Mounce 2015; Ramos 2007; Simon 1998; Van Der Auwera 1994; Wright 2006). Fatemi 2010 stated that no concealment took place and was rated as at high risk of bias.
Blinding
Blinding of the woman or the clinician was not practically possible in any of the included studies. Moreover, non‐blinding may not affect some of the outcome measures as they were objectively assessed. Therefore, we rated all the included studies as unclear with respect to blinding and detection bias.
Incomplete outcome data
Five studies used an intention‐to‐treat analysis, that is, all women randomized at baseline were included in the analysis (Azimi Nekoo 2015; Davar 2007; El‐Toukhy 2004; Mounce 2015; Simon 1998); in another study, the proportions of withdrawals and reasons for withdrawals were fairly balanced between the two groups (Greco 2016). We therefore assessed these six studies as at low risk of bias with respect to attrition. There was insufficient information in 10 studies to make a conclusive judgement on attrition bias and we rated them as unclear in this domain (Cattoli 1994; Dal Prato 2002; Eftekhar 2012; Fatemi 2010; Karimzadeh 2012; Loh 2001; Peeraer 2015; Ramos 2007; Van Der Auwera 1994; Wright 2006). Two studies were at high risk of attrition bias because the reasons for withdrawals and the proportions of withdrawals were substantially different between the two treatment groups (Groenewoud 2016; Weissman 2011).
Selective reporting
Eleven studies were at low risk of selective reporting bias (Dal Prato 2002; Davar 2007; Eftekhar 2012; El‐Toukhy 2004; Fatemi 2010; Groenewoud 2016; Mounce 2015; Peeraer 2015; Simon 1998; Weissman 2011; Wright 2006). Reporting bias was assessed as unclear in the remaining seven studies as there was insufficient information (Azimi Nekoo 2015; Cattoli 1994; Greco 2016; Karimzadeh 2012; Loh 2001; Ramos 2007; Van Der Auwera 1994).
Other potential sources of bias
In one study participants in the groups differed significantly in age so we assessed it at high risk of bias with respect to demographic characteristics (Weissman 2011). We found no potential sources of within‐study bias in 11 included studies (Azimi Nekoo 2015; Dal Prato 2002; Davar 2007; Eftekhar 2012; El‐Toukhy 2004; Groenewoud 2016; Karimzadeh 2012; Mounce 2015; Peeraer 2015; Simon 1998; Wright 2006). Information was insufficient to form a clear judgement in six studies (Cattoli 1994; Fatemi 2010; Greco 2016; Loh 2001; Ramos 2007; Van Der Auwera 1994).
Effects of interventions
See: Summary of findings for the main comparison Natural cycle FET versus HT FET; Summary of findings 2 Natural cycle FET versus HT plus GnRHa suppression FET; Summary of findings 3 Natural cycle FET versus modified natural cycle FET (HCG trigger); Summary of findings 4 Modified natural cycle FET (HCG trigger) versus HT FET; Summary of findings 5 Modified natural cycle FET (HCG trigger) versus HT + GnRHa suppression FET; Summary of findings 6 HT FET versus HT + GnRHa FET; Summary of findings 7 HMG FET versus clomiphene + HMG FET
The included studies compared a wide range of FET cycle regimens and outcome measures. We could not combine data for most of the comparisons as they were reported in single trials.
NATURAL CYCLE FET COMPARISONS
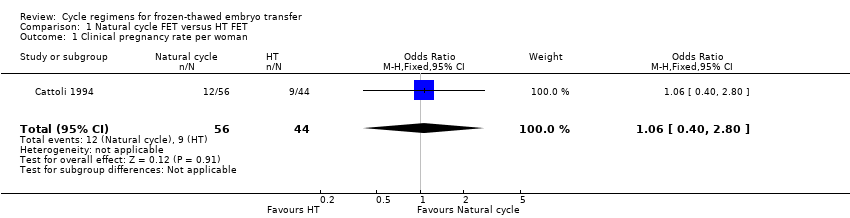
1 Natural cycle FET versus HT FET
Two studies made this comparison (Cattoli 1994; Karimzadeh 2012). For Karimzadeh 2012 no per‐woman outcome data were available. See Table 2; Table 3; Table 5.
Primary outcomes
1.1 Live birth rate per woman
No data were available.
1.2 Miscarriage rate per woman
No data were available.
Secondary outcomes
1.3 Ongoing pregnancy rate per woman
No data were available.
1.4 Clinical pregnancy rate per woman
There was no evidence of a difference between the groups in the clinical pregnancy rate (OR 1.06, 95% CI 0.40 to 2.80, 1 RCT, n = 100) (Analysis 1.1).
1.5 Multiple pregnancy rate per woman
There was no evidence of a difference between the groups in the multiple pregnancy rate (OR 2.48, 95% CI 0.09 to 68.14, 1 RCT, n = 21, very low‐quality evidence) (Analysis 1.2).
1.6 Cycle cancellation rate per woman
No data were available.
1.1.7 Endometrial thickness during FET cycle
No data were available.
1.8 Number of centre visits to monitor FET cycle
No data were available.
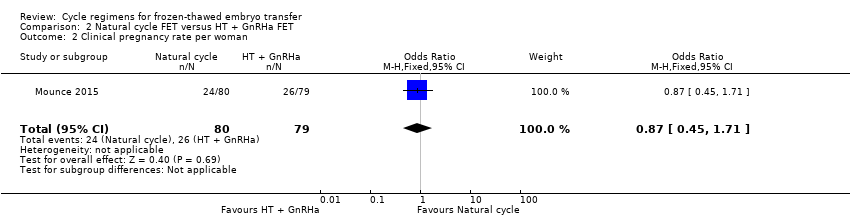
2 Natural cycle FET versus HT plus GnRHa suppression FET
Primary outcomes
2.1 Live birth rate per woman
There was no evidence of a difference between the groups (OR 0.77, 95% CI 0.39 to 1.53, 1 RCT, n = 159, low‐quality evidence). The evidence suggests that if the chance of live birth in an HT plus GnRHa suppression cycle is assumed to be 32%, the chance in a natural cycle would be between 15% and 41% (Analysis 2.1).
Sensitivity analysis using a random‐effects model (OR 0.77, 95% CI 0.39 to 1.53) or RR as a measure of treatment effect (RR 0.83, 95% CI 0.51 to 1.35) did not substantially change our finding.
2.2 Miscarriage rate per woman
No data were available.
Secondary outcomes
2.3 Ongoing pregnancy rate per woman
No data were available.
2.4 Clinical pregnancy rate per woman
There was no evidence of a difference between the groups in the clinical pregnancy rate (OR 0.87, 95% CI 0.45 to 1.71, 1 RCT, n = 159) (Analysis 2.2).
2.5 Multiple pregnancy rate
There was no evidence of a difference between the groups in multiple pregnancy rates (OR 0.58, 95% CI 0.13 to 2.50, 1 RCT, n = 159, low‐quality evidence). The evidence suggests that if the risk of multiple pregnancy following an HT with GnRHa suppression cycle is assumed to be 6%, the risk following a natural cycle would be between 1% and 14% (Analysis 2.3).
2.6 Cycle cancellation rate per woman.
No data were available.
2.7 Endometrial thickness during FET cycle
No data were available.
2.8 Number of centre visits to monitor FET cycle
No data were available.
3. Natural cycle FET versus HMG FET
One study reported this comparison (Peeraer 2015), but no per‐woman outcome data were available. See Table 1, Table 6.
4 Natural cycle FET versus modified natural cycle FET (HCG trigger)
Two studies made this comparison (Fatemi 2010; Weissman 2011).
Primary outcomes
4.1 Live birth rate per woman
One study reported on live birth rate. There was no evidence of a difference between the groups (OR 0.55, 95% CI 0.16 to 1.93, 1 RCT, n = 60, very low‐quality evidence). This evidence suggests that if the chance of live birth in a natural cycle with HCG trigger is assumed to be 27%, the chance in a natural cycle with FET only would be between 6% and 41% (Analysis 3.1).
Sensitivity analysis using a random‐effects model (OR 0.55, 95% CI 0.16 to 1.93) or RR as a measure of treatment effect (RR 0.63, 95% CI 0.23 to 1.69) did not substantially change our finding.
4.2 Miscarriage rate per woman
One study reported on miscarriage. There was no evidence of a difference between the groups (OR 0.20, 95% CI 0.01 to 4.13, 1 RCT, n = 168, very low‐quality evidence). The evidence suggests that if the risk of miscarriage following a natural cycle with HCG trigger is assumed to be 2%, the risk following a natural cycle only would be between 0% and 9%.
Sensitivity analysis using a random‐effects model (OR 0.20, 95% CI 0.01 to 4.13) or RR as a measure of treatment effect (RR 0.20, 95% CI 0.01 to 4.10) did not substantially change our finding (Analysis 3.2).
Secondary outcomes
4.3 Ongoing pregnancy per woman
One study reported ongoing pregnancy. The evidence marginally favoured a natural cycle FET (OR 2.44, 95% CI 1.03 to 5.76, 1 RCT, n = 168, very low‐quality evidence). The evidence suggests that if the chance of ongoing pregnancy following a natural cycle with HCG trigger is assumed to be 11%, the chance following a natural cycle only would be between 11% and 41% (Analysis 3.3).
4.4 Clinical pregnancy per woman
One study reported on clinical pregnancy. There was no evidence of a difference between the groups (OR 1.00, 95% CI 0.32 to 3.14, 1 RCT, n = 60) (Analysis 3.4).
4.5 Multiple pregnancy
No data were available.
4.6 Cycle cancellation rate per woman
No data were available.
4.7 Endometrial thickness during FET cycle
No data were available.
4.8 Number of centre visits to monitor FET cycle
No data were available.
MODIFIED NATURAL CYCLE FET COMPARISONS
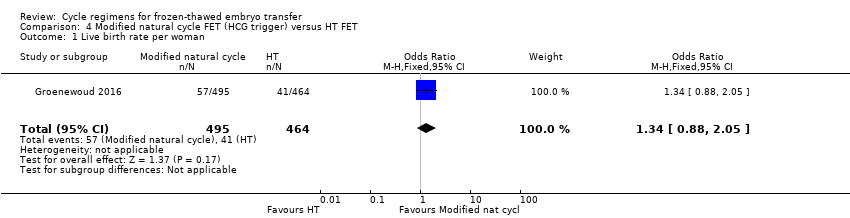
5. Modified natural cycle FET (HCG trigger) versus HT FET
Only one study reported data on this comparison (Groenewoud 2016).
Primary outcomes
5.1 Live birth rate per woman
There was no evidence of a difference between the two groups in the rate of live births (OR 1.34, 95% CI 0.88 to 2.05, 1 RCT, n = 959, low‐quality evidence). The evidence suggests that if the chance of live birth in HT FET cycle is assumed to be 9%, the chance in modified natural cycle FET would be between 8% and 17%. (Analysis 4.1).
5.2 Miscarriage rate per woman
No data were available.
Secondary outcomes
5.3 Ongoing pregnancy rate per woman
There was no evidence of a difference between the two groups in the ongoing pregnancy rate (OR 1.21, 95% CI 0.80 to 1.83, 1 RCT, n = 959, low‐quality evidence). The evidence suggests that if the chance of ongoing pregnancy in HT FET cycle is assumed to be 10%, the chance in modified natural cycle FET would be between 8% and 16%. (Analysis 4.2).
5.4 Clinical pregnancy rate per woman
There was no evidence of a difference in clinical pregnancy rate between the two groups (OR 1.22, 95% CI 0.87 to 1.70, 1 RCT, n = 959) (Analysis 4.3).
5.5 Multiple pregnancy rate per woman
No data were available.
5.6 Cycle cancellation rate per woman
There was evidence of a difference in the rate of cycle cancellation between the two groups with more cycles cancelled in the HT group compared to the modified natural cycle group (OR 0.70, 95% CI 0.52 to 0.95, 1 RCT, n = 959) (Analysis 4.4).
5.7 Endometrial thickness
There was no evidence of a difference between the two groups in endometrial thickness (MD 0.10 mm, 95% CI ‐0.13 to 0.33, 1 RCT, n = 959) (Analysis 4.5).
5.8 Number of centre visits to monitor FET cycle
No data were available.
6. Modified natural cycle FET (HCG trigger) versus HT + GnRHa suppression FET
One trial reported data on this comparison (Greco 2016).
Primary outcomes
6.1 Live birth rate per woman
There was no evidence of a difference between the two groups in live birth rate (OR 1.11, 95% CI 0.66 to 1.87, 1 RCT, n = 236, low‐quality evidence). The evidence suggests that if the chance of live birth in HT plus GnRHa FET cycle is assumed to be 40%, the chance in a modified natural cycle would be between 30% and 55% (Analysis 5.1).
6.2 Miscarriage rate per woman
There was no evidence of a difference between the two groups in the rate of miscarriage (OR 0.74, 95% CI 0.25 to 2.19, 1 RCT, n = 236, low‐quality evidence). The evidence suggests that if the risk of miscarriage in HT plus GnRHa FET cycle is assumed to be 7%, the risk in a modified natural cycle would be between 2% and 14% (Analysis 5.2).
Secondary outcomes
6.3 Ongoing pregnancy rate per woman
No data were available.
6.4 Clinical pregnancy rate per woman
There was no evidence of a difference between the two groups in clinical pregnancy rate (OR 1.07, 95% CI 0.64 to 1.78, 1 RCT, n = 236) (Analysis 5.3).
6.5 Multiple pregnancy rate per woman
No data were available.
6.6 Cycle cancellation rate per woman
No data were available.
6.7 Endometrial thickness
There was no evidence of a difference between the two groups in endometrial thickness (MD ‐0.20 mm, 95% CI ‐0.54 to 0.14, 1 RCT, n = 236) (Analysis 5.4).
6.8 Number of centre visits to monitor FET cycles
No data were available.
HT FET COMPARISONS
7. HT FET versus HT plus GnRHa suppression FET
Seven studies made this comparison (Azimi Nekoo 2015; Dal Prato 2002; Davar 2007; El‐Toukhy 2004; Loh 2001; Ramos 2007; Simon 1998). For Loh 2001 no per‐woman outcome data were available. See Table 4, Table 6.
Primary outcomes
7.1 Live birth rate per woman
There was evidence of a difference between the two groups in live birth rate, with a higher proportion of women who were treated with HT plus GnRHa suppression having live births compared to women treated with HT alone (OR 0.10, 95% CI 0.04 to 0.30, 1 RCT, n = 75, low‐quality evidence). The evidence suggests that if the chance of a live birth following HT plus GnRHa suppression is assumed to be 74%, the chance following treatment with HT alone would be between 10% and 46% (Analysis 6.1).
Sensitivity analysis using a random‐effects model (OR 0.10, 95% CI 0.04 to 0.30) or RR as a measure of treatment effect (RR 0.31, 95% CI 0.17 to 0.55) did not substantially change our finding.
7.2 Miscarriage rate per woman
There was no evidence of a difference between the two groups in miscarriage rate (OR 0.64, 95% CI 0.37 to 1.12, 6 RCTs, n = 991, I2 = 0%, low‐quality evidence). The evidence suggests that if the risk of miscarriage in an HT plus GnRHa suppression cycle is assumed to be 5%, the risk following treatment with HT alone would be between 2% and 5% (Analysis 6.2).
Sensitivity analysis using a random‐effects model (OR 0.73, 95% CI 0.40 to 1.31) or RR as a measure of treatment effect (RR 0.66, 95% CI 0.39 to 1.11) did not substantially change our finding.
Secondary outcomes
7.3 Ongoing pregnancy rate per woman
There was no evidence of a difference between the two groups in ongoing pregnancy rates (OR 1.72, 95% CI 0.61 to 4.85, 1 RCT, n = 106, very low‐quality evidence). The evidence suggests that if the chance of an ongoing pregnancy following treatment with HT plus GnRHa suppression is assumed to be 13%, the chance following treatment with HT alone would be between 9% and 42% (Analysis 6.3).
7.4 Clinical pregnancy rate per woman
There was no evidence of a difference between the two groups in clinical pregnancy rate (OR 0.90, 95% CI 0.65 to 1.25, 5 RCTs, n = 872, I2 = 54%) (Analysis 6.4).
7.5 Multiple pregnancy rate per woman
No data were available.
7.6 Cycle cancellation rate per woman
There was no evidence of a difference between the two groups in cycle cancellation rate (OR 2.73, 95% CI 0.79 to 9.38, 3 RCTs, n = 636, I2 = 0%).(Analysis 6.5).
7.7 Endometrial thickness during FET cycle
There was no evidence of a difference between the two groups in endometrial thickness (MD ‐0.16 mm, 95% CI ‐0.41 to 0.09, 3 RCTs, n = 625, I2 = 79%).( Analysis 6.6).
On sensitivity analysis using a random‐effects estimate, there was a similar pattern of result (MD ‐0.32, 95% CI ‐0.92 to 0.27).
7.8 Number of centre visits to monitor FET cycles
No data were available.
8. HT FET versus FSH ovulation induction
One study made this comparison (Wright 2006)
Primary outcomes
8.1 Live birth rate per woman
No data were available.
8.2 Miscarriage rate per woman
No data were available.
Secondary outcomes
8.3 Ongoing pregnancy rate per woman
No data were available.
8.4 Clinical pregnancy rate per woman
There was no evidence of a difference between the two groups in clinical pregnancy rate (OR 1.09, 95% CI 0.45 to 2.62, 1 RCT, n = 175) (Analysis 7.1).
8.5 Multiple pregnancy rate per woman
No data were available.
8.6 Cycle cancellation rate per woman
There was no evidence of a difference between the two groups in cycle cancellation rates (OR 0.99, 95% CI 0.49 to 2.00, 1 RCT, n = 75) (Analysis 7.2).
3.1.7 Endometrial thickness during FET cycles
There was no evidence of a difference between the two groups in endometrial thickness (MD 0.00 mm, 95% CI ‐0.31 to 0.31, 1 RCT, n = 175) (Analysis 7.3).
8.8 Number of centre visits to monitor FET cycles
No data were reported.
9. HT FET versus HT plus HCG supplement FET
One study made this comparison (Eftekhar 2012), but no outcome data were reported.
COMPARISONS OF SUBTYPES OF OVULATION‐INDUCTION FET
10. HMG FET versus clomiphene + HMG FET
One study made this comparison (Van Der Auwera 1994).
Primary outcomes
10.1 Live birth rate per woman
There were lower live birth rates in women treated with clomiphene plus HMG than in women treated with HMG alone (OR 2.49, 95% CI 1.07 to 5.80, 1 RCT, n = 209, very low‐quality evidence). The evidence suggests that if the chance of a live birth following treatment with clomiphene combined with HMG is assumed to be 8%, the chance following treatment with HMG alone would be between 9% and 35% (Analysis 8.1).
Sensitivity analysis using a random‐effects model (OR 2.49, 95% CI 1.07 to 5.80) or RR as a measure of treatment effect (RR 2.21, 95% CI 1.05 to 4.67) did not substantially change our finding.
10.2 Miscarriage rate per woman
There was no evidence of a difference between the two groups in miscarriage rates (OR 1.33, 95% CI 0.35 to 5.09, 1 RCT, n = 209, very low‐quality evidence). The evidence suggests that if the risk of miscarriage following treatment with clomiphene combined with HMG is assumed to be 4%, the risk following treatment with HMG alone would be between 1% and 16% (Analysis 8.2).
Sensitivity analysis using a random‐effects model (OR 1.33, 95% CI 0.35 to 5.09) or RR as a measure of treatment effect (RR 1.31, 95% CI 0.36 to 4.75) did not substantially change our finding.
Secondary outcomes
10.3 Ongoing pregnancy rate per woman
No data were available.
10.4 Clinical pregnancy rate per woman
No data were available
10.5 Multiple pregnancy rate per woman
There was no evidence of a difference between the two groups in multiple pregnancy rates (OR 1.41, 95% CI 0.31 to 6.48, 1 RCT, n = 209, very low‐quality evidence). The evidence suggests that if the risk of a multiple pregnancy following treatment with clomiphene combined with HMG is assumed to be 3%, the risk following HMG alone would be between 1% and 16% (Analysis 8.3).
10.6 Cycle cancellation rate per woman.
No data were available.
10.7 Endometrial thickness
No data were available.
10.8 Number of centre visits to monitor FET cycles
No data were available.
11. HT plus GnRHa FET versus clomiphene FET
One study made this comparison (Loh 2001), but reported no per‐woman data.
Discussion
Summary of main results
We found 18 RCTs with 3815 participating women. The largest study included 959 women. The mean number of women per trial was 164 (range 60 to 959). Therefore, findings from this review should be interpreted with caution due to the limited number and small size of available RCTs.
Natural cycle FET comparisons
There was no evidence of a difference in live birth, miscarriage or multiple pregnancy rates between women in natural cycle and women undergoing other FET regimens (HT with GnRHa suppression or natural cycle plus HCG trigger). However, women in natural cycle had a marginally higher ongoing pregnancy rate than women who had natural cycle with HCG trigger. This might be attributed to administration of HCG in late follicular phase, which induces a cascade of events in the endometrium and a rise in endogenous luteinising hormone (LH). These events might have a negative impact on implantation and ultimately on ongoing pregnancy rates.
Modified natural cycle FET comparisons
There was no evidence of a difference in the rates of live birth, miscarriage, or ongoing pregnancy between women in modified natural cycle and those undergoing HT FET or HT with GnRHa suppression.
HT FET comparisons
Hormonally prepared (HT) FET cycles combined with GnRHa suppression resulted in higher live birth rates compared with FET cycles prepared with HT alone, but there was no evidence of a difference in miscarriage or ongoing pregnancy rates. The difference in live births may be attributed to a premature rise in LH levels that may occur in women with functioning ovaries not suppressed by a GnRHa. This rise in LH was reported even with no observed follicular recruitment (de Ziegler 1991; Speroff 1994). LH is known to affect endometrial development through its effect on oestrogen and progesterone production but there has also been evidence to suggest that LH promotes localised synthesis of oestrogen and progesterone in the endometrium (Ku 2002; Shemesh 2001). This premature LH rise may interfere with endometrial development and may hinder embryo implantation or it may cause suboptimal embryo implantation.
The review authors acknowledge the difficulty in combining studies in meta‐analyses in the comparison HT versus HT plus GnRHa suppression. One study used a fixed‐dose oestrogen preparation for both groups (El‐Toukhy 2004), while in two studies the starting dose of oestrogen was lower in the HT‐plus‐GnRHa group compared to the HT‐alone group (Dal Prato 2002; Simon 1998). The El‐Toukhy 2004 study may have accounted for the presence of significant heterogeneity observed in one of the outcome measures, that is, endometrial thickness (MD ‐0.16 mm, 95% CI ‐0.41 to 0.09, 3 RCTs, n = 625, I2 = 79%) (Analysis 18.6).
Comparisons of subtypes of ovulation‐induction FET
We identified two subtypes of FET comparisons: HMG versus clomiphene plus HMG; and HT plus GnRHa versus clomiphene. However, there were no per‐woman clinical outcomes reported for HT plus GnRHa versus clomiphene. Women treated with HMG alone reported higher live birth rates compared with those who received clomiphene combined with HMG (Van Der Auwera 1994). There was no evidence of a difference in either miscarriage rates or multiple pregnancy rates
In current practice, most centres use natural cycle or use GnRHa suppression in conjunction with HT for FET. Clomiphene has an anti‐oestrogenic effect on the endometrium leading to suboptimal endometrial development, therefore few centres, if any, are using it for ovulation induction cycle FET. It is highly unlikely that there will be future studies comparing clomiphene with HT only cycles.
Overall completeness and applicability of evidence
We included only 18 RCTs and 3815 women. The included studies did not investigate some of our comparisons in full. In some of those that were investigated, data were either not available on some important outcome measures or were reported in non‐usable forms. The majority of the investigated comparisons were in single, small trials. The largest number of participants that could be combined in this review related to the comparison of HT versus HT plus GnRHa (six RCTs, n = 991). Thus, in most of the comparisons, we could not combine data in meta‐analyses for some outcome measures, resulting in effect estimates with wide CIs. In addition, most of the included studies were not adequately powered to detect any significant difference in treatment effects between the various treatment groups. In addition, the majority of the trials included women with regular ovulatory cycles with no information on women with anovulatory cycles In all, the body of current identified evidence does not allow a robust conclusion regarding the superiority of one cycle regimen over another in preparation for FET.
Quality of the evidence
The overall quality of the evidence was low or very low. The main limitations were failure to report important clinical outcomes, poor reporting of study methods and lack of precision due to low event rates.
The quality of fertility trials has been criticised repeatedly. One of the areas of particular concern is what statisticians refer to as the 'unit of analysis' error (Vail 2003). It is methodologically incorrect to report data per cycle when it is women or couples who are randomized because many of the women will have undergone more than one treatment cycle (Dias 2008; Johnson 2003; Vail 2003). However, pregnancy rate per cycle is a commonly reported outcome in fertility trials and reviews.
Potential biases in the review process
To prevent selection bias, two review authors independently assessed the included studies. The review was undertaken using its protocol as a guide to minimise bias as much as possible (Ghobara 2002). For meta‐analysis, the unit of analysis was 'per woman randomized' resulting in the exclusion of outcomes reported in 'per‐cycle'. As a result, the analyses are statistically less biased although a selection bias may have occurred.
We conducted a comprehensive search for eligible studies so as to minimise the effect of publication bias. However, we could not construct funnel plots for any comparisons thereby making it difficult to detect the presence of publication bias.
Agreements and disagreements with other studies or reviews
Findings from the current and previous versions of the review were essentially similar and substantially in agreement with each other (see Ghobara 2008 for previous version of the review).
In nine non‐randomised controlled studies, there was no evidence of a difference in either clinical or multiple pregnancy rates between women who had natural cycle FET and women who had HT FET (Belaisch‐Allart 1994; Dolan 1991; Dor 1991; Givens 2007; Kawamura 2007; Oehninger 2000; Pattinson 1992; Schmidt 1989; Yishai 2001). These findings are in agreement with those of this review. In contrast, however, results of three retrospective studies comparing these two regimens showed higher pregnancy rates in the natural‐cycle group (Gonzalez 1992; Loh 1999; Morozov 2007).
We found one quasi‐randomised study involving 162 cycles (Sathanandan 1991) and five non‐randomised controlled studies assessing natural‐cycle FET versus HT plus GnRHa suppression (149 cycles (Al‐Shawaf 1993), 419 cycles (Chen 2007), 417 cycles (Gelbaya 2006), 512 cycles (Queenan 1994), 125 cycles (Wada 1992)). There were no differences in live birth or clinical pregnancy rates in any of these studies. Again, these findings are in agreement with those of this review.

Study flow diagram

Risk of bias graph: review authors' judgements about each risk of bias item presented as percentages across all included studies

Risk of bias summary: review authors' judgements about each risk of bias item for each included study
Comparison 1 Natural cycle FET versus HT FET, Outcome 1 Clinical pregnancy rate per woman.

Comparison 1 Natural cycle FET versus HT FET, Outcome 2 Multiple pregnancy rate per woman.

Comparison 2 Natural cycle FET versus HT + GnRHa FET, Outcome 1 Live birth rate per woman.
Comparison 2 Natural cycle FET versus HT + GnRHa FET, Outcome 2 Clinical pregnancy rate per woman.

Comparison 2 Natural cycle FET versus HT + GnRHa FET, Outcome 3 Multiple pregnancy rate per woman.

Comparison 3 Natural cycle FET versus modified natural cycle FET (HCG trigger), Outcome 1 Live birth rate per woman.

Comparison 3 Natural cycle FET versus modified natural cycle FET (HCG trigger), Outcome 2 Miscarriage rate per woman.

Comparison 3 Natural cycle FET versus modified natural cycle FET (HCG trigger), Outcome 3 Ongoing pregnancy rate per woman.

Comparison 3 Natural cycle FET versus modified natural cycle FET (HCG trigger), Outcome 4 Clinical pregnancy rate per woman.
Comparison 4 Modified natural cycle FET (HCG trigger) versus HT FET, Outcome 1 Live birth rate per woman.

Comparison 4 Modified natural cycle FET (HCG trigger) versus HT FET, Outcome 2 Ongoing pregnancy rate per woman.
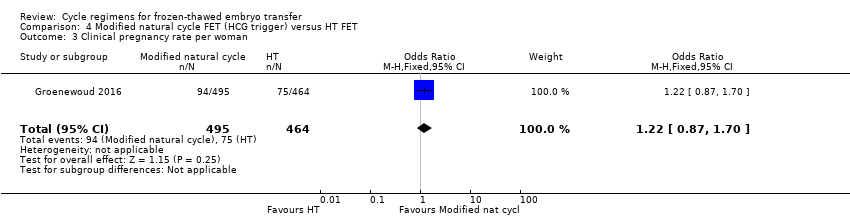
Comparison 4 Modified natural cycle FET (HCG trigger) versus HT FET, Outcome 3 Clinical pregnancy rate per woman.

Comparison 4 Modified natural cycle FET (HCG trigger) versus HT FET, Outcome 4 Cycle cancellation rate per woman.
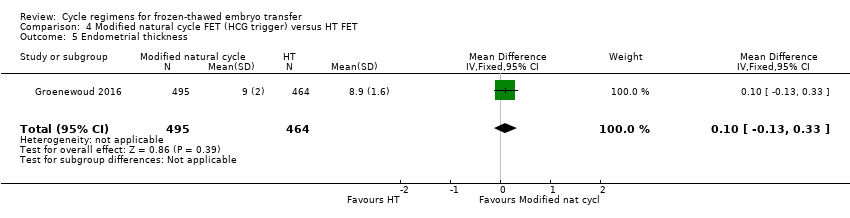
Comparison 4 Modified natural cycle FET (HCG trigger) versus HT FET, Outcome 5 Endometrial thickness.

Comparison 5 Modified natural cycle FET (HCG trigger) versus HT + GnRH‐a FET, Outcome 1 Live birth rate per woman.

Comparison 5 Modified natural cycle FET (HCG trigger) versus HT + GnRH‐a FET, Outcome 2 Miscarriage rate per woman.
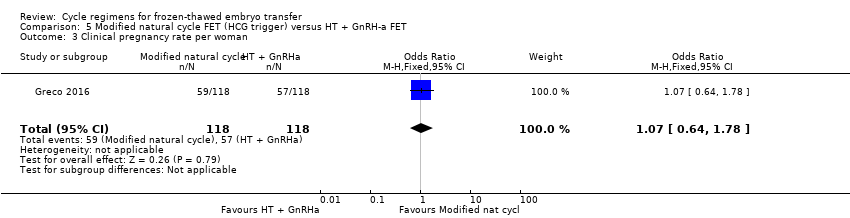
Comparison 5 Modified natural cycle FET (HCG trigger) versus HT + GnRH‐a FET, Outcome 3 Clinical pregnancy rate per woman.
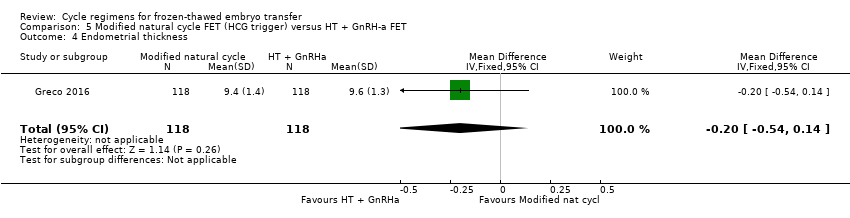
Comparison 5 Modified natural cycle FET (HCG trigger) versus HT + GnRH‐a FET, Outcome 4 Endometrial thickness.

Comparison 6 HT FET versus HT + GnRH‐a, Outcome 1 Live birth rate per woman.
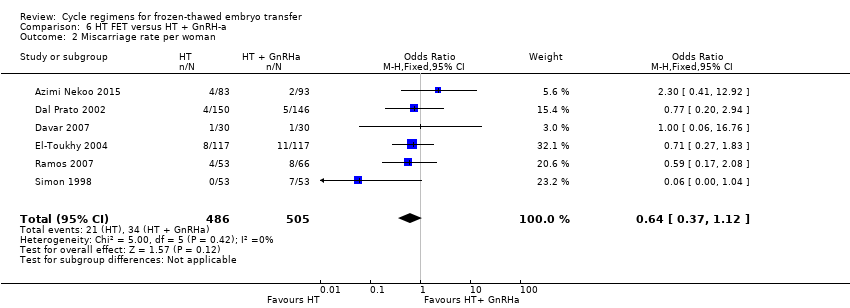
Comparison 6 HT FET versus HT + GnRH‐a, Outcome 2 Miscarriage rate per woman.
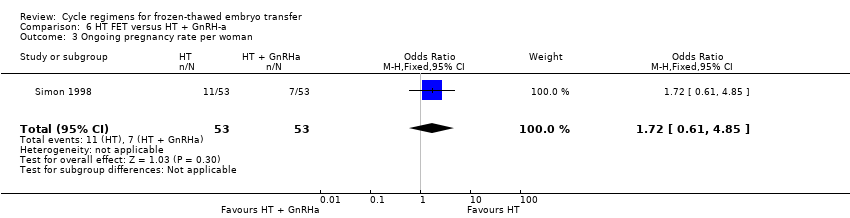
Comparison 6 HT FET versus HT + GnRH‐a, Outcome 3 Ongoing pregnancy rate per woman.
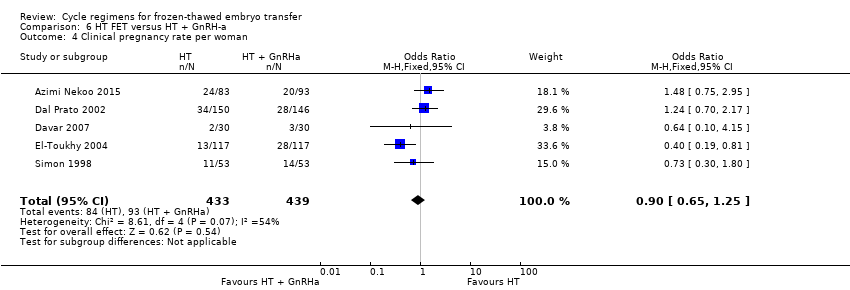
Comparison 6 HT FET versus HT + GnRH‐a, Outcome 4 Clinical pregnancy rate per woman.

Comparison 6 HT FET versus HT + GnRH‐a, Outcome 5 Cycle cancellation rate per woman.
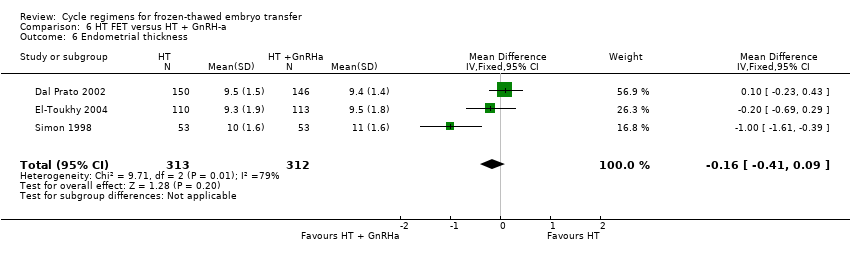
Comparison 6 HT FET versus HT + GnRH‐a, Outcome 6 Endometrial thickness.
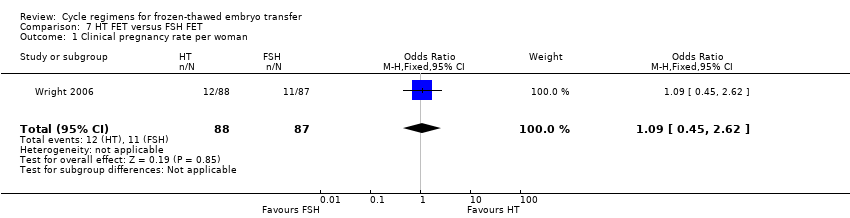
Comparison 7 HT FET versus FSH FET, Outcome 1 Clinical pregnancy rate per woman.

Comparison 7 HT FET versus FSH FET, Outcome 2 Cycle cancellation rate per woman.

Comparison 7 HT FET versus FSH FET, Outcome 3 Endometrial thickness.

Comparison 8 HMG FET versus clomiphene + HMG FET, Outcome 1 Live birth rate per woman.

Comparison 8 HMG FET versus clomiphene + HMG FET, Outcome 2 Miscarriage rate per woman.
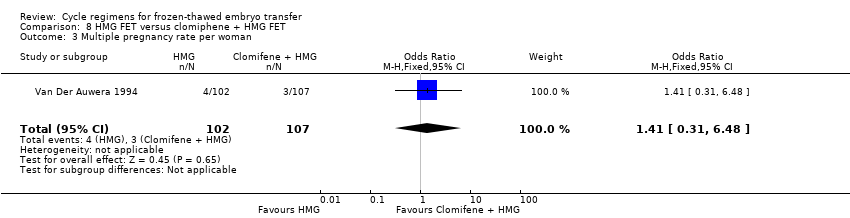
Comparison 8 HMG FET versus clomiphene + HMG FET, Outcome 3 Multiple pregnancy rate per woman.
| Natural cycle FET versus HT FET | ||||||
| Population: subfertile women | ||||||
| Outcomes | Illustrative comparative risks* (95% CI) | Relative effect | No of participants | Quality of the evidence | Comments | |
| Assumed risk | Corresponding risk | |||||
| HT FET | Natural cycle FET | |||||
| Live birth rate per woman | No data available | Not estimable | ‐ | |||
| Miscarriage rate per woman | No data available | Not estimable | ‐ | |||
| Ongoing pregnancy rate per woman | No data available | Not estimable | ‐ | |||
| Multiple pregnancy rate per woman | See comment | OR 2.48 | 21 | ⊕⊝⊝⊝ | No events in the control group | |
| *The basis for the assumed risk (e.g. the median control group risk across studies) is provided in footnotes. The corresponding risk (and its 95% confidence interval) is based on the assumed risk in the comparison group and the relative effect of the intervention (and its 95% CI). | ||||||
| GRADE Working Group grades of evidence | ||||||
| 1Downgraded one level for serious risk of bias: study at unclear risk of bias in all domains. | ||||||
| Natural cycle FET versus HT + GnRHa suppression FET | ||||||
| Population: subfertile women | ||||||
| Outcomes | Illustrative comparative risks* (95% CI) | Relative effect | No of participants | Quality of the evidence | Comments | |
| Assumed risk | Corresponding risk | |||||
| HT + GnRHa FET | Natural cycle FET | |||||
| Live birth rate per woman | 316 per 1000 | 262 per 1000 | OR 0.77 | 159 | ⊕⊕⊝⊝ | Only 46 events |
| Miscarriage rate per woman | No data available | Not estimable | ‐ | |||
| Ongoing pregnancy rate per woman | No data available | Not estimable | ‐ | |||
| Multiple pregnancy rate per woman | 63 per 1000 | 38 per 1000 | OR 0.58 | 159 | ⊕⊕⊝⊝ | Only 8 events |
| *The basis for the assumed risk (e.g. the median control group risk across studies) is provided in footnotes. The corresponding risk (and its 95% confidence interval) is based on the assumed risk in the comparison group and the relative effect of the intervention (and its 95% CI). | ||||||
| GRADE Working Group grades of evidence | ||||||
| 1Downgraded two levels due to very serious imprecision: single study, few events, confidence interval compatible with benefit in either group or with no effect. | ||||||
| Natural cycle FET versus other regimens for primary or secondary subfertility | ||||||
| Population: subfertile women | ||||||
| Outcomes | Illustrative comparative risks* (95% CI) | Relative effect | No of participants | Quality of the evidence | Comments | |
| Assumed risk | Corresponding risk | |||||
| Modified natural cycle FET (HCG trigger) | Natural cycle FET | |||||
| Live birth rate per woman | 267 per 1000 | 167 per 1000 | OR 0.55 | 60 | ⊕⊝⊝⊝ | Only 13 events |
| Miscarriage rate per woman | 24 per 1000 | 5 per 1000 | OR 0.20 | 168 | ⊕⊝⊝⊝ | Only 2 events |
| Ongoing pregnancy rate per woman | 107 per 1000 | 226 per 1000 | OR 2.44 | 168 | ⊕⊝⊝⊝ | Only 28 events |
| Multiple pregnancy per woman | No data available | |||||
| *The basis for the assumed risk is the mean control group risk across studies. The corresponding risk (and its 95% confidence interval) is based on the assumed risk in the comparison group and the relative effect of the intervention (and its 95% CI). | ||||||
| GRADE Working Group grades of evidence | ||||||
| 1One other study compared natural cycle FET versus natural cycle plus human menopausal gonadotrophin, but did not report any per‐woman data. | ||||||
| Modified natural cycle FET (HCG trigger) versus HT FET | ||||||
| Population: subfertile women | ||||||
| Outcomes | Illustrative comparative risks* (95% CI) | Relative effect | No of participants | Quality of the evidence | Comments | |
| Assumed risk | Corresponding risk | |||||
| HT FET | Modified natural cycle FET (HCG trigger) | |||||
| Live birth rate per woman | 88 per 1000 | 114 per 1000 | OR 1.34 | 959 | ⊕⊕⊝⊝ | |
| Miscarriage rate per woman | No data available | Not estimable | ‐ | |||
| Ongoing pregnancy rate per woman | 97 per 1000 | 115 per 1000 | OR 1.21 | 959 | ⊕⊕⊝⊝ | |
| Multiple pregnancy rate per woman | No data available | Not estimable | ‐ | |||
| *The basis for the assumed risk (e.g. the median control group risk across studies) is provided in footnotes. The corresponding risk (and its 95% confidence interval) is based on the assumed risk in the comparison group and the relative effect of the intervention (and its 95% CI). | ||||||
| GRADE Working Group grades of evidence | ||||||
| 1Downgraded one level due to serious risk of bias: high attrition rate, unclear risk of allocation concealment | ||||||
| Modified natural cycle FET (HCG trigger) versus HT + GnRHa FET | ||||||
| Population: subfertile women | ||||||
| Outcomes | Illustrative comparative risks* (95% CI) | Relative effect | No of participants | Quality of the evidence | Comments | |
| Assumed risk | Corresponding risk | |||||
| HT + GnRHa FET | Modified natural cycle FET (HCG trigger) | |||||
| Live birth rate per woman | 398 per 1000 | 423 per 1000 | OR 1.11 | 236 | ⊕⊕⊝⊝ | |
| Miscarriage rate per woman | 68 per 1000 | 51 per 1000 | OR 0.74 | 236 | ⊕⊕⊝⊝ | |
| Ongoing pregnancy rate | No data available | Not estimable | ‐ | |||
| Multiple pregnancy rate per woman | No data available | Not estimable | ‐ | |||
| *The basis for the assumed risk is the mean control group risk across studies. The corresponding risk (and its 95% confidence interval) is based on the assumed risk in the comparison group and the relative effect of the intervention (and its 95% CI). | ||||||
| GRADE Working Group grades of evidence | ||||||
| 1Downgraded one level due to serious risk of bias: study at unclear risk of in most domains of bias (allocation concealment, blinding, selective reporting and other sources of bias). | ||||||
| HT FET versus other regimens for primary or secondary subfertility | ||||||
| Population: women with primary or secondary subfertility | ||||||
| Outcomes | Illustrative comparative risks* (95% CI) | Relative effect | No of participants | Quality of the evidence | Comments | |
| Assumed risk | Corresponding risk | |||||
| HT + GnRHa FET | HT FET | |||||
| Live birth rate per woman | 742 per 1000 | 223 per 1000 | OR 0.10 | 75 | ⊕⊕⊝⊝ | Only 33 events |
| Miscarriage rate per woman | 48 per 1000 | 31 per 1000 | OR 0.64 | 991 | ⊕⊕⊝⊝ | ‐ |
| Ongoing pregnancy rate per woman | 132 per 1000 | 207 per 1000 | OR 1.72 | 106 | ⊕⊝⊝⊝ | Only 18 events |
| Multiple pregnancy rate per woman | No data available | |||||
| *The basis for the assumed risk is the mean control group risk across studies. The corresponding risk (and its 95% confidence interval) is based on the assumed risk in the comparison group and the relative effect of the intervention (and its 95% CI). | ||||||
| GRADE Working Group grades of evidence | ||||||
| 1Downgraded one level due to serious imprecision: single study, few events. | ||||||
| HMG FET versus clomiphene + HMG FET | ||||||
| Population: subfertile women | ||||||
| Outcomes | Illustrative comparative risks* (95% CI) | Relative effect | No of participants | Quality of the evidence | Comments | |
| Assumed risk | Corresponding risk | |||||
| Clomiphene+ HMG FET | HMG FET | |||||
| Live birth rate per woman | 84 per 1000 | 186 per 1000 | OR 2.49 | 209 | ⊕⊝⊝⊝ | Only 26 events |
| Miscarriage rate per woman | 37 per 1000 | 49 per 1000 | OR 1.33 | 209 | ⊕⊝⊝⊝ | Only 9 events |
| Ongoing pregnancy rate per woman | No data available | Not estimable | ‐ | |||
| Multiple pregnancy rate per woman | 28 per 1000 | 39 per 1000 | OR 1.41 | 209 | ⊕⊝⊝⊝ | Only 7 events |
| *The basis for the assumed risk (e.g. the median control group risk across studies) is provided in footnotes. The corresponding risk (and its 95% confidence interval) is based on the assumed risk in the comparison group and the relative effect of the intervention (and its 95% CI). | ||||||
| GRADE Working Group grades of evidence | ||||||
| 1Downgraded one level for serious risk of bias: study at unclear risk of bias in all domains. | ||||||
| Study | Intervention (number of embryo transfer) | Control (number of embryo transfer) | Live birth rate | P value |
| Natural cycle FET (n = 332) | HMG FET (n = 340) | 32/332 vs 45/340 | n/s | |
| FET: frozen‐thawed embryo transfer; HMG: human menopausal gonadotrophin; n/s: not significant. | ||||
| Study | Intervention (number of embryo transfer) | Control (number of embryo transfer) | Miscarriage rate | P value |
| Natural cycle FET | HT FET | 41.7% vs 22.2% | n/s | |
| FET: frozen‐thawed embryo transfer; HT: hormone therapy; n/s: not significant. | ||||
| Study | Intervention (number of embryo transfer) | Control (number of embryo transfer) | Ongoing pregnancy rate | P value |
| Natural cycle FET | HT FET | 24.1% vs 21.9% | n/s | |
| FET: frozen‐thawed embryo transfer; HT: hormone therapy; n/s: not significant. | ||||
| Study | Intervention (number of cycles) | Control (number of cycles) | Clinical pregnancy rate | P value |
| Clomiphene‐induced ovulation (n = 35) | HT (n = 52) | 3/35 vs 5/52 | n/s | |
| Clomiphene‐induced ovulation (n = 32) | HT plus GnRHa trigger (n = 37) | 2/32 vs 6/37 | n/s | |
| GnRHa: gonadotrophin releasing hormone agonist; HT: hormone therapy; n/s: not significant. | ||||
| Study | Intervention (number of embryo transfer) | Control (number of embryo transfer) | Clinical pregnancy rate | P value |
| Natural cycle FET | HT FET | 27.6% vs 25% | n/s | |
| FET: frozen‐thawed embryo transfer; HT: hormone therapy; n/s: not significant. | ||||
| Study | Intervention (number of cycles/embryo transfer) | Control (number of cycles/embryo transfer) | Endometrial thickness | P value |
| Clomiphene‐induced ovulation (n = 67) | HT alone or HT plus GnRHa suppression (n = 37) | 9.7 vs 9.8 | n/s | |
| Natural cycle FET (n = 332) | HMG FET (n = 340) | 8.9 vs 8.9 | n/s | |
| FET: frozen‐thawed embryo transfer; GnRHa: gonadotrophin releasing hormone agonist; HMG: human menopausal gonadotrophin; HT: hormone therapy; n/s: not significant. | ||||
| Outcome or subgroup title | No. of studies | No. of participants | Statistical method | Effect size |
| 1 Clinical pregnancy rate per woman Show forest plot | 1 | 100 | Odds Ratio (M‐H, Fixed, 95% CI) | 1.06 [0.40, 2.80] |
| 2 Multiple pregnancy rate per woman Show forest plot | 1 | 21 | Odds Ratio (M‐H, Fixed, 95% CI) | 2.48 [0.09, 68.14] |
| Outcome or subgroup title | No. of studies | No. of participants | Statistical method | Effect size |
| 1 Live birth rate per woman Show forest plot | 1 | 159 | Odds Ratio (M‐H, Fixed, 95% CI) | 0.77 [0.39, 1.53] |
| 2 Clinical pregnancy rate per woman Show forest plot | 1 | 159 | Odds Ratio (M‐H, Fixed, 95% CI) | 0.87 [0.45, 1.71] |
| 3 Multiple pregnancy rate per woman Show forest plot | 1 | 159 | Odds Ratio (M‐H, Fixed, 95% CI) | 0.58 [0.13, 2.50] |
| Outcome or subgroup title | No. of studies | No. of participants | Statistical method | Effect size |
| 1 Live birth rate per woman Show forest plot | 1 | 60 | Odds Ratio (M‐H, Fixed, 95% CI) | 0.55 [0.16, 1.93] |
| 2 Miscarriage rate per woman Show forest plot | 1 | 168 | Odds Ratio (M‐H, Fixed, 95% CI) | 0.20 [0.01, 4.13] |
| 3 Ongoing pregnancy rate per woman Show forest plot | 1 | 168 | Odds Ratio (M‐H, Fixed, 95% CI) | 2.44 [1.03, 5.76] |
| 4 Clinical pregnancy rate per woman Show forest plot | 1 | 60 | Odds Ratio (M‐H, Fixed, 95% CI) | 1.0 [0.32, 3.14] |
| Outcome or subgroup title | No. of studies | No. of participants | Statistical method | Effect size |
| 1 Live birth rate per woman Show forest plot | 1 | 959 | Odds Ratio (M‐H, Fixed, 95% CI) | 1.34 [0.88, 2.05] |
| 2 Ongoing pregnancy rate per woman Show forest plot | 1 | 959 | Odds Ratio (M‐H, Fixed, 95% CI) | 1.21 [0.80, 1.83] |
| 3 Clinical pregnancy rate per woman Show forest plot | 1 | 959 | Odds Ratio (M‐H, Fixed, 95% CI) | 1.22 [0.87, 1.70] |
| 4 Cycle cancellation rate per woman Show forest plot | 1 | 959 | Odds Ratio (M‐H, Fixed, 95% CI) | 0.70 [0.52, 0.95] |
| 5 Endometrial thickness Show forest plot | 1 | 959 | Mean Difference (IV, Fixed, 95% CI) | 0.10 [‐0.13, 0.33] |
| Outcome or subgroup title | No. of studies | No. of participants | Statistical method | Effect size |
| 1 Live birth rate per woman Show forest plot | 1 | 236 | Odds Ratio (M‐H, Fixed, 95% CI) | 1.11 [0.66, 1.87] |
| 2 Miscarriage rate per woman Show forest plot | 1 | 236 | Odds Ratio (M‐H, Fixed, 95% CI) | 0.74 [0.25, 2.19] |
| 3 Clinical pregnancy rate per woman Show forest plot | 1 | 236 | Odds Ratio (M‐H, Fixed, 95% CI) | 1.07 [0.64, 1.78] |
| 4 Endometrial thickness Show forest plot | 1 | 236 | Mean Difference (IV, Fixed, 95% CI) | ‐0.20 [‐0.54, 0.14] |
| Outcome or subgroup title | No. of studies | No. of participants | Statistical method | Effect size |
| 1 Live birth rate per woman Show forest plot | 1 | 75 | Odds Ratio (M‐H, Fixed, 95% CI) | 0.10 [0.04, 0.30] |
| 2 Miscarriage rate per woman Show forest plot | 6 | 991 | Odds Ratio (M‐H, Fixed, 95% CI) | 0.64 [0.37, 1.12] |
| 3 Ongoing pregnancy rate per woman Show forest plot | 1 | 106 | Odds Ratio (M‐H, Fixed, 95% CI) | 1.72 [0.61, 4.85] |
| 4 Clinical pregnancy rate per woman Show forest plot | 5 | 872 | Odds Ratio (M‐H, Fixed, 95% CI) | 0.90 [0.65, 1.25] |
| 5 Cycle cancellation rate per woman Show forest plot | 3 | 636 | Odds Ratio (M‐H, Fixed, 95% CI) | 2.73 [0.79, 9.38] |
| 6 Endometrial thickness Show forest plot | 3 | 625 | Mean Difference (IV, Fixed, 95% CI) | ‐0.16 [‐0.41, 0.09] |
| Outcome or subgroup title | No. of studies | No. of participants | Statistical method | Effect size |
| 1 Clinical pregnancy rate per woman Show forest plot | 1 | 175 | Odds Ratio (M‐H, Fixed, 95% CI) | 1.09 [0.45, 2.62] |
| 2 Cycle cancellation rate per woman Show forest plot | 1 | 175 | Odds Ratio (M‐H, Fixed, 95% CI) | 0.99 [0.49, 2.00] |
| 3 Endometrial thickness Show forest plot | 1 | 175 | Mean Difference (IV, Fixed, 95% CI) | 0.0 [‐0.31, 0.31] |
| Outcome or subgroup title | No. of studies | No. of participants | Statistical method | Effect size |
| 1 Live birth rate per woman Show forest plot | 1 | 209 | Odds Ratio (M‐H, Fixed, 95% CI) | 2.49 [1.07, 5.80] |
| 2 Miscarriage rate per woman Show forest plot | 1 | 209 | Odds Ratio (M‐H, Fixed, 95% CI) | 1.33 [0.35, 5.09] |
| 3 Multiple pregnancy rate per woman Show forest plot | 1 | 209 | Odds Ratio (M‐H, Fixed, 95% CI) | 1.41 [0.31, 6.48] |