Exercise therapy for chronic fatigue syndrome
Referencias
References to studies included in this review
References to studies excluded from this review
References to studies awaiting assessment
References to ongoing studies
Additional references
Characteristics of studies
Characteristics of included studies [ordered by study ID]
| Methods | RCT, 2 parallel arms | |
| Participants | Diagnostic criteria: Oxford Number of participants: N = 66 Gender: 49 (65%) female Earlier treatment: NS Co‐morbidity: 20 (30%) possible cases of depression (HADS): 30 (45%) on full‐dose antidepressant (n = 20) or low‐dose tricyclic antidepressants as hypnotics (n = 10) Average illness duration: 2.7 (0.6 to 19) years Work and employment status: 26 (395) working or studying at least part time Setting: secondary care (chronic fatigue clinic in a general hospital of psychiatry) Country: UK | |
| Interventions | Group 1: exercise therapy (12 sessions) with 1 weekly supervised session and 5 home sessions a week, initially lasting between 5 and 15 minutes (n = 33) | |
| Outcomes |
Outcomes were assessed at end of treatment (12 weeks) | |
| Notes | No long‐term follow‐up, as participants who completed the flexibility programme were invited to cross over to the exercise programme afterwards | |
| Risk of bias | ||
| Bias | Authors' judgement | Support for judgement |
| Random sequence generation (selection bias) | Low risk | Quote: "determined by random number tables" |
| Allocation concealment (selection bias) | Low risk | Quote: "Randomisation was achieved blindly to the psychiatrist and independently of the exercise physiologist by placing the letter E or F in 66 separate blank envelopes. These were then arranged in random order determined by random number tables and opened by an independent administrator after baseline tests as each new patient entered the study" |
| Blinding (performance bias and detection bias) | High risk | Not possible to blind participants or personnel (supervisors) to treatment allocation |
| Blinding (performance bias and detection bias) | High risk | Blinding not possible for self‐reported measurements (e.g. FS, SF‐36) |
| Incomplete outcome data (attrition bias) | Low risk | Quote: "We completed follow up assessments on four of the seven patients who dropped out of treatment and included these data in the intention to treat analysis. Patients with missing data were counted as nonimprovers" |
| Selective reporting (reporting bias) | Unclear risk | All primary outcomes stated under Methods were reported; however, as the trial protocol is not available, we cannot categorically state that the review is free of selective outcome reporting |
| Other bias | Low risk | We do not suspect other bias |
| Methods | RCT, 4 parallel arms | |
| Participants | Diagnostic criteria: CDC 1994 Number of participants: N = 114 Gender: 95 (83.3%) female Age: 43.8 years Earlier treatment: NS Co‐morbidity: 44 (39%) with a current Axis I disorder (depression and anxiety most common). Use of antidepressant not stated Illness duration: > 5 years Work and employment status: 52 (46%) working or studying at least part time, 24% unemployed, 6% retired, 25% on disability Setting: secondary care, but recruitment from different sources Country: USA | |
| Interventions | 13 sessions every 2 weeks lasting 45 minutes Group 1: cognitive‐behavioural therapy (CBT) aimed at showing participants that activity could be done without exacerbating symptoms (n = 29) Group 2: anaerobic activity therapy (ACT) focused on developing individualised and pleasurable activities accompanied by reinforcement of progress (n = 29) Group 3: cognitive therapy treatment(COG) focused on developing strategies to better tolerance, reduce stress and symptoms and lessen self‐criticism (n = 28) Group 4: relaxation treatment (RELAX) introducing several types of relaxation techniques along with expectations of skill practice (n = 28) | |
| Outcomes | Several outcomes are reported (˜25), among others.
Outcomes assessed at 12 months' follow‐up | |
| Notes | Fidelity ratings and drop‐out reported across study arms | |
| Risk of bias | ||
| Bias | Authors' judgement | Support for judgement |
| Random sequence generation (selection bias) | Low risk | Quote: "Random assignment was done using a random number generator in statistical software (SPSS version 12)" |
| Allocation concealment (selection bias) | Unclear risk | Not stated |
| Blinding (performance bias and detection bias) | High risk | Not possible to blind participants or personnel (supervisors) to treatment allocation |
| Blinding (performance bias and detection bias) | High risk | Blinding not possible for self‐reported measurements (e.g. FSS, BPI) |
| Incomplete outcome data (attrition bias) | High risk | Quote: "The average dropout rate was 25%, but it was not significantly different per condition." The statistical analysis used, the best linear unbiased predictor, is a way to avoid taking missing data into account |
| Selective reporting (reporting bias) | Unclear risk | All primary outcomes stated under Methods were reported; however, as the trial protocol is not available, we cannot categorically state that the review is free of selective outcome reporting |
| Other bias | High risk | Baseline data differences across groups for several important parameters (e.g. physical functioning: ACT group 39.17 (15.65) and RELAX group 53.77 (26.66)) |
| Methods | RCT, 2 parallel arms | |
| Participants | Diagnostic criteria: CDC 1994 Number of participants: N = 49 Gender: 34 (69%) female Earlier treatment: NS Co‐morbidity, mean (SD): 14 (29%) possible or probable cases of depression (HADS). HADSAnxiety 6.72(3.44) in treatment group and 7.17 (3.43) in control group. HADSDepression 5.70 (2.69) in treatment group and 6.70 (0.67) in control group. Use of antidepressant not stated Illness duration, median (range): 3.1 years, 2.67 (0.6 to 20) in treatment group and 5 (0.5 to 45) in control group Work and employment status: 11 (22%) unemployed and unable to work because of disability Country: New Zealand | |
| Interventions | Group 1: graded exercise therapy (12 weeks), met weekly, final goal 30 minutes for 5 days a week, 70% of VO2max (n = 25) | |
| Outcomes |
Outcomes assessed at end of treatment (12 weeks). A self‐report questionnaire was distributed at 6 months' follow‐up and was returned by 16 exercise participants and 17 control participants | |
| Notes | The exact components involved in 'treatment as usual' are not explained | |
| Risk of bias | ||
| Bias | Authors' judgement | Support for judgement |
| Random sequence generation (selection bias) | Low risk | Quote: "...randomised into either treatment or control conditions by means of a sequence of computer generated numbers placed in sealed opaque envelopes by an independent administrator" |
| Allocation concealment (selection bias) | Low risk | Quote: "placed in sealed opaque envelopes by an independent administrator" |
| Blinding (performance bias and detection bias) | High risk | Not possible to blind participants or personnel (supervisors) to treatment allocation |
| Blinding (performance bias and detection bias) | High risk | Blinding not possible for self‐reported measurements (e.g. FS, SF‐36) |
| Incomplete outcome data (attrition bias) | Low risk | 3 of 25 participants (12%) dropped out from exercise treatment. Reasons for drop‐out: 1 had to return to the USA, 1 had an injured calf and 1 was not reached at follow‐up. 3 of 24 patients (12.5%) in control group did not return follow‐up questionnaire at 12 weeks. To determine whether drop‐out affected the calculated treatment effect, study authors completed intention‐to‐treat analysis |
| Selective reporting (reporting bias) | Unclear risk | All primary outcomes stated under Methods were reported; however, as the trial protocol is not available, we cannot categorically state that the review is free of selective outcome reporting |
| Other bias | Low risk | We do not suspect other bias |
| Methods | RCT, 4 parallel arms | |
| Participants | Diagnostic criteria: Oxford Gender: 116 (78%) female Age, mean: 33 years Earlier treatment: NS Co‐morbidity: 58 (39%) possible cases of depression (HADS), 27 (18%) used antidepressants Illness duration: 4.3 years Work and employment status: 50 (34%) working, 64 (43%) on disability Country: UK | |
| Interventions | Group 1: treatment as usual (n = 34) Group 2: exercise therapy + 2 sessions (total 3 hours, n = 37) Sessions, whether telephone or face‐to‐face, were used to reiterate the treatment rationale and to discuss problems associated with graded exercise | |
| Outcomes |
Outcomes assessed at 3 (end treatment), 6 and 12 months | |
| Notes | Treatment as usual comprised a medical assessment, advice and an information booklet that encouraged graded activity and positive thinking but gave no explanations for symptoms. SF‐36 physical functioning subscale is reported on a 10 to 30 scale. We transformed scores from the 10 to 30 scale to the more common 0 to 100 scale by using the following formula: meannew = (meanold ‐ 10) * 5 and SDnew = 5 * SDold | |
| Risk of bias | ||
| Bias | Authors' judgement | Support for judgement |
| Random sequence generation (selection bias) | Low risk | Quote: "Randomised into four groups by means of a sequence of computer generated random numbers...simple randomisation with stratification for scores on the hospital anxiety and depression scale, 15, using a cut off of 11 to indicate clinical depression" |
| Allocation concealment (selection bias) | Unclear risk | Quote: "...in sealed numbered envelopes" |
| Blinding (performance bias and detection bias) | High risk | Not possible for this intervention |
| Blinding (performance bias and detection bias) | High risk | Blinding not possible for self‐reported measurements (e.g. FS, SF‐36) |
| Incomplete outcome data (attrition bias) | Low risk | Quote: "We used an intention to treat analysis. For patients who dropped out of treatment, the last values obtained were carried forward. Complete data were obtained for all patients who completed treatment except for three: two did not complete the questionnaire at three months and one did not complete the questionnaire at one year" |
| Selective reporting (reporting bias) | Unclear risk | All primary outcomes stated under Methods were reported; however, as the trial protocol is not available, we cannot categorically state that the review is free of selective outcome reporting |
| Other bias | Low risk | We do not suspect other bias |
| Methods | RCT, 2 parallel arms | |
| Participants | Diagnostic criteria: CDC 1994 Number of participants: N = 68 Gender: 47 (77%) female Earlier treatment: NS Co‐morbidity: possible depression not stated, 16 (26%) used antidepressants Illness duration: no initial difference between groups Work and employment status: not stated Country: Western Australia | |
| Interventions | Group 1: prescribed exercise therapy, 12 weeks (n = 32) | |
| Outcomes |
Outcomes assessed at 12 weeks (end of treatment) | |
| Notes | Supplementary HADS data obtained from study authors for first version of this review | |
| Risk of bias | ||
| Bias | Authors' judgement | Support for judgement |
| Random sequence generation (selection bias) | Unclear risk | Quote: "...patients were randomised (by an independent investigator)" |
| Allocation concealment (selection bias) | Unclear risk | Not adequately described |
| Blinding (performance bias and detection bias) | High risk | Not possible to blind participants or personnel (supervisors) to treatment allocation |
| Blinding (performance bias and detection bias) | High risk | Blinding not possible for self‐reported measurements (e.g. FS, SF‐36) |
| Incomplete outcome data (attrition bias) | Low risk | 2 of 34 (6%) participants in the ET group withdrew: "...for reasons not associated with the study" 5 of 34 (15%) participants in control group withdrew: "for reasons not associated with the study, and a further subject was excluded because her body mass index (44 kg/m2) prevented her form participating in the exercise test" |
| Selective reporting (reporting bias) | Unclear risk | All primary outcomes stated under Methods were reported; however, as the trial protocol is not available, we cannot categorically state that the review is free of selective outcome reporting |
| Other bias | Unclear risk | Baseline data differences between groups for anxiety (7.3 in exercise group vs 8.7 in control group) and mental fatigue (6.3 vs 5.6) |
| Methods | RCT, 4 parallel arms | |
| Participants | Diagnostic criteria: Oxford Number of participants: N = 136 Gender: 97 (71%) female Earlier treatment: NS Co‐morbidity: 46 (34%) with depressive disorder according to DSM‐III‐R criteria, use of antidepressant not stated Illness duration: duration of fatigue, median (IQR) 28.0 (39.5) months Work and employment status: 114 (84%) had recently changed occupation Setting: secondary/tertiary care Country: UK | |
| Interventions | Group 1: graded exercise + fluoxetine (n = 33) | |
| Outcomes |
Outcomes assessed at weeks 12 and 26 (end of treatment) | |
| Notes | Group 4 was used as treatment as usual, as participants were given no specific advice on exercise but were advised to exercise when they felt capable. Supplementary HADS data were obtained from study authors for the first version of this review | |
| Risk of bias | ||
| Bias | Authors' judgement | Support for judgement |
| Random sequence generation (selection bias) | Low risk | Quote: "...randomised into a treatment group by computer generated numbers, with groups of 10 to obtain roughly equal numbers" |
| Allocation concealment (selection bias) | Low risk | Quote: "A list of subject numbers marked with the exercise group for each number was held by the physiotherapist. Pharmacy staff dispensed medication in accordance with the subject number assigned to each subject." The initial assessment was done independently: "All patients were medically assessed by a doctor...under the supervision of a consultant physician" |
| Blinding (performance bias and detection bias) | High risk | Quote: "The drug treatment was double blind. The placebo to fluoxetine was a capsule of similar taste and appearance. The placebo to the exercise programme was a review of activity diaries by the physiotherapists" |
| Blinding (performance bias and detection bias) | High risk | Blinding not possible for self‐reported measurements (e.g. FS, SF‐36) |
| Incomplete outcome data (attrition bias) | High risk | Quote: "Analysis was carried out on an intention to treat basis. When there were missing data at 12 and 26 weeks, scores on the previous assessment were substituted. No data were available on 17 patients for the week 12 assessment, functional work capacity assessments at week 0, seven at week 12 and seven at week 26" Large drop‐out rates in all intervention groups |
| Selective reporting (reporting bias) | High risk | It is clear (p 488) that investigators collected data for all six subscales of the MOS that they used (as well as measures for fatigue, depression and anxiety). Data from fatigue and depression (primary outcomes) are reported numerically. Data from the anxiety scale are said to show 'no significant changes' and are not reported numerically. This is also the case for 5 of the 6 subscales of the MOS, with the exception of health perceptions, which is significant and favours the intervention group. NB: Data for forced work capacity (fwc) were collected by investigators but are not reported in this review |
| Other bias | Low risk | We do not suspect other bias |
| Methods | RCT, 3 parallel arms | |
| Participants | Diagnostic criteria: Oxford (31% fulfilled London ME criteria) Number of participants: N = 296 Gender: 230 (78%) female Earlier treatment: 264 (89%) reported medication during the past 6 months with antidepressant (n = 160) or analgesic (n = 79) Co‐morbidity, N (%): 53 (18) had a depression diagnosis, 160 (54) were prescribed antidepressants the last 6 months Illness duration (M): 7 (range from 0.5 to 51.7) years Work and employment status: not stated Setting: primary care Country: UK | |
| Interventions | Group 1: pragmatic rehabilitation, 10 sessions over an 18‐week period; graded return to activity designed collaboratively by the participant and the therapist, also focusing on sleep patterns and relaxation exercises to address somatic symptoms of anxiety (n = 95) Group 2: supportive listening, 10 sessions over an 18‐week period; listening therapy in which the therapist aims to provide an empathic and validating environment in which patients can freely discuss their prioritised concerns (n = 101) Group 3: general practitioner treatment as usual; GPs were asked to manage their cases as they saw fit, but to not refer participants for systematic psychological therapies for CFS/ME during the 18‐week treatment period (n = 100) | |
| Outcomes |
Outcomes assessed at 20 weeks (end of treatment) and at 70 weeks (follow‐up) | |
| Notes | Economic evaluation of the relative cost‐effectiveness of pragmatic rehabilitation and supportive listening when compared with treatment as usual, results of which will be reported separately | |
| Risk of bias | ||
| Bias | Authors' judgement | Support for judgement |
| Random sequence generation (selection bias) | Low risk | Quote: "Individual patients were randomly allocated to one of the three treatment arms using computer generated randomised permuted blocks (with randomly varying block sizes of 9, 12, 15, and 18), after stratification on the basis of whether the patient was non‐ambulatory (used a mobility aid on most days) and whether the patient fulfilled London ME criteria" |
| Allocation concealment (selection bias) | Low risk | Quote: "The random allocation was emailed to the trial manager, who assigned each patient a unique study number and notified the designated nurse therapist if the patient had been allocated to a therapy arm" |
| Blinding (performance bias and detection bias) | High risk | Not possible to blind participants or personnel (supervisors) to treatment allocation |
| Blinding (performance bias and detection bias) | High risk | Blinding not possible for self‐reported measurements (e.g. FS, SF‐36) |
| Incomplete outcome data (attrition bias) | Unclear risk | Number of drop‐outs (did not complete treatment): 18/95 (group 1), 17/101 (group 2). Reasons for drop‐out: unhappy with randomisation (n = 8), lost contact (n = 8), too busy (n = 7), not benefiting or feeling worse (n = 5), nurse therapist safety concern (n = 2), misdiagnosis (n = 1), received different treatment (n = 1) Loss to follow‐up at 20 weeks: 10/95 (group 1), 4/101 (group 2), 8/100 (group 3) Loss to follow‐up at 70 weeks: 14/95 (group 1), 11/101 (group 2), 14/100 (group 3) |
| Selective reporting (reporting bias) | Low risk | All relevant outcomes are reported in accordance with the protocol |
| Other bias | Low risk | We do not suspect other types of bias |
| Methods | RCT, multi‐centre, 4 parallel arms | |
| Participants | Diagnostic criteria: Oxford (56% satisfied London ME criteria) Number of participants: N = 641 Gender: 495 (77%) female Earlier treatment: NS Co‐morbidity: 219 (34%) with any depressive disorder, 260 (41%) used antidepressants Illness duration: median 32 (IQR 16 to 68) months (GET 35 (18 to 67) and SMC 25 (15 to 57) months) Work and employment status: mean baseline score at the work and social adjustment scale, 27.4 Setting: secondary/tertiary care Country: UK | |
| Interventions | Group 1, specialist medical care (SMC): provided by doctors with specialist experience in CFS. All participants were given a leaflet explaining the illness and the nature of this treatment. Treatment consisted of an explanation of chronic fatigue syndrome, generic advice such as to avoid extremes of activity and rest, specific advice on self‐help according to the particular approach chosen by the participant (if receiving SMC alone) and symptomatic pharmacotherapy (especially for insomnia, pain and mood, n = 160) Group 2, adaptive pacing therapy (APT): based on the envelope theory aimed at optimum adaptation to the illness by helping the participant to plan and pace activity to reduce or avoid fatigue, achieve prioritised activities and provide the best conditions for natural recovery. Therapeutic strategies consisted of identifying links between activity and fatigue by using a daily diary, with corresponding encouragement to plan activity to avoid exacerbations, developing awareness of early warnings of exacerbation, limiting demands and stress, regularly planning rest and relaxation and alternating different types of activities, with advice not to undertake activities that demanded more than 70% of participants’ perceived energy envelopes. Increased activities were encouraged if participants felt able, and as long as they did not exacerbate symptoms (n = 160) Group 3, cognitive‐behavioural therapy (CBT): done on the basis of the fear avoidance theory of CFS. The aim of treatment was to change the behavioural and cognitive factors assumed to be responsible for perpetuation of participants’ symptoms and disability. Therapeutic strategies guided participants to address unhelpful cognitions, including fears about symptoms or activities, by testing them through behavioural experiments. These experiments consisted of establishing a baseline of activity and rest and a regular sleep pattern, then making collaboratively planned gradual increases in both physical and mental activity. Participants were helped to address social and emotional obstacles to improvement through problem solving (n = 161) Group 4, graded exercise therapy (GET): done on the basis of deconditioning and exercise intolerance theories of chronic fatigue syndrome. The aim of treatment was to help participants gradually return to appropriate physical activities and reverse deconditioning, thereby reducing fatigue and disability. Therapeutic strategies consisted of establishment of a baseline of achievable exercise or physical activity, followed by a negotiated, incremental increase in the duration of time spent being physically active. Target heart rate ranges were set when necessary to avoid overexertion, which eventually aimed at 30 minutes of light exercise 5 times a week. When this rate was achieved, the intensity and aerobic nature of the exercise (usually walking) were gradually increased in response to participant feedback and with mutual planning (n = 160) | |
| Outcomes | Primary outcomes
Secondary outcomes
Outcomes assessed at 12 weeks, 24 weeks (end of treatment) and 52 weeks (follow‐up) | |
| Notes | ||
| Risk of bias | ||
| Bias | Authors' judgement | Support for judgement |
| Random sequence generation (selection bias) | Low risk | Quote: "Participants were allocated to treatment groups through the Mental Health and Neuroscience Clinical Trials Unit (London, UK) after baseline assessment and obtainment of consent. A database programmer undertook treatment allocation, independently of the trial team. The first three participants at each of the six clinics were allocated with straightforward randomisation. Thereafter allocation was stratified by centre, alternative criteria for chronic fatigue syndrome and myalgic encephalomyelitis and depressive disorder (major or minor depressive episode or dysthymia), with computer‐generated probabilistic minimisation" |
| Allocation concealment (selection bias) | Low risk | Quote: "Once notified of treatment allocation by the Clinical Trials Unit, the research assessor informed the participant and clinicians" |
| Blinding (performance bias and detection bias) | High risk | Quote: "As with any therapy trial, participants, therapists, and doctors could not be masked to treatment allocation and it was also impractical to mask research assessors. The primary outcomes were rated by participants themselves" |
| Blinding (performance bias and detection bias) | High risk | Quote: "The statistician undertaking the analysis of primary outcomes was masked to treatment allocation" |
| Incomplete outcome data (attrition bias) | Low risk | None found |
| Selective reporting (reporting bias) | Low risk | Quote: "These secondary outcomes were a subset of those specified in the protocol, selected in the statistical analysis plan as most relevant to this report." Our primary interest is the primary outcome reported in accordance with the protocol, so we do not believe that selective reporting is a problem |
| Other bias | Low risk | We do not suspect other types of bias |
ACT, anaerobic activity therapy.
APT, adaptive pacing therapy.
BAI, Beck Anxiety Inventory.
BDI‐II, Beck Depression Inventory.
BPI, Brief Pain Inventory.
CBT, cognitive‐behavioural therapy.
CDC, Centers for Disease Control and Prevention.
CFS, chronic fatigue syndrome.
COG, cognitive therapy.
ET, exercise therapy.
FS, Fatigue Scale.
FSS, Fatigue Severity Scale.
GET, graded exercise therapy.
HADS, Hospital Anxiety and Depression Scale.
HR, heart rate.
IQR, interquartile range.
ME, myalgic encephalitis.
MOS, Medical Outcome Survey.
NS, Not stated.
PSQI, Pittsburgh Sleep Quality Index.
PSS, Perceived Stress Scale.
RCT, randomised controlled trial.
RELAX, relaxation treatment.
RPE, rating of perceived exertion.
SD, standard deviation.
SF‐36, Short Form 36.
SMC, specialist medical care.
VO2, oxygen consumption.
Characteristics of excluded studies [ordered by study ID]
| Study | Reason for exclusion |
| RCT The trial was excluded, as the intervention was feedback on physical activity | |
| RCT Compares the relative effectiveness of 2 different types of exercise therapy. Even though this is an interesting question, it was beyond the scope of this version of the review | |
| The trial was excluded, as the population was "Gulf War veterans" | |
| RCT Combination treatment of which exercise therapy is a minor part | |
| RCT No clinical diagnosis of chronic fatigue syndrome. Our inclusion criteria state that the duration of fatigue needs to > 6 months, whereas inclusion criteria in Risdale 2004 is > 3 months The trial was excluded, as the intervention did not include exercise: "cognitive behaviour therapy (CBT) with counselling"; the population was "patients with chronic fatigue" | |
| RCT The trial was excluded, as the population was "people presenting with chronic fatigue in primary care" | |
| RCT The trial was excluded, as exercise was not the main part of the intervention: "Group rehabilitation (psycho‐education, graded exercise, goal setting and pacing, breathing control and challenging unhelpful thoughts)" | |
| RCT The PhD was excluded, as exercise was a minor component of the intervention: "conducted to implement the use of sleep hygiene education, biofeedback assisted relaxation and breathing retraining, graded aerobic exercise, and cognitive therapy...." | |
| RCT The trial was excluded, as exercise was not the main component of the intervention: "In our program, group topics included activity pacing using the Envelope Theory (Jason et al., 1999), cognitive coping skills training, relaxation and meditation training, employment issues and economic self‐sufficiency, personal relationships, traditional and complementary medical approaches, and nutritional approaches" | |
| The trial was excluded, as the study used a "cross‐sectional design" | |
| The trial was excluded, as "between‐group comparisons were used." This was a controlled trial, but participants were not randomly assigned | |
| RCT The trial was excluded, as interventions included variations of CBT: "additional CBT (stepped care) or regular CBT (care as usual)" | |
| The trial was excluded, as the population consisted of "young people (aged 9–17 years) with CFS/ME" | |
| The trial was excluded, as the population included young people 0 to 19 years of age |
Characteristics of studies awaiting assessment [ordered by study ID]
| Methods | RCT, 2 arms |
| Participants | Patients with chronic fatigue syndrome |
| Interventions | Dothiepin and graded activity |
| Outcomes | Not found |
| Notes | Not able to identify published paper nor study author |
| Methods | RCT, 3 arms, N = 90 |
| Participants | Patients with chronic fatigue syndrome |
| Interventions | Tuina group Taijiquan (take exercise) group Fluoxetine group |
| Outcomes | Therapeutic effects and changes in malondialdehyde (MDA) content and in activity of serum superoxide dismutases (SOD) and serum glutathione peroxidase (GSH‐Px) were observed |
| Notes | Published paper does not report outcomes that are relevant for this review Study authors were contacted to clarify whether relevant outcomes were measured, but we are still awaiting response |
| Methods | RCT, 2 parallel arms |
| Participants | Patients with chronic fatigue syndrome, N = 70 |
| Interventions | Sports group received gradual exercise Comparison group rested |
| Outcomes | Fatigue symptoms of chronic fatigue syndrome (CFS), sleeping time; symptoms for ears and eyes, muscle and bone system, nervous system and quality of life |
| Notes | Information from English abstract. Waiting for translation |
Characteristics of ongoing studies [ordered by study ID]
| Trial name or title | Pilot study on the effects of intermittent and graded exercise compared with no exercise for optimising health and reducing symptoms in chronic fatigue syndrome (CFS) patients |
| Methods | Randomised controlled trial, parallel |
| Participants | Inclusion criteria: medical diagnosis of chronic fatigue syndrome: persistent and disabling, and/or recurring, fatigue lasting longer than 6 months, which does not result from physical exertion and is not alleviated by rest. Other symptoms include muscle weakness and pain, ongoing medical symptoms such as swollen lymph nodes and fever, poor sleep, poor concentration and reduced quality of life Exclusion criteria: diagnosed cardiac and/or respiratory disease; joint or muscle condition/disease other than CFS that is contraindicated for exercise; any mental health condition that may affect exercise participation or safety of participants and researchers Age minimum: 18 years Age maximum: 60 years Gender: both male and female |
| Interventions | Randomised controlled trial of intermittent exercise training compared with graded exercise and standard care. Graded exercise is the current recommended exercise approach to CFS; it consists of self‐paced (e.g. low‐intensity) steady state exercise at a constant workload for a short time; as the patient's fitness gradually improves, the length of time and eventually the intensity are increased in a gradual graded manner, provided no adverse symptoms occur. Intermittent or interval exercise consists of short blocks of exercise at low to moderate intensity with a rest interval in between bouts of exercise (e.g. 1 minute of low‐intensity cycling, followed by 1 minute of rest, followed by 1 minute of cycling); total time spent exercising can be gradually increased whilst rest or unloaded exercise intervals are maintained. Participants will be randomly allocated to 1 of 3 groups. Each group will consist of 20 participants to provide a power of 80% for the study (based on data from Gordon 2010), with an a prior test used to compute required sample size, given alpha (P value 0.05), power and effect size for an F test, and looking at ANOVA fixed effects, main effects and interactions (GPower). Volunteers will participate in 3 aerobic exercise sessions (cycling on a cycle ergometer) per week, consisting of the following.
Over the 12 weeks of the project, we aim to progress the duration of SS exercise towards 20 minutes, as tolerated by the participant, and to progress ITE participants towards intervals of 2 to 3 minutes of moderate‐intensity cycling, alternated with 1‐minute intervals of low‐intensity cycling, totaling 25 to 30 minutes in duration. All group sessions will be supervised by a member of the research team (consisting of accredited exercise physiologists) with assistance from postgraduate Masters of Clinical Exercise Physiology students, who are studying to become accredited exercise physiologists Total intervention duration will be 12 weeks for graded, intermittent and control groups |
| Outcomes | Improved physiological adaptations to exercise (reduced RPE, heart rate and blood pressure). Rate of perceived exertion (RPE) is assessed using a standard 10‐point Borg Scale on which participants are asked how hard they feel they are exercising; heart rate will be measured using a 12‐lead ECG during prestudy and poststudy exercise tests, and during exercise sessions, by using a Polar heart rate monitor; blood pressure will be monitored constantly during prestudy and poststudy exercise testing, and during exercise sessions, using a standard sphygmomanometer and an adult‐sized cuff and stethoscope Increased lymphocyte function and reduced inflammatory cytokines measured prestudy and poststudy by comparison of immune cell counts, lymphocyte (CD4, CD8, CD19, NK) function and inflammatory cytokines (IFN‐λ, IL‐1) in both exercise groups and control groups. Cell counts will be measured by full blood count (standard pathology); lymphocyte subsets will be measured by cell count using a FACSCanto flow cytometer (Becton Dickinson); lymphocyte function will be analysed using proliferative assays with flow cytometric fluorescent analysis; and inflammatory cytokines will be assessed using standard ELISA assays Increased VO2peak, as measured prestudy and poststudy by open circuit spirometry (Sensormedics) metabolic cart and by breath‐by‐breath analysis. The test protocol is a cycle test starting with a 3‐minute warm‐up of unloaded cycling, followed by 1‐minute increments of 10 watts (W) until a VO2 plateau is achieved (i.e. VO2 does not increase, although workload continues to increase and/or RER > 1.15 and/or peak heart rate within 10 beats per minute of age‐predicted maximum and/or volitional exhaustion). The test may also be stopped at the request of participants if they feel too fatigued. If a submaximal value is achieved at this stage, a peak VO2 value can be extrapolated by using a linear regression Reduced fatigue and symptoms (Cummins Fatigue Scale) |
| Starting date | 10/02/2013 |
| Contact information | |
| Notes | http://apps.who.int/trialsearch/Trial.aspx?TrialID=ACTRN12612001241820 http://www.anzctr.org.au/ACTRN12612001241820.aspx |
| Trial name or title | Pacing activity self‐management for patients with chronic fatigue syndrome: randomized controlled clinical trial |
| Methods | RCT |
| Participants | Inclusion criteria
Exclusion criteria
|
| Interventions | Behavioural: pacing Behavioural: relaxation therapy |
| Outcomes | Change in score on the Canadian Occupational Performance Measure (COPM) Change in autonomic activity at rest and following 3 activities of daily living Change in CFS Symptom List Change in Checklist of Individual Strength (CIS) Change in subscale scores on the Medical Outcomes Short Form‐36 Health Status Survey (SF‐36) |
| Starting date | August 2011 |
| Contact information | |
| Notes |
| Trial name or title | Protocol for the "four steps to control your fatigue (4‐STEPS)" randomised controlled trial: a self‐regulation based physical activity intervention for patients with unexplained chronic fatigue |
| Methods | Multi‐centre, randomised controlled trial (RCT) |
| Participants | Fulfilling operationalised criteria for idiopathic chronic fatigue (ICF) and for chronic fatigue syndrome (CFS) Patients visiting their physician with a main complaint of unexplained fatigue of at least 6 months' duration are recruited for the study Inclusion criteria: meeting the operationalised criteria for ICF or CFS (CDC criteria); between 18 and 65 years of age; fluent in spoken Portuguese; capacity to provide informed consent Exclusion criteria: presence of a concurrent somatic condition that can explain the fatigue symptoms; severe psychiatric disorders |
| Interventions | Standard care (SC) or standard care plus a self‐regulation based physical activity programme (4‐STEPS) In addition to standard care, participants in the intervention group received the 4‐STEPS programme consisting of the following.
|
| Outcomes | The primary outcome was the reduction in perceived fatigue severity, which was assessed by using the Checklist of Individual Strength (CIS‐20R). A difference of 7 points between intervention and control groups for the main dimension (the subjective feeling of fatigue subscale) of the CIS‐20R was considered to be clinically significant |
| Starting date | The 4‐STEPS RCT started in January 2011 |
| Contact information | Marta Marques: [email protected] |
| Notes | ISRCTN: ISRCTN70763996 Copied from the published protocol: http://www.biomedcentral.com/1471‐2458/12/202 |
| Trial name or title | Is a multi‐disciplinary rehabilitation treatment more effective than mono‐disciplinary cognitive behavioural therapy for patients with chronic fatigue syndrome? A multi‐centre randomised controlled trial |
| Methods | RCT |
| Participants | Patients were included if they fulfilled the CDC‐94 criteria for CFS and had a score ≥ 40 on the Checklist of Individual Strength (CIS)‐fatigue questionnaire. CDC‐94 criteria for CFS are as follows.
In combination with 4 or more of the following symptoms, persistent or regularly recurring over a period of 6 months and that must not have predated the fatigue.
Additional inclusion criteria for this study follow here
|
| Interventions | After intake, participants will be randomly divided into 2 groups: cognitive‐behavioural therapy (CBT) and multi‐disciplinary rehabilitation therapy (MRT)
CBT is based on process variables of a CFS model. This model shows that high physical attributions will decrease physical activity and increase fatigue and functional impairment. A low level of sense of control over symptoms and focusing on physical sensations have a direct causal effect on fatigue. In CFS precipitating and perpetuating factors are important. The perpetuating factors become the focus of the intervention in CBT. An important subject in the therapy is the balance between activity and rest and the patients' responsibility to see to it. Negative beliefs regarding the symptoms of fatigue, self‐expectations or self‐esteem are identified and patients are encouraged to challenge them the conventional way. Specific lifestyle changes are encouraged if deemed appropriate. At the end of the therapy relapse prevention is addressed. Patients who are assigned to this group will attend 16 individual therapy sessions of one hour duration, spread out over 6 months with a psychologist or behavioural therapist.
MRT includes the following
During MRT, a participant sees the physician during rehabilitation 3 times (20 minutes per visit) |
| Outcomes | Primary outcomes
Secondary outcomes
All outcomes are measured at baseline and at 6 and 12 months after start of therapy. Treatment costs and additional expenses (work‐related costs, healthcare and non‐healthcare costs) are measured using the Trimbos/iMTA Questionnaire for Costs Associated With Psychiatric Illness; will be measured every month (from baseline until 12 months after start of therapy) |
| Starting date | 27/11/2008 Recruitment status: completed |
| Contact information | d.vos‐[email protected] |
| Notes |
| Trial name or title | Graded Exercise Therapy guided SElf‐help Treatment (GETSET) for patients with chronic fatigue syndrome/myalgic encephalomyelitis: a randomised controlled trial in secondary care (GETSET) |
| Methods | Randomised interventional trial |
| Participants | Inclusion
Exclusion
|
| Interventions | Guided support, a copy of the GETSET booklet, a 30‐minute consultation face‐to‐face by Skype or by telephone, 3 further Skype telephone contacts Intervention over 9 weeks: follow‐up length: 3 month(s); study entry: single randomisation only |
| Outcomes | Primary: SF‐36 physical function subscale (SF‐36PF) measured 12 weeks from randomisation Secondary: Clinical Global Impression Change Scale (CGI) score measured 12 weeks from baseline |
| Starting date | 16/05/2012 |
| Contact information | Prof PD White; [email protected] |
| Notes | http://www.controlled‐trials.com/ISRCTN22975026/GETSET |
ANOVA, analysis of variance.
CFS, chronic fatigue syndrome.
CGI, Clinical Global Impression scale.
CIS, Checklist of Individual Strength.
COPM, Canadian Occupational Performance Measure.
ELISA, enzyme‐linked immunosorbent assay.
EuroQol 6‐D: Short Form 6‐D of the standard measure of health outcomes of the EuroQol Group.
GE, Graded exercise.
ICF, idiopathic chronic fatigue.
IFN, interferon.
IL, interleukin.
ITE, intermittent exercise training.
MI, motivational interviewing.
MRT, multi‐disciplinary rehabilitation therapy.
NK, natural killer cell.
RER, respiratory exchange ratio.
RPE, rating of perceived exertion.
SC, standard care.
SS, steady state.
VO2, oxygen consumption
Data and analyses
| Outcome or subgroup title | No. of studies | No. of participants | Statistical method | Effect size |
| 1 Fatigue (end of treatment) Show forest plot | 7 | Mean Difference (IV, Random, 95% CI) | Subtotals only | |
| Analysis 1.1  Comparison 1 Exercise therapy versus treatment as usual, relaxation or flexibility, Outcome 1 Fatigue (end of treatment). | ||||
| 1.1 Fatigue Scale, FS (11 items/0 to 11 points) | 1 | 148 | Mean Difference (IV, Random, 95% CI) | ‐6.06 [‐6.95, ‐5.17] |
| 1.2 Fatigue Scale, FS (11 items/0 to 33 points) | 3 | 540 | Mean Difference (IV, Random, 95% CI) | ‐2.82 [‐4.07, ‐1.57] |
| 1.3 Fatigue Scale, FS (14 items/0 to 42 points) | 3 | 152 | Mean Difference (IV, Random, 95% CI) | ‐6.80 [‐10.31, ‐3.28] |
| 2 Fatigue (follow‐up) Show forest plot | 4 | Mean Difference (IV, Random, 95% CI) | Subtotals only | |
| Analysis 1.2 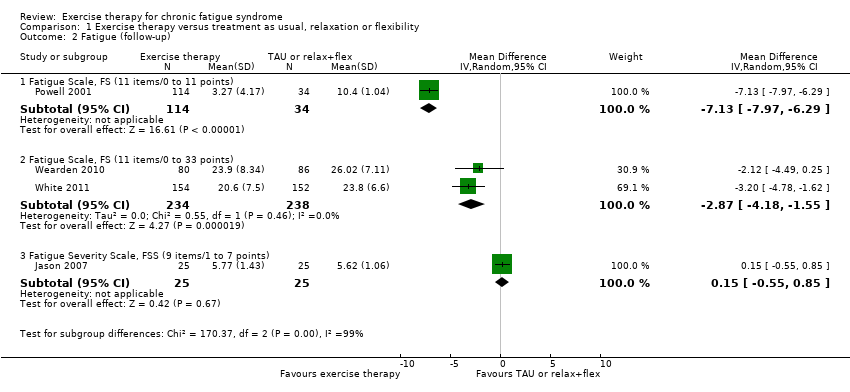 Comparison 1 Exercise therapy versus treatment as usual, relaxation or flexibility, Outcome 2 Fatigue (follow‐up). | ||||
| 2.1 Fatigue Scale, FS (11 items/0 to 11 points) | 1 | 148 | Mean Difference (IV, Random, 95% CI) | ‐7.13 [‐7.97, ‐6.29] |
| 2.2 Fatigue Scale, FS (11 items/0 to 33 points) | 2 | 472 | Mean Difference (IV, Random, 95% CI) | ‐2.87 [‐4.18, ‐1.55] |
| 2.3 Fatigue Severity Scale, FSS (9 items/1 to 7 points) | 1 | 50 | Mean Difference (IV, Random, 95% CI) | 0.15 [‐0.55, 0.85] |
| 3 Participants with serious adverse reactions Show forest plot | 1 | Risk Ratio (M‐H, Random, 95% CI) | Totals not selected | |
| Analysis 1.3  Comparison 1 Exercise therapy versus treatment as usual, relaxation or flexibility, Outcome 3 Participants with serious adverse reactions. | ||||
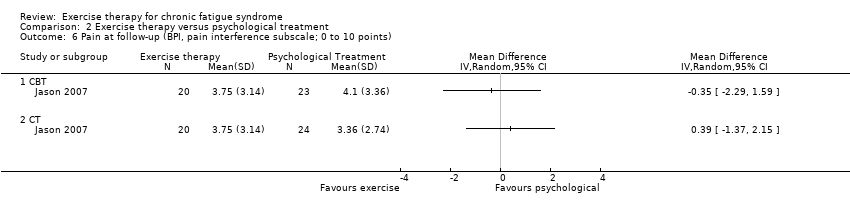
| 4 Pain (follow‐up) Show forest plot | 1 | Mean Difference (IV, Random, 95% CI) | Totals not selected | |
| Analysis 1.4  Comparison 1 Exercise therapy versus treatment as usual, relaxation or flexibility, Outcome 4 Pain (follow‐up). | ||||
| 4.1 Brief Pain Inventory, pain severity subscale (0 to 10 points) | 1 | Mean Difference (IV, Random, 95% CI) | 0.0 [0.0, 0.0] | |
| 4.2 Brief Pain Inventory, pain interference subscale (0 to 10 points) | 1 | Mean Difference (IV, Random, 95% CI) | 0.0 [0.0, 0.0] | |
| 5 Physical functioning (end of treatment) Show forest plot | 5 | Mean Difference (IV, Random, 95% CI) | Subtotals only | |
| Analysis 1.5  Comparison 1 Exercise therapy versus treatment as usual, relaxation or flexibility, Outcome 5 Physical functioning (end of treatment). | ||||
| 5.1 SF‐36, physical functioning subscale (0 to 100 points) | 5 | 725 | Mean Difference (IV, Random, 95% CI) | ‐13.10 [‐24.22, ‐1.98] |
| 6 Physical functioning (follow‐up) Show forest plot | 3 | Mean Difference (IV, Random, 95% CI) | Subtotals only | |
| Analysis 1.6 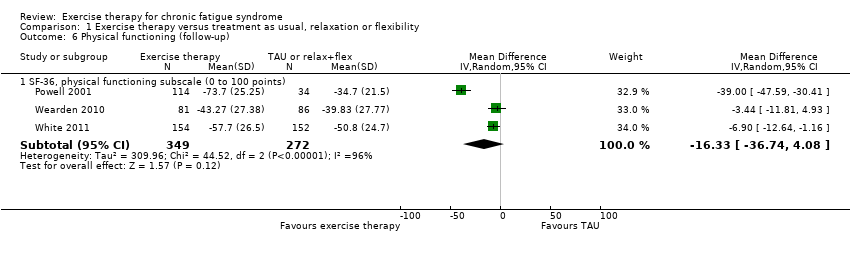 Comparison 1 Exercise therapy versus treatment as usual, relaxation or flexibility, Outcome 6 Physical functioning (follow‐up). | ||||
| 6.1 SF‐36, physical functioning subscale (0 to 100 points) | 3 | 621 | Mean Difference (IV, Random, 95% CI) | ‐16.33 [‐36.74, 4.08] |
| 7 Quality of life (follow‐up) Show forest plot | 1 | Mean Difference (IV, Random, 95% CI) | Totals not selected | |
| Analysis 1.7  Comparison 1 Exercise therapy versus treatment as usual, relaxation or flexibility, Outcome 7 Quality of life (follow‐up). | ||||
| 7.1 Quality of Life Scale (16 to 112 points) | 1 | Mean Difference (IV, Random, 95% CI) | 0.0 [0.0, 0.0] | |
| 8 Depression (end of treatment) Show forest plot | 5 | Mean Difference (IV, Random, 95% CI) | Subtotals only | |
| Analysis 1.8  Comparison 1 Exercise therapy versus treatment as usual, relaxation or flexibility, Outcome 8 Depression (end of treatment). | ||||
| 8.1 HADS, depression score (7 items/21 points) | 5 | 504 | Mean Difference (IV, Random, 95% CI) | ‐1.63 [‐3.50, 0.23] |
| 9 Depression (follow‐up) Show forest plot | 4 | Mean Difference (IV, Random, 95% CI) | Subtotals only | |
| Analysis 1.9  Comparison 1 Exercise therapy versus treatment as usual, relaxation or flexibility, Outcome 9 Depression (follow‐up). | ||||
| 9.1 Beck Depression Inventory (0 to 63 points) | 1 | 45 | Mean Difference (IV, Random, 95% CI) | 3.44 [‐1.00, 9.88] |
| 9.2 HADS, depression subscale (0 to 21 points) | 3 | 609 | Mean Difference (IV, Random, 95% CI) | ‐2.26 [‐5.09, 0.56] |
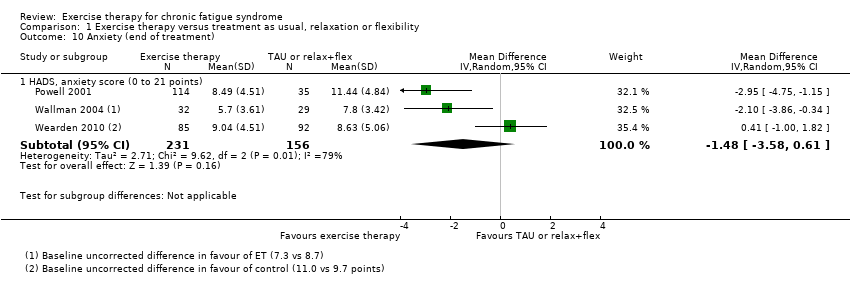
| 10 Anxiety (end of treatment) Show forest plot | 3 | Mean Difference (IV, Random, 95% CI) | Subtotals only | |
| Analysis 1.10  Comparison 1 Exercise therapy versus treatment as usual, relaxation or flexibility, Outcome 10 Anxiety (end of treatment). | ||||
| 10.1 HADS, anxiety score (0 to 21 points) | 3 | 387 | Mean Difference (IV, Random, 95% CI) | ‐1.48 [‐3.58, 0.61] |
| 11 Anxiety (follow‐up) Show forest plot | 4 | Mean Difference (IV, Random, 95% CI) | Subtotals only | |
| Analysis 1.11 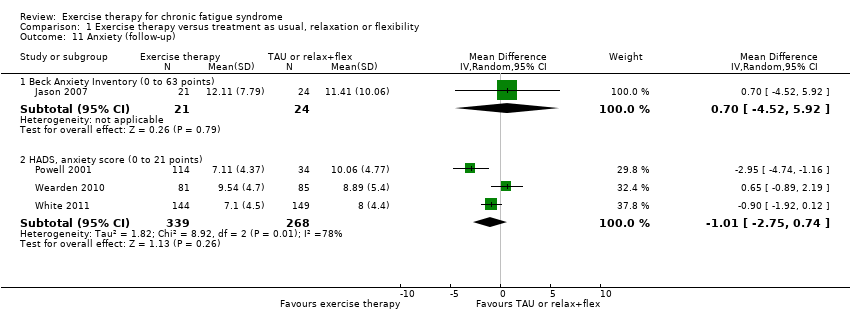 Comparison 1 Exercise therapy versus treatment as usual, relaxation or flexibility, Outcome 11 Anxiety (follow‐up). | ||||
| 11.1 Beck Anxiety Inventory (0 to 63 points) | 1 | 45 | Mean Difference (IV, Random, 95% CI) | 0.70 [‐4.52, 5.92] |
| 11.2 HADS, anxiety score (0 to 21 points) | 3 | 607 | Mean Difference (IV, Random, 95% CI) | ‐1.01 [‐2.75, 0.74] |
| 12 Sleep (end of treatment) Show forest plot | 2 | Mean Difference (IV, Random, 95% CI) | Subtotals only | |
| Analysis 1.12  Comparison 1 Exercise therapy versus treatment as usual, relaxation or flexibility, Outcome 12 Sleep (end of treatment). | ||||
| 12.1 Jenkins Sleep Scale (0 to 20 points) | 2 | 323 | Mean Difference (IV, Random, 95% CI) | ‐1.49 [‐2.95, ‐0.02] |
| 13 Sleep (follow‐up) Show forest plot | 3 | Mean Difference (IV, Random, 95% CI) | Subtotals only | |
| Analysis 1.13  Comparison 1 Exercise therapy versus treatment as usual, relaxation or flexibility, Outcome 13 Sleep (follow‐up). | ||||
| 13.1 Jenkins Sleep Scale (0 to 20 points) | 3 | 610 | Mean Difference (IV, Random, 95% CI) | ‐2.04 [‐3.84, ‐0.23] |
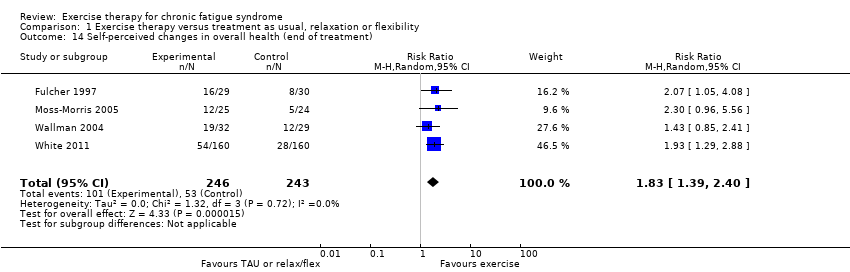
| 14 Self‐perceived changes in overall health (end of treatment) Show forest plot | 4 | 489 | Risk Ratio (M‐H, Random, 95% CI) | 1.83 [1.39, 2.40] |
| Analysis 1.14  Comparison 1 Exercise therapy versus treatment as usual, relaxation or flexibility, Outcome 14 Self‐perceived changes in overall health (end of treatment). | ||||
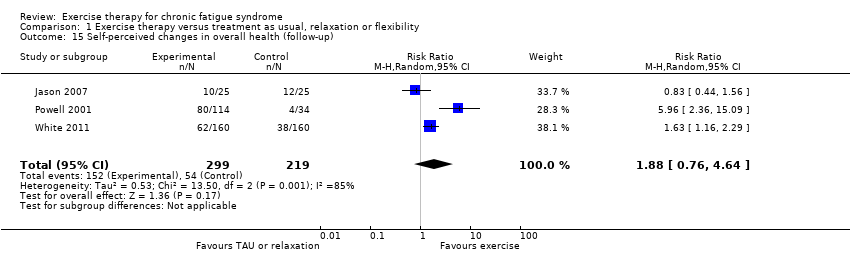
| 15 Self‐perceived changes in overall health (follow‐up) Show forest plot | 3 | 518 | Risk Ratio (M‐H, Random, 95% CI) | 1.88 [0.76, 4.64] |
| Analysis 1.15  Comparison 1 Exercise therapy versus treatment as usual, relaxation or flexibility, Outcome 15 Self‐perceived changes in overall health (follow‐up). | ||||
| 16 Health resource use (follow‐up) [Mean no. of contacts] Show forest plot | 1 | Mean Difference (IV, Random, 95% CI) | Totals not selected | |
| Analysis 1.16 ![Comparison 1 Exercise therapy versus treatment as usual, relaxation or flexibility, Outcome 16 Health resource use (follow‐up) [Mean no. of contacts].](/cdsr/doi/10.1002/14651858.CD003200.pub6/media/CDSR/CD003200/rel0006/CD003200/image_n/nCD003200-CMP-001-16.png) Comparison 1 Exercise therapy versus treatment as usual, relaxation or flexibility, Outcome 16 Health resource use (follow‐up) [Mean no. of contacts]. | ||||
| 16.1 Primary care | 1 | Mean Difference (IV, Random, 95% CI) | 0.0 [0.0, 0.0] | |
| 16.2 Other doctor | 1 | Mean Difference (IV, Random, 95% CI) | 0.0 [0.0, 0.0] | |
| 16.3 Healthcare professional | 1 | Mean Difference (IV, Random, 95% CI) | 0.0 [0.0, 0.0] | |
| 16.4 Inpatient | 1 | Mean Difference (IV, Random, 95% CI) | 0.0 [0.0, 0.0] | |
| 16.5 Accident and emergency | 1 | Mean Difference (IV, Random, 95% CI) | 0.0 [0.0, 0.0] | |
| 16.6 Other health/social services | 1 | Mean Difference (IV, Random, 95% CI) | 0.0 [0.0, 0.0] | |
| 16.7 Complementary health care | 1 | Mean Difference (IV, Random, 95% CI) | 0.0 [0.0, 0.0] | |
| 16.8 Standardised medical care | 1 | Mean Difference (IV, Random, 95% CI) | 0.0 [0.0, 0.0] | |
| 17 Health resource use (follow‐up) [No. of users] Show forest plot | 1 | Risk Ratio (M‐H, Random, 95% CI) | Totals not selected | |
| Analysis 1.17 ![Comparison 1 Exercise therapy versus treatment as usual, relaxation or flexibility, Outcome 17 Health resource use (follow‐up) [No. of users].](/cdsr/doi/10.1002/14651858.CD003200.pub6/media/CDSR/CD003200/rel0006/CD003200/image_n/nCD003200-CMP-001-17.png) Comparison 1 Exercise therapy versus treatment as usual, relaxation or flexibility, Outcome 17 Health resource use (follow‐up) [No. of users]. | ||||
| 17.1 Primary care | 1 | Risk Ratio (M‐H, Random, 95% CI) | 0.0 [0.0, 0.0] | |
| 17.2 Other doctor | 1 | Risk Ratio (M‐H, Random, 95% CI) | 0.0 [0.0, 0.0] | |
| 17.3 Healthcare professional | 1 | Risk Ratio (M‐H, Random, 95% CI) | 0.0 [0.0, 0.0] | |
| 17.4 Inpatient | 1 | Risk Ratio (M‐H, Random, 95% CI) | 0.0 [0.0, 0.0] | |
| 17.5 Accident and emergency | 1 | Risk Ratio (M‐H, Random, 95% CI) | 0.0 [0.0, 0.0] | |
| 17.6 Medication | 1 | Risk Ratio (M‐H, Random, 95% CI) | 0.0 [0.0, 0.0] | |
| 17.7 Complementary health care | 1 | Risk Ratio (M‐H, Random, 95% CI) | 0.0 [0.0, 0.0] | |
| 17.8 Other health/social services | 1 | Risk Ratio (M‐H, Random, 95% CI) | 0.0 [0.0, 0.0] | |
| 17.9 Standardised medical care | 1 | Risk Ratio (M‐H, Random, 95% CI) | 0.0 [0.0, 0.0] | |
| 18 Drop‐out Show forest plot | 6 | 843 | Risk Ratio (M‐H, Random, 95% CI) | 1.63 [0.77, 3.43] |
| Analysis 1.18  Comparison 1 Exercise therapy versus treatment as usual, relaxation or flexibility, Outcome 18 Drop‐out. | ||||
| 19 Subgroup analysis for fatigue Show forest plot | 7 | 840 | Std. Mean Difference (IV, Random, 95% CI) | ‐0.68 [‐1.02, ‐0.35] |
| Analysis 1.19  Comparison 1 Exercise therapy versus treatment as usual, relaxation or flexibility, Outcome 19 Subgroup analysis for fatigue. | ||||
| 19.1 Graded exercise therapy | 6 | 779 | Std. Mean Difference (IV, Random, 95% CI) | ‐0.71 [‐1.09, ‐0.32] |
| 19.2 Exercise with self‐pacing | 1 | 61 | Std. Mean Difference (IV, Random, 95% CI) | ‐0.54 [‐1.05, ‐0.02] |
| Outcome or subgroup title | No. of studies | No. of participants | Statistical method | Effect size |
| 1 Fatigue at end of treatment (FS; 11 items/0 to 33 points) Show forest plot | 2 | Mean Difference (IV, Random, 95% CI) | Totals not selected | |
| Analysis 2.1  Comparison 2 Exercise therapy versus psychological treatment, Outcome 1 Fatigue at end of treatment (FS; 11 items/0 to 33 points). | ||||
| 1.1 CBT | 1 | Mean Difference (IV, Random, 95% CI) | 0.0 [0.0, 0.0] | |
| 1.2 Supportive listening | 1 | Mean Difference (IV, Random, 95% CI) | 0.0 [0.0, 0.0] | |
| 2 Fatigue at follow‐up (FSS; 1 to 7 points) Show forest plot | 1 | Mean Difference (IV, Random, 95% CI) | Totals not selected | |
| Analysis 2.2 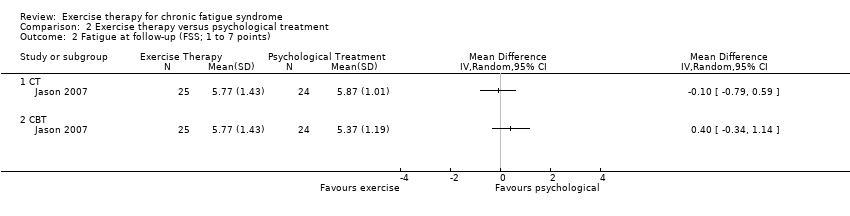 Comparison 2 Exercise therapy versus psychological treatment, Outcome 2 Fatigue at follow‐up (FSS; 1 to 7 points). | ||||
| 2.1 CT | 1 | Mean Difference (IV, Random, 95% CI) | 0.0 [0.0, 0.0] | |
| 2.2 CBT | 1 | Mean Difference (IV, Random, 95% CI) | 0.0 [0.0, 0.0] | |
| 3 Fatigue at follow‐up (FS; 11 items/0 to 33 points) Show forest plot | 2 | Mean Difference (IV, Random, 95% CI) | Totals not selected | |
| Analysis 2.3  Comparison 2 Exercise therapy versus psychological treatment, Outcome 3 Fatigue at follow‐up (FS; 11 items/0 to 33 points). | ||||
| 3.1 CBT | 1 | Mean Difference (IV, Random, 95% CI) | 0.0 [0.0, 0.0] | |
| 3.2 Supportive listening | 1 | Mean Difference (IV, Random, 95% CI) | 0.0 [0.0, 0.0] | |
| 4 Participants with serious adverse reactions Show forest plot | 2 | Risk Ratio (M‐H, Random, 95% CI) | Totals not selected | |
| Analysis 2.4 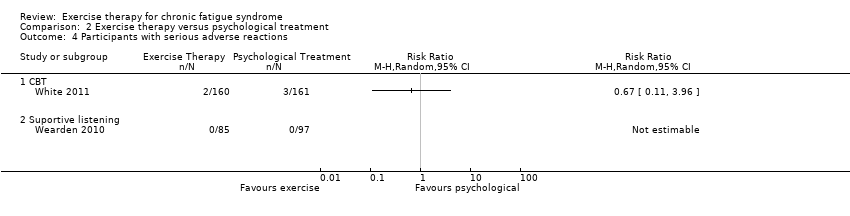 Comparison 2 Exercise therapy versus psychological treatment, Outcome 4 Participants with serious adverse reactions. | ||||
| 4.1 CBT | 1 | Risk Ratio (M‐H, Random, 95% CI) | 0.0 [0.0, 0.0] | |
| 4.2 Suportive listening | 1 | Risk Ratio (M‐H, Random, 95% CI) | 0.0 [0.0, 0.0] | |
| 5 Pain at follow‐up (BPI, pain severity subscale; 0 to 10 points) Show forest plot | 1 | Mean Difference (IV, Random, 95% CI) | Totals not selected | |
| Analysis 2.5 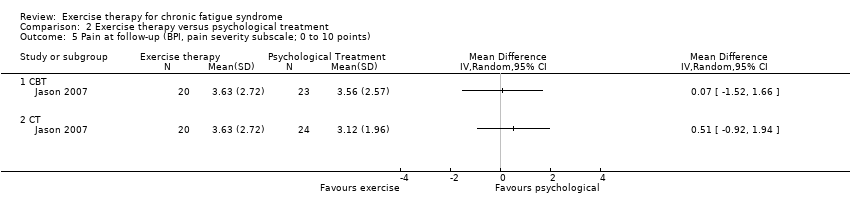 Comparison 2 Exercise therapy versus psychological treatment, Outcome 5 Pain at follow‐up (BPI, pain severity subscale; 0 to 10 points). | ||||
| 5.1 CBT | 1 | Mean Difference (IV, Random, 95% CI) | 0.0 [0.0, 0.0] | |
| 5.2 CT | 1 | Mean Difference (IV, Random, 95% CI) | 0.0 [0.0, 0.0] | |
| 6 Pain at follow‐up (BPI, pain interference subscale; 0 to 10 points) Show forest plot | 1 | Mean Difference (IV, Random, 95% CI) | Totals not selected | |
| Analysis 2.6  Comparison 2 Exercise therapy versus psychological treatment, Outcome 6 Pain at follow‐up (BPI, pain interference subscale; 0 to 10 points). | ||||
| 6.1 CBT | 1 | Mean Difference (IV, Random, 95% CI) | 0.0 [0.0, 0.0] | |
| 6.2 CT | 1 | Mean Difference (IV, Random, 95% CI) | 0.0 [0.0, 0.0] | |
| 7 Physical functioning at end of treatment (SF‐36, physical functioning subscale; 0 to 100 points) Show forest plot | 2 | Mean Difference (IV, Random, 95% CI) | Totals not selected | |
| Analysis 2.7 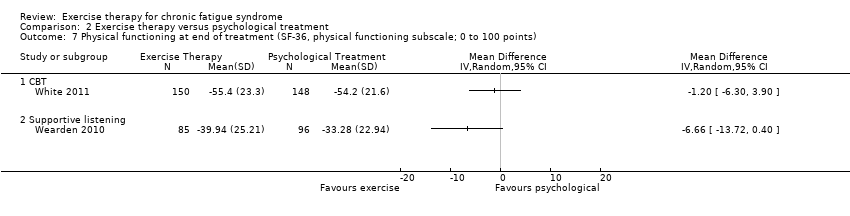 Comparison 2 Exercise therapy versus psychological treatment, Outcome 7 Physical functioning at end of treatment (SF‐36, physical functioning subscale; 0 to 100 points). | ||||
| 7.1 CBT | 1 | Mean Difference (IV, Random, 95% CI) | 0.0 [0.0, 0.0] | |
| 7.2 Supportive listening | 1 | Mean Difference (IV, Random, 95% CI) | 0.0 [0.0, 0.0] | |
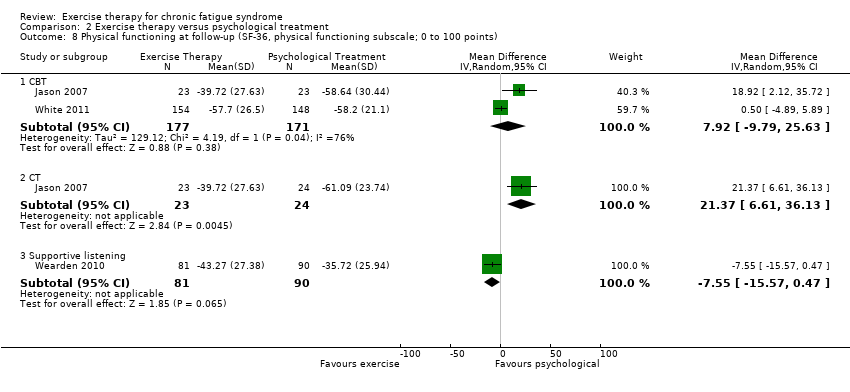
| 8 Physical functioning at follow‐up (SF‐36, physical functioning subscale; 0 to 100 points) Show forest plot | 3 | Mean Difference (IV, Random, 95% CI) | Subtotals only | |
| Analysis 2.8  Comparison 2 Exercise therapy versus psychological treatment, Outcome 8 Physical functioning at follow‐up (SF‐36, physical functioning subscale; 0 to 100 points). | ||||
| 8.1 CBT | 2 | 348 | Mean Difference (IV, Random, 95% CI) | 7.92 [‐9.79, 25.63] |
| 8.2 CT | 1 | 47 | Mean Difference (IV, Random, 95% CI) | 21.37 [6.61, 36.13] |
| 8.3 Supportive listening | 1 | 171 | Mean Difference (IV, Random, 95% CI) | ‐7.55 [‐15.57, 0.47] |
| 9 Depression at end of treatment (HADS depression score; 7 items/21 points) Show forest plot | 1 | Mean Difference (IV, Random, 95% CI) | Totals not selected | |
| Analysis 2.9 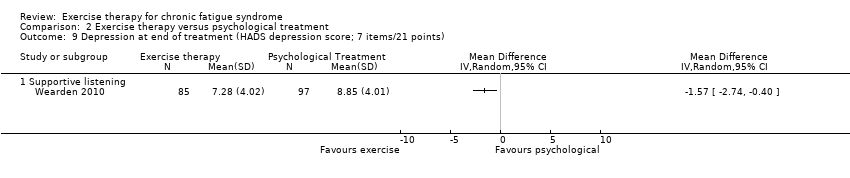 Comparison 2 Exercise therapy versus psychological treatment, Outcome 9 Depression at end of treatment (HADS depression score; 7 items/21 points). | ||||
| 9.1 Supportive listening | 1 | Mean Difference (IV, Random, 95% CI) | 0.0 [0.0, 0.0] | |
| 10 Depression at follow‐up (BDI; 0 to 63 points) Show forest plot | 1 | Mean Difference (IV, Random, 95% CI) | Totals not selected | |
| Analysis 2.10 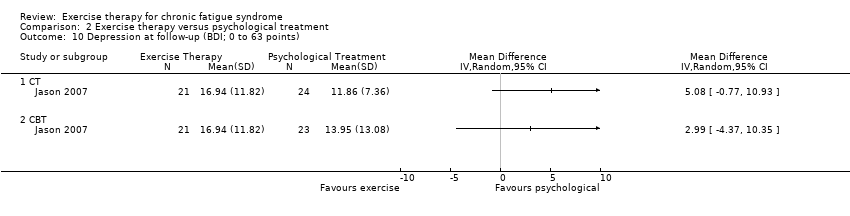 Comparison 2 Exercise therapy versus psychological treatment, Outcome 10 Depression at follow‐up (BDI; 0 to 63 points). | ||||
| 10.1 CT | 1 | Mean Difference (IV, Random, 95% CI) | 0.0 [0.0, 0.0] | |
| 10.2 CBT | 1 | Mean Difference (IV, Random, 95% CI) | 0.0 [0.0, 0.0] | |
| 11 Depression at follow‐up (HADS depression score; 7 items/21 points) Show forest plot | 2 | Mean Difference (IV, Random, 95% CI) | Totals not selected | |
| Analysis 2.11  Comparison 2 Exercise therapy versus psychological treatment, Outcome 11 Depression at follow‐up (HADS depression score; 7 items/21 points). | ||||
| 11.1 CBT | 1 | Mean Difference (IV, Random, 95% CI) | 0.0 [0.0, 0.0] | |
| 11.2 Supportive listening | 1 | Mean Difference (IV, Random, 95% CI) | 0.0 [0.0, 0.0] | |
| 12 Anxiety at end of treatment (HADS anxiety; 7 items/21 points) Show forest plot | 1 | Mean Difference (IV, Random, 95% CI) | Totals not selected | |
| Analysis 2.12  Comparison 2 Exercise therapy versus psychological treatment, Outcome 12 Anxiety at end of treatment (HADS anxiety; 7 items/21 points). | ||||
| 12.1 Supportive listening | 1 | Mean Difference (IV, Random, 95% CI) | 0.0 [0.0, 0.0] | |
| 13 Anxiety at follow‐up (BAI; 0 to 63 points) Show forest plot | 1 | Mean Difference (IV, Random, 95% CI) | Totals not selected | |
| Analysis 2.13  Comparison 2 Exercise therapy versus psychological treatment, Outcome 13 Anxiety at follow‐up (BAI; 0 to 63 points). | ||||
| 13.1 CT | 1 | Mean Difference (IV, Random, 95% CI) | 0.0 [0.0, 0.0] | |
| 13.2 CBT | 1 | Mean Difference (IV, Random, 95% CI) | 0.0 [0.0, 0.0] | |
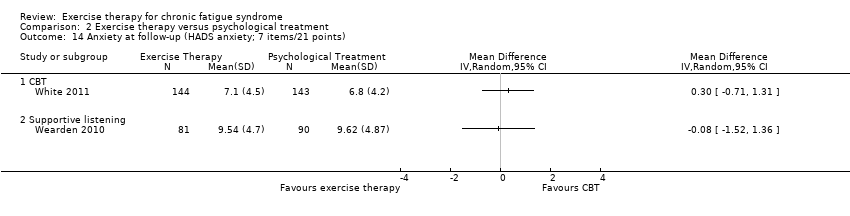
| 14 Anxiety at follow‐up (HADS anxiety; 7 items/21 points) Show forest plot | 2 | Mean Difference (IV, Random, 95% CI) | Totals not selected | |
| Analysis 2.14  Comparison 2 Exercise therapy versus psychological treatment, Outcome 14 Anxiety at follow‐up (HADS anxiety; 7 items/21 points). | ||||
| 14.1 CBT | 1 | Mean Difference (IV, Random, 95% CI) | 0.0 [0.0, 0.0] | |
| 14.2 Supportive listening | 1 | Mean Difference (IV, Random, 95% CI) | 0.0 [0.0, 0.0] | |
| 15 Sleep at end of treatment (Jenkins Sleep Scale; 0 to 20 points) Show forest plot | 1 | Mean Difference (IV, Random, 95% CI) | Totals not selected | |
| Analysis 2.15  Comparison 2 Exercise therapy versus psychological treatment, Outcome 15 Sleep at end of treatment (Jenkins Sleep Scale; 0 to 20 points). | ||||
| 15.1 Supportive listening | 1 | Mean Difference (IV, Random, 95% CI) | 0.0 [0.0, 0.0] | |
| 16 Sleep at follow‐up (Jenkins Sleep Scale; 0 to 20 points) Show forest plot | 2 | Mean Difference (IV, Random, 95% CI) | Totals not selected | |
| Analysis 2.16 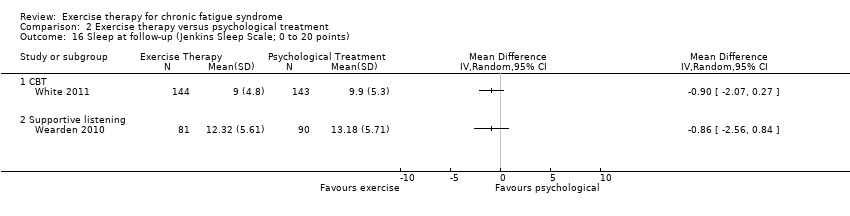 Comparison 2 Exercise therapy versus psychological treatment, Outcome 16 Sleep at follow‐up (Jenkins Sleep Scale; 0 to 20 points). | ||||
| 16.1 CBT | 1 | Mean Difference (IV, Random, 95% CI) | 0.0 [0.0, 0.0] | |
| 16.2 Supportive listening | 1 | Mean Difference (IV, Random, 95% CI) | 0.0 [0.0, 0.0] | |
| 17 Self‐perceived changes in overall health at end of treatment Show forest plot | 1 | Risk Ratio (M‐H, Random, 95% CI) | Totals not selected | |
| Analysis 2.17 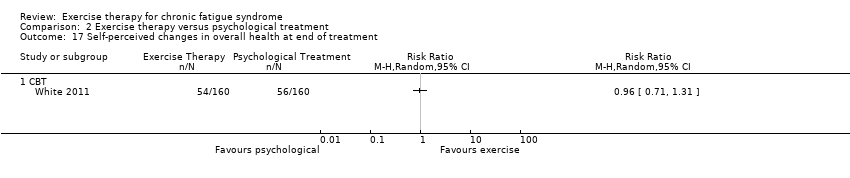 Comparison 2 Exercise therapy versus psychological treatment, Outcome 17 Self‐perceived changes in overall health at end of treatment. | ||||
| 17.1 CBT | 1 | Risk Ratio (M‐H, Random, 95% CI) | 0.0 [0.0, 0.0] | |
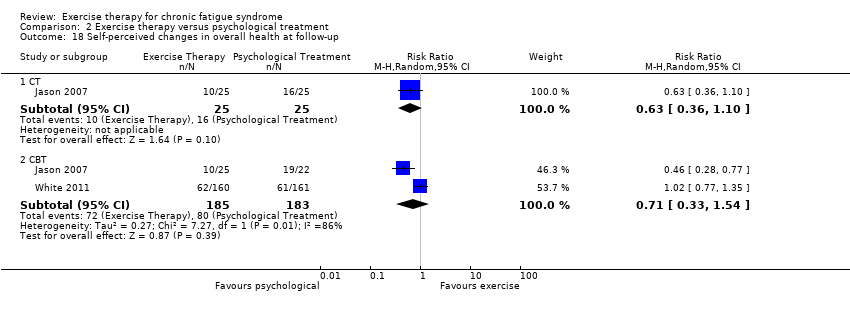
| 18 Self‐perceived changes in overall health at follow‐up Show forest plot | 2 | Risk Ratio (M‐H, Random, 95% CI) | Subtotals only | |
| Analysis 2.18  Comparison 2 Exercise therapy versus psychological treatment, Outcome 18 Self‐perceived changes in overall health at follow‐up. | ||||
| 18.1 CT | 1 | 50 | Risk Ratio (M‐H, Random, 95% CI) | 0.63 [0.36, 1.10] |
| 18.2 CBT | 2 | 368 | Risk Ratio (M‐H, Random, 95% CI) | 0.71 [0.33, 1.54] |
| 19 Health resource use (follow‐up) [Mean no. of contacts] Show forest plot | 1 | Mean Difference (IV, Random, 95% CI) | Totals not selected | |
| Analysis 2.19 ![Comparison 2 Exercise therapy versus psychological treatment, Outcome 19 Health resource use (follow‐up) [Mean no. of contacts].](/cdsr/doi/10.1002/14651858.CD003200.pub6/media/CDSR/CD003200/rel0006/CD003200/image_n/nCD003200-CMP-002-19.png) Comparison 2 Exercise therapy versus psychological treatment, Outcome 19 Health resource use (follow‐up) [Mean no. of contacts]. | ||||
| 19.1 Primary care | 1 | Mean Difference (IV, Random, 95% CI) | 0.0 [0.0, 0.0] | |
| 19.2 Other doctor | 1 | Mean Difference (IV, Random, 95% CI) | 0.0 [0.0, 0.0] | |
| 19.3 Healthcare professional | 1 | Mean Difference (IV, Random, 95% CI) | 0.0 [0.0, 0.0] | |
| 19.4 Inpatient | 1 | Mean Difference (IV, Random, 95% CI) | 0.0 [0.0, 0.0] | |
| 19.5 Accident and emergency | 1 | Mean Difference (IV, Random, 95% CI) | 0.0 [0.0, 0.0] | |
| 19.6 Other health/social services | 1 | Mean Difference (IV, Random, 95% CI) | 0.0 [0.0, 0.0] | |
| 19.7 Complementary health care | 1 | Mean Difference (IV, Random, 95% CI) | 0.0 [0.0, 0.0] | |
| 19.8 Standardised medical care | 1 | Mean Difference (IV, Random, 95% CI) | 0.0 [0.0, 0.0] | |
| 20 Health resource use (follow‐up) [No. of users] Show forest plot | 1 | Risk Ratio (M‐H, Random, 95% CI) | Totals not selected | |
| Analysis 2.20 ![Comparison 2 Exercise therapy versus psychological treatment, Outcome 20 Health resource use (follow‐up) [No. of users].](/cdsr/doi/10.1002/14651858.CD003200.pub6/media/CDSR/CD003200/rel0006/CD003200/image_n/nCD003200-CMP-002-20.png) Comparison 2 Exercise therapy versus psychological treatment, Outcome 20 Health resource use (follow‐up) [No. of users]. | ||||
| 20.1 Primary care | 1 | Risk Ratio (M‐H, Random, 95% CI) | 0.0 [0.0, 0.0] | |
| 20.2 Other doctor | 1 | Risk Ratio (M‐H, Random, 95% CI) | 0.0 [0.0, 0.0] | |
| 20.3 Healthcare professional | 1 | Risk Ratio (M‐H, Random, 95% CI) | 0.0 [0.0, 0.0] | |
| 20.4 Inpatient | 1 | Risk Ratio (M‐H, Random, 95% CI) | 0.0 [0.0, 0.0] | |
| 20.5 Accident and emergency | 1 | Risk Ratio (M‐H, Random, 95% CI) | 0.0 [0.0, 0.0] | |
| 20.6 Medication | 1 | Risk Ratio (M‐H, Random, 95% CI) | 0.0 [0.0, 0.0] | |
| 20.7 Complementary health care | 1 | Risk Ratio (M‐H, Random, 95% CI) | 0.0 [0.0, 0.0] | |
| 20.8 Other health/social services | 1 | Risk Ratio (M‐H, Random, 95% CI) | 0.0 [0.0, 0.0] | |
| 20.9 Standardised medical care | 1 | Risk Ratio (M‐H, Random, 95% CI) | 0.0 [0.0, 0.0] | |
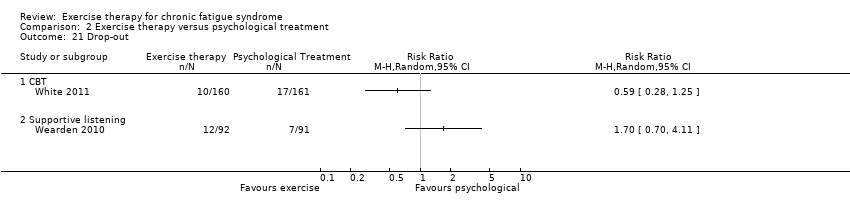
| 21 Drop‐out Show forest plot | 2 | Risk Ratio (M‐H, Random, 95% CI) | Totals not selected | |
| Analysis 2.21  Comparison 2 Exercise therapy versus psychological treatment, Outcome 21 Drop‐out. | ||||
| 21.1 CBT | 1 | Risk Ratio (M‐H, Random, 95% CI) | 0.0 [0.0, 0.0] | |
| 21.2 Supportive listening | 1 | Risk Ratio (M‐H, Random, 95% CI) | 0.0 [0.0, 0.0] | |
| Outcome or subgroup title | No. of studies | No. of participants | Statistical method | Effect size |
| 1 Fatigue Show forest plot | 1 | Mean Difference (IV, Random, 95% CI) | Totals not selected | |
| Analysis 3.1 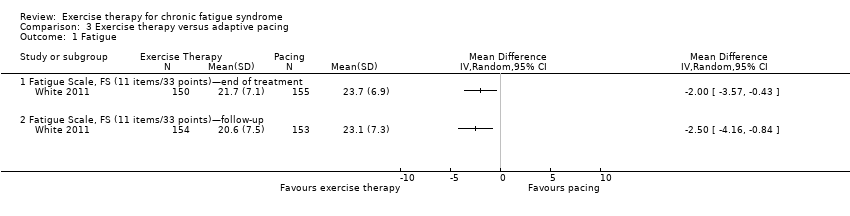 Comparison 3 Exercise therapy versus adaptive pacing, Outcome 1 Fatigue. | ||||
| 1.1 Fatigue Scale, FS (11 items/33 points)—end of treatment | 1 | Mean Difference (IV, Random, 95% CI) | 0.0 [0.0, 0.0] | |
| 1.2 Fatigue Scale, FS (11 items/33 points)—follow‐up | 1 | Mean Difference (IV, Random, 95% CI) | 0.0 [0.0, 0.0] | |
| 2 Participants with serious adverse reactions Show forest plot | 1 | Risk Ratio (M‐H, Random, 95% CI) | Totals not selected | |
| Analysis 3.2  Comparison 3 Exercise therapy versus adaptive pacing, Outcome 2 Participants with serious adverse reactions. | ||||
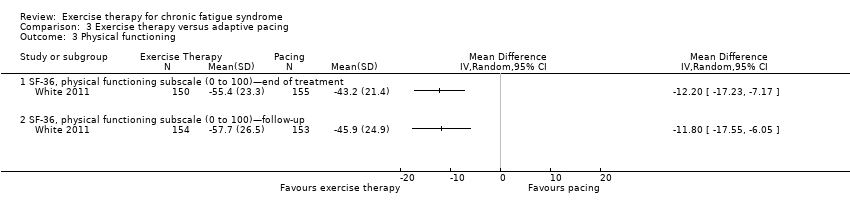
| 3 Physical functioning Show forest plot | 1 | Mean Difference (IV, Random, 95% CI) | Totals not selected | |
| Analysis 3.3  Comparison 3 Exercise therapy versus adaptive pacing, Outcome 3 Physical functioning. | ||||
| 3.1 SF‐36, physical functioning subscale (0 to 100)—end of treatment | 1 | Mean Difference (IV, Random, 95% CI) | 0.0 [0.0, 0.0] | |
| 3.2 SF‐36, physical functioning subscale (0 to 100)—follow‐up | 1 | Mean Difference (IV, Random, 95% CI) | 0.0 [0.0, 0.0] | |
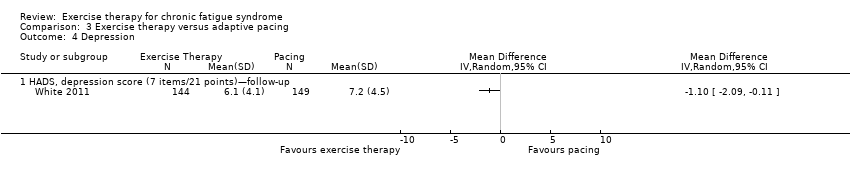
| 4 Depression Show forest plot | 1 | Mean Difference (IV, Random, 95% CI) | Totals not selected | |
| Analysis 3.4  Comparison 3 Exercise therapy versus adaptive pacing, Outcome 4 Depression. | ||||
| 4.1 HADS, depression score (7 items/21 points)—follow‐up | 1 | Mean Difference (IV, Random, 95% CI) | 0.0 [0.0, 0.0] | |
| 5 Anxiety Show forest plot | 1 | Mean Difference (IV, Random, 95% CI) | Totals not selected | |
| Analysis 3.5 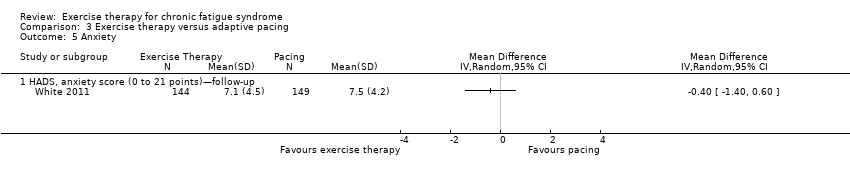 Comparison 3 Exercise therapy versus adaptive pacing, Outcome 5 Anxiety. | ||||
| 5.1 HADS, anxiety score (0 to 21 points)—follow‐up | 1 | Mean Difference (IV, Random, 95% CI) | 0.0 [0.0, 0.0] | |
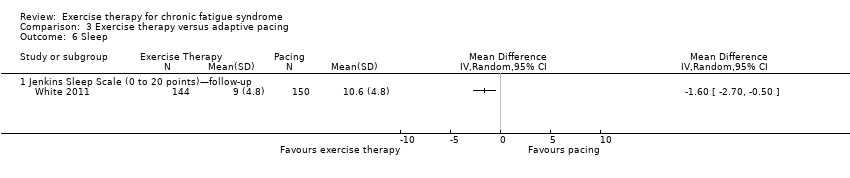
| 6 Sleep Show forest plot | 1 | Mean Difference (IV, Random, 95% CI) | Totals not selected | |
| Analysis 3.6  Comparison 3 Exercise therapy versus adaptive pacing, Outcome 6 Sleep. | ||||
| 6.1 Jenkins Sleep Scale (0 to 20 points)—follow‐up | 1 | Mean Difference (IV, Random, 95% CI) | 0.0 [0.0, 0.0] | |
| 7 Self‐perceived changes in overall health Show forest plot | 1 | Risk Ratio (M‐H, Random, 95% CI) | Totals not selected | |
| Analysis 3.7 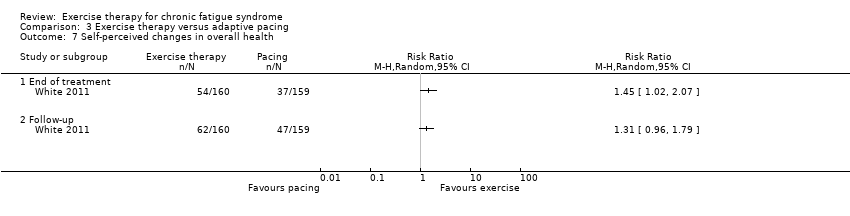 Comparison 3 Exercise therapy versus adaptive pacing, Outcome 7 Self‐perceived changes in overall health. | ||||
| 7.1 End of treatment | 1 | Risk Ratio (M‐H, Random, 95% CI) | 0.0 [0.0, 0.0] | |
| 7.2 Follow‐up | 1 | Risk Ratio (M‐H, Random, 95% CI) | 0.0 [0.0, 0.0] | |
| 8 Health resource use (follow‐up) [Mean no. of contacts] Show forest plot | 1 | Mean Difference (IV, Random, 95% CI) | Totals not selected | |
| Analysis 3.8 ![Comparison 3 Exercise therapy versus adaptive pacing, Outcome 8 Health resource use (follow‐up) [Mean no. of contacts].](/cdsr/doi/10.1002/14651858.CD003200.pub6/media/CDSR/CD003200/rel0006/CD003200/image_n/nCD003200-CMP-003-08.png) Comparison 3 Exercise therapy versus adaptive pacing, Outcome 8 Health resource use (follow‐up) [Mean no. of contacts]. | ||||
| 8.1 Primary care | 1 | Mean Difference (IV, Random, 95% CI) | 0.0 [0.0, 0.0] | |
| 8.2 Other doctor | 1 | Mean Difference (IV, Random, 95% CI) | 0.0 [0.0, 0.0] | |
| 8.3 Healthcare professional | 1 | Mean Difference (IV, Random, 95% CI) | 0.0 [0.0, 0.0] | |
| 8.4 Inpatient | 1 | Mean Difference (IV, Random, 95% CI) | 0.0 [0.0, 0.0] | |
| 8.5 Accident and emergency | 1 | Mean Difference (IV, Random, 95% CI) | 0.0 [0.0, 0.0] | |
| 8.6 Other health/social services | 1 | Mean Difference (IV, Random, 95% CI) | 0.0 [0.0, 0.0] | |
| 8.7 Complementary health care | 1 | Mean Difference (IV, Random, 95% CI) | 0.0 [0.0, 0.0] | |
| 8.8 Standardised medical care | 1 | Mean Difference (IV, Random, 95% CI) | 0.0 [0.0, 0.0] | |
| 9 Health resource use (follow‐up) [No. of users] Show forest plot | 1 | Risk Ratio (M‐H, Random, 95% CI) | Totals not selected | |
| Analysis 3.9 ![Comparison 3 Exercise therapy versus adaptive pacing, Outcome 9 Health resource use (follow‐up) [No. of users].](/cdsr/doi/10.1002/14651858.CD003200.pub6/media/CDSR/CD003200/rel0006/CD003200/image_n/nCD003200-CMP-003-09.png) Comparison 3 Exercise therapy versus adaptive pacing, Outcome 9 Health resource use (follow‐up) [No. of users]. | ||||
| 9.1 Primary care | 1 | Risk Ratio (M‐H, Random, 95% CI) | 0.0 [0.0, 0.0] | |
| 9.2 Other doctor | 1 | Risk Ratio (M‐H, Random, 95% CI) | 0.0 [0.0, 0.0] | |
| 9.3 Healthcare professional | 1 | Risk Ratio (M‐H, Random, 95% CI) | 0.0 [0.0, 0.0] | |
| 9.4 Inpatient | 1 | Risk Ratio (M‐H, Random, 95% CI) | 0.0 [0.0, 0.0] | |
| 9.5 Accident and emergency | 1 | Risk Ratio (M‐H, Random, 95% CI) | 0.0 [0.0, 0.0] | |
| 9.6 Medication | 1 | Risk Ratio (M‐H, Random, 95% CI) | 0.0 [0.0, 0.0] | |
| 9.7 Complementary health care | 1 | Risk Ratio (M‐H, Random, 95% CI) | 0.0 [0.0, 0.0] | |
| 9.8 Other health/social services | 1 | Risk Ratio (M‐H, Random, 95% CI) | 0.0 [0.0, 0.0] | |
| 9.9 Standardised medical care | 1 | Risk Ratio (M‐H, Random, 95% CI) | 0.0 [0.0, 0.0] | |
| 10 Drop‐out Show forest plot | 1 | Risk Ratio (M‐H, Random, 95% CI) | Totals not selected | |
| Analysis 3.10  Comparison 3 Exercise therapy versus adaptive pacing, Outcome 10 Drop‐out. | ||||
| Outcome or subgroup title | No. of studies | No. of participants | Statistical method | Effect size |
| 1 Fatigue Show forest plot | 1 | Mean Difference (IV, Random, 95% CI) | Totals not selected | |
| Analysis 4.1  Comparison 4 Exercise therapy + antidepressant placebo versus antidepressant + exercise placebo, Outcome 1 Fatigue. | ||||
| 1.1 Fatigue Scale, FS (14 items/0 to 42 points)—end of treatment | 1 | Mean Difference (IV, Random, 95% CI) | 0.0 [0.0, 0.0] | |
| 2 Depression Show forest plot | 1 | Mean Difference (IV, Random, 95% CI) | Totals not selected | |
| Analysis 4.2  Comparison 4 Exercise therapy + antidepressant placebo versus antidepressant + exercise placebo, Outcome 2 Depression. | ||||
| 2.1 HADS, depression score (7 items/21 points)—end of treatment | 1 | Mean Difference (IV, Random, 95% CI) | 0.0 [0.0, 0.0] | |
| 3 Drop‐out Show forest plot | 1 | Risk Ratio (M‐H, Random, 95% CI) | Totals not selected | |
| Analysis 4.3  Comparison 4 Exercise therapy + antidepressant placebo versus antidepressant + exercise placebo, Outcome 3 Drop‐out. | ||||
| Outcome or subgroup title | No. of studies | No. of participants | Statistical method | Effect size |
| 1 Fatigue Show forest plot | 1 | Mean Difference (IV, Random, 95% CI) | Totals not selected | |
| Analysis 5.1  Comparison 5 Exercise therapy + antidepressant versus antidepressant + exercise placebo, Outcome 1 Fatigue. | ||||
| 1.1 Fatigue Scale, FS (14 items/0 to 42 points)—end of treatment | 1 | Mean Difference (IV, Random, 95% CI) | 0.0 [0.0, 0.0] | |
| 2 Depression Show forest plot | 1 | Mean Difference (IV, Random, 95% CI) | Totals not selected | |
| Analysis 5.2  Comparison 5 Exercise therapy + antidepressant versus antidepressant + exercise placebo, Outcome 2 Depression. | ||||
| 2.1 HADS, depression score (7 items/21 points)—end of treatment | 1 | Mean Difference (IV, Random, 95% CI) | 0.0 [0.0, 0.0] | |
| 3 Drop‐out Show forest plot | 1 | Risk Ratio (M‐H, Random, 95% CI) | Totals not selected | |
| Analysis 5.3  Comparison 5 Exercise therapy + antidepressant versus antidepressant + exercise placebo, Outcome 3 Drop‐out. | ||||

PRISMA flow diagram.
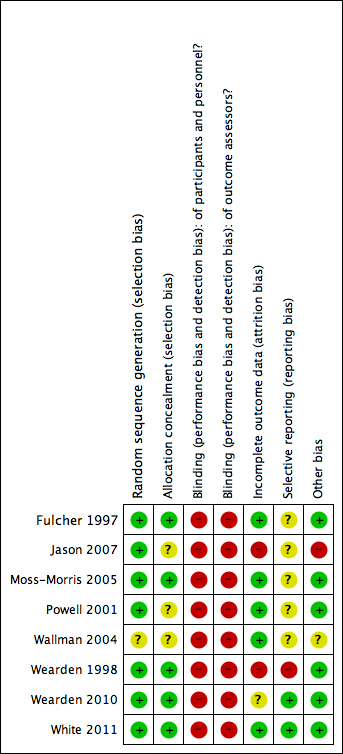
Risk of bias summary: review authors' judgements about each risk of bias item for each included study.
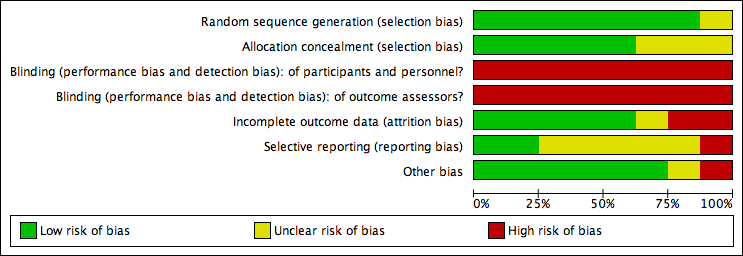
Risk of bias graph: review authors' judgements about each risk of bias item presented as percentages across all included studies.

Comparison 1 Exercise therapy versus treatment as usual, relaxation or flexibility, Outcome 1 Fatigue (end of treatment).

Comparison 1 Exercise therapy versus treatment as usual, relaxation or flexibility, Outcome 2 Fatigue (follow‐up).
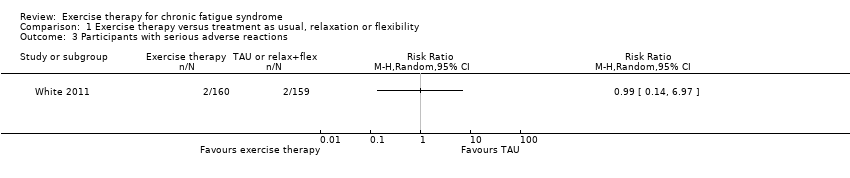
Comparison 1 Exercise therapy versus treatment as usual, relaxation or flexibility, Outcome 3 Participants with serious adverse reactions.
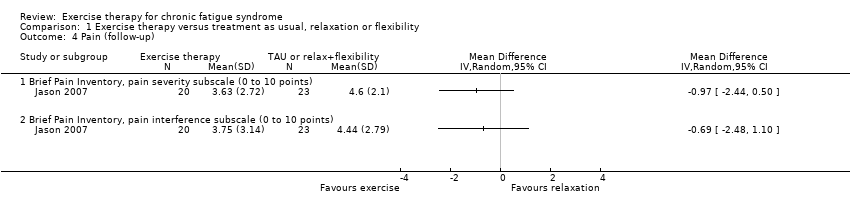
Comparison 1 Exercise therapy versus treatment as usual, relaxation or flexibility, Outcome 4 Pain (follow‐up).

Comparison 1 Exercise therapy versus treatment as usual, relaxation or flexibility, Outcome 5 Physical functioning (end of treatment).

Comparison 1 Exercise therapy versus treatment as usual, relaxation or flexibility, Outcome 6 Physical functioning (follow‐up).
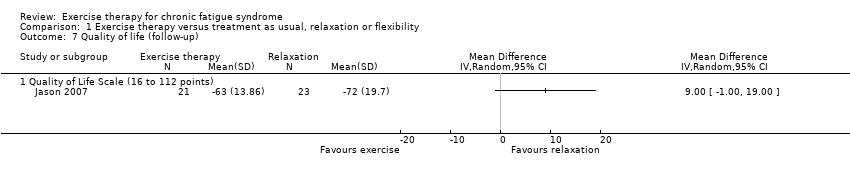
Comparison 1 Exercise therapy versus treatment as usual, relaxation or flexibility, Outcome 7 Quality of life (follow‐up).

Comparison 1 Exercise therapy versus treatment as usual, relaxation or flexibility, Outcome 8 Depression (end of treatment).
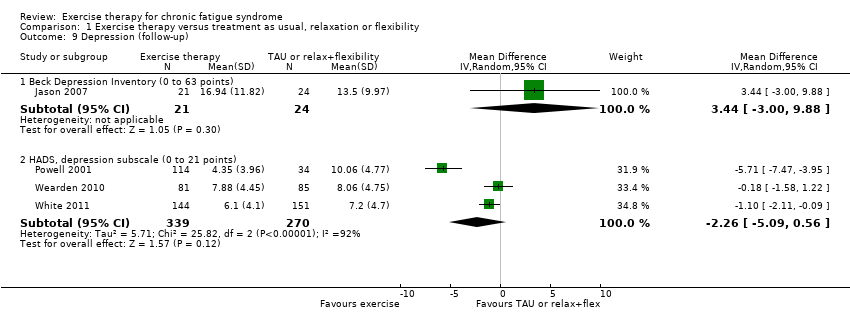
Comparison 1 Exercise therapy versus treatment as usual, relaxation or flexibility, Outcome 9 Depression (follow‐up).
Comparison 1 Exercise therapy versus treatment as usual, relaxation or flexibility, Outcome 10 Anxiety (end of treatment).

Comparison 1 Exercise therapy versus treatment as usual, relaxation or flexibility, Outcome 11 Anxiety (follow‐up).

Comparison 1 Exercise therapy versus treatment as usual, relaxation or flexibility, Outcome 12 Sleep (end of treatment).

Comparison 1 Exercise therapy versus treatment as usual, relaxation or flexibility, Outcome 13 Sleep (follow‐up).
Comparison 1 Exercise therapy versus treatment as usual, relaxation or flexibility, Outcome 14 Self‐perceived changes in overall health (end of treatment).
Comparison 1 Exercise therapy versus treatment as usual, relaxation or flexibility, Outcome 15 Self‐perceived changes in overall health (follow‐up).
![Comparison 1 Exercise therapy versus treatment as usual, relaxation or flexibility, Outcome 16 Health resource use (follow‐up) [Mean no. of contacts].](/es/cdsr/doi/10.1002/14651858.CD003200.pub6/media/CDSR/CD003200/rel0006/CD003200/image_n/nCD003200-CMP-001-16.png)
Comparison 1 Exercise therapy versus treatment as usual, relaxation or flexibility, Outcome 16 Health resource use (follow‐up) [Mean no. of contacts].
![Comparison 1 Exercise therapy versus treatment as usual, relaxation or flexibility, Outcome 17 Health resource use (follow‐up) [No. of users].](/es/cdsr/doi/10.1002/14651858.CD003200.pub6/media/CDSR/CD003200/rel0006/CD003200/image_n/nCD003200-CMP-001-17.png)
Comparison 1 Exercise therapy versus treatment as usual, relaxation or flexibility, Outcome 17 Health resource use (follow‐up) [No. of users].

Comparison 1 Exercise therapy versus treatment as usual, relaxation or flexibility, Outcome 18 Drop‐out.

Comparison 1 Exercise therapy versus treatment as usual, relaxation or flexibility, Outcome 19 Subgroup analysis for fatigue.

Comparison 2 Exercise therapy versus psychological treatment, Outcome 1 Fatigue at end of treatment (FS; 11 items/0 to 33 points).

Comparison 2 Exercise therapy versus psychological treatment, Outcome 2 Fatigue at follow‐up (FSS; 1 to 7 points).

Comparison 2 Exercise therapy versus psychological treatment, Outcome 3 Fatigue at follow‐up (FS; 11 items/0 to 33 points).

Comparison 2 Exercise therapy versus psychological treatment, Outcome 4 Participants with serious adverse reactions.

Comparison 2 Exercise therapy versus psychological treatment, Outcome 5 Pain at follow‐up (BPI, pain severity subscale; 0 to 10 points).
Comparison 2 Exercise therapy versus psychological treatment, Outcome 6 Pain at follow‐up (BPI, pain interference subscale; 0 to 10 points).

Comparison 2 Exercise therapy versus psychological treatment, Outcome 7 Physical functioning at end of treatment (SF‐36, physical functioning subscale; 0 to 100 points).
Comparison 2 Exercise therapy versus psychological treatment, Outcome 8 Physical functioning at follow‐up (SF‐36, physical functioning subscale; 0 to 100 points).

Comparison 2 Exercise therapy versus psychological treatment, Outcome 9 Depression at end of treatment (HADS depression score; 7 items/21 points).

Comparison 2 Exercise therapy versus psychological treatment, Outcome 10 Depression at follow‐up (BDI; 0 to 63 points).

Comparison 2 Exercise therapy versus psychological treatment, Outcome 11 Depression at follow‐up (HADS depression score; 7 items/21 points).

Comparison 2 Exercise therapy versus psychological treatment, Outcome 12 Anxiety at end of treatment (HADS anxiety; 7 items/21 points).

Comparison 2 Exercise therapy versus psychological treatment, Outcome 13 Anxiety at follow‐up (BAI; 0 to 63 points).
Comparison 2 Exercise therapy versus psychological treatment, Outcome 14 Anxiety at follow‐up (HADS anxiety; 7 items/21 points).

Comparison 2 Exercise therapy versus psychological treatment, Outcome 15 Sleep at end of treatment (Jenkins Sleep Scale; 0 to 20 points).

Comparison 2 Exercise therapy versus psychological treatment, Outcome 16 Sleep at follow‐up (Jenkins Sleep Scale; 0 to 20 points).

Comparison 2 Exercise therapy versus psychological treatment, Outcome 17 Self‐perceived changes in overall health at end of treatment.
Comparison 2 Exercise therapy versus psychological treatment, Outcome 18 Self‐perceived changes in overall health at follow‐up.
![Comparison 2 Exercise therapy versus psychological treatment, Outcome 19 Health resource use (follow‐up) [Mean no. of contacts].](/es/cdsr/doi/10.1002/14651858.CD003200.pub6/media/CDSR/CD003200/rel0006/CD003200/image_n/nCD003200-CMP-002-19.png)
Comparison 2 Exercise therapy versus psychological treatment, Outcome 19 Health resource use (follow‐up) [Mean no. of contacts].
![Comparison 2 Exercise therapy versus psychological treatment, Outcome 20 Health resource use (follow‐up) [No. of users].](/es/cdsr/doi/10.1002/14651858.CD003200.pub6/media/CDSR/CD003200/rel0006/CD003200/image_n/nCD003200-CMP-002-20.png)
Comparison 2 Exercise therapy versus psychological treatment, Outcome 20 Health resource use (follow‐up) [No. of users].
Comparison 2 Exercise therapy versus psychological treatment, Outcome 21 Drop‐out.

Comparison 3 Exercise therapy versus adaptive pacing, Outcome 1 Fatigue.

Comparison 3 Exercise therapy versus adaptive pacing, Outcome 2 Participants with serious adverse reactions.
Comparison 3 Exercise therapy versus adaptive pacing, Outcome 3 Physical functioning.
Comparison 3 Exercise therapy versus adaptive pacing, Outcome 4 Depression.

Comparison 3 Exercise therapy versus adaptive pacing, Outcome 5 Anxiety.
Comparison 3 Exercise therapy versus adaptive pacing, Outcome 6 Sleep.

Comparison 3 Exercise therapy versus adaptive pacing, Outcome 7 Self‐perceived changes in overall health.
![Comparison 3 Exercise therapy versus adaptive pacing, Outcome 8 Health resource use (follow‐up) [Mean no. of contacts].](/es/cdsr/doi/10.1002/14651858.CD003200.pub6/media/CDSR/CD003200/rel0006/CD003200/image_n/nCD003200-CMP-003-08.png)
Comparison 3 Exercise therapy versus adaptive pacing, Outcome 8 Health resource use (follow‐up) [Mean no. of contacts].
![Comparison 3 Exercise therapy versus adaptive pacing, Outcome 9 Health resource use (follow‐up) [No. of users].](/es/cdsr/doi/10.1002/14651858.CD003200.pub6/media/CDSR/CD003200/rel0006/CD003200/image_n/nCD003200-CMP-003-09.png)
Comparison 3 Exercise therapy versus adaptive pacing, Outcome 9 Health resource use (follow‐up) [No. of users].

Comparison 3 Exercise therapy versus adaptive pacing, Outcome 10 Drop‐out.

Comparison 4 Exercise therapy + antidepressant placebo versus antidepressant + exercise placebo, Outcome 1 Fatigue.
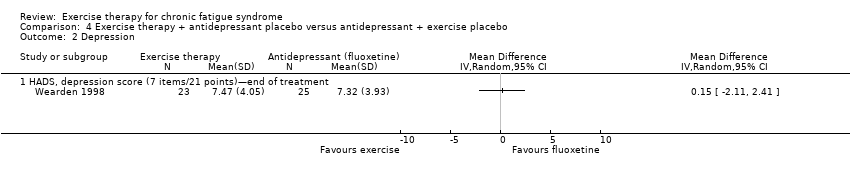
Comparison 4 Exercise therapy + antidepressant placebo versus antidepressant + exercise placebo, Outcome 2 Depression.

Comparison 4 Exercise therapy + antidepressant placebo versus antidepressant + exercise placebo, Outcome 3 Drop‐out.

Comparison 5 Exercise therapy + antidepressant versus antidepressant + exercise placebo, Outcome 1 Fatigue.
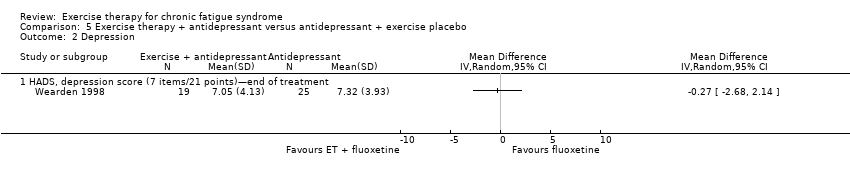
Comparison 5 Exercise therapy + antidepressant versus antidepressant + exercise placebo, Outcome 2 Depression.

Comparison 5 Exercise therapy + antidepressant versus antidepressant + exercise placebo, Outcome 3 Drop‐out.
| Exercise therapy for chronic fatigue syndrome | ||||||
| Patient or population: males and females over 18 years of age with chronic fatigue syndrome Intervention: exercise therapy Comparison: standard care, waiting list or relaxation/flexibility | ||||||
| Outcomes | Illustrative comparative risks* (95% CI) | Relative effect | Number of participants | Quality of the evidence | Comments | |
| Assumed risk | Corresponding risk | |||||
| Control | Exercise | |||||
| Fatiguea: FS, Fatigue Scale (0 to 11 points) (end of treatment) | Mean fatigue in the control groups was 10.4 points | Mean fatigue in the intervention groups was | 148 | ⊕⊕⊝⊝ | Lower score indicates less fatigue | |
| Fatiguea: FS, Fatigue Scale (0 to 33 points) (end of treatment) | Mean fatigue ranged across control groups from 15.3 to 26.3 points | Mean fatigue in the intervention groups was | 540 | ⊕⊕⊕⊝ | Lower score indicates less fatigue | |
| Fatiguea: FS, Fatigue Scale (0 to 42 points) (end of treatment) | Mean fatigue ranged across control groups from 24.4 to 31.6 points | Mean fatigue in the intervention groups was 6.80 points lower (10.31 to 3.28 lower) | 152 | ⊕⊕⊕⊝ | Lower score indicates less fatigue | |
| Participants with serious adverse reactions | Study population | RR 0.99 (0.14 to 6.97) | 319 | ⊕⊕⊕⊝ | ||
| 13 per 1000 | 12 per 1000 | |||||
| Quality of Life (QOL) Scale (16 to 112 points) (follow‐up) | Mean QOL score in the control group was 72 points | Mean QOL score in the intervention groups was 9.00 points lower (19.00 lower to 1.00 higher) | 44 | ⊕⊝⊝⊝ | Higher score indicates improved QOL | |
| Physical functioning: SF‐36 subscale (0 to 100 points) (end of treatment) | Mean physical functioning score ranged from 31.1 to 55.2 points across control groups | Mean physical functioning score in the intervention groups was 13.10 points higher (1.98 to 24.22 higher) | 725 | ⊕⊕⊝⊝ Lowb,g | Higher score indicates improved physical function | |
| Depression: HADS depression score (0 to 21 points) (end of treatment) | Mean depression score ranged across control groups from 5.2 to 11.2 points | Mean depression score in the intervention groups was 1.63 points lower (3.50 lower to 0.23 higher) | 504 | ⊕⊝⊝⊝ | Lower score indicates fewer depressive symptoms | |
| Sleep: Jenkins Sleep Scale (0 to 20 points) (end of treatment) | Mean sleep score ranged across control groups from 11.7 to 12.2 points | Mean sleep score in the intervention groups was | 323 | ⊕⊕⊝⊝ | Lower score indicates improved sleep quality | |
| Self‐perceived changes in overall health (end of treatment) | Study population | RR 1.83 (1.39 to 2.40) | 489 | ⊕⊕⊕⊝ | RR higher than 1 means that more participants in exercise groups reported improvement | |
| 218 per 1000 | 399 per 1000 | |||||
| Medium‐risk population | ||||||
| 238 per 1000 | 436 per 1000 | |||||
| Drop‐out (end of treatment) | Study population | RR 1.63 (0.77 to 3.43) | 843 (6 studies) | ⊕⊕⊝⊝ | RR higher than 1 means that more participants in exercise groups dropped out from treatment | |
| 70 per 1000 | 114 per 1000 (54 to 241) | |||||
| Medium‐risk population | ||||||
| 89 per 1000 | 145 per 1000 (69 to 305) | |||||
| *The basis for the assumed risk (e.g. median control group risk across studies) is provided in footnotes. The corresponding risk (and its 95% confidence interval) is based on the assumed risk in the comparison group and the relative effect of the intervention (and its 95% CI). | ||||||
| GRADE Working Group grades of evidence. | ||||||
| aWe choose to present effect estimates as measured on the original scales rather than to transform them to standardised units. As 3 different scoring systems for fatigue were used, the outcome is presented over 3 rows. bRisk of bias (‐1): All studies were at risk of performance bias, as they were unblinded. | ||||||
| Study ID | N | Gender | Duration of illness | Depression co‐morbidity | Use of antidepressants (ADs) | Work and employment status |
| 66 | 49F/17M 65% female | 2.7 years | 20 (30%) possible cases of depression (HADS) | 30 (45%) on full‐dose AD (n = 20) or low‐dose AD (n = 10) | 26 (39%) working or studying at least part time | |
| 114 | 95F/19M 83% female | > 5.0 years | 44 (39%) with a current Axis I disorder (depression and anxiety most common) | Not stated | 52 (46%) working or studying at least part time, 24% unemployed, 6% retired, 25% on disability | |
| 49 | 34F/15M 69% female | 3.1 years | 14 (29%) possible or probable cases of depression (HADS) | Not stated | 11 (22%) were unemployed and were unable to work because of disability | |
| 148 | 116F/32M 78% female | 4.3 years | 58 (39%) possible or probable cases of depression (HADS) | 27 (18%) used AD | 50 (34%) were working, 64 (43%) were on disability | |
| 61 | 47F/14M 77% female | Not stated | Not stated | 16 (26%) used AD | Not stated | |
| 136 | 97F/39M 71% female | 2.3 years | 46 (34%) with depressive disorder according to DSM‐III‐R criteria | Not stated | 114 (84%) had recently changed occupation | |
| 296 | 230F/66M 78% female | 7.0 years | 53 (18%) had a depression diagnosis | 160 (54%) were prescribed AD in the past 6 months | Not stated | |
| 641 | 495F/146M 77% female | 2.7 years | 219 (34%) with any depressive disorder | 260 (41%) used AD | Not stated |
| Study ID | Deliverer of intervention | Explanation and materials | Type of exercise | Schedule therapist | Schedule home | Duration of activity | Initial exercise level | Increment steps | Participant self‐monitoring | Criteria for (non)‐increment |
| Exercise physiologist | Verbal explanation of deconditioning and reconditioning | Walking (encouraged to take other modes such as cycling and swimming) | Weekly (1 hour), talking only | 5 days/wk | 5 to 15 minutes increasing to 30 minutes/d | 5 to 15 minutes at 40% of peak O2 consumption (target HR of resting + 50% of HRR) | Duration increased 1 to 2 minutes per week up to 30 minutes; then intensity increased | Ambulatory heart rate monitors | If increased fatigue, continue at the same level for an extra week | |
| Physiotherapist, fitness focus | Minimal explanation; no written materials | Preferred activity (walking/jogging, some did cycling, swimming) | At week 0, 1, 2, 4, 8, 12*, 20, 26*, talking only (*evaluation visits) | 3 days/wk | 20 minutes | 75% of VO2max from bike test | Intensity increased | Borg Exertion Scale chart, before and after HR | Increase if: | |
| Senior clinical therapist | Explanations for GET, circadian dysrhythmia, deconditioning, sleep "educational information pack" | Aerobic exercise; own choice but mostly exercise bike | 9 face‐to‐face (1.5 hours each) | Tailored | Tailored to functional abilities | Tailored to functional abilities: “a level which you are capable of doing on a BAD DAY” | Varying daily increase (e.g. "5 second increase each day for the rest of the second week" to 30 minutes twice/d | Duration of exercise | Discouraged, but restart at lower level and rapidly reincrease | |
| Single physical therapist | Small laminated Borg Scale and heart rate monitor | Walking/jogging, swimming or cycling | Phone contact every 2 weeks | Every second day | From 5 to 15 minutes, increasing to 30 minutes | Initial exercise duration was between 5 and 15 minutes, and intensity was based on the mean HR value achieved midpoint during submaximal exercise tests | Duration increased by 2 to 5 minutes/2 wk | Heart rate monitoring, Borg Exertion Scale | Keep Borg within 11 to 14. Adjust every 2 weeks. Average peak HR when exercising comfortably at a typical day represents patient’s target heart rate (± 3 bpm) for future sessions | |
| Health psychology MSc student, researcher | Focused on the "downward spiral of activity reduction, deconditioning" | Walking (but could also do other preferred exercise, e.g. jogging, swimming) | Weekly for 12 weeks, talking only | 4 to 5 days/wk | Set collaboratively approx 5 to 15 minutes | HR at 40% of VO2max | Duration 3 to 5 minutes/wk Intensity increased after 6 weeks 5 bpm/wk | Ambulatory heart rate monitors | If increased fatigue, continue at the same level for an extra week | |
| Registered nurses supervised by exercise physiologist | "Behavioral goals explained, energy system education, redefining exercise" | "individualized, constructive and pleasurable activities" | Every 2 weeks (45 minutes), 13 sessions | 3 per week | Tailored | Flexibility tests Strength test (hand grip) | "Gradually increasing anaerobic activity levels" | Self‐monitoring daily exercise diary | New targets only after habituation, or if goals achieved for 2 weeks | |
| Nurses with 16 half‐days of training and supervision | Explanation of physiological symptoms and training in first session | Wide choice: walking, stairs, bicycle, dance, jog | 10 sessions over 18 weeks | Several times per day | First 90 minutes, then alternating 60 and 30 minutes | Determined collaboratively with the participant | "Increased very gradually," examples show 50% increase per day | Diary of progress on exercise programme, with note of daily activities | On "bad days," try to do same as day before | |
| Exercise therapist/physiotherapist (8 to 10 days training + ongoing supervision) | 142‐page manual: benefits of exercise and "how to" of GET; some got pedometers | Wide choice: walking, cycling, swimming, Tai Chi. Aim to build into daily activities | Weekly × 4, then fortnightly; total of 15 sessions | 5 to 6 days/wk | Negotiated, goal to get to 30 minutes per session | Test of fitness (step test. and 6‐minute walking test), perceived physical exertion, actigraphy data | "20% increases" per fortnight; increase duration to 30 minutes, then increase intensity | Exercise diary + Borg scale + “Use non‐symptoms to monitor” and heart rate monitor (for intensity increases) | Do not increase if global increase in symptoms | |
| © 9. March 2012, Paul Glasziou, Bond University, Australia | ||||||||||
| Outcome or subgroup title | No. of studies | No. of participants | Statistical method | Effect size |
| 1 Fatigue (end of treatment) Show forest plot | 7 | Mean Difference (IV, Random, 95% CI) | Subtotals only | |
| 1.1 Fatigue Scale, FS (11 items/0 to 11 points) | 1 | 148 | Mean Difference (IV, Random, 95% CI) | ‐6.06 [‐6.95, ‐5.17] |
| 1.2 Fatigue Scale, FS (11 items/0 to 33 points) | 3 | 540 | Mean Difference (IV, Random, 95% CI) | ‐2.82 [‐4.07, ‐1.57] |
| 1.3 Fatigue Scale, FS (14 items/0 to 42 points) | 3 | 152 | Mean Difference (IV, Random, 95% CI) | ‐6.80 [‐10.31, ‐3.28] |
| 2 Fatigue (follow‐up) Show forest plot | 4 | Mean Difference (IV, Random, 95% CI) | Subtotals only | |
| 2.1 Fatigue Scale, FS (11 items/0 to 11 points) | 1 | 148 | Mean Difference (IV, Random, 95% CI) | ‐7.13 [‐7.97, ‐6.29] |
| 2.2 Fatigue Scale, FS (11 items/0 to 33 points) | 2 | 472 | Mean Difference (IV, Random, 95% CI) | ‐2.87 [‐4.18, ‐1.55] |
| 2.3 Fatigue Severity Scale, FSS (9 items/1 to 7 points) | 1 | 50 | Mean Difference (IV, Random, 95% CI) | 0.15 [‐0.55, 0.85] |
| 3 Participants with serious adverse reactions Show forest plot | 1 | Risk Ratio (M‐H, Random, 95% CI) | Totals not selected | |
| 4 Pain (follow‐up) Show forest plot | 1 | Mean Difference (IV, Random, 95% CI) | Totals not selected | |
| 4.1 Brief Pain Inventory, pain severity subscale (0 to 10 points) | 1 | Mean Difference (IV, Random, 95% CI) | 0.0 [0.0, 0.0] | |
| 4.2 Brief Pain Inventory, pain interference subscale (0 to 10 points) | 1 | Mean Difference (IV, Random, 95% CI) | 0.0 [0.0, 0.0] | |
| 5 Physical functioning (end of treatment) Show forest plot | 5 | Mean Difference (IV, Random, 95% CI) | Subtotals only | |
| 5.1 SF‐36, physical functioning subscale (0 to 100 points) | 5 | 725 | Mean Difference (IV, Random, 95% CI) | ‐13.10 [‐24.22, ‐1.98] |
| 6 Physical functioning (follow‐up) Show forest plot | 3 | Mean Difference (IV, Random, 95% CI) | Subtotals only | |
| 6.1 SF‐36, physical functioning subscale (0 to 100 points) | 3 | 621 | Mean Difference (IV, Random, 95% CI) | ‐16.33 [‐36.74, 4.08] |
| 7 Quality of life (follow‐up) Show forest plot | 1 | Mean Difference (IV, Random, 95% CI) | Totals not selected | |
| 7.1 Quality of Life Scale (16 to 112 points) | 1 | Mean Difference (IV, Random, 95% CI) | 0.0 [0.0, 0.0] | |
| 8 Depression (end of treatment) Show forest plot | 5 | Mean Difference (IV, Random, 95% CI) | Subtotals only | |
| 8.1 HADS, depression score (7 items/21 points) | 5 | 504 | Mean Difference (IV, Random, 95% CI) | ‐1.63 [‐3.50, 0.23] |
| 9 Depression (follow‐up) Show forest plot | 4 | Mean Difference (IV, Random, 95% CI) | Subtotals only | |
| 9.1 Beck Depression Inventory (0 to 63 points) | 1 | 45 | Mean Difference (IV, Random, 95% CI) | 3.44 [‐1.00, 9.88] |
| 9.2 HADS, depression subscale (0 to 21 points) | 3 | 609 | Mean Difference (IV, Random, 95% CI) | ‐2.26 [‐5.09, 0.56] |
| 10 Anxiety (end of treatment) Show forest plot | 3 | Mean Difference (IV, Random, 95% CI) | Subtotals only | |
| 10.1 HADS, anxiety score (0 to 21 points) | 3 | 387 | Mean Difference (IV, Random, 95% CI) | ‐1.48 [‐3.58, 0.61] |
| 11 Anxiety (follow‐up) Show forest plot | 4 | Mean Difference (IV, Random, 95% CI) | Subtotals only | |
| 11.1 Beck Anxiety Inventory (0 to 63 points) | 1 | 45 | Mean Difference (IV, Random, 95% CI) | 0.70 [‐4.52, 5.92] |
| 11.2 HADS, anxiety score (0 to 21 points) | 3 | 607 | Mean Difference (IV, Random, 95% CI) | ‐1.01 [‐2.75, 0.74] |
| 12 Sleep (end of treatment) Show forest plot | 2 | Mean Difference (IV, Random, 95% CI) | Subtotals only | |
| 12.1 Jenkins Sleep Scale (0 to 20 points) | 2 | 323 | Mean Difference (IV, Random, 95% CI) | ‐1.49 [‐2.95, ‐0.02] |
| 13 Sleep (follow‐up) Show forest plot | 3 | Mean Difference (IV, Random, 95% CI) | Subtotals only | |
| 13.1 Jenkins Sleep Scale (0 to 20 points) | 3 | 610 | Mean Difference (IV, Random, 95% CI) | ‐2.04 [‐3.84, ‐0.23] |
| 14 Self‐perceived changes in overall health (end of treatment) Show forest plot | 4 | 489 | Risk Ratio (M‐H, Random, 95% CI) | 1.83 [1.39, 2.40] |
| 15 Self‐perceived changes in overall health (follow‐up) Show forest plot | 3 | 518 | Risk Ratio (M‐H, Random, 95% CI) | 1.88 [0.76, 4.64] |
| 16 Health resource use (follow‐up) [Mean no. of contacts] Show forest plot | 1 | Mean Difference (IV, Random, 95% CI) | Totals not selected | |
| 16.1 Primary care | 1 | Mean Difference (IV, Random, 95% CI) | 0.0 [0.0, 0.0] | |
| 16.2 Other doctor | 1 | Mean Difference (IV, Random, 95% CI) | 0.0 [0.0, 0.0] | |
| 16.3 Healthcare professional | 1 | Mean Difference (IV, Random, 95% CI) | 0.0 [0.0, 0.0] | |
| 16.4 Inpatient | 1 | Mean Difference (IV, Random, 95% CI) | 0.0 [0.0, 0.0] | |
| 16.5 Accident and emergency | 1 | Mean Difference (IV, Random, 95% CI) | 0.0 [0.0, 0.0] | |
| 16.6 Other health/social services | 1 | Mean Difference (IV, Random, 95% CI) | 0.0 [0.0, 0.0] | |
| 16.7 Complementary health care | 1 | Mean Difference (IV, Random, 95% CI) | 0.0 [0.0, 0.0] | |
| 16.8 Standardised medical care | 1 | Mean Difference (IV, Random, 95% CI) | 0.0 [0.0, 0.0] | |
| 17 Health resource use (follow‐up) [No. of users] Show forest plot | 1 | Risk Ratio (M‐H, Random, 95% CI) | Totals not selected | |
| 17.1 Primary care | 1 | Risk Ratio (M‐H, Random, 95% CI) | 0.0 [0.0, 0.0] | |
| 17.2 Other doctor | 1 | Risk Ratio (M‐H, Random, 95% CI) | 0.0 [0.0, 0.0] | |
| 17.3 Healthcare professional | 1 | Risk Ratio (M‐H, Random, 95% CI) | 0.0 [0.0, 0.0] | |
| 17.4 Inpatient | 1 | Risk Ratio (M‐H, Random, 95% CI) | 0.0 [0.0, 0.0] | |
| 17.5 Accident and emergency | 1 | Risk Ratio (M‐H, Random, 95% CI) | 0.0 [0.0, 0.0] | |
| 17.6 Medication | 1 | Risk Ratio (M‐H, Random, 95% CI) | 0.0 [0.0, 0.0] | |
| 17.7 Complementary health care | 1 | Risk Ratio (M‐H, Random, 95% CI) | 0.0 [0.0, 0.0] | |
| 17.8 Other health/social services | 1 | Risk Ratio (M‐H, Random, 95% CI) | 0.0 [0.0, 0.0] | |
| 17.9 Standardised medical care | 1 | Risk Ratio (M‐H, Random, 95% CI) | 0.0 [0.0, 0.0] | |
| 18 Drop‐out Show forest plot | 6 | 843 | Risk Ratio (M‐H, Random, 95% CI) | 1.63 [0.77, 3.43] |
| 19 Subgroup analysis for fatigue Show forest plot | 7 | 840 | Std. Mean Difference (IV, Random, 95% CI) | ‐0.68 [‐1.02, ‐0.35] |
| 19.1 Graded exercise therapy | 6 | 779 | Std. Mean Difference (IV, Random, 95% CI) | ‐0.71 [‐1.09, ‐0.32] |
| 19.2 Exercise with self‐pacing | 1 | 61 | Std. Mean Difference (IV, Random, 95% CI) | ‐0.54 [‐1.05, ‐0.02] |
| Outcome or subgroup title | No. of studies | No. of participants | Statistical method | Effect size |
| 1 Fatigue at end of treatment (FS; 11 items/0 to 33 points) Show forest plot | 2 | Mean Difference (IV, Random, 95% CI) | Totals not selected | |
| 1.1 CBT | 1 | Mean Difference (IV, Random, 95% CI) | 0.0 [0.0, 0.0] | |
| 1.2 Supportive listening | 1 | Mean Difference (IV, Random, 95% CI) | 0.0 [0.0, 0.0] | |
| 2 Fatigue at follow‐up (FSS; 1 to 7 points) Show forest plot | 1 | Mean Difference (IV, Random, 95% CI) | Totals not selected | |
| 2.1 CT | 1 | Mean Difference (IV, Random, 95% CI) | 0.0 [0.0, 0.0] | |
| 2.2 CBT | 1 | Mean Difference (IV, Random, 95% CI) | 0.0 [0.0, 0.0] | |
| 3 Fatigue at follow‐up (FS; 11 items/0 to 33 points) Show forest plot | 2 | Mean Difference (IV, Random, 95% CI) | Totals not selected | |
| 3.1 CBT | 1 | Mean Difference (IV, Random, 95% CI) | 0.0 [0.0, 0.0] | |
| 3.2 Supportive listening | 1 | Mean Difference (IV, Random, 95% CI) | 0.0 [0.0, 0.0] | |
| 4 Participants with serious adverse reactions Show forest plot | 2 | Risk Ratio (M‐H, Random, 95% CI) | Totals not selected | |
| 4.1 CBT | 1 | Risk Ratio (M‐H, Random, 95% CI) | 0.0 [0.0, 0.0] | |
| 4.2 Suportive listening | 1 | Risk Ratio (M‐H, Random, 95% CI) | 0.0 [0.0, 0.0] | |
| 5 Pain at follow‐up (BPI, pain severity subscale; 0 to 10 points) Show forest plot | 1 | Mean Difference (IV, Random, 95% CI) | Totals not selected | |
| 5.1 CBT | 1 | Mean Difference (IV, Random, 95% CI) | 0.0 [0.0, 0.0] | |
| 5.2 CT | 1 | Mean Difference (IV, Random, 95% CI) | 0.0 [0.0, 0.0] | |
| 6 Pain at follow‐up (BPI, pain interference subscale; 0 to 10 points) Show forest plot | 1 | Mean Difference (IV, Random, 95% CI) | Totals not selected | |
| 6.1 CBT | 1 | Mean Difference (IV, Random, 95% CI) | 0.0 [0.0, 0.0] | |
| 6.2 CT | 1 | Mean Difference (IV, Random, 95% CI) | 0.0 [0.0, 0.0] | |
| 7 Physical functioning at end of treatment (SF‐36, physical functioning subscale; 0 to 100 points) Show forest plot | 2 | Mean Difference (IV, Random, 95% CI) | Totals not selected | |
| 7.1 CBT | 1 | Mean Difference (IV, Random, 95% CI) | 0.0 [0.0, 0.0] | |
| 7.2 Supportive listening | 1 | Mean Difference (IV, Random, 95% CI) | 0.0 [0.0, 0.0] | |
| 8 Physical functioning at follow‐up (SF‐36, physical functioning subscale; 0 to 100 points) Show forest plot | 3 | Mean Difference (IV, Random, 95% CI) | Subtotals only | |
| 8.1 CBT | 2 | 348 | Mean Difference (IV, Random, 95% CI) | 7.92 [‐9.79, 25.63] |
| 8.2 CT | 1 | 47 | Mean Difference (IV, Random, 95% CI) | 21.37 [6.61, 36.13] |
| 8.3 Supportive listening | 1 | 171 | Mean Difference (IV, Random, 95% CI) | ‐7.55 [‐15.57, 0.47] |
| 9 Depression at end of treatment (HADS depression score; 7 items/21 points) Show forest plot | 1 | Mean Difference (IV, Random, 95% CI) | Totals not selected | |
| 9.1 Supportive listening | 1 | Mean Difference (IV, Random, 95% CI) | 0.0 [0.0, 0.0] | |
| 10 Depression at follow‐up (BDI; 0 to 63 points) Show forest plot | 1 | Mean Difference (IV, Random, 95% CI) | Totals not selected | |
| 10.1 CT | 1 | Mean Difference (IV, Random, 95% CI) | 0.0 [0.0, 0.0] | |
| 10.2 CBT | 1 | Mean Difference (IV, Random, 95% CI) | 0.0 [0.0, 0.0] | |
| 11 Depression at follow‐up (HADS depression score; 7 items/21 points) Show forest plot | 2 | Mean Difference (IV, Random, 95% CI) | Totals not selected | |
| 11.1 CBT | 1 | Mean Difference (IV, Random, 95% CI) | 0.0 [0.0, 0.0] | |
| 11.2 Supportive listening | 1 | Mean Difference (IV, Random, 95% CI) | 0.0 [0.0, 0.0] | |
| 12 Anxiety at end of treatment (HADS anxiety; 7 items/21 points) Show forest plot | 1 | Mean Difference (IV, Random, 95% CI) | Totals not selected | |
| 12.1 Supportive listening | 1 | Mean Difference (IV, Random, 95% CI) | 0.0 [0.0, 0.0] | |
| 13 Anxiety at follow‐up (BAI; 0 to 63 points) Show forest plot | 1 | Mean Difference (IV, Random, 95% CI) | Totals not selected | |
| 13.1 CT | 1 | Mean Difference (IV, Random, 95% CI) | 0.0 [0.0, 0.0] | |
| 13.2 CBT | 1 | Mean Difference (IV, Random, 95% CI) | 0.0 [0.0, 0.0] | |
| 14 Anxiety at follow‐up (HADS anxiety; 7 items/21 points) Show forest plot | 2 | Mean Difference (IV, Random, 95% CI) | Totals not selected | |
| 14.1 CBT | 1 | Mean Difference (IV, Random, 95% CI) | 0.0 [0.0, 0.0] | |
| 14.2 Supportive listening | 1 | Mean Difference (IV, Random, 95% CI) | 0.0 [0.0, 0.0] | |
| 15 Sleep at end of treatment (Jenkins Sleep Scale; 0 to 20 points) Show forest plot | 1 | Mean Difference (IV, Random, 95% CI) | Totals not selected | |
| 15.1 Supportive listening | 1 | Mean Difference (IV, Random, 95% CI) | 0.0 [0.0, 0.0] | |
| 16 Sleep at follow‐up (Jenkins Sleep Scale; 0 to 20 points) Show forest plot | 2 | Mean Difference (IV, Random, 95% CI) | Totals not selected | |
| 16.1 CBT | 1 | Mean Difference (IV, Random, 95% CI) | 0.0 [0.0, 0.0] | |
| 16.2 Supportive listening | 1 | Mean Difference (IV, Random, 95% CI) | 0.0 [0.0, 0.0] | |
| 17 Self‐perceived changes in overall health at end of treatment Show forest plot | 1 | Risk Ratio (M‐H, Random, 95% CI) | Totals not selected | |
| 17.1 CBT | 1 | Risk Ratio (M‐H, Random, 95% CI) | 0.0 [0.0, 0.0] | |
| 18 Self‐perceived changes in overall health at follow‐up Show forest plot | 2 | Risk Ratio (M‐H, Random, 95% CI) | Subtotals only | |
| 18.1 CT | 1 | 50 | Risk Ratio (M‐H, Random, 95% CI) | 0.63 [0.36, 1.10] |
| 18.2 CBT | 2 | 368 | Risk Ratio (M‐H, Random, 95% CI) | 0.71 [0.33, 1.54] |
| 19 Health resource use (follow‐up) [Mean no. of contacts] Show forest plot | 1 | Mean Difference (IV, Random, 95% CI) | Totals not selected | |
| 19.1 Primary care | 1 | Mean Difference (IV, Random, 95% CI) | 0.0 [0.0, 0.0] | |
| 19.2 Other doctor | 1 | Mean Difference (IV, Random, 95% CI) | 0.0 [0.0, 0.0] | |
| 19.3 Healthcare professional | 1 | Mean Difference (IV, Random, 95% CI) | 0.0 [0.0, 0.0] | |
| 19.4 Inpatient | 1 | Mean Difference (IV, Random, 95% CI) | 0.0 [0.0, 0.0] | |
| 19.5 Accident and emergency | 1 | Mean Difference (IV, Random, 95% CI) | 0.0 [0.0, 0.0] | |
| 19.6 Other health/social services | 1 | Mean Difference (IV, Random, 95% CI) | 0.0 [0.0, 0.0] | |
| 19.7 Complementary health care | 1 | Mean Difference (IV, Random, 95% CI) | 0.0 [0.0, 0.0] | |
| 19.8 Standardised medical care | 1 | Mean Difference (IV, Random, 95% CI) | 0.0 [0.0, 0.0] | |
| 20 Health resource use (follow‐up) [No. of users] Show forest plot | 1 | Risk Ratio (M‐H, Random, 95% CI) | Totals not selected | |
| 20.1 Primary care | 1 | Risk Ratio (M‐H, Random, 95% CI) | 0.0 [0.0, 0.0] | |
| 20.2 Other doctor | 1 | Risk Ratio (M‐H, Random, 95% CI) | 0.0 [0.0, 0.0] | |
| 20.3 Healthcare professional | 1 | Risk Ratio (M‐H, Random, 95% CI) | 0.0 [0.0, 0.0] | |
| 20.4 Inpatient | 1 | Risk Ratio (M‐H, Random, 95% CI) | 0.0 [0.0, 0.0] | |
| 20.5 Accident and emergency | 1 | Risk Ratio (M‐H, Random, 95% CI) | 0.0 [0.0, 0.0] | |
| 20.6 Medication | 1 | Risk Ratio (M‐H, Random, 95% CI) | 0.0 [0.0, 0.0] | |
| 20.7 Complementary health care | 1 | Risk Ratio (M‐H, Random, 95% CI) | 0.0 [0.0, 0.0] | |
| 20.8 Other health/social services | 1 | Risk Ratio (M‐H, Random, 95% CI) | 0.0 [0.0, 0.0] | |
| 20.9 Standardised medical care | 1 | Risk Ratio (M‐H, Random, 95% CI) | 0.0 [0.0, 0.0] | |
| 21 Drop‐out Show forest plot | 2 | Risk Ratio (M‐H, Random, 95% CI) | Totals not selected | |
| 21.1 CBT | 1 | Risk Ratio (M‐H, Random, 95% CI) | 0.0 [0.0, 0.0] | |
| 21.2 Supportive listening | 1 | Risk Ratio (M‐H, Random, 95% CI) | 0.0 [0.0, 0.0] | |
| Outcome or subgroup title | No. of studies | No. of participants | Statistical method | Effect size |
| 1 Fatigue Show forest plot | 1 | Mean Difference (IV, Random, 95% CI) | Totals not selected | |
| 1.1 Fatigue Scale, FS (11 items/33 points)—end of treatment | 1 | Mean Difference (IV, Random, 95% CI) | 0.0 [0.0, 0.0] | |
| 1.2 Fatigue Scale, FS (11 items/33 points)—follow‐up | 1 | Mean Difference (IV, Random, 95% CI) | 0.0 [0.0, 0.0] | |
| 2 Participants with serious adverse reactions Show forest plot | 1 | Risk Ratio (M‐H, Random, 95% CI) | Totals not selected | |
| 3 Physical functioning Show forest plot | 1 | Mean Difference (IV, Random, 95% CI) | Totals not selected | |
| 3.1 SF‐36, physical functioning subscale (0 to 100)—end of treatment | 1 | Mean Difference (IV, Random, 95% CI) | 0.0 [0.0, 0.0] | |
| 3.2 SF‐36, physical functioning subscale (0 to 100)—follow‐up | 1 | Mean Difference (IV, Random, 95% CI) | 0.0 [0.0, 0.0] | |
| 4 Depression Show forest plot | 1 | Mean Difference (IV, Random, 95% CI) | Totals not selected | |
| 4.1 HADS, depression score (7 items/21 points)—follow‐up | 1 | Mean Difference (IV, Random, 95% CI) | 0.0 [0.0, 0.0] | |
| 5 Anxiety Show forest plot | 1 | Mean Difference (IV, Random, 95% CI) | Totals not selected | |
| 5.1 HADS, anxiety score (0 to 21 points)—follow‐up | 1 | Mean Difference (IV, Random, 95% CI) | 0.0 [0.0, 0.0] | |
| 6 Sleep Show forest plot | 1 | Mean Difference (IV, Random, 95% CI) | Totals not selected | |
| 6.1 Jenkins Sleep Scale (0 to 20 points)—follow‐up | 1 | Mean Difference (IV, Random, 95% CI) | 0.0 [0.0, 0.0] | |
| 7 Self‐perceived changes in overall health Show forest plot | 1 | Risk Ratio (M‐H, Random, 95% CI) | Totals not selected | |
| 7.1 End of treatment | 1 | Risk Ratio (M‐H, Random, 95% CI) | 0.0 [0.0, 0.0] | |
| 7.2 Follow‐up | 1 | Risk Ratio (M‐H, Random, 95% CI) | 0.0 [0.0, 0.0] | |
| 8 Health resource use (follow‐up) [Mean no. of contacts] Show forest plot | 1 | Mean Difference (IV, Random, 95% CI) | Totals not selected | |
| 8.1 Primary care | 1 | Mean Difference (IV, Random, 95% CI) | 0.0 [0.0, 0.0] | |
| 8.2 Other doctor | 1 | Mean Difference (IV, Random, 95% CI) | 0.0 [0.0, 0.0] | |
| 8.3 Healthcare professional | 1 | Mean Difference (IV, Random, 95% CI) | 0.0 [0.0, 0.0] | |
| 8.4 Inpatient | 1 | Mean Difference (IV, Random, 95% CI) | 0.0 [0.0, 0.0] | |
| 8.5 Accident and emergency | 1 | Mean Difference (IV, Random, 95% CI) | 0.0 [0.0, 0.0] | |
| 8.6 Other health/social services | 1 | Mean Difference (IV, Random, 95% CI) | 0.0 [0.0, 0.0] | |
| 8.7 Complementary health care | 1 | Mean Difference (IV, Random, 95% CI) | 0.0 [0.0, 0.0] | |
| 8.8 Standardised medical care | 1 | Mean Difference (IV, Random, 95% CI) | 0.0 [0.0, 0.0] | |
| 9 Health resource use (follow‐up) [No. of users] Show forest plot | 1 | Risk Ratio (M‐H, Random, 95% CI) | Totals not selected | |
| 9.1 Primary care | 1 | Risk Ratio (M‐H, Random, 95% CI) | 0.0 [0.0, 0.0] | |
| 9.2 Other doctor | 1 | Risk Ratio (M‐H, Random, 95% CI) | 0.0 [0.0, 0.0] | |
| 9.3 Healthcare professional | 1 | Risk Ratio (M‐H, Random, 95% CI) | 0.0 [0.0, 0.0] | |
| 9.4 Inpatient | 1 | Risk Ratio (M‐H, Random, 95% CI) | 0.0 [0.0, 0.0] | |
| 9.5 Accident and emergency | 1 | Risk Ratio (M‐H, Random, 95% CI) | 0.0 [0.0, 0.0] | |
| 9.6 Medication | 1 | Risk Ratio (M‐H, Random, 95% CI) | 0.0 [0.0, 0.0] | |
| 9.7 Complementary health care | 1 | Risk Ratio (M‐H, Random, 95% CI) | 0.0 [0.0, 0.0] | |
| 9.8 Other health/social services | 1 | Risk Ratio (M‐H, Random, 95% CI) | 0.0 [0.0, 0.0] | |
| 9.9 Standardised medical care | 1 | Risk Ratio (M‐H, Random, 95% CI) | 0.0 [0.0, 0.0] | |
| 10 Drop‐out Show forest plot | 1 | Risk Ratio (M‐H, Random, 95% CI) | Totals not selected | |
| Outcome or subgroup title | No. of studies | No. of participants | Statistical method | Effect size |
| 1 Fatigue Show forest plot | 1 | Mean Difference (IV, Random, 95% CI) | Totals not selected | |
| 1.1 Fatigue Scale, FS (14 items/0 to 42 points)—end of treatment | 1 | Mean Difference (IV, Random, 95% CI) | 0.0 [0.0, 0.0] | |
| 2 Depression Show forest plot | 1 | Mean Difference (IV, Random, 95% CI) | Totals not selected | |
| 2.1 HADS, depression score (7 items/21 points)—end of treatment | 1 | Mean Difference (IV, Random, 95% CI) | 0.0 [0.0, 0.0] | |
| 3 Drop‐out Show forest plot | 1 | Risk Ratio (M‐H, Random, 95% CI) | Totals not selected | |