Tracción para el dolor lumbar con o sin ciática
Resumen
Antecedentes
La tracción se ha utilizado para tratar el dolor lumbar (DL), a menudo en combinación con otros tratamientos. Se incluyó tanto la tracción manual como la mecánica en esta revisión. Ésta es una actualización de una revisión Cochrane publicada por primera vez en 1995 y actualizada previamente en 2006.
Objetivos
Evaluar los efectos de la tracción en comparación con el placebo, la tracción simulada, los tratamientos de referencia y la ausencia de tratamiento en pacientes con DL.
Métodos de búsqueda
Se realizaron búsquedas en el Registro Especializado del Grupo Cochrane de la Espalda (Cochrane Back Review Group), en el Registro Cochrane Central de Ensayos Controlados (Cochrane Central Register of Controlled Trials) (2012, número 8), en MEDLINE (enero de 2006 hasta agosto de 2012), en EMBASE (enero de 2006 hasta agosto de 2012), en CINAHL (enero de 2006 hasta agosto de 2012) y en las listas de referencias de artículos y archivos personales. Los autores de la revisión no tienen conocimiento de ningún nuevo ensayo controlado aleatorizado (ECA) importante sobre este tema desde la fecha de la última búsqueda.
Criterios de selección
ECA con tracción para tratar el DL agudo (menos de cuatro semanas de duración), subagudo (cuatro a 12 semanas de duración) o crónico (más de 12 semanas de duración) inespecífico con o sin ciática.
Obtención y análisis de los datos
Dos autores de la revisión, de forma independiente, seleccionaron los estudios, evaluaron el riesgo de sesgo y extrajeron los datos. Como no había datos suficientes para el agrupamiento estadístico, se realizó un análisis descriptivo. No se encontraron series de casos que identificaran efectos adversos, por lo que se evaluaron los efectos adversos que se informaron en los estudios incluidos.
Resultados principales
Se incluyeron 32 ECA con 2762 participantes en esta revisión. Se consideró que 16 ensayos, que representan el 57% de todos los participantes, tienen un bajo riesgo de sesgo en base a la herramienta "Riesgo de sesgo" del Grupo Cochrane de la Espalda.
Para los pacientes con patrones de síntomas mixtos (DL agudo, subagudo y crónico con y sin ciática), hubo evidencia de calidad baja a moderada de que la tracción puede lograr poca o ninguna diferencia en la intensidad del dolor, el estado funcional, la mejoría global o la vuelta al trabajo en comparación con el placebo, la tracción simulada o la ausencia de tratamiento. Del mismo modo, al comparar la combinación de fisioterapia más tracción con la fisioterapia sola o al comparar la tracción con otros tratamientos, hubo evidencia de calidad muy baja a moderada de que la tracción puede lograr poca o ninguna diferencia en la intensidad del dolor, el estado funcional o la mejora global.
En el caso de pacientes con DL con ciática y dolor agudo, subagudo o crónico, hubo evidencia de baja a moderada calidad de que la tracción probablemente no tiene ningún impacto en la intensidad del dolor, el estado funcional o la mejora global. Esto fue así cuando se comparó la tracción con los controles y otros tratamientos, así como cuando la combinación de tracción más fisioterapia se comparó con la fisioterapia sola. Ningún estudio informó sobre el efecto de la tracción en la vuelta al trabajo.
Para el DL crónico sin ciática, hubo evidencia de calidad moderada de que la tracción probablemente logra poca o ninguna diferencia en la intensidad del dolor en comparación con el tratamiento simulado. Ningún estudio informó sobre el efecto de la tracción en el estado funcional, la mejora global o la vuelta al trabajo.
Se informó de efectos adversos en siete de los 32 estudios. Entre ellos, se incluyen el aumento del dolor, el agravamiento de los signos neurológicos y la cirugía posterior. Cuatro estudios informaron que no había efectos adversos. Los estudios restantes no mencionaron efectos adversos.
Conclusiones de los autores
Estos hallazgos indican que la tracción, ya sea sola o en combinación con otros tratamientos, tiene poco o ningún impacto en la intensidad del dolor, el estado funcional, la mejora global y la vuelta al trabajo entre los pacientes con DL. Sólo hay evidencia de calidad limitada procedentes de estudios con muestras de pequeño tamaño y riesgo de sesgo de moderado a alto. Los efectos que muestran estos estudios son pequeños y no son clínicamente relevantes.
Implicaciones para la práctica
Hasta la fecha, el uso de la tracción como tratamiento para el DL no específico no puede estar motivado por la mejor evidencia disponible. Estas conclusiones son aplicables tanto a la tracción manual como a la mecánica.
Implicaciones para la investigación
Sólo estudios nuevos, grandes y de alta calidad pueden cambiar la estimación puntual y su exactitud, pero cabe señalar que ese cambio no necesariamente favorece la tracción. Por consiguiente, debe darse poca prioridad a los nuevos estudios sobre el efecto del tratamiento de tracción, ya sea solo o como parte de un conjunto de intervenciones.
PICO
Resumen en términos sencillos
Tracción para el dolor lumbar
Se examinó la evidencia sobre el efecto de la tracción en la intensidad del dolor, la capacidad para realizar las actividades diarias normales, la mejoría general y la reincorporación al trabajo entre los pacientes con dolor lumbar (DL) en la fase aguda (menos de cuatro semanas de duración), subaguda (de cuatro a 12 semanas de duración) o crónica (más de 12 semanas de duración). Algunos pacientes también tenían ciática. Se examinaron los efectos de la tracción inmediatamente después de la sesión de tracción, a corto plazo (hasta tres meses después de la tracción) y a largo plazo (alrededor de un año después de la tracción).
El DL es un problema de salud importante en todo el mundo y es una de las principales causas de gastos médicos, ausentismo y discapacidad. Una opción de tratamiento para el DL que se ha utilizado durante miles de años es la tracción, la aplicación de una fuerza que separa dos huesos adyacentes entre sí para aumentar su espacio articular compartido. Se utilizan varios tipos de tracción, a menudo en combinación con otros tratamientos. Las técnicas de tracción más utilizadas son la tracción mecánica o motorizada (en la que la tracción es ejercida por una polea motorizada) y la tracción manual (en la que la tracción es ejercida por el terapeuta, utilizando su peso corporal para alterar la fuerza y la dirección de la tracción).
La evidencia está actualizada hasta agosto de 2012. La revisión incluyó 32 estudios y 2762 pacientes con DL. La mayoría de los estudios incluyeron una población similar de pacientes con DL con y sin ciática. La mayoría de los estudios incluyeron a pacientes con DL agudo, subagudo y crónico. La mayoría de los estudios informaron un seguimiento de una a 16 semanas, y un número limitado de estudios informó un seguimiento a largo plazo de seis meses a un año.
Los estudios incluidos muestran que la tracción como tratamiento único o en combinación con la fisioterapia no es más efectivo para el tratamiento del dolor lumbar que el tratamiento simulado (fingido), la fisioterapia sin tracción u otros métodos de tratamiento que incluyen el ejercicio, el láser, el ultrasonido y los corsés. Estas conclusiones son válidas para los pacientes con y sin ciática. No hubo diferencias en cuanto al tipo de tracción (manual o mecánica).
Se informaron efectos secundarios en siete de los 32 estudios, e incluyeron el aumento del dolor, el agravamiento de los signos neurológicos y la cirugía posterior. Cuatro estudios informaron de que no había efectos secundarios. Los estudios restantes no mencionaron efectos secundarios.
La calidad de la evidencia varió de muy baja a moderada. Hubo escasez de estudios de alta calidad, especialmente los que distinguían entre pacientes con diferentes patrones de síntomas (con y sin ciática, con dolor de diferente duración).
Authors' conclusions
Summary of findings
| Traction compared with placebo, sham or no treatment for people with low‐back pain with and without sciatica | |||
| Patient or population: people with low‐back pain with and without sciatica Settings: diverse Intervention: traction Comparison: placebo, sham or no treatment | |||
| Outcomes | Effects | No of Participants | Quality of the evidence |
| Pain intensity VAS (0‐100 mm). Follow‐up 12‐16 weeks. | 1 trial showed that there was no difference in pain intensity between the 2 groups (MD ‐4, 95% CI ‐17.7 to 9.7). | 60 (1) | ⊕⊕⊕⊝
Imprecision (< 400 participants) |
| Functional status Oswestry Disability Index or Roland Morris Disability Questionnaire. Follow‐up 12‐16 weeks. | Not measured. |
|
|
| Global improvement Follow‐up 12‐16 weeks. | 1 trial showed that there was no difference in global improvement between the 2 groups (RD 0.06, 95% CI ‐0.16 to 0.28). | 81 (1) | ⊕⊕⊕⊝
Imprecision (< 300 participants) |
| Return to work Follow‐up 12‐16 weeks. | Not measured. | ||
| Adverse effects | 1 trial reported aggravation of neurological signs in 28% of the traction group, 20% of the light traction group and 20% of the placebo group. | ||
| CI: confidence interval; MD: mean difference; RD: risk difference; VAS: visual analogue scale. | |||
| GRADE Working Group grades of evidence | |||
| Note. Each 'Summary of findings' table presents evidence for a specific comparison and a set of prespecified outcomes. Therefore, the information presented in the tables is limited by the comparisons and outcomes reported in the included studies. | |||
| Physiotherapy with traction compared with physiotherapy without traction for people with low‐back pain with and without sciatica | |||
| Patient or population: people with low‐back pain with and without sciatica Settings: physical medicine and rehabilitation outpatient clinic of a larger hospital Intervention: physiotherapy with traction Comparison: physiotherapy without traction | |||
| Outcomes | Effects | No of Participants | Quality of the evidence |
| Pain intensity VAS (0‐100 mm). Follow‐up 12‐16 weeks. | 1 trial showed that there was no difference in pain intensity between the 2 groups (MD 5, 95% CI ‐5.7 to 15.7) in favour of the control group. | 39 (1) | ⊕⊕⊝⊝
Study design (high risk of bias) Imprecision (< 400 participants) |
| Functional status Oswestry Disability Index or Roland Morris Disability Questionnaire. Follow‐up 12‐16 weeks. | 2 trials showed that there was no difference in functional status between the 2 groups (SMD from 0.36 (95% CI ‐0.27 to 1.00) to 0.43 (95% CI ‐0.30 to 1.16)). | 69 (2) | ⊕⊕⊝⊝
Study design (high risk of bias) Imprecision (< 400 participants) |
| Global improvement Follow‐up 12‐16 weeks. | 1 trial showed no difference in global improvement, another trial did show a clinically significant difference in global improvement (RD 0.53, 95% CI 0.28 to 0.79). | 220 (2) | ⊕⊕⊝⊝
Study design (high risk of bias) Imprecision (< 300 participants) |
| Return to work Follow‐up 12‐16 weeks. | Not measured. |
|
|
| Adverse effects | 1 study reported that 25% of the physiotherapy with traction group and 37% of the physiotherapy without traction group felt worse at 3 months' follow‐up. |
|
|
| CI: confidence interval; MD: mean difference; RD: risk difference. | |||
| GRADE Working Group grades of evidence | |||
| Traction compared with another type of traction for people with low‐back pain with and without sciatica | |||
| Patient or population: people with low‐back pain with and without sciatica Settings: diverse Intervention: traction Comparison: another type of traction | |||
| Outcomes | Effects | No of Participants | Quality of the evidence |
| Pain intensity VAS (0‐100 mm). Follow‐up 12‐16 weeks. | Not measured. | ||
| Functional status Oswestry Disability Index or Roland Morris Disability Questionnaire. Follow‐up 12‐16 weeks. | Not measured. |
|
|
| Global improvement Follow‐up 12‐16 weeks. | Not measured. |
|
|
| Return to work Follow‐up 12‐16 weeks. | Not measured. |
|
|
| Adverse effects | 1 trial reported increased pain in 31% of the static traction group and 15% of the intermittent traction group. |
|
|
| VAS: visual analogue scale. | |||
| GRADE Working Group grades of evidence | |||
| Traction compared with any other treatment for people with low‐back pain with and without sciatica | |||
| Patient or population: people with low‐back pain with and without sciatica Settings: diverse Intervention: traction Comparison: other treatment | |||
| Outcomes | Effects | No of participants | Quality of the evidence |
| Pain intensity VAS (0‐100 mm). Follow‐up 12‐16 weeks. | 3 trials, of which 1 compared traction with 2 other types of treatment, showed no difference greater than 5 points on the VAS scale between the 2 groups (MD ‐2.90 (95% CI ‐8.53 to 2.93) to 4.50 (95% CI ‐0.45 to 9.45). | 304 (3) | ⊕⊕⊕⊝
Imprecision (< 400 participants) |
| Functional status Oswestry Disability Index or Roland Morris Disability Questionnaire. Follow‐up 12‐16 weeks. | 3 trials, of which 1 compared traction to 2 other types of treatment and used 2 types of questionnaires to assess functional status, showed no difference between the 2 groups (SMD ‐0.08 (95% CI ‐0.39 to 0.23) to 0.51 (95% CI ‐0.12 to 1.14)). | 350 (3) | ⊕⊕⊕⊝
Imprecision (< 400 participants) |
| Global improvement Follow‐up 12‐16 weeks. | 1 trial showed no difference in global improvement (RD 0.05, 95% CI ‐0.1 to 0.2). | 42 (1) | ⊕⊕⊝⊝
Study design (high risk of bias) Imprecision (< 300 participants) |
| Return to work Follow‐up 12‐16 weeks. | Not measured. | ||
| Adverse effects | 1 trial reported temporary deterioration of low‐back pain in 17% of the traction group and 15% of the exercise group. | ||
| MD: mean difference; RD: risk difference; SMD: standardized mean difference. | |||
| GRADE Working Group grades of evidence | |||
Background
Description of the condition
Low‐back pain (LBP) is a major health problem around the world and a major cause of medical expenses, absenteeism and disability (Dagenais 2008; Lambeek 2011; Vos 2012). Although LBP is usually a self limiting and benign condition that tends to improve spontaneously over time, a large variety of therapeutic interventions is available for treatment (Chou 2007). Sciatica can result when the nerve roots in the lower spine are irritated or compressed. Most often, sciatica is caused when the L5 or S1 nerve root in the lower spine is irritated by a herniated disc. Degenerative disc disease may irritate the nerve root and cause sciatica, as can mechanical compression of the sciatic nerve, such as from spondylolisthesis, spinal stenosis or arthritis in the spine. For the purposes of this review, we define sciatica as pain radiating down the leg(s) along the distribution of the sciatic nerve (which is usually related to mechanical pressure, inflammation of lumbosacral nerve roots or both) (Bigos 1994).
Description of the intervention
One treatment for LBP and sciatica is traction, which has been used for thousands of years. It is used relatively frequently in North America (e.g. up to 30% of people with acute LBP and sciatica in Ontario, Canada) (Li 2001), and to a lesser extent in the UK, Ireland and the Netherlands (Harte 2005). Traction is often provided in combination with other treatment modalities (Harte 2005). The most commonly used traction techniques are mechanical or motorized traction (where the traction is exerted by a motorized pulley), manual traction (in which the traction is exerted by the therapist, using his or her body weight to alter the force and direction of the pull), and auto‐traction (where the person controls the traction forces by grasping and pulling bars at the head of the traction table). There are also less common forms, such as underwater (where the person is fixed perpendicularly in a deep pool, a bar is grasped under the arms and traction is applied), and gravitational traction (e.g. bed rest traction, in which the person is fixed to a tilted table or bed, and inverted traction, where the participant is held in an inverted position by the ankles and another part of the lower extremities and gravity provides the force).
Lumbar traction uses a harness (with Velcro strapping) that is fitted around the lower rib cage and around the iliac crest. Duration and level of force exerted through this harness can be varied in a continuous or intermittent mode. The force can be standardized only in motorized traction or in methods using computer technology. With other techniques, total body weight and the strength of the person or therapist determine the forces exerted. In the application of traction force, consideration must be given to counter forces such as lumbar muscle tension, lumbar skin stretch and abdominal pressure, which depend on the participant's physical constitution. If the person is lying on the traction table, the friction of the body on the table or bed provides the main counter force during traction.
How the intervention might work
The exact mechanism through which traction might be effective is unclear. It has been suggested that spinal elongation, by decreasing lordosis and increasing intervertebral space, inhibits nociceptive impulses, improves mobility, decreases mechanical stress, reduces muscle spasm or spinal nerve root compression (due to osteophytes), releases luxation of a disc or capsule from the zygo‐apophysial joint, and releases adhesions around the zygo‐apophysial joint and the annulus fibrosus.
A more recent rationale, adapted to available neurophysiological research, suggests that stimulation of proprioceptive receptors in the vertebral ligaments and in the mono segmental muscles may modify and halt what is being conceptualized as a 'dysfunction'. Dysfunction is a relatively generalized disturbance involving higher cerebral centres as well as peripheral structures for postural control. The dysfunction involves self maintaining pain‐provoking neuromuscular reflex patterns. In relation to benefits of traction, this rationale involves the 'shocking' of dysfunctional higher centres by means of relaying 'unphysiological' proprioceptive information centrally, and thus 'resetting' the dysfunction (Blomberg 2005). So far, none of the proposed mechanisms has been supported by sufficient empirical information.
Little is known about the adverse effects of traction. Only a few case reports are available, which suggest that there is some danger for nerve impingement in heavy traction (i.e. lumbar traction forces exceeding 50% of the total body weight). Other risks described for lumbar traction are respiratory constraints due to the traction harness or increased blood pressure during inverted positional traction. There is some debate about the effect of low traction forces. Beurskens 1997 says that a certain amount of force is required to achieve separation of the vertebra and widening of the intervertebral foramina. Forces below 20% of the participants' body weight do not achieve this goal and, therefore, can be considered to constitute a placebo or sham traction. Other reports say that these forces can still be expected to produce positive results, as even low traction forces can produce intervertebral separation due to flattening of lumbar lordosis, and relaxation of spinal muscles (Harte 2003; Krause 2000).
Why it is important to do this review
This systematic review updates our previous Cochrane review (Clarke 2006a). The 2006 review included 25 randomized controlled trials (RCTs) and was an update of a previous review of the effectiveness of traction for back and neck pain (Van der Heijden 1995). The previous review stated that traction was not likely to be effective for people with and without sciatica, due to inconsistent results and methodological problems in most studies. This update integrated new literature on the subject and was performed using the latest methods.
Objectives
The objective of this systematic review was to determine if traction was more effective than reference treatments, placebo, sham traction or no treatment for LBP with or without sciatica, with a focus on pain intensity, functional status, global improvement and return to work.
Methods
Criteria for considering studies for this review
Types of studies
We included only RCTs.
Types of participants
We included RCTs involving the following types of participants: male or female; aged 18 years or older; treated for LBP; in the acute, subacute or chronic phases, with or without sciatica. We excluded studies involving people with LBP due to specific causes (e.g. tumour, metastasis, fracture, inflammation, osteoporosis, rheumatoid arthritis).
Types of interventions
We included RCTs using any type of traction, such as mechanical traction, manual traction (unspecific or segmental traction), computerized traction, auto‐traction, underwater traction, bed rest traction, inverted traction, continuous traction and intermittent traction. Additional treatment was allowed, provided that traction was the main contrast between the intervention and control groups. We included studies with any type of control group (i.e. those that used placebo, sham, no treatment or other treatments).
Types of outcome measures
The four primary outcome measures that we considered to be the most important were pain intensity (e.g. measured by a visual analogue scale (VAS) or a numerical rating scale (NRS)), back‐pain‐specific functional status (e.g. measured by the Roland Morris Disability Questionnaire or Oswestry Disability Index (ODI)), a global measure of improvement (e.g. overall improvement, proportion of participants recovered, subjective improvement of symptoms) and return to work (e.g. measured by return to work status or days off work). We also considered reported adverse effects.
These outcomes could be measured immediately after the end of one traction session, immediately after a course of traction sessions, in the short‐term after the end of the traction sessions (up to three months), or in the long‐term (around one year).
Search methods for identification of studies
Electronic searches
We used the results of the literature search listed in Appendix 1, updating the three previous versions of this review (Clarke 2006a; Clarke 2006b; Van der Heijden 1995a). This included a computer‐aided search the Cochrane Back Review Group Specialized Register (August 2012), the Cochrane Central Register of Controlled Trials (2012 Issue 8), MEDLINE (January 2006 to August 2012), EMBASE (January 2006 to August 2012) and CINAHL (January 2006 to August 2012).
Searching other resources
Furthermore, we screened reference lists of relevant reviews and identified RCTs, as well as references in personal files of the review authors.
Data collection and analysis
In this review, we followed the guidelines of the Cochrane Back Review Group (Furlan 2009), and the Cochrane Handbook for Systematic Reviews of Interventions (Higgins 2011).
Selection of studies
Two review authors independently selected the trials to be included in the systematic review using title, abstract and keywords. The same two review authors independently applied the selection criteria to the studies that were retrieved by our literature search. We used consensus to resolve disagreements concerning selection and inclusion of RCTs. There was the option to consult a third review author if disagreement had persisted, although this was not necessary. We only evaluated full papers and excluded papers written in languages other than English, Dutch, German, French and Swedish.
Data extraction and management
Two review authors (IW and ISW) independently extracted the data (using a standardized form) considering the study population (e.g. number of participants, age, gender, type and duration of back pain), the interventions (type, intensity, and frequency of index and reference interventions) and the primary outcomes (type and duration of follow‐up). We used consensus to resolve disagreements and we would have consulted a third review author (GH) if disagreement persisted, although this was not necessary. We summarized key findings in a narrative format. We did not blind data extraction.
Assessment of risk of bias in included studies
We used the Cochrane Back Review Group's 'Risk of bias' tool to assess the risk of bias of the included RCTs (Furlan 2009). The 12 criteria are listed in Appendix 2. Studies included in the previous version of the review had not been assessed using this tool. Therefore, we re‐assessed these studies according to the updated methods. We could not obtain two articles (Lind 1974; Reust 1988) and two articles were written in a language that the review authors did not master (Bihaug 1978; Walker 1982). We transformed the previous risk of bias assessments of these four trials to the new format without re‐assessing them. As a result, supporting statements for the risk of bias assessments are missing for these studies. Two review authors (IW and ISW) independently assessed the methodological quality. Review authors resolved their initial discrepancies during discussion; the presented results are based on their full consensus. We did not blind quality assessment with regard to the authors, institution and journal. We did not contact study authors for additional information, because half the trials were published in the late 1990s. If the article did not contain the required information for the scoring of a specific item, we scored the item as 'unclear'.
We scored the criteria as 'low risk', 'high risk' or 'unclear risk', and reported them in the 'Risk of bias' table. We defined a study with a low risk of bias as one fulfilling six or more of the criteria and having no fatal flaws. In the previous review, a sensitivity analysis was performed in which six was considered the cut‐off point for low risk of bias. A second sensitivity analysis was performed in which half of items that had been scored 'unclear' in each trial were included as 'positive'. The same cut‐off point of six for low risk of bias is supported by empirical evidence (Van Tulder 2009).
Blinding of participants and care providers to treatment allocation is nearly impossible in trials of traction therapy. Given that some of the primary outcomes assessed in this review are subjective measures (i.e. pain and functional status), any attempt to blind the outcome assessor regarding these outcomes can be considered irrelevant. However, most studies also assessed objective outcome measures. If the care provider assessing those outcomes was blinded, the item was scored as 'low risk'.
Measures of treatment effect
We analyzed dichotomous outcomes by calculating the risk difference. We analyzed continuous outcomes by calculating the mean difference (MD) when the same instrument was used to measure outcomes, or the standardized mean difference (SMD) when different instruments were used to measure the outcomes. We converted VAS or NRS scales to a 100‐point scale. We expressed uncertainty using with 95% confidence intervals (CI).
We grouped outcomes by timing when they were measured: immediately after, short term and long term.
Unit of analysis issues
In several studies, we compared more than two intervention groups. We included these studies by making pair‐wise comparisons between all possible pairs of intervention groups with traction being one of the intervention groups. The same group of participants was included more than once in these examples (e.g. underwater traction versus underwater massage and underwater traction versus balneotherapy in the study performed by Konrad 1992). These participants were not counted twice in the meta‐analysis.
Dealing with missing data
In cases where data were reported as a median with an interquartile range (IQR), we assumed that the median was equivalent to the mean and the width of the IQR equivalent to 1.35 times the standard deviation in accordance with Cochrane Handbook for Systematic Reviews of Interventions, section 7.7.3.5 (Higgins 2011). If standard deviations were not given, we calculated them from the 95% CIs, P values based on a two‐sided t‐test or standard errors. We did not include data reported in graphs in this review.
Assessment of heterogeneity
We tested heterogeneity using the Chi2 test and I2 statistic; however, the decision regarding heterogeneity was dependent upon the I2 statistic (Higgins 2011). We defined substantial heterogeneity as an I2 greater than 50%, and where necessary, the effect of the interventions were synthesised narratively when the I2 statistic was greater than 50%.
Assessment of reporting biases
We searched ClinicalTrials.org and ISRCTN.org for the protocols of included studies. When protocols were available, we checked studies for selective outcome reporting.
Data synthesis
A quantitative analysis had been planned, but most of the studies did not provide sufficient data to enable statistical pooling (e.g. some trials reported the mean score but not the standard deviation, other trials reported median and IQR; some trials reported only post‐intervention means and other trials reported mean change scores; some trials did not report any numerical data. Therefore, we used a descriptive analysis to summarize the data. In this analysis, we used a rating system of levels of evidence to summarize the results of the studies in terms of the strength of the scientific evidence. To accomplish this, we used the GRADE approach, as recommended in the Cochrane Handbook for Systematic Reviews of Interventions (Higgins 2011), and adapted in the updated Cochrane Back Review Group method guidelines (Furlan 2009). The system consists of five levels of evidence, based on performance against five principal domains or factors:
-
high‐quality evidence ‐ consistent findings among at least 75% of RCTs with low risk of bias, consistent, direct and precise data and no known or suspected publication biases. Further research is unlikely to change either the estimate or our confidence of the results;
-
moderate‐quality evidence ‐ one of the domains is not met. Further research is likely to have an important impact on our confidence in the estimate of effect and may change the estimate;
-
low‐quality evidence ‐ two of the domains are not met. Further research is very likely to have an important impact on our confidence in the estimate of effect and is likely to change the estimate;
-
very‐low‐quality evidence ‐ three of the domains are not met. We are very uncertain about the results;
-
no evidence ‐ no RCTs were identified that addressed this outcome.
Factors that may decrease the quality of the evidence are: study design and risk of bias (downgraded when > 25% of the participants were from studies with a high risk of bias), inconsistency of results, indirectness (downgraded when > 50% of the participants were outside the target group), imprecision (downgraded when the total number of participants was less than 400 for continuous outcomes and 300 for dichotomous outcomes) and other factors (e.g. reporting bias).
Because the majority of studies contained a mix of participants with acute, subacute and chronic LBP, we did not separate out these groups in our analyses, other than in several trials involving only people with chronic LBP. We categorized studies as including people 'with sciatica' if more than66% of the participants were described as having sciatica (this may or may not have included those with nerve root symptoms) or if there was a separate analysis of outcomes in those with sciatica.
Clinical relevance
Two review authors independently carried out an analysis of the clinical relevance of each study. Without using an arbitrary predefined threshold, studies were judged as to whether: participants were described in enough detail to allow practitioners to decide whether they were similar to those in their practices; interventions and treatment settings were described well enough to allow practitioners to provide the same treatment for their participants; clinically relevant outcomes were measured and reported; the size of the effect; and the treatment benefits were worth the potential harms (see Table 1).
| Author | Participants | Interventions | Outcomes | Effect size | Benefits/harms |
| + | + | + | ‐ | ‐ | |
| + | + | + | ‐ | ‐ | |
| + | + | + | ‐ | ‐ | |
| + | ‐ | + | ‐ | ‐ | |
| + | + | + | ‐ | ‐ | |
| + | + | + | ‐ | ‐ | |
| + | + | + | ? | ‐ | |
| + | + | + | ‐ | ‐ | |
| + | ? | + | ‐ | ‐ | |
| + | + | + | ‐ | ‐ | |
| ‐ | + | + | ‐ | ‐ | |
| + | + | + | ? | ‐ | |
| + | + | + | + | + | |
| + | + | + | ‐ | ‐ | |
| + | + | + | ‐ | ‐ | |
| + | + | + | ‐ | ‐ | |
| + | + | + | ‐ | ‐ | |
| + | + | + | ‐ | ‐ | |
| + | + | + | ‐ | ‐ | |
| ‐ | + | + | ‐ | ‐ | |
| + | + | + | ‐ | ‐ | |
| + | + | + | + | ? | |
| + | + | + | ‐ | ‐ | |
| + | + | + | ‐ | ‐ | |
| + | + | + | ? | ‐ | |
| + | + | + | ‐ | ‐ | |
| + | + | + | ‐ | ‐ | |
| + | + | + | ‐ | ‐ | |
| ‐ | + | + | ‐ | ‐ | |
| Weber 1984 (1) | ‐ | + | + | ‐ | ‐ |
| Weber 1984 (2) | ‐ | + | + | ‐ | ‐ |
| + | + | + | ‐ | ‐ |
+: yes; ‐: no; ?: unknown.
Subgroup analysis and investigation of heterogeneity
Predefined subgroup analyses included:
-
different types of comparison (traction versus placebo, sham or no treatment; physiotherapy with traction versus physiotherapy without traction; different types of traction and traction versus other treatments);
-
different symptom patterns in subjects (mixed population of people with LBP with and without sciatica; people with LBP with sciatica and people with LBP without sciatica).
However, we were not able to conduct these analyses, because of reasons stated above. Instead, the results were synthesized narratively. 'Summary of findings' tables were generated for all analyses of different types of comparison. Primary outcome measures at a follow‐up duration of 12 to 16 weeks were included in the 'Summary of findings' tables.
Sensitivity analysis
In the previous review, sensitivity analyses were carried out to determine the cut‐off for high‐quality studies. The cut‐off point was set at six criteria for risk of bias, which is supported by empirical evidence (Van Tulder 2009). We considered that studies that met six or more of the criteria for risk of bias carried low risk of bias, whereas studies that met fewer than six of the criteria carried high risk of bias. We did not plan or carry out any new sensitivity analyses.
Results
Description of studies
See: Characteristics of included studies; Characteristics of excluded studies; Characteristics of studies awaiting classification; Characteristics of ongoing studies.
We identified 32 trials that fulfilled the inclusion criteria. Seven new trials were published since the publication of the previous review (Fritz 2007; Gudavalli 2006; Harte 2007; Ozturk 2006; Schimmel 2009; Simmerman 2011; Unlu 2008). We included all 25 trials discussed in the previous review in this review. The total number of studies retrieved by all search methods over time was not available. In this review, we included 32 studies, involving 2762 participants. Two of these studies were reported in one publication (Weber 1984); in four of the studies, there was more than one pertinent publication (Beurskens 1997; Gudavalli 2006; Mathews 1988; Van der Heijden 1995).
Presence of sciatica
Twenty‐three of the studies included a relatively homogeneous population of people with LBP and sciatica (Bihaug 1978; Coxhead 1981; Fritz 2007; Güvenol 2000; Harte 2007; Larsson 1980; Lidström 1970; Lind 1974; Ljunggren 1984; Ljunggren 1992; Mathews 1975; Mathews 1988; Ozturk 2006; Pal 1986; Reust 1988; Sherry 2001; Simmerman 2011; Sweetman 1993; Unlu 2008; Walker 1982; Weber 1973; two trials in Weber 1984). Eight studies included a greater mix of participants with and without sciatica (Beurskens 1997; Borman 2003; Gudavalli 2006; Konrad 1992; Letchuman 1993; Tesio 1993; Van der Heijden 1995; Werners 1999). There was only one study that exclusively involved people who did not have sciatica (Schimmel 2009).
Duration of low‐back pain
Ten studies included solely or primarily people with chronic LBP of more than 12 weeks (Borman 2003; Gudavalli 2006; Güvenol 2000; Ljunggren 1984; Schimmel 2009; Sherry 2001; Tesio 1993; Van der Heijden 1995; two in Weber 1984); in one study, participants were all in the subacute range (four to 12 weeks) (Konrad 1992); in 17 studies, the duration of LBP was a mixture of acute, subacute and chronic (Beurskens 1997; Bihaug 1978; Coxhead 1981; Fritz 2007; Harte 2007; Larsson 1980; Lidström 1970; Lind 1974; Ljunggren 1992; Mathews 1975; Mathews 1988; Ozturk 2006; Pal 1986; Simmerman 2011; Sweetman 1993; Unlu 2008; Walker 1982); in five studies duration was not specified (Letchuman 1993; Reust 1988; Weber 1973; and two in Weber 1984).
Comparisons
Thirteen studies compared traction with sham traction (Beurskens 1997; Letchuman 1993; Mathews 1975; Pal 1986; Reust 1988; Schimmel 2009; Van der Heijden 1995; Walker 1982; Weber 1973; and two in Weber 1984), with some kind of placebo (sham shortwave diathermy, Sweetman 1993; sham shortwave Lind 1974); or with no treatment (Konrad 1992). Fifteen studies compared traction with other treatments (Bihaug 1978; Coxhead 1981; Gudavalli 2006; Konrad 1992; Larsson 1980; Lidström 1970; Lind 1974; Ljunggren 1992; Mathews 1988; Sherry 2001; Simmerman 2011; Sweetman 1993; Unlu 2008; Werners 1999; Weber 1984). In one of these (Lind 1974), auto‐traction was compared with physiotherapy, in which Tru‐Trac traction was one of the range of treatments included. Five studies compared different types of traction (e.g. auto‐traction versus manual traction or passive traction, continuous versus intermittent traction, inversion traction versus conventional traction) (Güvenol 2000; Letchuman 1993; Ljunggren 1984; Reust 1988; Tesio 1993). Four studies compared a standard physiotherapy programme (not including traction) with the same treatment with traction (Borman 2003; Fritz 2007; Harte 2007; Ozturk 2006). One study compared different types of underwater therapy, underwater traction being one of them (Konrad 1992).
Length of follow‐up
Fourteen studies reported short‐term follow‐up (one week) (Fritz 2007; Gudavalli 2006; Harte 2007; Larsson 1980; Ljunggren 1984; Ljunggren 1992; Ozturk 2006; Pal 1986; Simmerman 2011; Sweetman 1993; Unlu 2008; Weber 1973; two in Weber 1984). Fifteen studies reported follow‐up at three to five weeks (Beurskens 1997; Bihaug 1978; Coxhead 1981; Fritz 2007; Konrad 1992; Lidström 1970; Lind 1974; Ljunggren 1984; Mathews 1975; Mathews 1988; Pal 1986, Reust 1988; Sherry 2001; Unlu 2008; Van der Heijden 1995). Fourteen studies reported follow‐up at nine to 16 weeks (Beurskens 1997; Bihaug 1978; Borman 2003; Coxhead 1981; Gudavalli 2006; Güvenol 2000; Harte 2007; Larsson 1980; Ljunggren 1984; Schimmel 2009; Tesio 1993; Unlu 2008; Van der Heijden 1995; Werners 1999). Five studies reported follow‐up at six months (Beurskens 1997; Gudavalli 2006; Harte 2007; Mathews 1988), or one year (Gudavalli 2006; Konrad 1992; Mathews 1988). One study did not report the timing at which the outcomes were measured (Walker 1982).
Risk of bias in included studies
See: Characteristics of included studies.
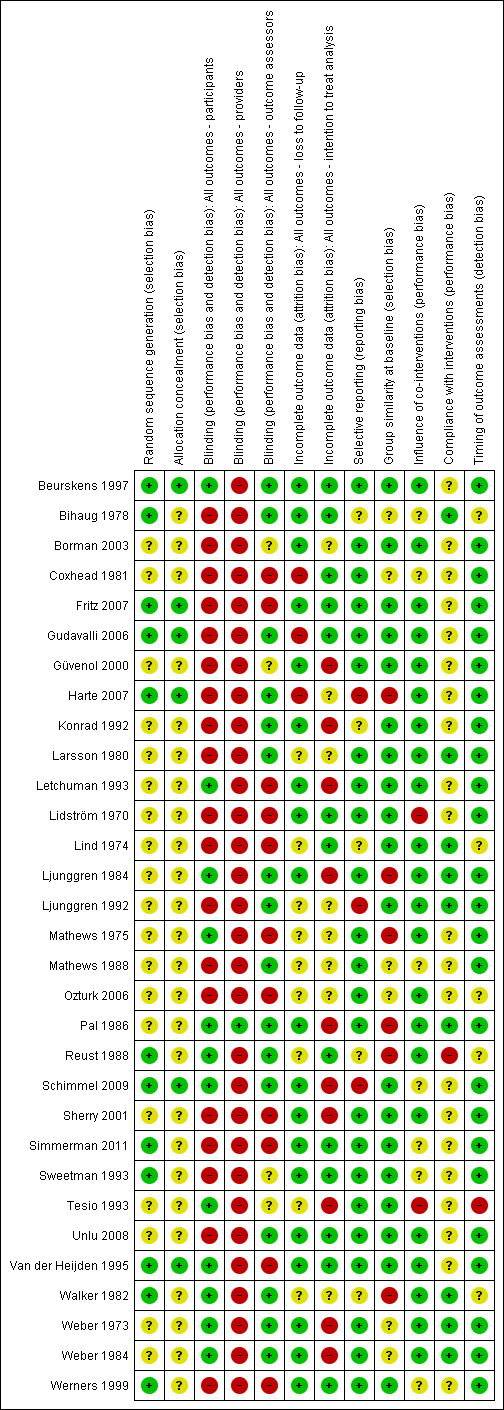
The results of the risk of bias analysis for the individual studies are summarized in Figure 1. Sixteen studies were considered to have a low risk of bias (Beurskens 1997; Fritz 2007; Gudavalli 2006; Larsson 1980; Letchuman 1993; Ljunggren 1984; Pal 1986; Schimmel 2009; Simmerman 2011; Sweetman 1993; Unlu 2008; Van der Heijden 1995; Weber 1973; both trials in Weber 1984; Werners 1999), representing 1568 (57%) participants. Overall, risk of bias scores ranged from two to 10 (maximum possible risk of bias score was 12). Some of the studies that were considered to have a low risk of bias based on the The Cochrane Collaboration's 'Risk of bias' tool were considered to have a high risk of bias in the previous review (Larsson 1980; Letchuman 1993; Ljunggren 1984; Pal 1986; Sweetman 1993; Weber 1973; Weber 1984). Overall completeness of data was assessed in this review, whereas previously, dropout during intervention and dropout during follow‐up were scored. Selective reporting and timing of outcome assessments were not assessed previously.

Risk of bias summary: review authors' judgements about each risk of bias item for each included study.
Allocation
The majority of the included studies did not properly report on their random and concealed allocation of treatment. In 20 of the included articles, there was no mention of the randomization procedure used and, in 26 of the included studies, it was unclear how concealment of treatment allocation was achieved. In six studies, both sequence generation and allocation procedure were conducted properly (Beurskens 1997; Fritz 2007; Gudavalli 2006; Harte 2007; Schimmel 2009; Van der Heijden 1991). In an additional six studies, the sequence generation was conducted properly, but the concealment of allocation was inadequately described (Bihaug 1978; Reust 1988; Simmerman 2011; Sweetman 1993; Walker 1982; Werners 1999). In the remaining studies, both randomization and allocation procedure were inadequately described or not mentioned at all. The authors claimed these studies were RCTs in the description of their methods and, therefore, these studies were included nevertheless.
Blinding
Blinding of outcomes was not achieved in the majority of the included studies. Blinding of the outcome assessor was achieved in 17 studies (Beurskens 1997; Bihaug 1978; Gudavalli 2006; Harte 2007; Konrad 1992; Larsson 1980; Ljunggren 1984; Ljunggren 1992; Mathews 1988; Pal 1986; Reust 1988; Schimmel 2009; Unlu 2008; Walker 1982; Weber 1973; both trials in Weber 1984), blinding of participants in 12 studies (Beurskens 1997; Letchuman 1993; Ljunggren 1984; Mathews 1975; Pal 1986; Reust 1988; Schimmel 2009; Tesio 1993; Van der Heijden 1995; Walker 1982; Weber 1973; Weber 1984), and blinding of care providers only in one study (Pal 1986). All of the studies that attempted to blind the participants to the assigned intervention did so by providing a sham treatment, with the exception of Tesio 1993. None of the studies evaluated the success of blinding post‐treatment. It should be noted that blinding of care providers of traction is impossible in most cases. It is disputable whether the outcome is likely to be influenced by a lack of blinding of care providers when it comes to assessing subjective measures such as pain intensity and functional status, as mentioned earlier. However, in the case of objective outcome measures, blinding is of importance.
Incomplete outcome data
In three studies, loss to follow‐up exceeded 20% of the study population (Coxhead 1981; Harte 2007), or significantly more subjects were lost to follow‐up in one treatment group compared the number of subjects that were lost to follow‐up in the other group (Gudavalli 2006). Loss to follow‐up never exceeded 23%. In nine of the included trials, it was not clear how many subjects were lost to follow‐up (Larsson 1980; Lind 1974; Ljunggren 1992; Mathews 1975; Mathews 1988; Ozturk 2006; Reust 1988; Tesio 1993; Walker 1982).
Selective reporting
None of the included RCTs had a published protocol in any of the protocol databases that were searched. The study's prespecified (primary and secondary) outcomes as reported in the article itself were compared with the reported outcomes. One study indicated that VAS scores, overall improvement and improvement in the straight leg raising test had been recorded at three and six months but did not report this (Harte 2007), while in another study, improvement in mobility, activities of daily living and the straight leg raising test were measured but not reported (Ljunggren 1992), and similarly for all outcome assessments at two and six weeks in another study (Schimmel 2009).
Other potential sources of bias
We identified no other potential sources of bias.
Effects of interventions
See: Summary of findings for the main comparison Traction compared with placebo, sham or no treatment for people with low‐back pain with and without sciatica; Summary of findings 2 Physiotherapy with traction compared with physiotherapy without traction for people with low‐back pain with and without sciatica; Summary of findings 3 Traction compared with another type of traction for people with low‐back pain with and without sciatica; Summary of findings 4 Traction compared with any other treatment for people with low‐back pain with and without sciatica
Section (1) of the results describes those studies in which a mixed group of people with LBP is involved, i.e., some with and some without sciatica. In section (2), the participant populations include only people with LBP with sciatica. Section (3) describes the studies that included only people with LBP without sciatica. Studies that included more than 66% of participants with sciatica were categorized as studies that included people with sciatica.
(1) Traction for a mixed group of people with low‐back pain, some with and some without sciatica
(1a) Traction versus placebo, sham or no treatment
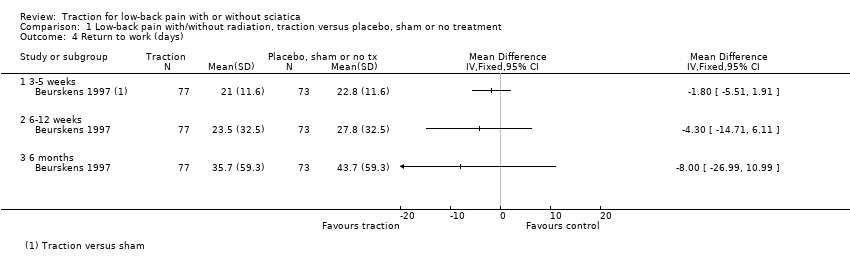
There was low‐quality evidence that decrease in pain intensity was greater in participants treated with traction at three to five weeks' follow‐up (MD 18.49 points on the VAS, 95% CI ‐24.12 to ‐12.87) (Beurskens 1997; Konrad 1992). However, the difference in pain intensity at one year' follow‐up had an MD of only 9 points on the VAS (95% CI ‐19.32 to 1.12), favouring traction (Konrad 1992). Moderate‐quality evidence indicated there was a small positive effect on functional status favouring the sham group at three to five weeks' follow‐up (1.3 points on the Roland Morris Disability Questionnaire (RMDQ), 95% CI ‐2.90 to 0.30) (Beurskens 1997). There was no difference in global improvement at three to five weeks (RD ‐0.03, 95% CI ‐0.17 to 0.12) (Beurskens 1997; Van der Heijden 1995), or at six to 12 weeks (RD 0.03, 95% CI ‐0.12 to 0.18) (Beurskens 1997; Van der Heijden 1995). Moderate‐quality evidence showed mean time to return to work in the traction group was two days earlier (Beurskens 1997).
(1b) Physiotherapy with traction versus physiotherapy without traction
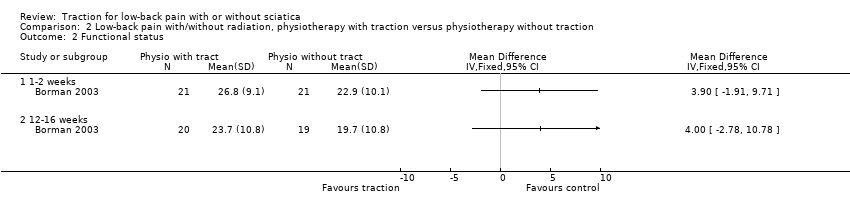
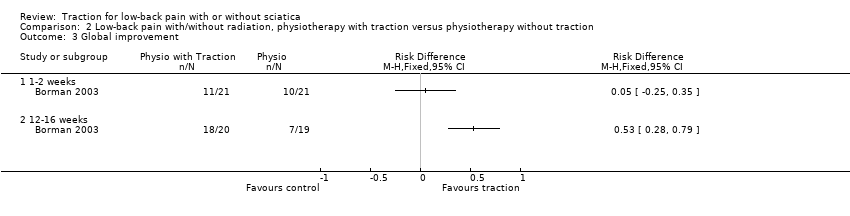
There was low‐quality evidence that there was no difference in pain intensity at one to two weeks' follow‐up between the two groups (Borman 2003). There was a small mean difference of 5 points on the VAS (95% CI ‐5.67 to 15.67) in favour of physiotherapy at 12 to 16 weeks' follow‐up (Borman 2003). Short‐term and long‐term functional status as measured by the ODI was better in the traction group than the physiotherapy group (short term mean points: 4, 95% CI ‐1.91 to 9.71; long term: 95% CI ‐2.78 to 10.78) (Borman 2003). There was low‐quality evidence that global improvement at one to two weeks' follow‐up was the same for both groups, whereas at 12 to 16 weeks' follow‐up, global improvement was higher in the traction group (RD 0.53, 95% CI 0.28 to 0.79) (Borman 2003).
(1c) Different types of traction
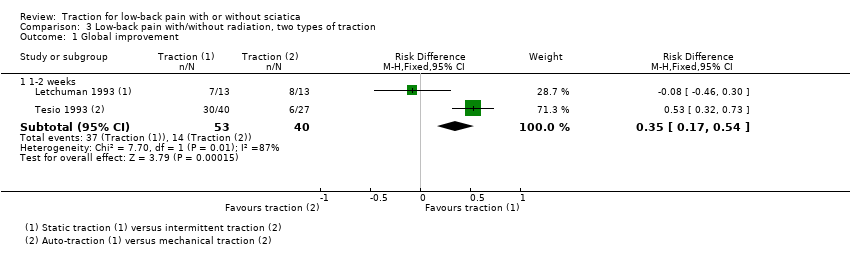
One study with very‐low‐quality evidence showed that there was no difference in global improvement between participants undergoing static traction and participants undergoing intermittent traction (Letchuman 1993). Global improvement was higher in participants undergoing auto‐traction than in participants undergoing mechanical traction (RD 0.53, 95% CI 0.32 to 0.73) (Tesio 1993). Outcomes on pain intensity and functional status were reported only for those participants responding to treatment.
(1d) Traction versus other treatments
Six studies compared traction with another treatment (Bihaug 1978; Gudavalli 2006; Konrad 1992; Lind 1974; Sweetman 1993; Werners 1999). Traction was compared with varying other treatments: physiotherapy, exercise, short‐wave diathermy, interferential therapy, bed rest and analgesics.
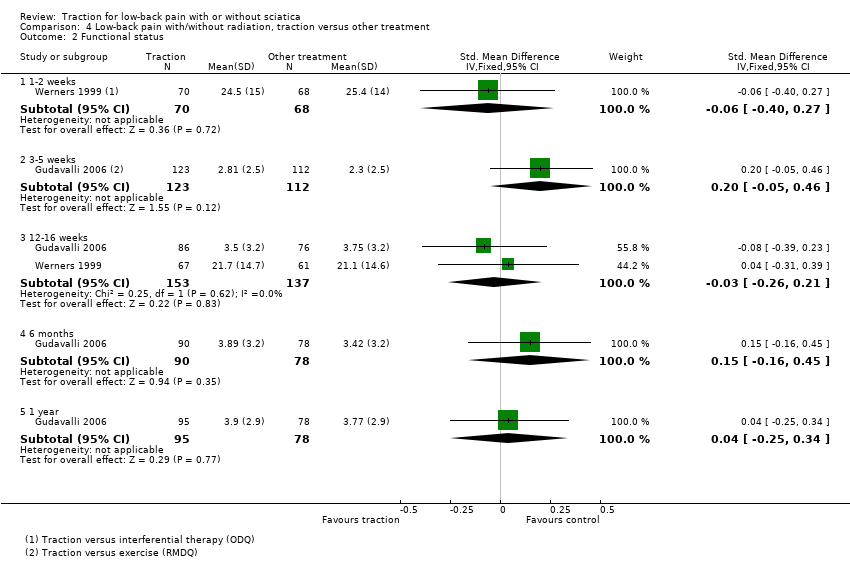
There was low‐ to moderate‐quality evidence that pain intensity was slightly lower in participants treated with traction in the short‐term and the long‐term (Gudavalli 2006; Konrad 1992; Sweetman 1993; Werners 1999). MDs varied from 1 to 8 points on the VAS with a follow‐up duration varying from one week to one year. Moderate‐quality evidence showed that functional status as measured by the ODI or RMDQ was the same for both groups at one to two weeks, 12 to 16 weeks and one year' follow‐up (Gudavalli 2006; Werners 1999). There was a small difference in favour of the control group at three to five weeks (MD 0.2, 95% CI ‐0.05 to 0.46) and at six months (0.15 points, 95% CI ‐0.16 to 0.45) (Gudavalli 2006). There was a very small difference in global improvement favouring traction at 12 to 16 weeks (Bihaug 1978) (RD 0.05, 95% CI ‐0.11 to 0.20), for which there was high‐quality evidence. The difference in global improvement at three to five weeks was much higher with an RD of 0.14 (95% CI ‐0.08 to 0.36) (Bihaug 1978) and 0.87 (95% CI 0.67 to 1.07) favouring traction (Lind 1974). However, the quality of evidence supporting this difference was very low.
(2) Traction for people with low‐back pain and sciatica
(2a) Traction versus placebo, sham or no treatment for people with a mix of acute, subacute and chronic low back pain with sciatica
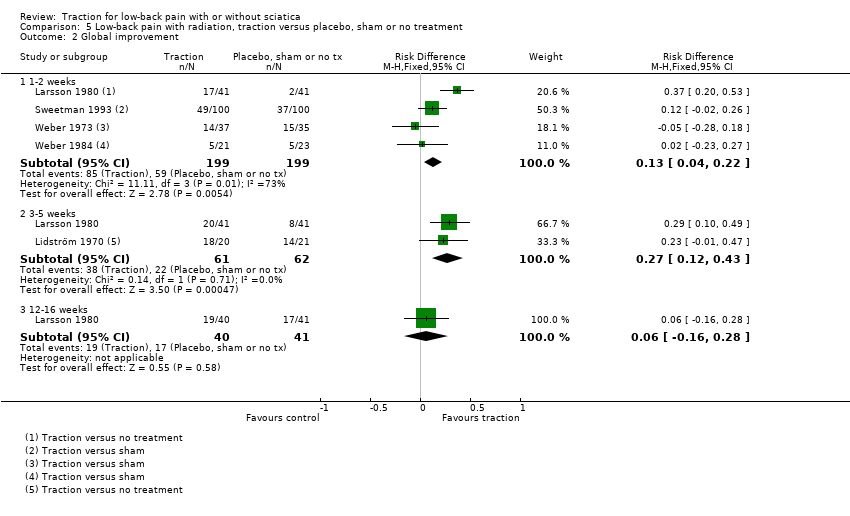
Low‐quality evidence suggested that there was a small effect on pain intensity in favour of the sham group (MD 2.93 points on the VAS scale, 95% CI ‐14.73 to 20.59) at one to two weeks' follow‐up (Pal 1986; Reust 1988), and at three to five weeks' follow‐up (Pal 1986). There was low‐ to moderate‐quality evidence that global improvement rates were higher in participants receiving traction at one to two weeks' follow‐up (RD 0.13, 95% CI 0.04 to 0.22) (Larsson 1980; Sweetman 1993; Weber 1973; Weber 1984), and three to five weeks' follow‐up (RD 0.27, 95% CI 0.12 to 0.43) (Larsson 1980; Lidström 1970). However, at 12 to 16 weeks' follow‐up, there was no significant difference in global improvement between the two groups (RD 0.06, 95% CI ‐0.16 to 0.28) (Larsson 1980). Moderate‐quality evidence suggested that more participants receiving traction returned to work compared with participants receiving sham treatment (RD 0.15, 95% CI ‐0.15 to 0.45) (Pal 1986).
(2b) Physiotherapy with traction versus physiotherapy without traction
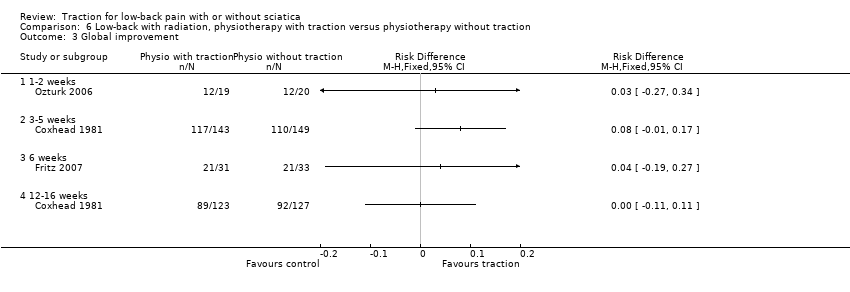
Although moderate‐quality evidence showed a lower mean pain intensity in the traction group (a difference of 7.96 points on the VAS, 95% CI ‐16.53 to 0.61) at one to two weeks' follow‐up (Fritz 2007; Ozturk 2006), the difference in mean pain intensity between the two groups was 2.00 points (95% CI ‐10.02 to 14.02) in favour of the physiotherapy group at six weeks' follow‐up (Fritz 2007). Functional status was measured by both the ODI and the RMDI. There was low‐ to moderate‐quality evidence that there was no difference in functional outcome at one to two weeks', six to 12 weeks', 12 to 16 weeks and six months' follow‐up (Fritz 2007; Harte 2007). Low‐ to moderate‐quality evidence showed no difference in global improvement at one to two weeks' (Ozturk 2006), three to five weeks' (Coxhead 1981), six weeks' (Fritz 2007) and 12 to 16 weeks' (Coxhead 1981) follow‐up.
(2c) Different types of traction
We found three RCTs that compared two types of traction and reported on pain intensity (Ljunggren 1984; Reust 1988; Simmerman 2011). Reust 1988 compared auto‐traction with mechanical traction. There was a small effect in favour of auto‐traction (2.9 points on the VAS, 95% CI ‐14.73 to 20.59). Simmerman 2011 compared aquatic traction to a land‐based supine position at one to two weeks' follow‐up. There was a small effect in favour of auto‐traction at one to two weeks' follow‐up (8 points on the VAS, 95% CI ‐3.02 to 19.02). One RCT was identified that compared two types of traction, auto‐traction versus manual traction, and reported on global improvement (Ljunggren 1984). There was a small effect in favour of manual traction at one to two weeks' follow‐up (RD ‐0.16, 95% CI ‐0.40 to 0.09).
Although one more RCT compared two types of traction (Güvenol 2000), this study only reported P values.
(2d) Traction versus other treatments
Three RCTs compared traction with other treatments and reported varying outcome measures (Lidström 1970; Ljunggren 1992; Unlu 2008). Traction was compared with physiotherapy, exercise, laser, ultrasound, manipulation and corset treatment.
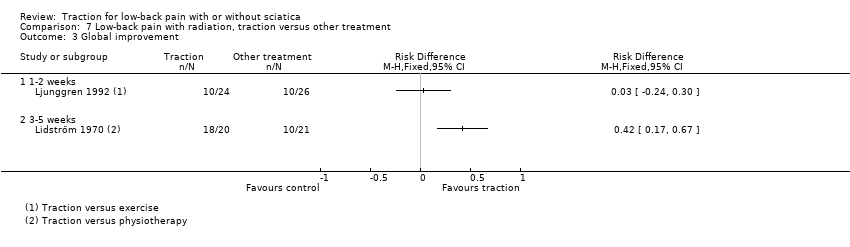
There was moderate‐quality evidence that mean pain intensity in the traction group was slightly lower at one to two weeks' follow‐up (Ljunggren 1992; Unlu 2008), and three to five weeks' follow‐up (Unlu 2008). The maximum MD in pain intensity was 4.9 points (95% CI ‐15.87 to 6.07) (Unlu 2008). However, at 12 to 16 weeks' follow‐up the mean pain intensity in the traction group was higher (maximum MD 4.4 points, 95% CI ‐5.40 to 14.20) (Unlu 2008). There was no difference in functional status measured by the ODI or RMDI between the two groups at one to two weeks', three to five weeks' and 12 to 16 weeks' follow‐up (Ljunggren 1992; Unlu 2008). There was low‐ to moderate‐quality evidence that there is only a very small difference in global improvement between the two groups at one to two weeks' follow‐up (RD 0.03, 95% CI ‐0.24 to 0.30) (Ljunggren 1992), and three to five weeks' follow‐up (RD 0.42, 95% CI 0.17 to 0.67) (Lidström 1970).
(3) Traction for people with low‐back pain and without sciatica
(3a) Traction versus sham treatment
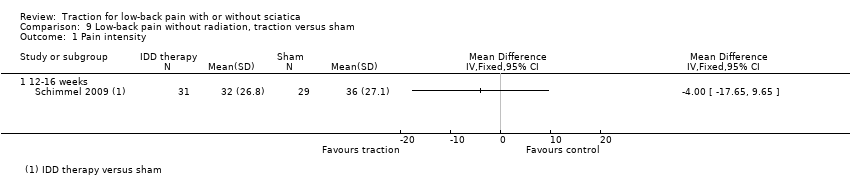
There was moderate‐quality evidence that there is a very small difference in pain intensity between the two groups, favouring the traction group by 4 points on the VAS (95% CI ‐17.65 to 9.65) (Schimmel 2009).
Adverse effects
Of the 32 studies, four stated that there were no adverse effects (Gudavalli 2006; Konrad 1992; Schimmel 2009; Walker 1982); seven studies reported some adverse effects, for example, increased pain in 11 of 14 inversion traction participants versus 2 of 13 conventional traction participants, and anxiety during treatment with "almost all of the inversion traction patients" (Güvenol 2000); increased pain in 31% of static traction group and 15% of intermittent traction group (Letchuman 1993); temporary deterioration in 4 of 24 of traction and 4 of 26 of exercise group (Ljunggren 1992); subsequent surgery in 7 of 83 in lumbar traction group versus none in control group (Mathews 1988); aggravation of neurological signs in 5 of 18 of traction group, 4 of 20 of light traction group and 4 of 20 of placebo group (Reust 1988); aggravation of symptoms in 5 of 43 of traction and 1 of 43 of sham (Weber 1973). Borman 2003 reported that 25% of the group receiving traction as part of standard physiotherapy and 37% of the physiotherapy without traction group felt "probably or definitely worse" at three‐month' follow‐up. The remaining 21 studies did not report adverse effects.
Discussion
Summary of main results
Many studies were identified on the effect of traction on pain intensity, functional status, global improvement and return to work in people with LBP. However, most evidence was imprecise and inconsistent and numerous studies carried substantial risk of bias. Many of the studies seemed to have sample sizes that were too small to detect a clinically significant difference. Furthermore, the heterogeneity in comparisons, outcomes and follow‐up durations prohibited us, among other reasons, from pooling the data and, therefore, we used a descriptive analysis in this review. The sample sizes per comparison mostly did not reach the threshold of 400 for continuous outcomes and 300 for dichotomous outcomes (Furlan 2009; Higgins 2011). Therefore, we put little trust in positive effects that emerged.
The included studies largely differed in their population, outcome measures, and scales and duration of follow‐up. Some studies included hospitalized participants with demonstrated herniated discs, neurological findings and sciatica, while other studies included people recruited from primary care or workers recruited through internal company newspapers. Some studies used the ODI, while others used the RMDI. Some studies reported on all four primary outcomes (pain intensity, functional status, global improvement and return to work), whereas others only reported on one or two, which might suggest publication bias.
The studies showed small differences in effects between traction and other treatment options on pain intensity, functional status, global improvement and return to work at short term. The effect was even smaller at longer‐term follow‐up. Mostly the MD between the two groups favours the traction group, but not always. For most of the outcomes, no effects of traction were shown and when they were, the effects were too small to be clinically relevant. The minimum important difference (between groups) in changes (within groups) for pain intensity and functional status established by Ostelo 2008 were used to judge clinical relevancy. A clinically relevant effect was achieved in pain intensity at three to five weeks' follow‐up in people with and without sciatica undergoing traction when compared with sham treatment (Konrad 1992). A clinically relevant difference in changes in global improvement was seen in people with and without sciatica undergoing physiotherapy with traction at 12 to 16 weeks' follow‐up (RD 0.53) (Borman 2003), and in global improvement in people with and without sciatica undergoing traction when compared to other treatments at 12 to 16 weeks (RD 0.57) (Bihaug 1978; Lind 1974). However, in all of these cases, the effects did not reach statistical significance and they were based on low‐ to very‐low‐quality evidence, which means that we are very uncertain about the findings. Studies with a high risk of bias typically overestimate the effect compared to studies with a low risk of bias (Van Tulder 2009).
Two articles examined the level of physical force applied in the treatment and concluded that even a low level of force may be effective (Harte 2003; Krause 2000). Beurskens 1997 maintained that traction at levels below 25% of body weight and using a split table can be regarded as sham (or low‐dose) traction, and the sham traction group in their trial received treatment involving a force of 10% to 20% of the participant's body weight. In the other trials that classified their control groups as 'sham traction', the force applied varied (e.g. less than 25% of body weight in Van der Heijden 1995; 10 lb (4.5 kg) in Letchuman 1993; 1.8 kg in Pal 1986; 5 kg in Reust 1988; and a maximum of 20 lb (9 kg) in Mathews 1975). No differences between traction and sham traction were demonstrated in any of these trials.
Overall completeness and applicability of evidence
We minimized review bias by performing an extensive database search. Publication bias could be an issue. The many small RCTs are more likely to be published when positive. Authors possibly may refrain from publishing when results are negative. However, the review authors consider that it is unlikely that large trials on the subject were not published. Many of the published studies did not have a published protocol and, therefore, it is difficult to ascertain to what extent studies did not publish their findings because the results did not prove to be favourable.
Quality of the evidence
Sixteen of the 32 included studies demonstrated a low risk of bias. Items that were scored predominantly negatively or unclear were randomization, concealment and blinding. The majority of the included studies did not properly report on their random and concealed allocation of treatment. In 20 of the included articles, there was no mention of the randomization procedure used and, in 26 of the included studies, it was unclear how concealment of treatment allocation was achieved. Blinding of outcomes was not achieved in the majority of the included studies. Blinding of the outcome assessor was achieved in 17 studies and blinding of participants in 12 studies. The latter reflects the number of trials in which sham or simulated traction was used. Blinding of the care provider is virtually impossible given the nature of the intervention. As a result, only one study achieved blinding of the care provider.
Furthermore, relatively few participants were identified for any of the principal outcome measurements and, as a result, none of the findings should be considered robust.
Potential biases in the review process
Although content area experts may have inside knowledge, may be familiar with current interests in their field and may be aware of pressing questions in their field, they may also have personal prejudices and idiosyncrasies. Experts with strong opinions may make it difficult to prevent bias (Gotzsche 2012). To harness bias in this review, two non‐experts (IW and ISW) in this area, trained in reviewing literature, were involved in writing this review. Data from previous reviews were verified, checked and changed where necessary by these two review authors.
Agreements and disagreements with other studies or reviews
In general, the results and conclusions of this updated review are consistent with the previous version of the review, namely that traction is no better than standard interventions for (acute, subacute and chronic) LBP. In this review, we discussed one high‐quality study that included only people without sciatica that was not included in the previous review (Schimmel 2009). This study showed that traction in people without sciatica is no better than sham treatment. There was no significant difference between the traction and sham group in pain intensity or functional status.
Our findings were consistent with those reported in other systematic reviews on the subject (Chou 2007; Gay 2008). One review concluded there was insufficient data to draw firm conclusions on the clinical effect of traction (Van Middelkoop 2011). Only one RCT discussing the effect of traction was included in this review.
Risk of bias summary: review authors' judgements about each risk of bias item for each included study.

Comparison 1 Low‐back pain with/without radiation, traction versus placebo, sham or no treatment, Outcome 1 Pain intensity.

Comparison 1 Low‐back pain with/without radiation, traction versus placebo, sham or no treatment, Outcome 2 Functional status.
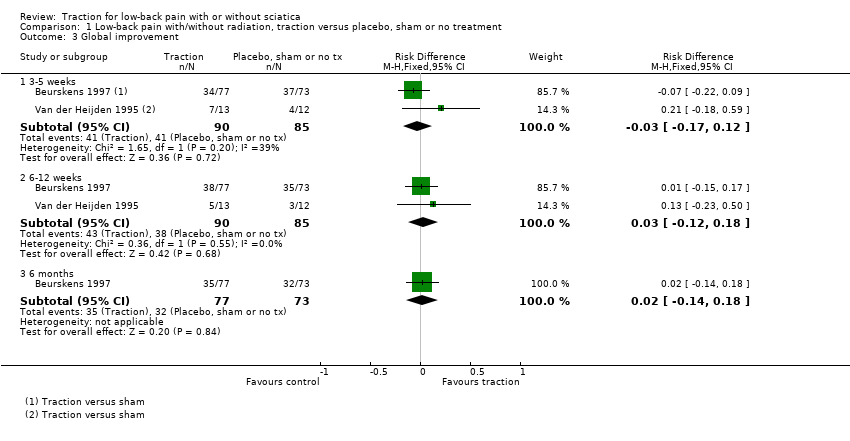
Comparison 1 Low‐back pain with/without radiation, traction versus placebo, sham or no treatment, Outcome 3 Global improvement.
Comparison 1 Low‐back pain with/without radiation, traction versus placebo, sham or no treatment, Outcome 4 Return to work (days).

Comparison 2 Low‐back pain with/without radiation, physiotherapy with traction versus physiotherapy without traction, Outcome 1 Pain intensity.
Comparison 2 Low‐back pain with/without radiation, physiotherapy with traction versus physiotherapy without traction, Outcome 2 Functional status.
Comparison 2 Low‐back pain with/without radiation, physiotherapy with traction versus physiotherapy without traction, Outcome 3 Global improvement.
Comparison 3 Low‐back pain with/without radiation, two types of traction, Outcome 1 Global improvement.

Comparison 4 Low‐back pain with/without radiation, traction versus other treatment, Outcome 1 Pain intensity.
Comparison 4 Low‐back pain with/without radiation, traction versus other treatment, Outcome 2 Functional status.

Comparison 4 Low‐back pain with/without radiation, traction versus other treatment, Outcome 3 Global improvement.

Comparison 5 Low‐back pain with radiation, traction versus placebo, sham or no treatment, Outcome 1 Pain intensity.
Comparison 5 Low‐back pain with radiation, traction versus placebo, sham or no treatment, Outcome 2 Global improvement.

Comparison 5 Low‐back pain with radiation, traction versus placebo, sham or no treatment, Outcome 3 Return to work.

Comparison 6 Low‐back with radiation, physiotherapy with traction versus physiotherapy without traction, Outcome 1 Pain intensity.

Comparison 6 Low‐back with radiation, physiotherapy with traction versus physiotherapy without traction, Outcome 2 Functional status.
Comparison 6 Low‐back with radiation, physiotherapy with traction versus physiotherapy without traction, Outcome 3 Global improvement.

Comparison 6 Low‐back with radiation, physiotherapy with traction versus physiotherapy without traction, Outcome 4 Return to work.

Comparison 7 Low‐back pain with radiation, traction versus other treatment, Outcome 1 Pain intensity.

Comparison 7 Low‐back pain with radiation, traction versus other treatment, Outcome 2 Functional status.
Comparison 7 Low‐back pain with radiation, traction versus other treatment, Outcome 3 Global improvement.

Comparison 8 Low‐back pain with radiation, two types of traction, Outcome 1 Pain intensity.

Comparison 8 Low‐back pain with radiation, two types of traction, Outcome 2 Global improvement.
Comparison 9 Low‐back pain without radiation, traction versus sham, Outcome 1 Pain intensity.
| Traction compared with placebo, sham or no treatment for people with low‐back pain with and without sciatica | |||
| Patient or population: people with low‐back pain with and without sciatica Settings: diverse Intervention: traction Comparison: placebo, sham or no treatment | |||
| Outcomes | Effects | No of Participants | Quality of the evidence |
| Pain intensity VAS (0‐100 mm). Follow‐up 12‐16 weeks. | 1 trial showed that there was no difference in pain intensity between the 2 groups (MD ‐4, 95% CI ‐17.7 to 9.7). | 60 (1) | ⊕⊕⊕⊝
Imprecision (< 400 participants) |
| Functional status Oswestry Disability Index or Roland Morris Disability Questionnaire. Follow‐up 12‐16 weeks. | Not measured. |
|
|
| Global improvement Follow‐up 12‐16 weeks. | 1 trial showed that there was no difference in global improvement between the 2 groups (RD 0.06, 95% CI ‐0.16 to 0.28). | 81 (1) | ⊕⊕⊕⊝
Imprecision (< 300 participants) |
| Return to work Follow‐up 12‐16 weeks. | Not measured. | ||
| Adverse effects | 1 trial reported aggravation of neurological signs in 28% of the traction group, 20% of the light traction group and 20% of the placebo group. | ||
| CI: confidence interval; MD: mean difference; RD: risk difference; VAS: visual analogue scale. | |||
| GRADE Working Group grades of evidence | |||
| Note. Each 'Summary of findings' table presents evidence for a specific comparison and a set of prespecified outcomes. Therefore, the information presented in the tables is limited by the comparisons and outcomes reported in the included studies. | |||
| Physiotherapy with traction compared with physiotherapy without traction for people with low‐back pain with and without sciatica | |||
| Patient or population: people with low‐back pain with and without sciatica Settings: physical medicine and rehabilitation outpatient clinic of a larger hospital Intervention: physiotherapy with traction Comparison: physiotherapy without traction | |||
| Outcomes | Effects | No of Participants | Quality of the evidence |
| Pain intensity VAS (0‐100 mm). Follow‐up 12‐16 weeks. | 1 trial showed that there was no difference in pain intensity between the 2 groups (MD 5, 95% CI ‐5.7 to 15.7) in favour of the control group. | 39 (1) | ⊕⊕⊝⊝
Study design (high risk of bias) Imprecision (< 400 participants) |
| Functional status Oswestry Disability Index or Roland Morris Disability Questionnaire. Follow‐up 12‐16 weeks. | 2 trials showed that there was no difference in functional status between the 2 groups (SMD from 0.36 (95% CI ‐0.27 to 1.00) to 0.43 (95% CI ‐0.30 to 1.16)). | 69 (2) | ⊕⊕⊝⊝
Study design (high risk of bias) Imprecision (< 400 participants) |
| Global improvement Follow‐up 12‐16 weeks. | 1 trial showed no difference in global improvement, another trial did show a clinically significant difference in global improvement (RD 0.53, 95% CI 0.28 to 0.79). | 220 (2) | ⊕⊕⊝⊝
Study design (high risk of bias) Imprecision (< 300 participants) |
| Return to work Follow‐up 12‐16 weeks. | Not measured. |
|
|
| Adverse effects | 1 study reported that 25% of the physiotherapy with traction group and 37% of the physiotherapy without traction group felt worse at 3 months' follow‐up. |
|
|
| CI: confidence interval; MD: mean difference; RD: risk difference. | |||
| GRADE Working Group grades of evidence | |||
| Traction compared with another type of traction for people with low‐back pain with and without sciatica | |||
| Patient or population: people with low‐back pain with and without sciatica Settings: diverse Intervention: traction Comparison: another type of traction | |||
| Outcomes | Effects | No of Participants | Quality of the evidence |
| Pain intensity VAS (0‐100 mm). Follow‐up 12‐16 weeks. | Not measured. | ||
| Functional status Oswestry Disability Index or Roland Morris Disability Questionnaire. Follow‐up 12‐16 weeks. | Not measured. |
|
|
| Global improvement Follow‐up 12‐16 weeks. | Not measured. |
|
|
| Return to work Follow‐up 12‐16 weeks. | Not measured. |
|
|
| Adverse effects | 1 trial reported increased pain in 31% of the static traction group and 15% of the intermittent traction group. |
|
|
| VAS: visual analogue scale. | |||
| GRADE Working Group grades of evidence | |||
| Traction compared with any other treatment for people with low‐back pain with and without sciatica | |||
| Patient or population: people with low‐back pain with and without sciatica Settings: diverse Intervention: traction Comparison: other treatment | |||
| Outcomes | Effects | No of participants | Quality of the evidence |
| Pain intensity VAS (0‐100 mm). Follow‐up 12‐16 weeks. | 3 trials, of which 1 compared traction with 2 other types of treatment, showed no difference greater than 5 points on the VAS scale between the 2 groups (MD ‐2.90 (95% CI ‐8.53 to 2.93) to 4.50 (95% CI ‐0.45 to 9.45). | 304 (3) | ⊕⊕⊕⊝
Imprecision (< 400 participants) |
| Functional status Oswestry Disability Index or Roland Morris Disability Questionnaire. Follow‐up 12‐16 weeks. | 3 trials, of which 1 compared traction to 2 other types of treatment and used 2 types of questionnaires to assess functional status, showed no difference between the 2 groups (SMD ‐0.08 (95% CI ‐0.39 to 0.23) to 0.51 (95% CI ‐0.12 to 1.14)). | 350 (3) | ⊕⊕⊕⊝
Imprecision (< 400 participants) |
| Global improvement Follow‐up 12‐16 weeks. | 1 trial showed no difference in global improvement (RD 0.05, 95% CI ‐0.1 to 0.2). | 42 (1) | ⊕⊕⊝⊝
Study design (high risk of bias) Imprecision (< 300 participants) |
| Return to work Follow‐up 12‐16 weeks. | Not measured. | ||
| Adverse effects | 1 trial reported temporary deterioration of low‐back pain in 17% of the traction group and 15% of the exercise group. | ||
| MD: mean difference; RD: risk difference; SMD: standardized mean difference. | |||
| GRADE Working Group grades of evidence | |||
| Author | Participants | Interventions | Outcomes | Effect size | Benefits/harms |
| + | + | + | ‐ | ‐ | |
| + | + | + | ‐ | ‐ | |
| + | + | + | ‐ | ‐ | |
| + | ‐ | + | ‐ | ‐ | |
| + | + | + | ‐ | ‐ | |
| + | + | + | ‐ | ‐ | |
| + | + | + | ? | ‐ | |
| + | + | + | ‐ | ‐ | |
| + | ? | + | ‐ | ‐ | |
| + | + | + | ‐ | ‐ | |
| ‐ | + | + | ‐ | ‐ | |
| + | + | + | ? | ‐ | |
| + | + | + | + | + | |
| + | + | + | ‐ | ‐ | |
| + | + | + | ‐ | ‐ | |
| + | + | + | ‐ | ‐ | |
| + | + | + | ‐ | ‐ | |
| + | + | + | ‐ | ‐ | |
| + | + | + | ‐ | ‐ | |
| ‐ | + | + | ‐ | ‐ | |
| + | + | + | ‐ | ‐ | |
| + | + | + | + | ? | |
| + | + | + | ‐ | ‐ | |
| + | + | + | ‐ | ‐ | |
| + | + | + | ? | ‐ | |
| + | + | + | ‐ | ‐ | |
| + | + | + | ‐ | ‐ | |
| + | + | + | ‐ | ‐ | |
| ‐ | + | + | ‐ | ‐ | |
| Weber 1984 (1) | ‐ | + | + | ‐ | ‐ |
| Weber 1984 (2) | ‐ | + | + | ‐ | ‐ |
| + | + | + | ‐ | ‐ | |
| +: yes; ‐: no; ?: unknown. | |||||
| Outcome or subgroup title | No. of studies | No. of participants | Statistical method | Effect size |
| 1 Pain intensity Show forest plot | 2 | Mean Difference (IV, Fixed, 95% CI) | Subtotals only | |
| 1.1 3‐5 weeks | 2 | 247 | Mean Difference (IV, Fixed, 95% CI) | ‐18.49 [‐24.12, ‐12.87] |
| 1.2 6‐12 weeks | 1 | 150 | Mean Difference (IV, Fixed, 95% CI) | 0.30 [‐9.91, 10.51] |
| 1.3 6 months | 1 | 150 | Mean Difference (IV, Fixed, 95% CI) | ‐0.5 [‐11.55, 10.55] |
| 1.4 1 year | 1 | 97 | Mean Difference (IV, Fixed, 95% CI) | ‐9.10 [‐19.32, 1.12] |
| 2 Functional status Show forest plot | 1 | Mean Difference (IV, Fixed, 95% CI) | Totals not selected | |
| 2.1 3‐5 weeks | 1 | Mean Difference (IV, Fixed, 95% CI) | 0.0 [0.0, 0.0] | |
| 2.2 6‐12 weeks | 1 | Mean Difference (IV, Fixed, 95% CI) | 0.0 [0.0, 0.0] | |
| 2.3 6 months | 1 | Mean Difference (IV, Fixed, 95% CI) | 0.0 [0.0, 0.0] | |
| 3 Global improvement Show forest plot | 2 | Risk Difference (M‐H, Fixed, 95% CI) | Subtotals only | |
| 3.1 3‐5 weeks | 2 | 175 | Risk Difference (M‐H, Fixed, 95% CI) | ‐0.03 [‐0.17, 0.12] |
| 3.2 6‐12 weeks | 2 | 175 | Risk Difference (M‐H, Fixed, 95% CI) | 0.03 [‐0.12, 0.18] |
| 3.3 6 months | 1 | 150 | Risk Difference (M‐H, Fixed, 95% CI) | 0.02 [‐0.14, 0.18] |
| 4 Return to work (days) Show forest plot | 1 | Mean Difference (IV, Fixed, 95% CI) | Totals not selected | |
| 4.1 3‐5 weeks | 1 | Mean Difference (IV, Fixed, 95% CI) | 0.0 [0.0, 0.0] | |
| 4.2 6‐12 weeks | 1 | Mean Difference (IV, Fixed, 95% CI) | 0.0 [0.0, 0.0] | |
| 4.3 6 months | 1 | Mean Difference (IV, Fixed, 95% CI) | 0.0 [0.0, 0.0] | |
| Outcome or subgroup title | No. of studies | No. of participants | Statistical method | Effect size |
| 1 Pain intensity Show forest plot | 1 | Mean Difference (IV, Fixed, 95% CI) | Totals not selected | |
| 1.1 1‐2 weeks | 1 | Mean Difference (IV, Fixed, 95% CI) | 0.0 [0.0, 0.0] | |
| 1.2 12‐16 weeks | 1 | Mean Difference (IV, Fixed, 95% CI) | 0.0 [0.0, 0.0] | |
| 2 Functional status Show forest plot | 1 | Mean Difference (IV, Fixed, 95% CI) | Totals not selected | |
| 2.1 1‐2 weeks | 1 | Mean Difference (IV, Fixed, 95% CI) | 0.0 [0.0, 0.0] | |
| 2.2 12‐16 weeks | 1 | Mean Difference (IV, Fixed, 95% CI) | 0.0 [0.0, 0.0] | |
| 3 Global improvement Show forest plot | 1 | Risk Difference (M‐H, Fixed, 95% CI) | Totals not selected | |
| 3.1 1‐2 weeks | 1 | Risk Difference (M‐H, Fixed, 95% CI) | 0.0 [0.0, 0.0] | |
| 3.2 12‐16 weeks | 1 | Risk Difference (M‐H, Fixed, 95% CI) | 0.0 [0.0, 0.0] | |
| Outcome or subgroup title | No. of studies | No. of participants | Statistical method | Effect size |
| 1 Global improvement Show forest plot | 2 | Risk Difference (M‐H, Fixed, 95% CI) | Subtotals only | |
| 1.1 1‐2 weeks | 2 | 93 | Risk Difference (M‐H, Fixed, 95% CI) | 0.35 [0.17, 0.54] |
| Outcome or subgroup title | No. of studies | No. of participants | Statistical method | Effect size |
| 1 Pain intensity Show forest plot | 4 | Mean Difference (IV, Fixed, 95% CI) | Totals not selected | |
| 1.1 1‐2 weeks | 2 | Mean Difference (IV, Fixed, 95% CI) | 0.0 [0.0, 0.0] | |
| 1.2 3‐5 weeks | 2 | Mean Difference (IV, Fixed, 95% CI) | 0.0 [0.0, 0.0] | |
| 1.3 12‐16 weeks | 2 | Mean Difference (IV, Fixed, 95% CI) | 0.0 [0.0, 0.0] | |
| 1.4 6 months | 1 | Mean Difference (IV, Fixed, 95% CI) | 0.0 [0.0, 0.0] | |
| 1.5 1 year | 2 | Mean Difference (IV, Fixed, 95% CI) | 0.0 [0.0, 0.0] | |
| 2 Functional status Show forest plot | 2 | Std. Mean Difference (IV, Fixed, 95% CI) | Subtotals only | |
| 2.1 1‐2 weeks | 1 | 138 | Std. Mean Difference (IV, Fixed, 95% CI) | ‐0.06 [‐0.40, 0.27] |
| 2.2 3‐5 weeks | 1 | 235 | Std. Mean Difference (IV, Fixed, 95% CI) | 0.20 [‐0.05, 0.46] |
| 2.3 12‐16 weeks | 2 | 290 | Std. Mean Difference (IV, Fixed, 95% CI) | ‐0.03 [‐0.26, 0.21] |
| 2.4 6 months | 1 | 168 | Std. Mean Difference (IV, Fixed, 95% CI) | 0.15 [‐0.16, 0.45] |
| 2.5 1 year | 1 | 173 | Std. Mean Difference (IV, Fixed, 95% CI) | 0.04 [‐0.25, 0.34] |
| 3 Global improvement Show forest plot | 3 | Risk Difference (M‐H, Fixed, 95% CI) | Totals not selected | |
| 3.1 1‐2 weeks | 2 | Risk Difference (M‐H, Fixed, 95% CI) | 0.0 [0.0, 0.0] | |
| 3.2 3‐5 weeks | 2 | Risk Difference (M‐H, Fixed, 95% CI) | 0.0 [0.0, 0.0] | |
| 3.3 12‐16 weeks | 1 | Risk Difference (M‐H, Fixed, 95% CI) | 0.0 [0.0, 0.0] | |
| Outcome or subgroup title | No. of studies | No. of participants | Statistical method | Effect size |
| 1 Pain intensity Show forest plot | 2 | Mean Difference (IV, Fixed, 95% CI) | Subtotals only | |
| 1.1 1‐2 weeks | 2 | 79 | Mean Difference (IV, Fixed, 95% CI) | 2.93 [‐14.73, 20.59] |
| 1.2 3‐5 weeks | 1 | 39 | Mean Difference (IV, Fixed, 95% CI) | 0.0 [0.0, 0.0] |
| 2 Global improvement Show forest plot | 5 | Risk Difference (M‐H, Fixed, 95% CI) | Subtotals only | |
| 2.1 1‐2 weeks | 4 | 398 | Risk Difference (M‐H, Fixed, 95% CI) | 0.13 [0.04, 0.22] |
| 2.2 3‐5 weeks | 2 | 123 | Risk Difference (M‐H, Fixed, 95% CI) | 0.27 [0.12, 0.43] |
| 2.3 12‐16 weeks | 1 | 81 | Risk Difference (M‐H, Fixed, 95% CI) | 0.06 [‐0.16, 0.28] |
| 3 Return to work Show forest plot | 1 | Risk Difference (M‐H, Fixed, 95% CI) | Subtotals only | |
| 3.1 2 years | 1 | 39 | Risk Difference (M‐H, Fixed, 95% CI) | 0.15 [‐0.15, 0.45] |
| Outcome or subgroup title | No. of studies | No. of participants | Statistical method | Effect size |
| 1 Pain intensity Show forest plot | 2 | Mean Difference (IV, Fixed, 95% CI) | Subtotals only | |
| 1.1 1‐2 weeks | 2 | 110 | Mean Difference (IV, Fixed, 95% CI) | ‐7.96 [‐16.53, 0.61] |
| 1.2 6 weeks | 1 | 64 | Mean Difference (IV, Fixed, 95% CI) | 2.0 [‐10.02, 14.02] |
| 2 Functional status Show forest plot | 2 | Std. Mean Difference (IV, Fixed, 95% CI) | Subtotals only | |
| 2.1 1‐2 weeks | 2 | 94 | Std. Mean Difference (IV, Fixed, 95% CI) | ‐0.08 [‐0.49, 0.32] |
| 2.2 6‐12 weeks | 1 | 64 | Std. Mean Difference (IV, Fixed, 95% CI) | 0.14 [‐0.35, 0.63] |
| 2.3 12‐16 weeks | 1 | 30 | Std. Mean Difference (IV, Fixed, 95% CI) | 0.43 [‐0.30, 1.16] |
| 2.4 6 months | 1 | 30 | Std. Mean Difference (IV, Fixed, 95% CI) | 0.18 [‐0.54, 0.90] |
| 3 Global improvement Show forest plot | 3 | Risk Difference (M‐H, Fixed, 95% CI) | Totals not selected | |
| 3.1 1‐2 weeks | 1 | Risk Difference (M‐H, Fixed, 95% CI) | 0.0 [0.0, 0.0] | |
| 3.2 3‐5 weeks | 1 | Risk Difference (M‐H, Fixed, 95% CI) | 0.0 [0.0, 0.0] | |
| 3.3 6 weeks | 1 | Risk Difference (M‐H, Fixed, 95% CI) | 0.0 [0.0, 0.0] | |
| 3.4 12‐16 weeks | 1 | Risk Difference (M‐H, Fixed, 95% CI) | 0.0 [0.0, 0.0] | |
| 4 Return to work Show forest plot | 1 | Odds Ratio (M‐H, Fixed, 95% CI) | Totals not selected | |
| 4.1 3‐5 weeks | 1 | Odds Ratio (M‐H, Fixed, 95% CI) | 0.0 [0.0, 0.0] | |
| Outcome or subgroup title | No. of studies | No. of participants | Statistical method | Effect size |
| 1 Pain intensity Show forest plot | 2 | Mean Difference (IV, Fixed, 95% CI) | Totals not selected | |
| 1.1 1‐2 weeks | 2 | Mean Difference (IV, Fixed, 95% CI) | 0.0 [0.0, 0.0] | |
| 1.2 3‐5 weeks | 1 | Mean Difference (IV, Fixed, 95% CI) | 0.0 [0.0, 0.0] | |
| 1.3 12‐16 weeks | 1 | Mean Difference (IV, Fixed, 95% CI) | 0.0 [0.0, 0.0] | |
| 2 Functional status Show forest plot | 2 | Std. Mean Difference (IV, Fixed, 95% CI) | Totals not selected | |
| 2.1 1‐2 weeks | 2 | Std. Mean Difference (IV, Fixed, 95% CI) | 0.0 [0.0, 0.0] | |
| 2.2 3‐5 weeks | 1 | Std. Mean Difference (IV, Fixed, 95% CI) | 0.0 [0.0, 0.0] | |
| 2.3 12‐16 weeks | 1 | Std. Mean Difference (IV, Fixed, 95% CI) | 0.0 [0.0, 0.0] | |
| 3 Global improvement Show forest plot | 2 | Risk Difference (M‐H, Fixed, 95% CI) | Totals not selected | |
| 3.1 1‐2 weeks | 1 | Risk Difference (M‐H, Fixed, 95% CI) | 0.0 [0.0, 0.0] | |
| 3.2 3‐5 weeks | 1 | Risk Difference (M‐H, Fixed, 95% CI) | 0.0 [0.0, 0.0] | |
| Outcome or subgroup title | No. of studies | No. of participants | Statistical method | Effect size |
| 1 Pain intensity Show forest plot | 3 | Mean Difference (IV, Fixed, 95% CI) | Subtotals only | |
| 1.1 1‐2 weeks | 3 | 149 | Mean Difference (IV, Fixed, 95% CI) | 6.58 [‐2.77, 15.93] |
| 2 Global improvement Show forest plot | 1 | Risk Difference (M‐H, Fixed, 95% CI) | Totals not selected | |
| 2.1 1‐2 weeks | 1 | Risk Difference (M‐H, Fixed, 95% CI) | 0.0 [0.0, 0.0] | |
| Outcome or subgroup title | No. of studies | No. of participants | Statistical method | Effect size |
| 1 Pain intensity Show forest plot | 1 | Mean Difference (IV, Fixed, 95% CI) | Totals not selected | |
| 1.1 12‐16 weeks | 1 | Mean Difference (IV, Fixed, 95% CI) | 0.0 [0.0, 0.0] | |