| 1 HRQOL: SGRQ total Show forest plot | 7 | 698 | Mean Difference (IV, Fixed, 95% CI) | ‐2.58 [‐5.14, ‐0.02] |
|
| 2 HRQOL: SGRQ symptoms Show forest plot | 7 | 698 | Mean Difference (IV, Fixed, 95% CI) | ‐1.45 [‐4.41, 1.51] |
|
| 3 HRQOL: SGRQ activity Show forest plot | 7 | 698 | Mean Difference (IV, Fixed, 95% CI) | ‐2.88 [‐5.90, 0.13] |
|
| 4 HRQOL: SGRQ impacts Show forest plot | 7 | 698 | Mean Difference (IV, Fixed, 95% CI) | ‐2.83 [‐5.65, ‐0.02] |
|
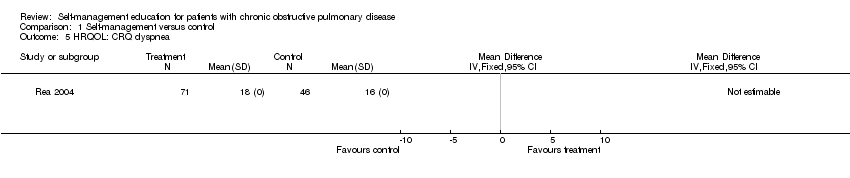
| 5 HRQOL: CRQ dyspnea Show forest plot | 1 | | Mean Difference (IV, Fixed, 95% CI) | Totals not selected |
|
| 6 HRQOL: CRQ fatigue Show forest plot | 1 | | Mean Difference (IV, Fixed, 95% CI) | Totals not selected |
|
| 7 HRQOL: CRQ emotional function Show forest plot | 1 | | Mean Difference (IV, Fixed, 95% CI) | Totals not selected |
|
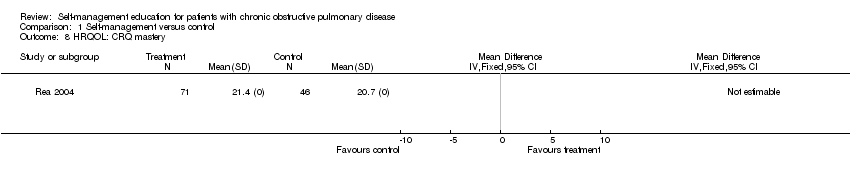
| 8 HRQOL: CRQ mastery Show forest plot | 1 | | Mean Difference (IV, Fixed, 95% CI) | Totals not selected |
|
| 9 General HRQOL: SIP Total score Show forest plot | 3 | 249 | Mean Difference (IV, Fixed, 95% CI) | 0.30 [‐4.00, 4.60] |
|
| 10 General HRQoL: SIP physical Show forest plot | 2 | 201 | Mean Difference (IV, Fixed, 95% CI) | 0.0 [0.0, 0.0] |
|
| 11 General HRQoL : SIP psychosocial Show forest plot | 2 | 201 | Mean Difference (IV, Fixed, 95% CI) | 0.0 [0.0, 0.0] |
|
| 12 HRQOL: SF‐36 Total + domains Show forest plot | 3 | | Mean Difference (IV, Fixed, 95% CI) | Subtotals only |
|
| 12.1 SF‐36 ‐ total | 0 | 0 | Mean Difference (IV, Fixed, 95% CI) | 0.0 [0.0, 0.0] |
| 12.2 SF‐36 ‐ physical functioning | 3 | 268 | Mean Difference (IV, Fixed, 95% CI) | 0.59 [‐8.64, 9.83] |
| 12.3 SF‐36 ‐ role limitations ‐ physical | 3 | 268 | Mean Difference (IV, Fixed, 95% CI) | 3.33 [‐9.22, 15.87] |
| 12.4 SF36 ‐ bodily pain | 3 | 268 | Mean Difference (IV, Fixed, 95% CI) | 8.91 [‐2.49, 20.32] |
| 12.5 SF‐36 ‐ social limitations | 3 | 268 | Mean Difference (IV, Fixed, 95% CI) | ‐1.90 [‐13.70, 9.90] |
| 12.6 SF‐36 ‐ mental health | 3 | 268 | Mean Difference (IV, Fixed, 95% CI) | 0.01 [‐7.70, 7.72] |
| 12.7 SF‐36 ‐ role limitations ‐ emotional | 3 | 268 | Mean Difference (IV, Fixed, 95% CI) | ‐4.64 [‐17.79, 8.51] |
| 12.8 SF‐36 ‐ vitality, energy, fatigue | 3 | 268 | Mean Difference (IV, Fixed, 95% CI) | 4.21 [‐4.19, 12.61] |
| 12.9 SF‐36 ‐ general health | 3 | 268 | Mean Difference (IV, Fixed, 95% CI) | ‐0.70 [‐9.73, 8.33] |
| 13 Borg score dyspnoea Show forest plot | 2 | 144 | Mean Difference (IV, Fixed, 95% CI) | ‐0.53 [‐0.96, ‐0.10] |
|
| 14 Patients using at least one course of oral steroids Show forest plot | 3 | 291 | Odds Ratio (M‐H, Fixed, 95% CI) | 1.44 [0.91, 2.30] |
|
| 15 Patients using at least one course of antibiotics Show forest plot | 1 | | Odds Ratio (M‐H, Fixed, 95% CI) | Totals not selected |
|
| 16 Respiratory‐related hospital admissions Show forest plot | 8 | 966 | Odds Ratio (M‐H, Fixed, 95% CI) | 0.64 [0.47, 0.89] |
|
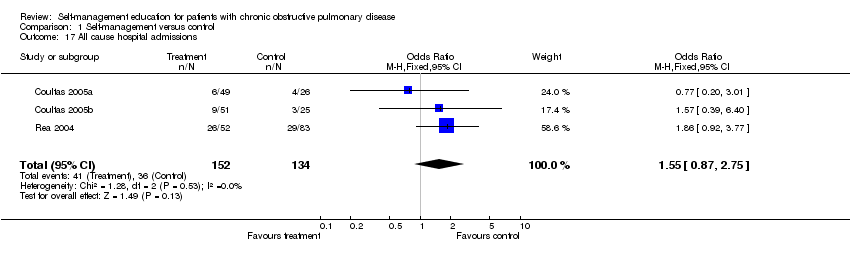
| 17 All cause hospital admissions Show forest plot | 3 | 286 | Odds Ratio (M‐H, Fixed, 95% CI) | 1.55 [0.87, 2.75] |
|
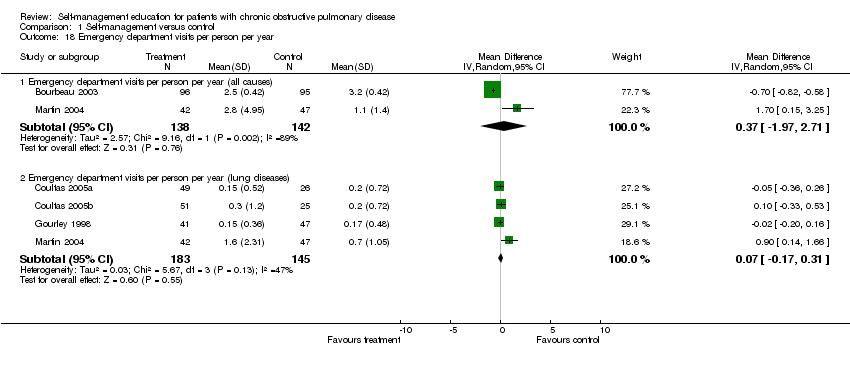
| 18 Emergency department visits per person per year Show forest plot | 5 | | Mean Difference (IV, Random, 95% CI) | Subtotals only |
|
| 18.1 Emergency department visits per person per year (all causes) | 2 | 280 | Mean Difference (IV, Random, 95% CI) | 0.37 [‐1.97, 2.71] |
| 18.2 Emergency department visits per person per year (lung diseases) | 4 | 328 | Mean Difference (IV, Random, 95% CI) | 0.07 [‐0.17, 0.31] |
| 19 Doctor and nurse visits: mean number per person per year Show forest plot | 8 | | Mean Difference (IV, Random, 95% CI) | Subtotals only |
|
| 19.1 doctor and nurse visits: mean number per person per year | 8 | 875 | Mean Difference (IV, Random, 95% CI) | 0.02 [‐1.10, 1.13] |
| 19.2 doctor and nurse visits: mean number per person per year (all) | 1 | 88 | Mean Difference (IV, Random, 95% CI) | 4.0 [‐0.51, 8.51] |
| 20 Days lost from work: mean number per person per year Show forest plot | 2 | 121 | Mean Difference (IV, Fixed, 95% CI) | ‐17.5 [‐50.05, 15.05] |
|
| 21 Lung function: FEV1% pred Show forest plot | 6 | 552 | Std. Mean Difference (IV, Fixed, 95% CI) | 0.04 [‐0.12, 0.21] |
|
| 22 Exercise capacity: 6MW Show forest plot | 3 | 413 | Mean Difference (IV, Fixed, 95% CI) | ‐6.25 [‐24.05, 11.55] |
|
| 23 Smokers (number of smokers) Show forest plot | 1 | | Odds Ratio (M‐H, Fixed, 95% CI) | Totals not selected |
|