Vacunas para las mujeres para la prevención del tétanos neonatal
Resumen
Antecedentes
El tétanos es una enfermedad aguda, a menudo mortal, causada por una exotoxina producida por el Clostridium tetani. Se presenta en recién nacidos de madres que no tienen suficientes anticuerpos circulantes para proteger de forma pasiva al recién nacido mediante la transferencia transplacentaria. La prevención puede ser posible mediante la vacunación de mujeres, embarazadas y no embarazadas, con toxoide tetánico, y la prestación de servicios de parto higiénicos. El toxoide tetánico consiste en una toxina tratada con formaldehído que estimula la producción de antitoxina.
Objetivos
Evaluar la efectividad del toxoide tetánico, administrado a mujeres en edad reproductiva o a embarazadas, para prevenir casos y muertes por tétanos neonatal.
Métodos de búsqueda
Se realizaron búsquedas en el registro de ensayos del Grupo Cochrane de Embarazo y Parto (Cochrane Pregnancy and Childbirth Group) (31 de enero de 2015), CENTRAL (The Cochrane Library 2015, Número 1), PubMed (1966 hasta el 28 de enero de 2015), EMBASE (1974 hasta el 28 de enero de 2015) y en las listas de referencias de los estudios recuperados.
Criterios de selección
Ensayos aleatorizados o cuasialeatorizados que evaluaron los efectos del toxoide tetánico en embarazadas o mujeres en edad reproductiva sobre los números de casos y muertes por tétanos neonatal.
Obtención y análisis de los datos
Dos autores de la revisión evaluaron de forma independiente los ensayos para la inclusión y el riesgo de sesgo, extrajeron los datos y verificaron su exactitud.
Resultados principales
Se incluyeron dos ensayos de eficacia (9823 lactantes) y un ensayo de seguridad (48 madres). Los principales resultados se midieron en los recién nacidos de un subgrupo de mujeres asignadas al azar que quedaron embarazadas durante el curso de los estudios. Para los resultados primarios de esta revisión no hubo evidencia de alta calidad según las evaluaciones GRADE.
Un estudio (1182 lactantes) evaluó la eficacia del toxoide tetánico en comparación con la vacuna contra la gripe para prevenir las muertes por tétanos en los recién nacidos. Una dosis única no proporcionó una protección significativa contra las muertes por tétanos neonatal, (riesgo relativo [RR] 0,57; intervalo de confianza [IC] del 95%: 0,26 a 1,24; 494 lactantes; GRADE: evidencia de calidad baja). Sin embargo, un ciclo de dos o tres dosis sí proporcionó protección contra las muertes neonatales, (RR 0,02; IC del 95%: 0,00 a 0,30; 688 lactantes; GRADE: evidencia de calidad moderada). La administración de un ciclo de dos o tres dosis dio lugar a una protección significativa cuando se consideraron todas las causas de muerte como un resultado (RR 0,31; IC del 95%: 0,17 a 0,55; 688 lactantes; GRADE: evidencia de calidad moderada). No se detectaron efectos en las causas de muerte diferentes del tétanos. Se redujeron los casos de tétanos neonatal después de al menos una dosis de toxoide tetánico en el grupo de toxoide tetánico, (RR 0,20; IC del 95%: 0,10 a 0,40; 1182 lactantes; GRADE: evidencia de calidad moderada).
En otro estudio, en el que participaron 8641 niños, se evaluó la eficacia del toxoide tetánico y diftérico en comparación con el toxoide del cólera para prevenir la mortalidad neonatal después de una o dos dosis. La mortalidad neonatal se redujo en el grupo de toxoide tetánico y diftérico (RR 0,68; IC del 95%: 0,56 a 0,82). En la prevención de las muertes a los cuatro a 14 días, la mortalidad neonatal se redujo nuevamente en el grupo de toxoide tetánico y diftérico (RR 0,38; IC del 95%: 0,27 a 0,55). Se determinó que la calidad de la evidencia evaluada mediante el uso de GRADE fue baja.
El tercer ensayo pequeño evaluó que el dolor en el lugar de la inyección se informó con mayor frecuencia entre las mujeres embarazadas que recibieron la vacuna con antitoxinas contra el tétano, la difteria y la tos ferina acelular que placebo (RR 5,68; IC del 95%: 1,54 a 20,94; GRADE: evidencia de calidad moderada).
Conclusiones de los autores
La evidencia disponible apoya la implementación de prácticas de inmunización en mujeres en edad reproductiva o embarazadas en comunidades con niveles de riesgo del tétanos neonatal similares o mayores a los dos sitios de estudio.
PICO
Resumen en términos sencillos
Vacunas para las mujeres para prevenir el tétanos en los recién nacidos
Pregunta de la revisión: Esta revisión evaluó la evidencia existente sobre la inmunización con toxoide tetánico en mujeres en edad reproductiva para la prevención del tétanos y la muerte en los recién nacidos y para determinar si la exposición al toxoide tetánico se asocia con efectos perjudiciales graves.
Antecedentes: El tétanos neonatal es una infección que causa rigidez, espasmo muscular y a menudo la muerte en los recién nacidos. Es bastante común en los países de bajos ingresos, como resultado de la insuficiente protección que se transmite de la madre al feto durante el embarazo, junto con la infección que adquiere el recién nacido cuando el cordón umbilical se corta con instrumentos contaminados.
Características de los estudios: La evidencia está actualizada hasta enero de 2015 y la revisión incluye tres ensayos. Dos evaluaron la eficacia de la vacunación de las mujeres en edad reproductiva (9823 lactantes): uno (1182 recién nacidos) evaluó los efectos del toxoide tetánico contra la gripe polivalente en la prevención del tétanos y las muertes en el transcurso de los 30 días de vida; el otro (8641 recién nacidos) evaluó los efectos del toxoide tetánico y diftérico contra el toxoide del cólera administrado en mujeres en edad reproductiva en la prevención de las muertes de los recién nacidos. El tercer ensayo (48 mujeres y sus recién nacidos) evaluó la seguridad de la administración de la vacuna con antitoxinas contra el tétano, la difteria y la tos ferina acelular (Tdap) durante el embarazo en comparación con placebo.
Resultados clave y calidad de la evidencia:
Se observó un efecto protector contra las muertes causadas por el tétanos entre los recién nacidos de madres que recibieron al menos dos dosis de la vacuna del toxoide tetánico, en comparación con los recién nacidos de madres que fueron inmunizadas con la vacuna contra la gripe. Se observó un efecto protector similar contra la muerte de los recién nacidos con al menos dos dosis de la vacuna antitetánica. Los casos de tétanos fueron menos frecuentes entre los recién nacidos de mujeres que recibieron por lo menos una dosis de toxoide tetánico. Esta evidencia es de calidad moderada. En el segundo ensayo, la inmunización de mujeres en edad reproductiva con el toxoide del tétanos y la difteria tuvo un mayor efecto protector contra la muerte de los recién nacidos que la vacuna contra el cólera. La calidad de la evidencia fue baja para este resultado. En el tercer estudio no hubo eventos adversos graves (durante el embarazo o en los recién nacidos) relacionado con la recepción de la vacuna Tdap. Las mujeres presentaron más dolor con la inyección de la vacuna que con placebo. La evidencia disponible apoya la aplicación de programas de inmunización para mujeres en edad reproductiva o embarazadas en comunidades con niveles de riesgo de tétanos en los recién nacidos similares o superiores a los de los dos sitios de estudio.
Authors' conclusions
Summary of findings
| Tetanus toxoid versus influenza vaccine for women to prevent neonatal tetanus | ||||||
| Patient or population: women aged between 13 and 45 years. Setting: rural community | ||||||
| Outcomes | Illustrative comparative risks* (95% CI) | Relative effect | No of participants | Quality of the evidence | Comments | |
| Assumed risk | Corresponding risk | |||||
| Control | Tetanus toxoid versus influenza vaccine | |||||
| Neonatal tetanus deaths ‐ 1 dose | Study population | RR 0.57 | 494 | ⊕⊕⊝⊝ | ||
| 70 per 1000 | 40 per 1000 | |||||
| Moderate | ||||||
| 70 per 1000 | 40 per 1000 | |||||
| Neonatal tetanus deaths ‐ 2 or 3 doses | Study population | RR 0.02 | 688 | ⊕⊕⊕⊝ | ||
| 78 per 1000 | 2 per 1000 | |||||
| Moderate | ||||||
| 78 per 1000 | 2 per 1000 | |||||
| All causes of deaths ‐ 1 dose | Study population | RR 1.08 | 494 | ⊕⊕⊝⊝ | About 57% of non‐tetanus deaths were observed in the first 7 days of life. | |
| 104 per 1000 | 112 per 1000 | |||||
| Moderate | ||||||
| 104 per 1000 | 112 per 1000 | |||||
| All causes of deaths ‐ 2 or 3 doses | Study population | RR 0.31 | 688 | ⊕⊕⊕⊝ | ||
| 133 per 1000 | 41 per 1000 | |||||
| Moderate | ||||||
| 133 per 1000 | 41 per 1000 | |||||
| Neonatal tetanus cases ‐ Any dose | Study population | RR 0.2 | 1182 | ⊕⊕⊕⊝ | Only 3 non fatal tetanus cases observed (all in the control group). | |
| 79 per 1000 | 16 per 1000 | |||||
| Moderate | ||||||
| 79 per 1000 | 16 per 1000 | |||||
| *The basis for the assumed risk (e.g. the median control group risk across studies) is provided in footnotes. The corresponding risk (and its 95% confidence interval) is based on the assumed risk in the comparison group and the relative effect of the intervention (and its 95% CI). | ||||||
| GRADE Working Group grades of evidence | ||||||
| 1 Design & Implementation (selection bias): Different aspect of the vials used for intervention and control vaccine could have introduced a certain bias in selection. | ||||||
| Tetanus diphtheria toxoid immunisation of women of reproductive age compared with cholera toxoid for preventing neonatal mortality | ||||||
| Patient or population: women of reproductive age ≥ 15 years. Intervention: tetanus diphtheria toxoid versus cholera toxoid. | ||||||
| Outcomes | Illustrative comparative risks* (95% CI) | Relative effect | No of participants | Quality of the evidence | Comments | |
| Assumed risk | Corresponding risk | |||||
| Control | Tetanus diphtheria toxoid | |||||
| Neonatal mortality in the first 28 days of life | Study population | RR 0.68 | 8641 | ⊕⊕⊝⊝ | ||
| 60 per 1000 | 41 per 1000 | |||||
| Moderate | ||||||
| 60 per 1000 | 41 per 1000 | |||||
| Neonatal mortality between day 4‐14 of life | Study population | RR 0.38 | 8641 | ⊕⊕⊝⊝ | ||
| 25 per 1000 | 10 per 1000 | |||||
| Moderate | ||||||
| 25 per 1000 | 9 per 1000 | |||||
| *The basis for the assumed risk (e.g. the median control group risk across studies) is provided in footnotes. The corresponding risk (and its 95% confidence interval) is based on the assumed risk in the comparison group and the relative effect of the intervention (and its 95% CI). | ||||||
| GRADE Working Group grades of evidence | ||||||
| 1 Design & Implementation (selection bias): Even if several important methodological details are missing, the possibility of a certain bias in selection could not be totally excluded. | ||||||
| Local and systemic reactions after administration of Tetanus Diphtheria acelluar Pertussis vaccine versus saline placebo in pregnant women | ||||||
| Patient or population: patients with local and systemic reactions | ||||||
| Outcomes | Illustrative comparative risks* (95% CI) | Relative effect | No of participants | Quality of the evidence | Comments | |
| Assumed risk | Corresponding risk | |||||
| Saline placebo | Tetanus Diphtheria acellular Pertussis vaccine | |||||
| Injection site reactions ‐ pain at injection site | Study population | RR 5.68 | 48 | ⊕⊕⊕⊝ | ||
| 133 per 1000 | 757 per 1000 | |||||
| Moderate | ||||||
| 133 per 1000 | 755 per 1000 | |||||
| Injection site reactions ‐ erythema ‐ redness | Study population | RR 1.36 | 48 | ⊕⊕⊕⊝ | ||
| 67 per 1000 | 91 per 1000 | |||||
| Moderate | ||||||
| 67 per 1000 | 91 per 1000 | |||||
| Injection site reactions ‐ induration ‐ swelling | Study population | RR 3.29 | 48 | ⊕⊕⊕⊝ | ||
| 0 per 1000 | 0 per 1000 | |||||
| Moderate | ||||||
| 0 per 1000 | 0 per 1000 | |||||
| Systemic reactions ‐ fever (oral temperature ≥ 38°C) | Study population | RR 1.41 | 48 | ⊕⊕⊕⊝ | ||
| 0 per 1000 | 0 per 1000 | |||||
| Moderate | ||||||
| 0 per 1000 | 0 per 1000 | |||||
| Systemic reactions ‐ headache | Study population | RR 1.67 | 48 | ⊕⊕⊕⊝ | ||
| 200 per 1000 | 334 per 1000 | |||||
| Moderate | ||||||
| 200 per 1000 | 334 per 1000 | |||||
| Systemic reactions ‐ malaise | Study population | RR 0.91 | 48 | ⊕⊕⊕⊝ | ||
| 133 per 1000 | 121 per 1000 | |||||
| Moderate | ||||||
| 133 per 1000 | 121 per 1000 | |||||
| Systemic reactions ‐ myalgia | Study population | RR 5.18 | 48 | ⊕⊕⊕⊝ | ||
| 0 per 1000 | 0 per 1000 | |||||
| Moderate | ||||||
| 0 per 1000 | 0 per 1000 | |||||
| *The basis for the assumed risk (e.g. the median control group risk across studies) is provided in footnotes. The corresponding risk (and its 95% confidence interval) is based on the assumed risk in the comparison group and the relative effect of the intervention (and its 95% CI). | ||||||
| GRADE Working Group grades of evidence | ||||||
| 1 Imprecision: Small sample size. The study was not powered to test any specific hypotheses. | ||||||
Background
Tetanus is an acute, often fatal, disease caused by an exotoxin produced by Clostridium tetani. Tetanus is characterised by generalised rigidity and convulsive spasms of skeletal muscles. The muscle stiffness usually involves the jaw and neck and then becomes generalised.
Description of the condition
Neonatal tetanus is a form of generalised tetanus that occurs in newborn infants born to mothers who do not have sufficient circulating antibodies to protect the infant passively by transplacental transfer. It usually occurs through infection of the unhealed umbilical stump, particularly when the stump is cut with an unsterile instrument.
Neonatal tetanus has been for several years a major cause of childhood mortality in developing countries. In 1997 an estimated 277,376 neonatal deaths were attributed to tetanus, corresponding to a global mortality rate of 2.1 per 1000 live births (Prevots 1998). More recently, as a consequence of successful vaccination programmes and application of single‐dose antenatal tetanus immunisation prevention strategies, the last available worldwide World Heath Organization (WHO) estimate for deaths caused by neonatal tetanus (year 2013), was 49,000 (Liu 2015; WHO 2015).
Although these data represent a strong reduction in disease incidence, and in 1993 deaths due to neonatal tetanus represented 14% of the global causes of neonatal mortality (UNICEF/WHO/UNFPA 2015), neonatal tetanus was still responsible for about 1% of deaths that occurred among newborns worldwide in 2013 (Liu 2015). Despite impressive progress, the goal of eliminating neonatal tetanus by 2005 (WHO 2006, UNICEF/WHO/UNFPA 2000) was later shifted to 2015 (WHO 2015).
Significant progress has been made in recent years. As of March 2015, neonatal tetanus remains a major public health problem (i.e. with an incidence rate of at least one neonatal tetanus case per 1000 live births at district level) in 23 countries: Afghanistan, Angola, Cambodia, Central African Republic, Chad, Congo DR, Equatorial Guinea, Ethiopia, Haiti, India, Indonesia, Iraq, Kenya, Mali, Niger, Nigeria, Pakistan, Papua New Guinea, Philippines, Somalia, Sudan, South Sudan, and Yemen (WHO 2015). Only as recently as 2000, neonatal tetanus was a public health problem in 59 countries (UNICEF/WHO/UNFPA 2000), but since that time it has been eliminated from 36 countries (WHO 2015).
Description of the intervention
Clostridium tetani cannot be eradicated because it is ubiquitous in the environment and prevention of infection remains the mainstay of control. Current strategies toward neonatal tetanus elimination rely on a number of approaches. These include (WHO 2006; WHO 2015; UNICEF/WHO/UNFPA 2015).
-
Strengthening routine immunisation of pregnant women with tetanus toxoid vaccine. For women who have never received vaccine, a total of five properly‐spaced doses is recommended: two given one month apart in the first pregnancy, the third dose at least six months later, then one dose in each subsequent pregnancy (or at intervals of at least one year), to a total of five doses.
-
Supplementary immunisation activities in selected high‐risk areas (districts where women have limited or no access to routine vaccination, underserved populations and special groups such as nomads and displaced persons), targeting women of reproductive age with three properly‐spaced doses of tetanus toxoid (high‐risk approach), a minimum of four weeks interval between the first and second rounds and a minimum of six months between the second and third rounds are recommended.
-
Promotion of clean deliveries and clean cord care practices. Health workers encourage also the use of trained health providers for obstetric care and also provide information about how to reach such services. Extra efforts should be made to teach pregnant women how to ensure a clean delivery at home (in case obstetric services are not available or if women prefer to deliver at home), the importance of not using harmful traditional substances for cord care, and when and where to seek care for complications.
-
Reliable neonatal tetanus surveillance including case investigation and response. The WHO estimates that only 10% of cases and deaths occurred in developing countries have been reported. It is necessary to integrate neonatal tetanus surveillance into the existing active acute flaccid paralysis and measles surveillance to have active integrated disease surveillance for vaccine preventable diseases.
Even if eradication of tetanus is not possible and tetanus exposure cannot be completely prevented, the WHO recommends the maintenance of the following program in countries that have already reached elimination (UNICEF/WHO/UNFPA 2015; WHO 2015).
-
Ensure that the majority of pregnant women (at least > 80%) are immunised against tetanus.
-
Ensure high coverage with tetanus toxoid‐containing vaccines in infancy, and consider introducing booster doses in childhood and adolescence. (School‐based immunisation can be an efficient and effective strategy).
-
Ensure access to and use of clean delivery practices and cord care.
-
Maintain and improve maternal and neonatal tetanus (MNT) surveillance to monitor continued elimination and identify areas where MNT is still occurring.
How the intervention might work
Tetanus toxoid has been regarded as safe and useful since Descombey first reported its production in 1924 (Descombey 1924). Tetanus toxoid consists of a formaldehyde‐treated toxin, which after a primary series of properly spaced doses, stimulates the production of an antitoxin that protects against tetanus toxin.
In an immunised mother, tetanus antibodies are transplacentally transferred to the fetus; this transfer is restricted to the IgG immunoglobulins only. The level of fetal IgG increases steadily from the fourth month up to delivery and at the birth is usually equal to the maternal level. This provides passive transient protection against diseases during the neonatal period. Placental antibody transfer could be reduced in the presence of other diseases (e.g. malaria or HIV infection), or multiple antigenic stimuli. The infants of mother with a sub‐optimal level of antitoxin may be at risk of tetanus. Two doses of toxoid administered during pregnancy should induce the development of a protective level of antitoxin, the level of immunity induced by a course of three injections is high and durable (Borrow 2006).
Why it is important to do this review
Current knowledge on vaccine efficacy and recommendations are only inferred from antitoxin levels and the availability of both field and experimental evidence on the effect of the tetanus toxoid appears to be insufficient. In order to try to help fill this gap, there is an urgent need for a systematic review of all available evidence on the subject.
Objectives
-
To assess the effectiveness of vaccination administered to women of reproductive age, or pregnant women, in preventing cases of neonatal tetanus.
-
To assess the effectiveness of vaccines in avoiding deaths from neonatal tetanus.
-
To estimate the frequency of adverse effects associated with tetanus toxoid vaccination in pregnancy or in women of reproductive age.
The following hypotheses will be tested comparing groups intended for tetanus toxoid vaccination versus control/placebo groups.
-
There is no difference in the number of cases of neonatal tetanus.
-
There is no difference in the number of deaths.
-
There is no difference in the number and severity of adverse effects (both systemic and localised).
Methods
Criteria for considering studies for this review
Types of studies
Randomised, quasi‐randomised, or cluster‐randomised trials comparing tetanus toxoid containing vaccines with placebo, control vaccines or no intervention (control group).
Types of participants
Pregnant women or women of reproductive age irrespective of immune status.
Types of interventions
Vaccines containing tetanus toxoid compared with placebo, other control vaccines or no intervention.
Types of outcome measures
Primary outcomes
-
Neonatal tetanus cases.
-
Neonatal mortality (deaths from neonatal tetanus; all causes).
-
Serious harms. This includes outcomes related to the course of pregnancy (spontaneous abortion, fetal death, stillbirth, preterm birth, maternal death), to neonatal outcomes (congenital malformations, neonatal death) and to severe adverse events (e.g. neurological harms).
Secondary outcomes
-
Adverse effects, classified as systemic (systemic adverse effects include cases of fever and more generalised signs).
-
Adverse effects, classified as local (local adverse effects include duration, soreness and redness at the site of inoculation).
Search methods for identification of studies
The following methods section of this review is based on a standard template used by the Cochrane Pregnancy and Childbirth Group.
Electronic searches
We searched the Cochrane Pregnancy and Childbirth Group’s Trials Register by contacting the Trials Search Co‐ordinator (31 January 2015).
The Cochrane Pregnancy and Childbirth Group’s Trials Register is maintained by the Trials Search Co‐ordinator and contains trials identified from:
-
monthly searches of the Cochrane Central Register of Controlled Trials (CENTRAL);
-
weekly searches of MEDLINE (Ovid);
-
weekly searches of Embase (Ovid);
-
monthly searches of CINAHL (EBSCO);
-
handsearches of 30 journals and the proceedings of major conferences;
-
weekly current awareness alerts for a further 44 journals plus monthly BioMed Central email alerts.
Details of the search strategies for CENTRAL, MEDLINE, Embase and CINAHL, the list of handsearched journals and conference proceedings, and the list of journals reviewed via the current awareness service can be found in the ‘Specialized Register’ section within the editorial information about the Cochrane Pregnancy and Childbirth Group.
Trials identified through the searching activities described above are each assigned to a review topic (or topics). The Trials Search Co‐ordinator searches the register for each review using the topic list rather than keywords.
In addition, we searched The Cochrane Library (2015, Issue 1), MEDLINE (1966 to 28 January 2015), EMBASE (1974 to 28 January 2015), using the search strategies detailed in Appendix 1.
Searching other resources
We used the results of the handsearch of the journal Vaccine (Jefferson 1996; Jefferson 1998). In order to locate unpublished trials, we wrote to the tetanus toxoid manufacturers listed on the WHO website. We read the bibliography of retrieved articles in order to identify further trials.
We did not apply any language or date restrictions.
Data collection and analysis
For methods used in the previous version of this review, seeDemicheli 2013.
For this update, we used the following methods for assessing the nine reports (eight trials) that were identified as a result of the updated search.
The following methods section of this review is based on a standard template used by the Cochrane Pregnancy and Childbirth Group.
Selection of studies
Two review authors independently assessed for inclusion all the potential studies identified as a result of the search strategy. We resolved any disagreement through discussion or, if required, we consulted the third review author.
Data extraction and management
We designed a form to extract data. For eligible studies, two review authors extracted the data using the agreed form. We resolved discrepancies through discussion or, if required, we consulted the third review author. We entered data into Review Manager software (RevMan 2014) and checked them for accuracy.
When information regarding any of the above was unclear, we planned to contact authors of the original reports to provide further details.
Assessment of risk of bias in included studies
Two review authors independently assessed risk of bias for each study using the criteria outlined in the Cochrane Handbook for Systematic Reviews of Interventions (Higgins 2011). Any disagreement was resolved by discussion or by involving a third assessor.
(1) Random sequence generation (checking for possible selection bias)
We described for each included study the method used to generate the allocation sequence in sufficient detail to allow an assessment of whether it should produce comparable groups.
We assessed the method as:
-
low risk of bias (any truly random process, e.g. random number table; computer random number generator);
-
high risk of bias (any non‐random process, e.g. odd or even date of birth; hospital or clinic record number);
-
unclear risk of bias.
(2) Allocation concealment (checking for possible selection bias)
We described for each included study the method used to conceal allocation to interventions prior to assignment and assessed whether intervention allocation could have been foreseen in advance of, or during recruitment, or changed after assignment.
We assessed the methods as:
-
low risk of bias (e.g. telephone or central randomisation; consecutively numbered sealed opaque envelopes);
-
high risk of bias (open random allocation; unsealed or non‐opaque envelopes, alternation; date of birth);
-
unclear risk of bias.
(3.1) Blinding of participants and personnel (checking for possible performance bias)
We described for each included study the methods used, if any, to blind study participants and personnel from knowledge of which intervention a participant received. We considered that studies were at low risk of bias if they were blinded, or if we judged that the lack of blinding unlikely to affect results. We assessed blinding separately for different outcomes or classes of outcomes.
We assessed the methods as:
-
low, high or unclear risk of bias for participants;
-
low, high or unclear risk of bias for personnel.
(3.2) Blinding of outcome assessment (checking for possible detection bias)
We described for each included study the methods used, if any, to blind outcome assessors from knowledge of which intervention a participant received. We assessed blinding separately for different outcomes or classes of outcomes.
We assessed methods used to blind outcome assessment as:
-
low, high or unclear risk of bias.
(4) Incomplete outcome data (checking for possible attrition bias due to the amount, nature and handling of incomplete outcome data)
We described for each included study, and for each outcome or class of outcomes, the completeness of data including attrition and exclusions from the analysis. We stated whether attrition and exclusions were reported and the numbers included in the analysis at each stage (compared with the total randomised participants), reasons for attrition or exclusion where reported, and whether missing data were balanced across groups or were related to outcomes. Where sufficient information was reported, or could be supplied by the trial authors, we planned to re‐include missing data in the analyses which we undertook.
We assessed methods as:
-
low risk of bias (e.g. no missing outcome data; missing outcome data balanced across groups);
-
high risk of bias (e.g. numbers or reasons for missing data imbalanced across groups; ‘as treated’ analysis done with substantial departure of intervention received from that assigned at randomisation);
-
unclear risk of bias.
(5) Selective reporting (checking for reporting bias)
We described for each included study how we investigated the possibility of selective outcome reporting bias and what we found.
We assessed the methods as:
-
low risk of bias (where it is clear that all of the study’s pre‐specified outcomes and all expected outcomes of interest to the review have been reported);
-
high risk of bias (where not all the study’s pre‐specified outcomes have been reported; one or more reported primary outcomes were not pre‐specified; outcomes of interest are reported incompletely and so cannot be used; study fails to include results of a key outcome that would have been expected to have been reported);
-
unclear risk of bias.
(6) Other bias (checking for bias due to problems not covered by (1) to (5) above)
We described for each included study any important concerns we had about other possible sources of bias.
(7) Overall risk of bias
We made explicit judgements about whether studies were at high risk of bias, according to the criteria given in the Handbook (Higgins 2011). With reference to (1) to (6) above, we planned to assess the likely magnitude and direction of the bias and whether we considered it is likely to impact on the findings. In future updates, we will explore the impact of the level of bias through undertaking sensitivity analyses ‐ seeSensitivity analysis.
Assessment of the quality of the evidence
For this update, we assessed the quality of the evidence using the GRADE approach (Schunemann 2009) in order to assess the quality of the body of evidence relating to the following outcomes for the main comparisons.
-
Neonatal tetanus cases.
-
Neonatal tetanus mortality.
-
Neonatal mortality (all causes).
-
Serious harms.
We used GRADEprofiler (GRADE 2014) to import data from RevMan 2014 in order to create ’Summary of findings’ tables. A summary of the intervention effect and a measure of quality for each of the above outcomes was produced using the GRADE approach. The GRADE approach uses five considerations (study limitations, consistency of effect, imprecision, indirectness and publication bias) to assess the quality of the body of evidence for each outcome. The evidence can be downgraded from 'high quality' by one level for serious (or by two levels for very serious) limitations, depending on assessments for risk of bias, indirectness of evidence, serious inconsistency, imprecision of effect estimates or potential publication bias.
Measures of treatment effect
Dichotomous data
For dichotomous data, we presented results as summary risk ratio with 95% confidence intervals.
Continuous data
No continuous data were analysed in this update. In future updates, we will use the mean difference if outcomes are measured in the same way between trials. We will use the standardised mean difference to combine trials that measure the same outcome, but used different methods.
Unit of analysis issues
Cluster‐randomised trials
There are no included cluster‐randomised trials. If we identify any in the futures, we will include them in the analyses along with individually‐randomised trials. We will adjust their sample sizes using the methods described in the Handbook (Higgins 2011) using an estimate of the intracluster correlation co‐efficient (ICC) derived from the trial (if possible), from a similar trial or from a study of a similar population. If we use ICCs from other sources, we will report this and conduct sensitivity analyses to investigate the effect of variation in the ICC. If we identify both cluster‐randomised trials and individually‐randomised trials, we plan to synthesise the relevant information. We will consider it reasonable to combine the results from both if there is little heterogeneity between the study designs and the interaction between the effect of intervention and the choice of randomisation unit is considered to be unlikely.
We will also acknowledge heterogeneity in the randomisation unit and perform a sensitivity analysis to investigate the effects of the randomisation unit.
Cross‐over trials
This design is generally not adequate and not applicable for the purpose of the present review. Only when the first part of a cross‐over trial is performed during pregnancy and/or concerns vaccine administration during pregnancy, can it be evaluated for inclusion as a parallel group trial.
Other unit of analysis issues
None.
Dealing with missing data
For included studies, we noted levels of attrition. In future updates, if more eligible studies are included, we will explore the impact of including studies with high levels of missing data in the overall assessment of treatment effect by using sensitivity analysis.
For all outcomes, we carried out analyses, as far as possible, on an intention‐to‐treat basis, that is, we attempted to include all participants randomised to each group in the analyses. The denominator for each outcome in each trial was the number randomised minus any participants whose outcomes were known to be missing.
Assessment of heterogeneity
We assessed statistical heterogeneity in each meta‐analysis using the Tau², I² and Chi² statistics. We regarded heterogeneity as substantial if an I² was greater than 30% and either the Tau² was greater than zero, or there was a low P value (less than 0.10) in the Chi² test for heterogeneity. Had we identified substantial heterogeneity (above 30%), we planned to explore it by pre‐specified subgroup analysis.
Assessment of reporting biases
In future updates, if there are 10 or more studies in the meta‐analysis we will investigate reporting biases (such as publication bias) using funnel plots. We will assess funnel plot asymmetry visually. If asymmetry is suggested by a visual assessment, we will perform exploratory analyses to investigate it.
Data synthesis
We carried out statistical analysis using the Review Manager software (RevMan 2014). We used fixed‐effect meta‐analysis for combining data where it was reasonable to assume that studies were estimating the same underlying treatment effect: i.e. where trials were examining the same intervention, and the trials’ populations and methods were judged sufficiently similar.
If there was clinical heterogeneity sufficient to expect that the underlying treatment effects differed between trials, or if substantial statistical heterogeneity was detected, we planned to use random‐effects meta‐analysis to produce an overall summary, if an average treatment effect across trials was considered clinically meaningful. The random‐effects summary would have been treated as the average of the range of possible treatment effects and we planned to discuss the clinical implications of treatment effects differing between trials. If the average treatment effect was not clinically meaningful, we did not intend to combine trials. If we used random‐effects analyses, we planned to present the results as the average treatment effect with 95% confidence intervals, and the estimates of Tau² and I².
Subgroup analysis and investigation of heterogeneity
If we had identified substantial heterogeneity, we planned to investigate it using subgroup analyses and sensitivity analyses. We would have considered whether an overall summary was meaningful, and if it was, used a random‐effects analysis to produce it.
We planned to perform the following subgroup analyses.
-
Doses administered (one, at least two).
-
Trimester of administration.
Subgroup analysis for trimester of administration could not be performed because the included studies did not report these data.
The following outcomes were used in subgroup analyses.
-
Neonatal tetanus cases.
-
Neonatal mortality all causes.
-
Serious harms.
We assessed subgroup differences by interaction tests available within RevMan (RevMan 2014). We reported the results of subgroup analyses quoting the Chi² statistic and P value, and the interaction test I² value.
Sensitivity analysis
We planned to carry out sensitivity analyses to explore the effect of trial quality assessed by concealment of allocation, high attrition rates, or both, with poor‐quality studies being excluded from the analyses in order to assess whether this makes any difference to the overall result. However, due to an insufficient number of included trials and no pooling of data, we did not carry out planned sensitivity analyses in this update.
Results
Description of studies
We included three trials involving 95,752 immunised individuals (including women of reproductive age, pregnant women and children aged one to 14 years) and 9871 infants born to them.
Results of the search
Searches performed for the present update yielded 628 citations. Nine of them (corresponding to eight studies) were retrieved in full form and examined. Only one study (reported in two papers) fulfilled inclusion criteria. The remaining seven were excluded.
Searches performed for the last update (Demicheli 2013), provided 1253 citations. After careful evaluation of title and abstracts, we retrieved 10 full‐text articles and evaluated them for inclusion. None of them satisfied our inclusion criteria and all were excluded.
Searches carried out for the first version of this review in 2005 (Demicheli 2005), identified 1738 potentially relevant studies. Following analysis of the titles and of the available abstracts, 33 studies were retrieved and considered for inclusion. Only two studies met the inclusion criteria; these had been published as full paper articles. The 31 excluded studies were rejected because: they had a study design different from that described in the protocol (28 studies) or dealt with treatments different from those considered for this review (three studies).
Included studies
Types of studies
One trial used individual randomisation (Newell 1966), while the other did not report details of randomisation methods and was included as a quasi‐randomised trial (Black 1980). One trial (Munoz 2014) tried to assess safety issues by using a randomised cross‐over design; thus, only the first part of the study (i.e. that concerning the administration during pregnancy) was considered for inclusion.
Types of interventions
One study assessed the effects of aluminium phosphate adsorbed tetanus toxoid (10LF) against polyvalent influenza vaccine (Newell 1966), one other study (Black 1980) assessed the effects of adsorbed tetanus‐diphtheria toxoid against cholera toxoid. A third trial (Munoz 2014) compared the administration of Tetanus Diphtheria acellular Pertussis vaccine (Tdap) with saline placebo.
Types of participants
The trial that compared tetanus‐diphtheria toxoid with cholera toxoid (Black 1980) included a total of 92,928 healthy women aged at least 15 years, and children aged one to 14 years, who were immunised with one or two doses of the vaccine preparations. Follow‐up was performed on 8641 infants born from this group of women and began nine months after immunisation, to ensure that women pregnant at the time of vaccination had been excluded from the analysis.
In the trial with influenza vaccine as control (Newell 1966), 2776 women aged between 13 and 45 years were enrolled. They were randomised to receive three doses of one vaccine preparation. Of these, 1158 declined to receive any immunisation and their infants were not included in the analysis (n = 601). Also, 136 infants born to the immunised groups were not included in the analysis because they were born before mothers could receive the first dose of the vaccine. Overall, 1182 infants were included in the analysis.
The trial comparing Tetanus Diphtheria acellular Pertussis vaccine (Adacel, Sanofi Pasteur) with saline placebo (Munoz 2014) was carried out on 48 pregnant women, who where randomised 2:1 in order to receive vaccine or placebo within 30th and 32nd weeks of gestation. Their 48 newborns were also included in the analysis. Treatment was then inverted after pregnancy (this phase is not considered in the review).
A total of 9871 births were considered from the three studies combined.
Types of outcome measures
Out of the two trials assessing effectiveness, one used cases of neonatal tetanus, deaths from neonatal tetanus, and non‐tetanus deaths as outcome measures (Newell 1966); the other study presented results in terms of neonatal mortality and mortality on days four to 14 from birth (Black 1980). Follow‐up periods covered the first months of life while the two studies were carried out for five (Newell 1966) and two years (Black 1980), respectively.
The outcomes of interest considered in Munoz 2014 are local and systemic reactions within seven days after immunisation, pregnancy outcomes, serious adverse events.
Date and location of the trials
Newell 1966 was carried out between 1961 and 1966 in the 'Corregimiento of Gachene' 45 km south‐east of Cali, department of Cauca, Columbia. Black 1980 took place between July 1974 and March 1977 in the Matlab area of Bangladesh. Both were sponsored by the Government, but for Newell 1966, the toxoid used was provided by Lederle Laboratoires. Both studies were published in WHO Bulletins. Munoz 2014 was performed between October 2008 and May 2012 in three National Institutes of Health Vaccine Treatment Evaluation Unit in the United States (Houston, Durham and Seattle).
Excluded studies
Altogether 47 studies were excluded for various reasons. The more frequent causes of exclusion were due to the study design (i.e. not a trial), inappropriate outcome, or intervention. For many studies exclusion was due to more than one reason (see Characteristics of excluded studies for further details). Excluded observational studies assessing effectiveness of tetanus toxoid immunisation are presented in Table 2. Results of excluded studies assessing safety outcomes are resumed in Table 1.
| References | Design | Study Population | Treatment | Outcomes | Results |
| Case‐control study. | 54 neonates admitted to hospital diagnosed with NT. 50 | Immunisation with TT, considered immunised if received at least 2 doses of TT during pregnancy, otherwise not. | Incidence of immunisation: cases (1/54), controls (12/49). | Protective effect against NT if at least 2 doses of TT. | |
| Case‐control study. | Cases: 60 children with NT (WHO case definition) reported by cards and hospital record in Bobai country (province of Guangxi, China) to the National Notifiable Disease Reporting System (NNDRS) from 1.1.97 to 30.4.98. Only children with accurate locating information were included. Controls: 60 infants born in the same village as the cases. | Mother of children were immunised with TT. No information about the number of administered doses is reported. | TT immunisation status of the mothers and other information (maternal: age, education level, annual income < 1000 Yuan; infant: gender, order of birth, home delivery; parental knowledge and attitude regarding NT) were assessed by means of a detailed questionnaire given to parents of both cases and controls. TT immunisation history was based only of mother's recall because they were not provided with vaccinal records. Mothers of 7 cases and 17 controls received previously TT. | Receiving of 1 or more of TT was significant protective against NT. Maternal age, education, family income, birth order, parental knowledge, were also significantly associated with NT. | |
| Survey. | 1688 pregnant women. India. | Immunisation with TT, considered immunised if received 2 doses of TT at least 4 weeks apart or a booster dose. Partially immunised, if received 1 dose of TT either during the current pregnancy or in the past 3 years. | Deaths from NT within 3 to 30 days of birth. | Immunisation during the antenatal period is highly protective against occurrence of NT. | |
| Case‐control study. | Infants with clinically‐diagnosed tetanus. 3 controls. Bangladesh. | Immunisation with TT, 2 doses 4 weeks apart, with second dose administered at least 30 days before delivery. | Incidence of immunisation: cases (33/112), controls (122/336). | Immunisation failed to provide the expected high level of protection. | |
| Follow‐up survey. | Women aged 10 to 45 years. Indonesia. | Immunisation with TT, 1 or 2 doses. | Deaths from NT within 3 to 28 days of birth. | Immunisation caused an 85% reduction of NT. | |
| Survey study. | Women aged 15 to 45 years. Thailand. | Immunisation with TT. | Cases of NT. | Immunisation caused a 8 to 10 times reduction of NT. | |
| Surveillance study. | Women from surveillance area. Bangladesh. | Immunised with TT at 6th, 7th, 8th month. Considered immunised if received 2 injections in 1974 or in the 1978 to 1979 programme. | Deaths attributed to NT within 4 to 14 days after birth. | Full immunisation reduced neonatal mortality rates by about one half and mortality rates on days 4 to 14 by about 70%. | |
| Survey. | Children between 1 to 14 years and non‐pregnant women at least 15 years. Bangladesh. | Immunised with cholera toxoid (1 or 2 0.5 mL doses) vs tetanus ‐ diphtheria toxoid (1 or 2 0.5 mL doses). | Deaths attributed to NT within 4 to 14 days after birth. | 2 injections provided significant protection. Protection of 1 dose not significant. | |
| Observational. | Pregnant women from 62 villages in New Guinea (Maprik, Wingei and Wosera areas). A retrospective "history‐taking survey" on children born from 1945 to the time of the study was also performed in the Maprik area. | 3 doses of fluid formalinised TT (Commonwealth Serum Laboratories, Melbourne). The first dose was administered as early as possible in pregnancy, the second 6 weeks later and the third between 6 weeks and 6 months after the second. | Cases of NT observed in children born from mothers who received different number of doses of TT during pregnancy. | 3 doses of formalinised TT administered during pregnancy afforded substantial protection against NT. Immunisation with only 2 doses provided also a significant protection level. No reactions to the vaccine were noticed. |
NT: neonatal tetanus
TT: tetanus toxoid
Risk of bias in included studies
See Figure 1 and Figure 2, for summary of risk of bias.
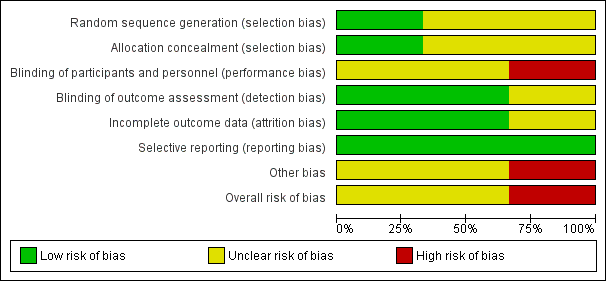
'Risk of bias' graph: review authors' judgements about each risk of bias item presented as percentages across all included studies.
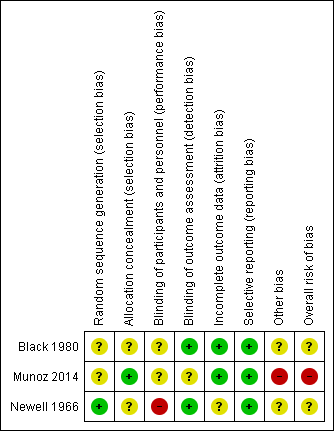
'Risk of bias' summary: review authors' judgements about each risk of bias item for each included study.
Allocation
The generation of random allocation sequence was adequate in one study (Newell 1966); the reports of the other two studies (Black 1980; Munoz 2014) did not give enough details on how the allocation sequence was generated.
Allocation concealment was described and considered to be adequate in two studies (Munoz 2014; Newell 1966), however, the refusal of immunisation from already allocated participants in Newell 1966 could have introduced a certain bias in selection. The remaining study did not report details on the allocation concealment procedures (Black 1980).
Blinding
All trials are reported as having double‐blind design. In Newell 1966, the different colour of vials might have caused a higher refusal rate in intervention group (about 10%). In the report of Black 1980, there is not enough detail in the description of the methods to know whether the vaccine had really been administered under blind conditions. Since the outcome of interest was assessment of the newborns, it is likely that investigators were not aware of the immunisation status of the mothers. Also, in Munoz 2014, there is no information provided to confirm whether the administration of vaccine or placebo was performed under blind conditions.
Incomplete outcome data
In one of the two studies, there were no losses to follow‐up (Black 1980); while the other one (Newell 1966) analysed the data "per‐protocol" and the information given in the report did not allow us to re‐analyse the results on an 'intention‐to‐treat' basis. In Munoz 2014, there were no losses to follow‐up for the outcomes considered in this review.
Selective reporting
Not detected for any of the included trials.
Other potential sources of bias
In one study (Black 1980), mortality between four and 14 days is the only indicator outcome for neonatal tetanus death, and so this study was assessed as being at an unclear risk of other bias. In Newell 1966, it is uncertain whether the method used by birth attendant for cutting and dressing the umbilical cord could have had effect on outcome. Design, dimension and the absence of power calculation and of a hypothesis to challenge make Munoz 2014 inadequate for safety assessment.
Effects of interventions
See: Summary of findings for the main comparison Tetanus toxoid versus influenza vaccine for women to prevent neonatal tetanus; Summary of findings 2 Tetanus diphtheria toxoid immunisation of women of reproductive age compared with cholera toxoid for preventing neonatal mortality; Summary of findings 3 Local and systemic reactions after administration of Tetanus Diphtheria acelluar Pertussis vaccine versus saline placebo in pregnant women
Three trials involving a total of 9871 infants were included.
Comparison: Tetanus toxoid versus influenza vaccine
Primary outcome
Neonatal tetanus deaths
One study (Newell 1966) assessed the effectiveness of tetanus toxoid in preventing neonatal tetanus deaths after one‐dose and two‐ or three‐dose vaccination courses. Altogether, 494 births after a single‐dose vaccination were considered; the risk ratio (RR) of death was 0.57 (95% confidence interval (CI) 0.26 to 1.24), Analysis 1.1.
Six‐hundred and eighty‐eight births were assessed after a two‐ or three‐dose course; the RR of death was 0.02 (95% CI 0.00 to 0.30), Analysis 1.1.
The test for subgroup differences indicated a difference between the two courses of vaccination: Chi² = 5.38, df = 1 (P = 0.02), I² = 81.4%.
Considering the total of 1182 births independently from the number of received doses, the average RR was 0.12 (95% CI 0.00 to 7.88), Analysis 1.1, using a random‐effects model (Heterogeneity: Tau² = 8.03; Chi² = 8.34, df = 1 (P = 0.004); I² = 88%).
All causes of death
Considering deaths for all causes, no significant effect could be observed after one dose of vaccine: the RR was 1.08 (95% CI 0.65 to 1.79; 494 infants), Analysis 1.2; whereas a significant effect was seen with two or three doses of tetanus toxoid (RR 0.31; 95% CI 0.17 to 0.55; 688 infants), Analysis 1.2. This positive association could not be found when the total study population was taken into account (average RR 0.58; 95% CI 0.17 to 1.99; 1182 infants), Analysis 1.2, using a random‐effects model (Heterogeneity: Tau² = 0.71; Chi² = 10.14, df = 1 (P = 0.001); I² = 90%).
The test for subgroup differences indicated a difference between the two courses of vaccination: Chi² = 10.02, df = 1 (P = 0.002), I² = 90.0%.
Tetanus cases
One‐thousand, one‐hundred and eighty‐two births were analysed in order to assess the effects of at least a single dose of tetanus toxoid on cases of neonatal tetanus. The RR was 0.20 (95% CI 0.10 to 0.40); Analysis 1.3.
Non pre‐specified outcomes
Death from non‐neonatal tetanus causes
The same study (Newell 1966) did not detect any effects on causes of death other than tetanus after one dose (RR 2.14, 95% CI 0.97 to 4.76; 494 infants), Analysis 1.4; and after two or three doses (RR 0.75, 95% CI 0.38 to 1.47; 688 infants), Analysis 1.4. The average RR considering the total population was 1.24 (95% CI 0.44 to 3.47; 1182 infants), Analysis 1.4, using a random‐effects model (Heterogeneity: Tau² = 0.41; Chi² = 3.89, df = 1 (P = 0.05); I² = 74%).
The test for subgroup differences indicated no difference between the two courses of vaccination: Chi² = 3.89, df = 1 (P = 0.05), I² = 74.3%.
Comparison: Tetanus diphtheria toxoid versus cholera toxoid
Primary outcome
Neonatal mortality
One study (Black 1980), considered the effectiveness of tetanus diphtheria toxoid in preventing neonatal mortality after one or two doses up to 32 months from vaccination. Eight‐thousand, six‐hundred and forty‐one births were assessed and the RR accounted for 0.68 (95% CI 0.56 to 0.82); Analysis 2.1.
Four to 14 days neonatal mortality
The same study (Black 1980) considered the effectiveness on four to 14 days neonatal mortality. The average RR was 0.38 (95% CI 0.27 to 0.55); Analysis 2.2.
Comparison: Tetanus diphtheria acellular pertussis vaccine versus placebo
Primary outcome
Serious adverse events
None of the serious adverse events observed in mothers and children (Munoz 2014) was judged to be attributable to the effect of vaccination. Gestational age, birth weight, Apgar score, and neonatal complications did not differ significantly among exposed and unexposed children.
Secondary outcomes
Pain at the injection site was experienced more frequently from pregnant women immunised with Tetanus diphtheria acellular pertussis vaccine than from those who received placebo (RR 5.68, 95% CI 1.54 to 20.94); Analysis 3.1. Occurrence of other local (erythema, induration) and systemic (fever, headache, malaise, myalgia) reactions within seven days after immunisation was not statistically different between vaccine and placebo recipients. Reported local and systemic reactions were mainly of mild or moderate intensity.
Discussion
For this systematic review only two experimental studies assessing the effectiveness of tetanus toxoid in preventing neonatal tetanus have been found (Black 1980; Newell 1966). The size of the population included in the studies and the consistency of the results allow us to draw some conclusions. One study exclusively randomised non‐pregnant women (Black 1980). The main outcomes were measured on infants born to a subset of those randomised women who became pregnant during the course of the studies. One small trial (Munoz 2014) reported local and systemic reactions observed after administration of tetanus diphtheria acellular pertussis vaccine to pregnant women.
Summary of main results
There is a moderate level of evidence that the effectiveness of vaccination with tetanus toxoid in preventing deaths from neonatal tetanus appears to be high when two or more doses are administered. Tetanus toxoid is also effective in preventing cases of neonatal tetanus (moderate level of evidence). The vaccination does not exert effects on causes of death other than tetanus, even when two or three doses have been administered (moderate level of evidence).
The two studies apparently show differences in the estimates of effect, but these differences are understandable when considering that the study showing lower effectiveness (Black 1980), was assessing a different intervention (vaccination with only one or two doses) and a less specific outcome (all causes neonatal deaths occurring four to 14 days from birth, low level of evidence).
In the interpretation of the results, it must be also considered that one study (Newell 1966), had a third arm containing participants who refused vaccination and that data from this arm were not included in the analysis.
Because of the limited number of eligible experimental studies included in this review, we decided to carry out an extended search in order to retrieve all the available comparative studies on this topic. The same databases were explored in order to identify cohort, case‐control studies and other non‐randomised study designs. Seven further studies were identified (four surveys comparing the disease incidence before and after the introduction of the immunisation campaign, two case‐control studies and a cohort study). The characteristics of these studies are summarised in additional Table 2. Altogether 37,352 births were surveyed by the prospective studies and 552 participants were included in the case‐control studies. All the studies but one confirmed the existence of a significant protective effect of an immunisation course of at least two doses of tetanus toxoid on the incidence of neonatal tetanus.
Adverse effects from non‐experimental studies
Among the excluded studies, we identified two studies evaluating the safety of tetanus toxoid. One was carried out in order to evaluate of the safety of different types of vaccine's adjuvants (MacLennan 1965) and the second was a case‐control study assessing the association between vaccination and congenital anomalies (Silveira 1995). In one further study (Salama 2009), pregnant women experienced pain at injection site more frequently after combined tetanus diphtheria administration than after tetanus toxoid alone. Their characteristics are described in additional Table 1.
Overall completeness and applicability of evidence
In conclusion, this review shows that vaccination of women with tetanus toxoid is effective in preventing neonatal tetanus cases and deaths specifically caused by neonatal tetanus. Even if the evidence is derived mainly from a single study, this appears to be solid and consistent with the findings of all other comparative studies presently available.
Quality of the evidence
Two trials performed on 9823 newborns assessing effectiveness of vaccination and one trial including 48 pregnant women assessing the occurrence of local and systemic following vaccine administration were included in the review. A certain degree of bias in selection could affect effectiveness estimates in Newell 1966, as some participant refused to participate after allocation and during administration (labels on the vials were of different colours and it was noticed early on in the trial that injection with one of the two preparations was more painful). For these reasons (downgrading of Design & Implementation due to selection bias), the GRADE level of evidence relative to the effect estimate of two or three doses of tetanus toxoid in preventing neonatal tetanus deaths, all causes of death within the first 30 days of life and of at least one dose of toxoid in preventing neonatal tetanus cases is moderate. GRADE level relative to the effect estimate of one tetanus toxoid dose in preventing neonatal tetanus deaths and all causes of death within the first 30 day of life is low because there is further downgrading due to imprecision. In Black 1980, information about allocation and blinding in the report were insufficient (Design & Implementation, selection bias); authors used an indirect outcome for neonatal tetanus mortality (indirectness). The GRADE level of evidence for the effect estimate of tetanus diphtheria immunisation during pregnancy in preventing neonatal mortality is low. Munoz 2014 was performed on a limited number of participants (48) and was not powered to test any specific hypothesis and not suitable for detecting rare vaccine‐related events (imprecision). Only the first part of the study has been included in analysis and considered as a parallel group trial. The GRADE level of effect estimates for local and systemic reactions is moderate.
The reasons for the low performance presently achieved by the vaccination campaigns should be sought outside the field of vaccine efficacy and are probably related to organisational and quality issues. Our review did not find evidence on the main factors that can have negative influence on the impact of the immunisation practice and that may justify the present low level of performance of the campaign (Dietz 1996; WHO 1999).
Potential biases in the review process
Future research should concentrate on evaluating factors that may have a negative impact on the immunisation practice and look for possible interventions in order to improve the performance of the campaign.
Agreements and disagreements with other studies or reviews
Our findings and conclusions are in agreement with those of a recently published systematic review (Blencowe 2010) evaluating trials and observational studies. However, the authors of this review did perform a meta‐analysis based on neonatal tetanus death cases reported in Newell 1966 (a randomised controlled trial) and Gupta 1998 (a cohort study). Black 1980 was excluded because the proxy outcome used in this trial (neonatal mortality between four and 14 days of life) was judged too unspecific.

'Risk of bias' graph: review authors' judgements about each risk of bias item presented as percentages across all included studies.

'Risk of bias' summary: review authors' judgements about each risk of bias item for each included study.

Comparison 1 Tetanus toxoid versus influenza vaccine, Outcome 1 Neonatal tetanus deaths.

Comparison 1 Tetanus toxoid versus influenza vaccine, Outcome 2 All causes of death.

Comparison 1 Tetanus toxoid versus influenza vaccine, Outcome 3 Neonatal tetanus cases.

Comparison 1 Tetanus toxoid versus influenza vaccine, Outcome 4 Deaths from non‐neonatal tetanus causes (not prespecified).

Comparison 2 Tetanus diphtheria toxoid versus cholera toxoid, Outcome 1 Neonatal mortality.

Comparison 2 Tetanus diphtheria toxoid versus cholera toxoid, Outcome 2 Four to 14 days neonatal mortality.

Comparison 3 Tetanus Diphtheria Acellular pertussis versus saline placebo local and systemic reactions, Outcome 1 Injection site reactions.

Comparison 3 Tetanus Diphtheria Acellular pertussis versus saline placebo local and systemic reactions, Outcome 2 Systemic reactions.
| Tetanus toxoid versus influenza vaccine for women to prevent neonatal tetanus | ||||||
| Patient or population: women aged between 13 and 45 years. Setting: rural community | ||||||
| Outcomes | Illustrative comparative risks* (95% CI) | Relative effect | No of participants | Quality of the evidence | Comments | |
| Assumed risk | Corresponding risk | |||||
| Control | Tetanus toxoid versus influenza vaccine | |||||
| Neonatal tetanus deaths ‐ 1 dose | Study population | RR 0.57 | 494 | ⊕⊕⊝⊝ | ||
| 70 per 1000 | 40 per 1000 | |||||
| Moderate | ||||||
| 70 per 1000 | 40 per 1000 | |||||
| Neonatal tetanus deaths ‐ 2 or 3 doses | Study population | RR 0.02 | 688 | ⊕⊕⊕⊝ | ||
| 78 per 1000 | 2 per 1000 | |||||
| Moderate | ||||||
| 78 per 1000 | 2 per 1000 | |||||
| All causes of deaths ‐ 1 dose | Study population | RR 1.08 | 494 | ⊕⊕⊝⊝ | About 57% of non‐tetanus deaths were observed in the first 7 days of life. | |
| 104 per 1000 | 112 per 1000 | |||||
| Moderate | ||||||
| 104 per 1000 | 112 per 1000 | |||||
| All causes of deaths ‐ 2 or 3 doses | Study population | RR 0.31 | 688 | ⊕⊕⊕⊝ | ||
| 133 per 1000 | 41 per 1000 | |||||
| Moderate | ||||||
| 133 per 1000 | 41 per 1000 | |||||
| Neonatal tetanus cases ‐ Any dose | Study population | RR 0.2 | 1182 | ⊕⊕⊕⊝ | Only 3 non fatal tetanus cases observed (all in the control group). | |
| 79 per 1000 | 16 per 1000 | |||||
| Moderate | ||||||
| 79 per 1000 | 16 per 1000 | |||||
| *The basis for the assumed risk (e.g. the median control group risk across studies) is provided in footnotes. The corresponding risk (and its 95% confidence interval) is based on the assumed risk in the comparison group and the relative effect of the intervention (and its 95% CI). | ||||||
| GRADE Working Group grades of evidence | ||||||
| 1 Design & Implementation (selection bias): Different aspect of the vials used for intervention and control vaccine could have introduced a certain bias in selection. | ||||||
| Tetanus diphtheria toxoid immunisation of women of reproductive age compared with cholera toxoid for preventing neonatal mortality | ||||||
| Patient or population: women of reproductive age ≥ 15 years. Intervention: tetanus diphtheria toxoid versus cholera toxoid. | ||||||
| Outcomes | Illustrative comparative risks* (95% CI) | Relative effect | No of participants | Quality of the evidence | Comments | |
| Assumed risk | Corresponding risk | |||||
| Control | Tetanus diphtheria toxoid | |||||
| Neonatal mortality in the first 28 days of life | Study population | RR 0.68 | 8641 | ⊕⊕⊝⊝ | ||
| 60 per 1000 | 41 per 1000 | |||||
| Moderate | ||||||
| 60 per 1000 | 41 per 1000 | |||||
| Neonatal mortality between day 4‐14 of life | Study population | RR 0.38 | 8641 | ⊕⊕⊝⊝ | ||
| 25 per 1000 | 10 per 1000 | |||||
| Moderate | ||||||
| 25 per 1000 | 9 per 1000 | |||||
| *The basis for the assumed risk (e.g. the median control group risk across studies) is provided in footnotes. The corresponding risk (and its 95% confidence interval) is based on the assumed risk in the comparison group and the relative effect of the intervention (and its 95% CI). | ||||||
| GRADE Working Group grades of evidence | ||||||
| 1 Design & Implementation (selection bias): Even if several important methodological details are missing, the possibility of a certain bias in selection could not be totally excluded. | ||||||
| Local and systemic reactions after administration of Tetanus Diphtheria acelluar Pertussis vaccine versus saline placebo in pregnant women | ||||||
| Patient or population: patients with local and systemic reactions | ||||||
| Outcomes | Illustrative comparative risks* (95% CI) | Relative effect | No of participants | Quality of the evidence | Comments | |
| Assumed risk | Corresponding risk | |||||
| Saline placebo | Tetanus Diphtheria acellular Pertussis vaccine | |||||
| Injection site reactions ‐ pain at injection site | Study population | RR 5.68 | 48 | ⊕⊕⊕⊝ | ||
| 133 per 1000 | 757 per 1000 | |||||
| Moderate | ||||||
| 133 per 1000 | 755 per 1000 | |||||
| Injection site reactions ‐ erythema ‐ redness | Study population | RR 1.36 | 48 | ⊕⊕⊕⊝ | ||
| 67 per 1000 | 91 per 1000 | |||||
| Moderate | ||||||
| 67 per 1000 | 91 per 1000 | |||||
| Injection site reactions ‐ induration ‐ swelling | Study population | RR 3.29 | 48 | ⊕⊕⊕⊝ | ||
| 0 per 1000 | 0 per 1000 | |||||
| Moderate | ||||||
| 0 per 1000 | 0 per 1000 | |||||
| Systemic reactions ‐ fever (oral temperature ≥ 38°C) | Study population | RR 1.41 | 48 | ⊕⊕⊕⊝ | ||
| 0 per 1000 | 0 per 1000 | |||||
| Moderate | ||||||
| 0 per 1000 | 0 per 1000 | |||||
| Systemic reactions ‐ headache | Study population | RR 1.67 | 48 | ⊕⊕⊕⊝ | ||
| 200 per 1000 | 334 per 1000 | |||||
| Moderate | ||||||
| 200 per 1000 | 334 per 1000 | |||||
| Systemic reactions ‐ malaise | Study population | RR 0.91 | 48 | ⊕⊕⊕⊝ | ||
| 133 per 1000 | 121 per 1000 | |||||
| Moderate | ||||||
| 133 per 1000 | 121 per 1000 | |||||
| Systemic reactions ‐ myalgia | Study population | RR 5.18 | 48 | ⊕⊕⊕⊝ | ||
| 0 per 1000 | 0 per 1000 | |||||
| Moderate | ||||||
| 0 per 1000 | 0 per 1000 | |||||
| *The basis for the assumed risk (e.g. the median control group risk across studies) is provided in footnotes. The corresponding risk (and its 95% confidence interval) is based on the assumed risk in the comparison group and the relative effect of the intervention (and its 95% CI). | ||||||
| GRADE Working Group grades of evidence | ||||||
| 1 Imprecision: Small sample size. The study was not powered to test any specific hypotheses. | ||||||
| References | Design | Study Population | Treatment | Outcomes | Results |
| Case‐control study. | 54 neonates admitted to hospital diagnosed with NT. 50 | Immunisation with TT, considered immunised if received at least 2 doses of TT during pregnancy, otherwise not. | Incidence of immunisation: cases (1/54), controls (12/49). | Protective effect against NT if at least 2 doses of TT. | |
| Case‐control study. | Cases: 60 children with NT (WHO case definition) reported by cards and hospital record in Bobai country (province of Guangxi, China) to the National Notifiable Disease Reporting System (NNDRS) from 1.1.97 to 30.4.98. Only children with accurate locating information were included. Controls: 60 infants born in the same village as the cases. | Mother of children were immunised with TT. No information about the number of administered doses is reported. | TT immunisation status of the mothers and other information (maternal: age, education level, annual income < 1000 Yuan; infant: gender, order of birth, home delivery; parental knowledge and attitude regarding NT) were assessed by means of a detailed questionnaire given to parents of both cases and controls. TT immunisation history was based only of mother's recall because they were not provided with vaccinal records. Mothers of 7 cases and 17 controls received previously TT. | Receiving of 1 or more of TT was significant protective against NT. Maternal age, education, family income, birth order, parental knowledge, were also significantly associated with NT. | |
| Survey. | 1688 pregnant women. India. | Immunisation with TT, considered immunised if received 2 doses of TT at least 4 weeks apart or a booster dose. Partially immunised, if received 1 dose of TT either during the current pregnancy or in the past 3 years. | Deaths from NT within 3 to 30 days of birth. | Immunisation during the antenatal period is highly protective against occurrence of NT. | |
| Case‐control study. | Infants with clinically‐diagnosed tetanus. 3 controls. Bangladesh. | Immunisation with TT, 2 doses 4 weeks apart, with second dose administered at least 30 days before delivery. | Incidence of immunisation: cases (33/112), controls (122/336). | Immunisation failed to provide the expected high level of protection. | |
| Follow‐up survey. | Women aged 10 to 45 years. Indonesia. | Immunisation with TT, 1 or 2 doses. | Deaths from NT within 3 to 28 days of birth. | Immunisation caused an 85% reduction of NT. | |
| Survey study. | Women aged 15 to 45 years. Thailand. | Immunisation with TT. | Cases of NT. | Immunisation caused a 8 to 10 times reduction of NT. | |
| Surveillance study. | Women from surveillance area. Bangladesh. | Immunised with TT at 6th, 7th, 8th month. Considered immunised if received 2 injections in 1974 or in the 1978 to 1979 programme. | Deaths attributed to NT within 4 to 14 days after birth. | Full immunisation reduced neonatal mortality rates by about one half and mortality rates on days 4 to 14 by about 70%. | |
| Survey. | Children between 1 to 14 years and non‐pregnant women at least 15 years. Bangladesh. | Immunised with cholera toxoid (1 or 2 0.5 mL doses) vs tetanus ‐ diphtheria toxoid (1 or 2 0.5 mL doses). | Deaths attributed to NT within 4 to 14 days after birth. | 2 injections provided significant protection. Protection of 1 dose not significant. | |
| Observational. | Pregnant women from 62 villages in New Guinea (Maprik, Wingei and Wosera areas). A retrospective "history‐taking survey" on children born from 1945 to the time of the study was also performed in the Maprik area. | 3 doses of fluid formalinised TT (Commonwealth Serum Laboratories, Melbourne). The first dose was administered as early as possible in pregnancy, the second 6 weeks later and the third between 6 weeks and 6 months after the second. | Cases of NT observed in children born from mothers who received different number of doses of TT during pregnancy. | 3 doses of formalinised TT administered during pregnancy afforded substantial protection against NT. Immunisation with only 2 doses provided also a significant protection level. No reactions to the vaccine were noticed. | |
| NT: neonatal tetanus | |||||
| References | Study design | Study population | Intervention | Safety outcomes | Results |
| 2 studies are reported in this paper: | Both studies were performed in New Guinea on indigenous populations. | a) TT prepared by Parke Davis & co with different adjuvants and administered in different doses (Drakeol, 1 dose vs H ‐ 24, 1 dose vs AlPO4, 2 doses vs none, 3 doses) or TT prepared by the Commonwealth Serum Laboratories without adjuvant, 3 doses. | a) Swelling (severe or no tender). | Although oil‐adjuvated preparations provide longer persistence of antitoxin and require to be administered only once, they caused frequently severe side‐effects. The Al‐adjuvated preparations, administered in 2 doses, appeared to be the best way at the time of the study to prevent the occurrence of NNT. | |
| Case‐control study. | Cases (n = 34,293): newborn with congenital malformation. The 10 most frequent in South America were considered. | Immunisation of the mothers with TT during pregnancy. | Cleft lip, pes equinovarus, postaxial polydactyly, hip subluxation, hemangioma, periauricular tag, fistula auris, pigmented naevus, other skin defects, multiple malformed. | No association for each of the examined factors was found. | |
| RCT. | Healthy pregnant Egyptian women at about 20 weeks of gestational age (n = 122). | Participants were randomised to : a) 0.5 mL of TT (TT, 5Lf, n = 62). b) 0.5 mL of combined tetanus and reduced diphtheria (Td, 5 Lf of each toxoids, n = 60). First dose at 20 to 26 weeks of pregnancy, 2nd and 3rd administered respectively 8 and 4 weeks apart. | Systemic (fever, malaise, headache, | Pain at the site of injection was complained more frequently in Td group after both first (P < 0.01) and second (P < 0.04) dose. | |
| Retrospective Cohort study | ‐ Exposed cohort: 138 women aged between 12 and 45 years with documented Tdap immunisation during pregnancy. They were identified among the 162,448 pregnancies occurred within the Intermountain Healthcare facilities (Salt Lake, Utah) between May 2005 and August 2009. ‐ Not exposed cohort: 552 randomly selected women from the same population (without documented vaccination during pregnancy). | In the exposed cohort Tdap immunisation occurred more frequently within 1st (63%), than during 2nd (17%) and 3rd (20%) pregnancy trimester. Immunisation with Tdap occurred mainly as prophylactic measure in consequence of wound, trauma or routine health supervision. | Spontaneous or elective abortion Stillbirth Preterm delivery (<37 weeks) Gestational age Birth weight Congenital anomalies | Incidence of spontaneous or elective abortion was no greater in Tdap cases than in controls. No significant differences in preterm delivery, gestational age, or birth weight between groups. Frequence of ICD‐9‐CM codes diagnosis for congenital anomalies reported among children born to Tdap exposed women do not differ significantly from that observed among born to not Tdap exposed women. | |
| Lf: limit of flocculation units | |||||
| Outcome or subgroup title | No. of studies | No. of participants | Statistical method | Effect size |
| 1 Neonatal tetanus deaths Show forest plot | 1 | Risk Ratio (M‐H, Fixed, 95% CI) | Subtotals only | |
| 1.1 One dose | 1 | 494 | Risk Ratio (M‐H, Fixed, 95% CI) | 0.57 [0.26, 1.24] |
| 1.2 Two or three doses | 1 | 688 | Risk Ratio (M‐H, Fixed, 95% CI) | 0.02 [0.00, 0.30] |
| 2 All causes of death Show forest plot | 1 | Risk Ratio (M‐H, Fixed, 95% CI) | Subtotals only | |
| 2.1 One dose | 1 | 494 | Risk Ratio (M‐H, Fixed, 95% CI) | 1.08 [0.65, 1.79] |
| 2.2 Two or three doses | 1 | 688 | Risk Ratio (M‐H, Fixed, 95% CI) | 0.31 [0.17, 0.55] |
| 3 Neonatal tetanus cases Show forest plot | 1 | Risk Ratio (M‐H, Fixed, 95% CI) | Subtotals only | |
| 3.1 Any dose | 1 | 1182 | Risk Ratio (M‐H, Fixed, 95% CI) | 0.20 [0.10, 0.40] |
| 4 Deaths from non‐neonatal tetanus causes (not prespecified) Show forest plot | 1 | Risk Ratio (M‐H, Fixed, 95% CI) | Subtotals only | |
| 4.1 One dose | 1 | 494 | Risk Ratio (M‐H, Fixed, 95% CI) | 2.14 [0.97, 4.76] |
| 4.2 Two or three doses | 1 | 688 | Risk Ratio (M‐H, Fixed, 95% CI) | 0.75 [0.38, 1.47] |
| Outcome or subgroup title | No. of studies | No. of participants | Statistical method | Effect size |
| 1 Neonatal mortality Show forest plot | 1 | 8641 | Risk Ratio (M‐H, Fixed, 95% CI) | 0.68 [0.56, 0.82] |
| 2 Four to 14 days neonatal mortality Show forest plot | 1 | 8641 | Risk Ratio (M‐H, Fixed, 95% CI) | 0.38 [0.27, 0.55] |
| Outcome or subgroup title | No. of studies | No. of participants | Statistical method | Effect size |
| 1 Injection site reactions Show forest plot | 1 | Risk Ratio (M‐H, Fixed, 95% CI) | Subtotals only | |
| 1.1 Pain at injection site | 1 | 48 | Risk Ratio (M‐H, Fixed, 95% CI) | 5.68 [1.54, 20.94] |
| 1.2 Erythema ‐ redness | 1 | 48 | Risk Ratio (M‐H, Fixed, 95% CI) | 1.36 [0.15, 12.05] |
| 1.3 Induration ‐ swelling | 1 | 48 | Risk Ratio (M‐H, Fixed, 95% CI) | 3.29 [0.18, 60.05] |
| 1.4 Any injection site symptoms | 1 | 48 | Risk Ratio (M‐H, Fixed, 95% CI) | 3.94 [1.41, 11.01] |
| 2 Systemic reactions Show forest plot | 1 | Risk Ratio (M‐H, Fixed, 95% CI) | Subtotals only | |
| 2.1 Fever (oral temperature ≥ 38°C) | 1 | 48 | Risk Ratio (M‐H, Fixed, 95% CI) | 1.41 [0.06, 32.78] |
| 2.2 Headache | 1 | 48 | Risk Ratio (M‐H, Fixed, 95% CI) | 1.67 [0.54, 5.11] |
| 2.3 Malaise | 1 | 48 | Risk Ratio (M‐H, Fixed, 95% CI) | 0.91 [0.19, 4.43] |
| 2.4 Myalgia | 1 | 48 | Risk Ratio (M‐H, Fixed, 95% CI) | 5.18 [0.30, 88.02] |
| 2.5 Any systemic symptoms | 1 | 48 | Risk Ratio (M‐H, Fixed, 95% CI) | 1.82 [0.60, 5.51] |