Naftidrofurilo para la demencia
Resumen
Antecedentes
La demencia es un trastorno cerebral caracterizado por la pérdida permanente de las funciones cognitivas más importantes. Para la demencia se prescriben varios tratamientos con vasodilatadores. El naftidrofurilo es uno de dichos fármacos y según los informes, mejora significativamente los síntomas clínicos. La eficacia y los posibles eventos adversos del naftidrofurilo se deben revisar sistemáticamente y evaluar críticamente para informar la práctica clínica y orientar la búsqueda continua de nuevos regímenes de tratamiento.
Objetivos
Evaluar la eficacia y la seguridad del naftidrofurilo en el tratamiento de la demencia.
Métodos de búsqueda
Se hicieron búsquedas en ALOIS: Registro Especializado del Grupo Cochrane de Demencia y Trastornos Cognitivos (Cochrane Dementia & Cognitive Improvement Group), el 11 de enero de 2011 con los términos: naftidrofuryl. ALOIS contiene registros de ensayos clínicos de las principales bases de datos de atención sanitaria (MEDLINE, EMBASE, PsycINFO, LILACS y CINAHL), registros de ensayos (como ClinicalTrials.gov) y fuentes de literatura gris.
Criterios de selección
Se consideraron elegibles para la inclusión los ensayos aleatorios controlados con placebo en los cuales los pacientes con demencia fueron tratados con naftidrofurilo.
Obtención y análisis de los datos
Dos revisores seleccionaron de forma independiente los ensayos para su inclusión, evaluaron su calidad y extrajeron los datos mediante formularios de extracción de datos. Los dominios evaluados para el riesgo del sesgo fueron la generación de la secuencia, la ocultación de la asignación, el cegamiento, los datos de resultado incompletos y el informe selectivo de resultados. Para informar los datos dicotómicos, se utilizaron los odds ratios (OR), y las diferencias de medias (DM) y las diferencias de medias estandarizadas (DME) se utilizaron para los datos continuos. La heterogeneidad estadística se evaluó mediante la estadística I2.
Resultados principales
Se identificaron nueve ensayos controlados aleatorios que incluyeron a 847 pacientes con enfermedad de Alzheimer, demencia vascular, demencia mixta, demencia senil y demencia no especificada. Se encontraron efectos beneficiosos en el rendimiento funcional y en la conducta (‐1,04 puntos estandarizados; IC del 95%: ‐1,73 a ‐0,35; p = 0,003) con un alto nivel de heterogeneidad (I2= 54%), y en el estado de ánimo (‐0,80 puntos estandarizados; IC del 95%: ‐1,26 a ‐0,34; p = 0,0006) de los pacientes con demencia, así como en la función cognitiva (‐0,36 puntos estandarizados; IC del 95%: ‐0,71 a ‐0,02; p = 0,04). Sin embargo, estos efectos beneficiosos no se confirmaron mediante medidas clínicas globales. Se encontró que el naftidrofurilo es bien tolerado por los pacientes con demencia.
Conclusiones de los autores
La administración oral del naftidrofurilo es bien tolerada por los pacientes con demencia. Pruebas de baja calidad muestran que los pacientes con demencia se pueden beneficiar con el uso del naftidrofurilo en cuanto al rendimiento, la conducta, la cognición y el estado de ánimo. Sin embargo, el efecto beneficioso sobre la impresión global es inconsistente y poco convincente.
PICOs
Resumen en términos sencillos
Los pacientes con demencia se pueden beneficiar con el naftidrofurilo
La demencia se caracteriza por el deterioro crónico, global e irreversible de las funciones cognitivas incluida la memoria, la función ejecutiva y la personalidad. Tiene una repercusión grave sobre la calidad de vida de los pacientes. El naftidrofurilo se ha indicado como un tratamiento para la demencia que puede funcionar al aumentar el suministro de oxígeno al tejido cerebral. Las pruebas de baja calidad muestran que el naftidrofurilo puede tener efectos beneficiosos en cuanto al rendimiento, la conducta, la cognición y el estado de ánimo de los pacientes con demencia. Sin embargo, estos efectos beneficiosos no logran traducirse en cambios confiables clínicamente detectables. El naftidrofurilo administrado por vía oral es bien tolerado.
Conclusiones de los autores
Antecedentes
La demencia se caracteriza por el deterioro crónico, global e irreversible de la función cerebral. Habitualmente, da lugar a pérdida de la memoria (inicialmente de eventos recientes), pérdida de la función ejecutiva (como la capacidad para tomar decisiones o tareas complejas en secuencia) y cambios en la personalidad. Actualmente, se calcula que 24 300 000 personas en todo el mundo presentan demencia, con 4 600 000 nuevos casos de demencia cada año (Ferri 2005). Se estima que la enfermedad de Alzheimer y la demencia vascular (que incluye la demencia mixta), dos subtipos principales, representan entre el 35% y el 50% de la demencia y se calcula que la demencia con cuerpos de Lewy representa el 20% de la demencia en las personas de edad avanzada, lo que varía según los factores geográficos, culturales y raciales (Farrer 2001, Ikeda 2001, Lobo 2000, McKeith 2000, Skoog 1993, Van Duijn 1996). Existen muchas otras causas de demencia, todas relativamente poco frecuentes. El criterio utilizado con más frecuencia para el diagnóstico de la demencia es el DSM‐IV (Diagnostic and Statistical Manual for Mental Disorders, American Psychiatric Association). Los efectos de la demencia son multidimensionales, con implicaciones generalizadas en la funcionalidad física, mental y social. La demencia aumenta enormemente la carga para los cuidadores, los médicos, los recursos de salud y la presión sobre la investigación para encontrar tratamientos eficaces, no solo en Europa o en los países industrializados (Grimley Evans 1997), sino en todo el mundo: se proyecta que para el 2040, el 71% de las 81 100 000 personas con demencia pertenecerán a los países en vías de desarrollo (Ferri 2005).
La demencia senil de tipo Alzheimer (DSTA), o enfermedad de Alzheimer, es el subtipo más frecuente de demencia y su patogénesis se dilucida cada vez más. El segundo tipo más frecuente de demencia es la demencia vascular, definida como una disminución sutil y progresiva de la memoria y la funcionalidad cognitiva causada por una reducción crónica del flujo sanguíneo al cerebro, generalmente, como resultado de un accidente cerebrovascular o una serie de accidentes cerebrovasculares (Roman 2003). Sin embargo, una proporción significativa de la demencia está representada por la demencia mixta tipo Alzheimer y vascular. Por lo tanto, el aumento o la mejoría del flujo sanguíneo cerebral es un enfoque posible para el tratamiento (al menos de los síntomas).
Para la demencia, se prescriben varios tratamientos con vasodilatadores y uno de estos es el naftidrofurilo o nafronil (comercializado por Lipha como Praxilene, también llamado Gevatran en algunos ensayos clínicos, también comercializado actualmente como Dusodril Retard por Merck) que se ha utilizado en Europa desde 1968. Se administra por vía oral y la dosis habitual es 100 a 200 mg tres veces al día para la vasculopatía periférica y 100 mg tres veces al día para la vasculopatía cerebral. En 1999, de la cantidad total de Praxilene dispensado para todas las indicaciones, el 54,7% se utilizó en Francia, el 36,5% en otros países europeos, el 1,3% en América del Sur, el 2,7% en Asia (excepto Japón) y el 4,8% en África, contra un total de cerca de 3 500 000 prescripciones.
El naftidrofurilo es el oxalato ácido de N‐dietilaminoetil beta (naftil‐1) beta tetra hidrofuril isobutirato. Actúa sobre el metabolismo energético en el músculo y el cerebro, principalmente en afecciones de hipoxia o isquemias totales o parciales. Los efectos farmacológicos del naftidrofurilo incluyen el aumento de la disponibilidad de oxígeno y mediadores energéticos en los tejidos; la reducción de la tasa de glucólisis y la captación de glucosa de la sangre; la alteración de las actividades enzimáticas mitocondriales; y la disminución de la actividad de la acetilcolinesterasa en hipoxia (Agnoli 1985). Los efectos secundarios que se han observado incluyen náuseas, dolor epigástrico, erupción cutánea, hepatitis e insuficiencia hepática, y después de la inyección, hipotensión, arritmias y convulsiones.
Una revisión sistemática Cochrane del naftidrofurilo intravenoso no encontró pruebas claras que indicaran que el naftidrofurilo intravenoso a corto plazo tuviera efectos beneficiosos en los pacientes con isquemia crítica de las extremidades y los autores también señalan que el tratamiento se retiró para las enfermedades arteriales periféricas en 1995 debido a los efectos secundarios informados (Smith 2008). Además, Leonardi‐Bee 2007 encontró que no había pruebas suficientes para apoyar el uso del naftidrofurilo en pacientes con accidente cerebrovascular agudo. Sin embargo, De Backer 2005 encontró que el naftidrofurilo mejoró significativamente la distancia de caminata de los pacientes con claudicación intermitente. Aunque la acción vasodilatadora del fármaco lo convierte en un tratamiento relativamente poco controvertido en la vasculopatía periférica (a pesar de los efectos secundarios), se considera que los médicos, los elaboradores de políticas y los usuarios finales podrían beneficiarse de esta tercera revisión del naftidrofurilo que busca pruebas del efecto para su uso en el deterioro cognitivo (aunque no está restringido a la demencia vascular sola) y también intenta evaluar los efectos secundarios.
Objetivos
El objetivo primario de esta revisión es determinar si el naftidrofurilo es eficaz en el tratamiento de la demencia. El objetivo secundario es determinar en qué medida su uso es seguro.
Métodos
Criterios de inclusión de estudios para esta revisión
Tipos de estudios
Se consideraron elegibles para inclusión todos los ensayos aleatorios controlados con placebo de naftidrofurilo para el tratamiento de la demencia. Se planificó utilizar solo los datos del primer período de cualquier ensayo cruzado (crossover) incluido.
Tipos de participantes
Estudios que incluyan participantes con un diagnóstico primario de demencia de cualquier gravedad. Se reconoció que, debido a la antigüedad de algunos de los estudios, no se habrían utilizado los criterios de diagnóstico actuales. Sin embargo, se consideró que un estudio podría valorarse para la inclusión si los participantes habían sido diagnosticados con demencia mediante criterios contemporáneos aceptados. Se excluyeron los ensayos que incluían participantes que no presentaban características de deterioro cognitivo. También se excluyeron las demencias de etiología infecciosa, tóxica o traumática.
Tipos de intervenciones
Naftidrofurilo administrado por cualquier vía por más de una dosis.
Tipos de medida de resultado
Resultados primarios
-
Impresión clínica global.
-
Eventos adversos.
Resultados secundarios
-
Rendimiento funcional (actividades cotidianas) y trastornos conductuales.
-
Estado de ánimo.
-
Función cognitiva.
-
Dependencia.
-
Muerte.
-
Retiro del ensayo (debido a los efectos adversos).
-
Calidad de vida.
-
Efecto sobre el cuidador.
Se utilizó un número significativo de escalas de calificación para evaluar los resultados dentro de la salud mental. Las escalas varían en calidad y muchas no se han validado de manera adecuada. Se excluyeron los ensayos que midieron los resultados con escalas de calificación no publicadas o con escalas sin confiabilidad o validez establecida para asegurar la corrección y la confiabilidad de los resultados.
Results
Description of studies
See Characteristics of included studies, Characteristics of excluded studies, Characteristics of studies awaiting classification.
The CDCIG search in the Specialized register found 41 possibly relevant references. We retrieved two articles by searches in Chinese databases. After screening the titles and abstracts, we selected 28 study papers which potentially fulfilled our inclusion criteria. Of these 28 references, two studies (Meignan‐Debray 1987, Nakano 1986) are currently awaiting assessment until full texts can be retrieved. Moreover, there were four studies with two publication paper in different years (Branconnier 1977, Cucinotta 1987, Grossmann 1990, Möller 2001). Of the remaining 22 studies, we excluded 10 because they were not randomised (Bornstein 1993, Bouvier 1974, Brodie 1977, Cox 1975, Gerin 1974, Hausotter 1987, Judge 1972, Maury 1993, Robinson 1972, Roger 1986), and three because participants were not diagnosed as suffering from dementia (Agnoli 1985, Bargheon 1975, Israel 1989).
Study design
All of the nine included studies had been published and all, except one (Möller 2001) used a two‐arm parallel group design. Möller 2001 used a three‐arm parallel group design, comprising a control group (inactive vehicle), and two active treatment groups. One active treatment group received naftidrofuryl 600 mg/day and the other received 400 mg/day. Six studies were conducted in a single centre (Branconnier 1977, Cohn 1984, Cox 1981, Gottschalk 1980, Grossmann 1990, Saldmann 1991); one study used two centres (Cucinotta 1987), and the remaining two studies used multiple centres (Emeriau 2000, Möller 2001). A total of 847 participants were included in these trials. All reports were published between 1977 and 2001.
Participants
Four trials studied patients whose diagnosis was given only as senile dementia (Branconnier 1977, Cohn 1984, Cox 1981, Saldmann 1991), one addressed Alzheimer's disease (Cucinotta 1987), two dealt with vascular and mixed dementia (Emeriau 2000, Möller 2001), two involved more than two types of dementia above (Grossmann 1990, Möller 2001), and one did not specify the classification (Gottschalk 1980). Mean ages ranged from approximately 69 to 82 years, and approximately 60% of participants were female. Where severity of dementia was reported it involved 'mild' (Branconnier 1977, Cucinotta 1987), 'moderate' (Cohn 1984), 'mild to moderate' (Cox 1981, Emeriau 2000, Grossmann 1990, Saldmann 1991), 'moderate to severe' (Gottschalk 1980), and 'mild to severe' (Möller 2001).
The baseline characteristics of participants and the specific active treatment regimens in included studies are summarized in Table 1.
| Study | Number randomised | Diagnosis | Severity of disease | Mean age (SD) | % female | Active Rx | duration (months) |
| 60 | senile organic brain syndrome | mild | Active: 69.7 (6.2) Control: 68.5 (5.4) | 45.0 | 300 mg/day | 3 | |
| 75 | senile dementia | moderate | 75 | not reported | 400 mg/day | 3 | |
| 32 | senile dementia | mild to moderate | Active: 82.6 (5.7) Control: 80.9 (6.4) | 18.8 | 300 mg/day plus daily multi‐vitamin preparation and potassium 600mg t.i.d. | 2 | |
| 30 | SDAT | mild | Active: 82.6 (5.7) Control: 80.9 (6.4) | 66.7 | 600 mg/day | 12 | |
| 96 | VD and MD | mild to moderate | Active: 77 (5.7) Control: 76.5 (6.3) | 79.8 | 600 mg/day | 12 | |
| 38 | dementia | moderate to severe | 76 | 57.9 | 400 mg/day | 3 | |
| 60 | SDAT (47%) MID (24%) MD (29%) | mild to moderate | Active: 77.8 (5.3) Control: 77.3 (6.3) | 60.8 | 600 mg/day | 2 | |
| 378 | VD or MD | mild to severe | Active 1: 71.5 (7.7) Active 2: 70.6 (8.2) Control: 72 (8.0) | 54.6 | Active 1: 600 mg/day Active 2: 400 mg/day | 6 | |
| 78 | senile dementia | mild to moderate | Active: 77.1 (4.6) Control: 78.9 (5.4) | 84.8 | 400 mg/day | 3 |
Abbreviations: MD = mixed Alzheimer's disease and vascular dementia; MID = multi‐infarct dementia; Rx = treatment; SDAT= Senile Dementia of the Alzheimer Type; t.i.d. = three times daily; VD = vascular dementia.
Interventions
Doses of naftidrofuryl ranged from 300 mg/day to 600 mg/day. Treatment periods ranged from two months to 12 months. Naftidrofuryl was administered orally in all studies. All studies used matching placebos as the control treatment.
Outcome measures
Participants were treated for two to four months in six trials, for six months in one trial (Möller 2001), and for 12 months in two trials (Cucinotta 1987, Emeriau 2000). The majority of outcome measures used scales which measured more than one of our outcome domains. All outcomes identified in the trials are listed in Table 2. Instead of rating scores, Möller 2001 used response rate to analyse, which was defined as a success if final score ≤ baseline. The following published and validated scales have been extracted for analyses in this review:
| Study | SCAG/EACG | CGI | ADAS‐Cog | MMSE | NOSGER | SGRS | BDRS | CBRS | Others |
| √ | Neuropsychology test | ||||||||
| √ | |||||||||
| √ | |||||||||
| √ | GBS, HRSD | ||||||||
| √ | √ | ||||||||
| GCIS | |||||||||
| EST, Depressiveness Scale | |||||||||
| Psychometric tests | |||||||||
| √ | √ | √ | √ | ||||||
| √ | √ | Psychometric tests |
Abbreviations: ADAS‐Cog= The cognitive part of the Alzheimer's Disease Assessment Scale; BDRS= Blessed Dementia Rating Scale; CBRS= Crichton Behavioural Rating Scale; CGI= Clinical Global Impression; EACG= Echelle d'Appreciation Clinique en Geriatrie, French version of SCAG; EST= Erzigkeit's Short Syndrome test; HRSD= Hamilton Rating Scale for Depression; GBS= Gottfries‐Brane‐Steen Scale; GCIS= Gottschalk Cognitive Impairment Scale; MMSE= Mini Mental State Examination; NOSGER= Nurse's Observational Scale for Geriatric Patients; SCAG= Sandoz Clinical Assessment Geriatric Scale; SGRS= Stockton Geriatric Rating Scale;
(1) Quality of life: no included trials reported this outcome.
(2) Global impression
-
The Sandoz Clinical Assessment Geriatric Scale (SCAG) (Shader 1974) is a physician rating. It consists of 18 items and an overall impression (item 19), all rated on a seven‐point scale. There are five subscores: cognitive disturbances, disturbances in social behaviour, lack of drive, affective disturbances, somatic disturbances. Item 19 was used in Cohn 1984.
-
The Clinical Global Impression (CGI) (Guy 1976) is a global rating of all domains of a patient's current condition. It is a seven‐point scale, from one (very much improved) to seven (very much worse), four indicating no change. The assessment is conducted by the same clinician at both time points with input from relatives or carers. This rating scale was used in Branconnier 1977and Möller 2001.
(3) Functional performance and behavioural disturbances
-
Stockton Geriatric Rating Scale (SGRS) (Pichot 1970) consists of 32 items, each of which is given a score of zero = 'not present', one = 'moderate' or two = 'severe'. The items can be grouped to obtain the factors: disturbance of motivation, disturbance of social behaviour, need of care, and communication disturbances. The subscores of motivation and behavioural disturbances were used in Saldmann 1991.
-
Crichton Behavioural Rating Scale (CBRS) (Robinson 1961) was used to assess mental function, mood and activities of daily living. This rating scale was used in Cox 1981.
-
The French version of SCAG, Echelle d'Appreciation Clinique en Geriatrie (EACG) (Georges 1977), was used in Saldmann 1991 (subscores of behaviour disturbances).
(4) Mood disturbances
-
The French version of SCAG, Echelle d'Appreciation Clinique en Geriatrie (EACG) (Georges 1977), was used in Saldmann 1991 (subscores of emotional disturbances).
-
The Depressiveness Scale (Zerssen 1976) is a self‐rating technique for measuring depression. This rating scale was used in Grossmann 1990.
-
The Hamilton Rating Scale for Depression (HRSD) (Hamilton 1960), is a 21‐question multiple choice questionnaire, which rates the severity of symptoms observed in depression such as low mood, insomnia, agitation, anxiety and weight loss. This rating scale was used in Cucinotta 1987.
(5) Cognitive function
-
The cognitive part of the Alzheimer's Disease Assessment Scale (ADAS‐Cog) (Rosen 1984) comprises 11 individual tests, spoken language ability (zero to five), comprehension of spoken language (zero to five), recall of test instructions (zero to five), word finding difficulty (zero to five), following commands (zero to five), naming object (zero to five), construction drawing (zero to five), ideational praxis (zero to five), orientation (zero to eight), word recall (zero to 10) and word recognition (zero to 12). The total score ranges from zero to 70, the high score indicating greater impairment. This rating scale was used in Emeriau 2000 and Möller 2001.
-
The Mini Mental State Examination (MMSE) (Folstein 1975) was developed as a short test suitable for the elderly with dementia. It concentrates on the cognitive aspects of mental function, and the five sections cover orientation, immediate recall, attention and calculation, delayed recall and language. A maximum score of 30 indicates no impairment. This rating scale was used in Emeriau 2000.
-
Erzigkeit's Short Syndrome test (EST) (Erzigkeit 1977) includes nine subtests that measure psychomotor co‐ordination, attentiveness, immediate and delayed repetition, interference, speed and perception. This rating scale was used in Grossmann 1990.
-
The French version of SCAG, Echelle d'Appreciation Clinique en Geriatrie (EACG) (Georges 1977), was used in Saldmann 1991 (subscore of cognitive disturbances).
(6) Combination Scales
Several scales used in earlier studies combine elements that are now more commonly assessed using separate instruments. Such scales have been used as a different method from 'overall clinical impression' for the systematic global assessment of dementia. These combination scales typically have several subscales, the results of which are sometimes presented separately and can be included in meta‐analyses.
-
Gottfries‐Brane‐Steen Scale (GBS) (Gottfries 1982) is a 26‐item, physician‐assessed observer scale based on caregiver's information and an interview with the patient. It comprises three subscales: motor performance, intellectual and emotional capacity, and a group of six symptoms commonly observed in dementia. This rating scale was used in Cucinotta 1987.
-
Nurse's Observational Scale for Geriatric Patients (NOSGER) (Spiegel 1991) contains 30 items of behaviour, each rated in a five‐point scale according to frequency of occurrence. Item scores are summarized into six dimension scores (memory, instrumental activities of daily life, self‐care activities of daily living, mood, social behaviour, and disturbance behaviour). This rating scale was used in Möller 2001.
-
Blessed Dementia Rating Scale (BDRS) (Blessed 1968) has six sections: the first three measure changes in performance of everyday activities, habits, and personality, interests and drive as answered by the carer. Each section is scored zero (normal) to 28 (severe). The second three sections form the cognitive test, and information, memory and concentration are each assessed on a score of zero (complete failure) to 37 (normal). This rating scale was used in Cucinotta 1987.
-
The Sandoz Clinical Assessment Geriatric Scale (SCAG) (Shader 1974) is a physician rating. It consists of 18 items and an overall impression (item 19), all rated on a seven‐point format. There are five subscores: cognitive disturbances, disturbances in social behaviour, lack of drive, affective disturbances, somatic disturbances. The mean scores were reported in Cohn 1984 and response rates were stated in Möller 2001.
(7) Dependency: no included trials reported this outcome.
(8) Effect on carer: no included trials reported this outcome.
Risk of bias in included studies
The risk of bias in included studies is summarized in Figure 1 and Figure 2.

Methodological quality graph: review authors' judgements about each methodological quality item presented as percentages across all included studies.

Methodological quality summary: review authors' judgements about each methodological quality item for each included study.
Sequence generation
All of the nine included trials mentioned "random". However, only two of the trials used a previously drawn up randomised list (Cucinotta 1987, Möller 2001). The others did not specify the randomisation method used.
Allocation concealment
An adequate method of allocation concealment was reported in two trials (Cucinotta 1987, Möller 2001). The other trial reports did not give any details of allocation concealment. The Cucinotta 1987 study stated that the allocation of participants was on the basis of a randomisation list concealed from the researchers. The Möller 2001 study used a centralised allocation system.
Blinding
Seven of the trial reports simply mentioned "double‐blind" without further description. Cox 1981 and Möller 2001 gave details of how the blinding of participants and investigators was ensured.
Incomplete outcome data
Intention‐to‐treat (ITT) analyses were performed in four trials (Cucinotta 1987, Emeriau 2000, Grossmann 1990, Möller 2001). The other trials had withdrawals post randomisation and did not use ITT analysis. One study did not report the missing participants or withdrawals (Branconnier 1977). The reasons for withdrawal were not reported in three studies: Cohn 1984 (28 withdrawals, 37.3%), Cox 1981 (two withdrawals, 6.3%) and Cucinotta 1987 (one withdrawal, 3.3%). Twelve participants (31.6%) were withdrawn from the Gottschalk 1980 trial, either due to medical disorders (six participants), or due to drop‐out (six participants), and twelve participants (15.4%) withdrew whilst on treatment in the Saldmann 1991 trial (one died, three due to intercurrent concomitant disease, seven lost to follow‐up).
Selective reporting
Seven of the included studies were judged to show selective reporting due to failure to report complete outcome data (Branconnier 1977, Cohn 1984, Cucinotta 1987, Emeriau 2000, Gottschalk 1980, Grossmann 1990, Saldmann 1991). In Möller 2001, the continuous data of rating scales was transformed into a response rate to treatment, defined as a success if the final score was less than baseline. Only the remaining study (Cox 1981) reported all expected outcomes clearly, although the study protocol was not available. Moreover, for five studies it was possible to calculate the missing SDs from either SEs (Cucinotta 1987, Grossmann 1990, Saldmann 1991), or P values (Cohn 1984, Emeriau 2000). The results from Branconnier 1977 and Gottschalk 1980 are presented in the Effects of interventions section, but not included in the meta‐analysis because neither SDs nor P values were available.
In respect of tolerability, five included studies (Branconnier 1977, Cox 1981, Emeriau 2000, Grossmann 1990, Möller 2001) specified the number of adverse effects with clinical manifestation, so that they could be included in a meta‐analysis to address the occurrence of adverse effects. The Cohn 1984 study reported that the active group had a somewhat higher occurrence of gastrointestinal disorders, but without description of data. The Cucinotta 1987 trial stated that no undesired effects were observed, while the Gottschalk 1980 trial failed to give any description on adverse effects. Of those studies which reported reasons for withdrawal, none reported any withdrawals due to adverse effects. Only three studies (Emeriau 2000, Möller 2001, Saldmann 1991) mentioned the number of deaths.
Other potential sources of bias
Lipha Sante Pharmaceuticals were involved in three of the studies. One study declared that they provided funding for the trial (Emeriau 2000), and in the other two studies (Grossmann 1990, Möller 2001) members of the company's staff were co‐authors, although the extent of their involvement in the analyses and report‐writing was unclear.
Effects of interventions
The main analysis is presented in Section 1. In Section 2, results are divided by the subtypes of dementia. In sections 3, the results are presented under different duration of studies.
Section 1. Effect of naftidrofuryl on patients with dementia
We pooled all available data from nine trials into the analysis.
(1) Global Impression: There was a significant difference in the clinical impression of change, as measured by item 19 of SCAG, in favour of naftidrofuryl (MD 2.70 points, 95% CI 0.07 to 5.33, P =0.04) assessed by Cohn 1984. Moreover, there was a significant difference in the response rate of clinical impression, as measured by the CGI, in favour of naftidrofuryl (OR 1.83, 95% CI 1.16 to 2.91, P = 0.01) assessed by Möller 2001. However, the larger dose group (600 mg/day) in this trial produced a non‐significant finding in favour of naftidrofuryl (OR 1.62, 95% CI 0.85 to 3.10), while the lower dose group (400 mg/day) led to a positive result (OR 2.08, 95% CI 1.08 to 4.03). Since no available data were reported in Branconnier 1977, we have to present the conclusion of this study as "no significant differences were observed on the severity of illness, global improvement, or effectiveness index scores on the CGI".
(2) Adverse events (Figure 3): A pooled analysis of these results indicated no significant difference in the odds of adverse events in the naftidrofuryl group as compared with the placebo group (OR 1.00, 95% CI 0.63 to 1.60). No heterogeneity was detected between the studies (I2 = 0%).

Forest plot of comparison: 1 Naftidrofuryl vs. placebo for all included studies, outcome: 1.15 Adverse events.
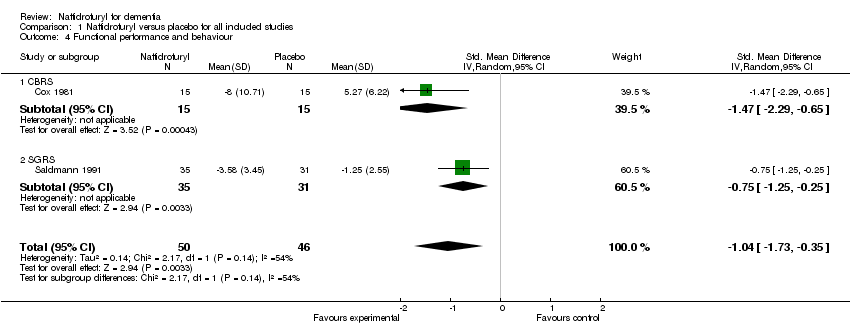
(3) Functional performance and behaviour (Figure 4): Standardized mean differences were used here due to the different rating scales used. There was a significant difference in change of activities of daily living and behavioural disturbances, as assessed using CBRS (Cox 1981) and SGRS (Saldmann 1991), in favour of naftidrofuryl (‐1.04 standardized points, 95% CI ‐1.73 to ‐0.35, P = 0.003), with a high‐level of heterogeneity (I2 = 54%). The reason remained unclear. Both Cox 1981 and Saldmann 1991 studied mild to moderate senile dementia for two months 300 mg daily use, or three months 400 mg daily use, respectively. Interestingly, the larger the dose used, the smaller the effect was observed. Another clue was that daily multi‐vitamin preparation and potassium 600mg were given three times daily additionally to both groups in Cox 1981.

Forest plot of comparison: 1 Naftidrofuryl vs. placebo for all included studies, outcome: 1.3 Functional performance and behaviour: change from baseline.
(4) Mood (Figure 5): Standardized mean differences were used here due to the different rating scales used. The patients' mood benefited from the use of naftidrofuryl (‐0.80 standardized points, 95% CI ‐1.26 to ‐0.34, P = 0.0006) with no discernible heterogeneity (I2 = 0%), as assessed on Depressive Scale (Grossmann 1990) and HRSD (Cucinotta 1987). Saldmann 1991 also found a similar result which assessed change from baseline of mood by EACG subscore (MD ‐0.90 points, 95% CI ‐1.73 to ‐0.07, P = 0.03).

Forest plot of comparison: 1 Naftidrofuryl vs. placebo for all included studies, outcome: 1.4 Mood.
(5) Cognition: Standardized mean differences were used here due to the different rating scales used. The pooled analysis showed a significant improvement in favour of naftidrofuryl (‐0.36 standardized points, 95% CI ‐0.71 to ‐0.02, P = 0.04). No heterogeneity was detected between the studies (I2 = 0%). Moreover, change from baseline of cognition measured by EACG subscore found a significant difference in favour of naftidrofuryl (MD ‐1.45 points, 95% CI ‐2.15 to ‐0.75, P < 0.0001) in Saldmann 1991. Furthermore, the response rate of cognition measured by ADAS‐Cog also found a significant difference in favour of naftidrofuryl (OR 2.46, 95% CI 1.46 to 4.14, P = 0.0007) in Möller 2001. However, Gottschalk 1980 concluded that "No significant change occurred on the Gottschalk Cognitive Impairment Scale scores after 1 to 3 months on either Praxilene or placebo" without usable data.
(6) Combination scales: There was a significant difference in the change of behaviour, mood and cognition, as measured by SCAG, in favour of naftidrofuryl (MD 1.00 points, 95% CI 0.03 to 1.97, P = 0.04) assessed by Cohn 1984. Moreover, Möller 2001 found a significant difference between naftidrofuryl and placebo in functional performance, behaviour, mood and cognition covered by SCAG (OR 2.83, 95% CI 1.68 to 4.78, P < 0.0001). However, the analysis of Cucinotta 1987 found no difference between naftidrofuryl and placebo in functional performance and behaviour, mood and cognition as measured by both GBS (MD 1.40 points, 95% CI ‐9.29 to 12.09, P = 0.80) and BDRS (MD 0.90 points, 95% CI ‐1.47 to 3.27, P = 0.46). Additionally, NOSGER presented an non‐significant difference in favour of naftidrofuryl (OR 1.54, 95% CI 0.98 to 2.42, P = 0.06) in Möller 2001.
(7) Death (Figure 6): The analysis found no relationship between death and naftidrofuryl use (OR 1.13, 95% CI 0.34 to 3.72), with no discernible heterogeneity (I2 = 0%).
Section 2. Subgroup analysis of subtypes of dementia
2.1 Effect of naftidrofuryl on patients with Alzheimer's disease
Two trials were identified that studied the effect of naftidrofuryl on patients with mild Alzheimer's disease (Cucinotta 1987, Grossmann 1990).
(1) Adverse events: Only Grossmann 1990 described the number of adverse events that occurred. The result showed no significant difference in the odds of adverse events in the naftidrofuryl group as compared with the placebo group (OR 1.38, 95% CI 0.45 to 4.17).
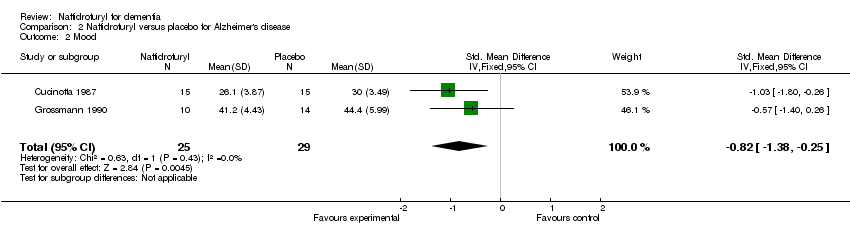
(2) Mood: Patients taking naftidrofuryl had significantly less worsening of mood (‐0.82 standardized points, 95% CI ‐1.38 to ‐0.25, P = 0.004), as assessed on HRSD (Cucinotta 1987) and Depressiveness scale (Grossmann 1990).
(3) Cognition: There was no relationship between naftidrofuryl use and cognitive function (MD 0.30 points, 95% CI ‐3.99 to 4.59, P = 0.89), as measured by EST (Grossmann 1990).
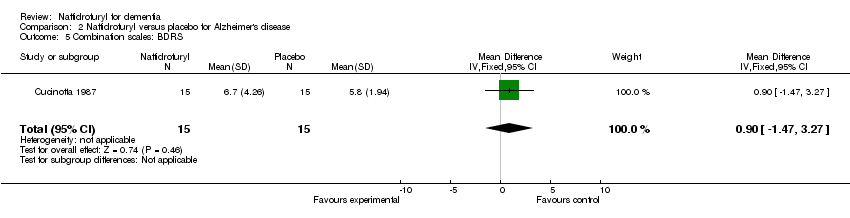
(4) Combination scales: The analysis of Cucinotta 1987 found no difference between naftidrofuryl and placebo in functional performance and behaviour, mood and cognition as measured by both GBS (MD 1.40 points, 95% CI ‐9.29 to 12.09, P = 0.80) and BDRS (MD 0.90 points, 95% CI ‐1.47 to 3.27, P = 0.46).
2.2 Effect of naftidrofuryl on patients with vascular dementia and mixed dementia
Three trials studied the effect of naftidrofuryl on patients with mild to severe vascular dementia and mixed dementia (Emeriau 2000, Grossmann 1990, Möller 2001).
(1) Global Impression (Figure 8): There was a significant difference in favour of naftidrofuryl on response rate measured by CGI (OR 1.83, 95% CI 1.16 to 2.91, P = 0.01). The larger dose group (600 mg/day) produced an OR estimate of 1.62 (95% CI 0.85 to 3.10, P = 0.15), a non‐significant finding in favour of naftidrofuryl (Möller 2001).
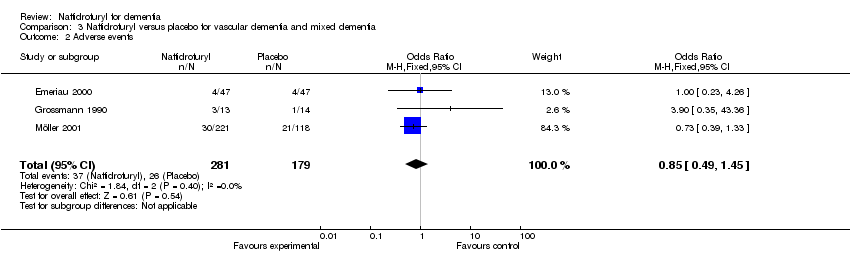
(2) Adverse events (Figure 7): A pooled analysis of these results indicated no significant difference in the risk of adverse events in the naftidrofuryl group as compared with the placebo group (OR 0.85, 95% CI 0.49 to 1.45). No heterogeneity was detected between the studies (I2 = 0%).
(3) Mood: A significant difference was observed in the improvement of mood, as measured by the Depressive Scale, in favour of naftidrofuryl (MD ‐7.80 points, 95% CI ‐14.90 to ‐0.70, P = 0.03) assessed by Grossmann 1990.
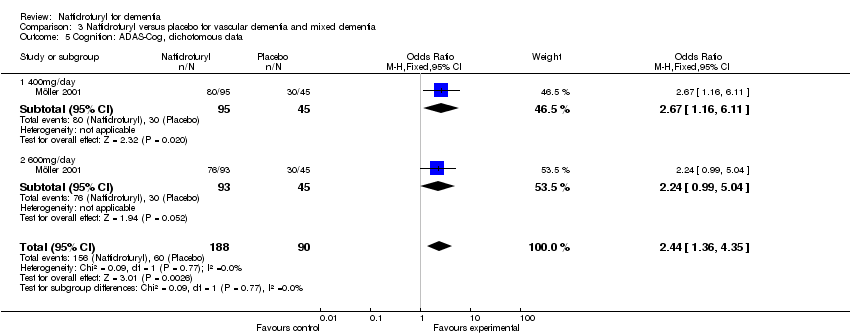
(4) Cognition (Figure 6): A pooled analysis of two trials found patients taking naftidrofuryl had significantly less worsening of cognition (‐0.46 standardized points, 95% CI ‐0.84 to ‐0.08, P = 0.02), as assessed by ADAS‐Cog (Emeriau 2000) and EST (Grossmann 1990). No heterogeneity was detected between the studies (I2 = 0%). Moreover, Emeriau 2000 assessed improvement of cognition by MMSE found a significant difference in favour of naftidrofuryl (2.08 points, P = 0.008). In respect to response rate of cognition, naftidrofuryl had significantly improved cognitive function (OR 2.46, 95% CI 1.46 to 4.14, P = 0.0007), as measured by response rate of ADAS‐Cog in Möller 2001.

Forest plot of comparison: 3 Naftidrofuryl vs. placebo for vascular dementia and mixed dementia, outcome: 3.3 Cognition.
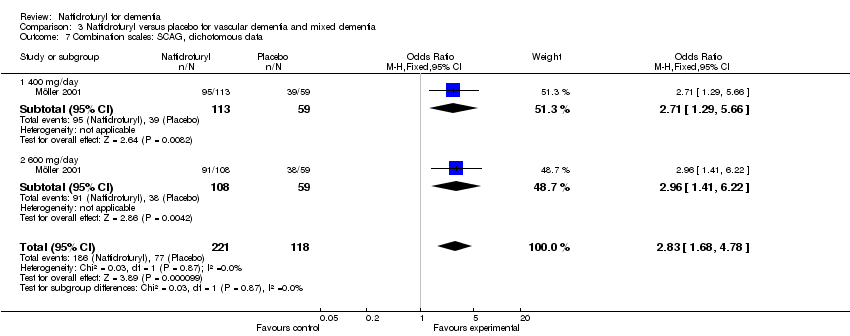
(5) Combination scales: Möller 2001 found a significant difference between naftidrofuryl and placebo in functional performance, behaviour, mood and cognition covered by SCAG (OR 2.83, 95% CI 1.68 to 4.78, P < 0.0001). However, NOSGER presented a different result (OR 1.54, 95% CI 0.98 to 2.41, P = 0.06).
(6) Death (Figure 10): The analysis found no relationship between death and naftidrofuryl use (OR 1.19, 95% CI 0.32 to 4.46).
2.3 Effect of naftidrofuryl on patients with unspecified dementia
Four trials were identified that compared the effect of naftidrofuryl and placebo in patients with mild to moderate unspecified senile dementia (Branconnier 1977, Cohn 1984, Cox 1981, Saldmann 1991). One trial addressed unspecified dementia with impaired cognitive functioning (Gottschalk 1980).
(1) Global Impression: There was a significant difference in the clinical impression of change, as measured by item 19 of SCAG, in favour of naftidrofuryl (MD 2.70 points, 95% CI 0.07 to 5.33, P = 0.04) assessed by Cohn 1984. Since no available data were reported in Branconnier 1977, we have to present the conclusion of this study as "no significant differences were observed on the severity of illness, global improvement, or effectiveness index scores on the CGI".
(2) Adverse events (Figure 11): Three studies (Branconnier 1977, Cox 1981, Saldmann 1991) described the number of adverse events that occurred. A pooled analysis of these results indicated no significant difference in the odds of adverse events in the naftidrofuryl group as compared with the placebo group (OR 3.31, 95% CI 0.72 to 15.31). No heterogeneity was detected between the studies (I2 = 0%).
(3) Functional performance and behaviour (Figure 4): Standardized mean differences were used here due to the different rating scales used. There was a significant difference in change of activities of daily living and behavioural disturbances, as assessed using CBRS (Cox 1981) and SGRS (Saldmann 1991), in favour of naftidrofuryl (‐1.04 standardized points, 95% CI ‐1.73 to ‐0.35, P = 0.003). However, high‐level heterogeneity was detected between the studies (I2 = 54%). The possible reason for high‐level heterogeneity has been mentioned above (Section 1 (4)).
(4) Mood: Saldmann 1991 assessed change of mood by EACG subscore and found a significant difference in favour of naftidrofuryl (MD ‐0.90 points, 95% CI ‐1.73 to ‐0.07, P = 0.03).
(5) Cognition: Gottschalk 1980 concluded that "No significant change occurred on the Gottschalk Cognitive Impairment Scale scores after 1 to 3 months on either Praxilene or placebo". However, change from baseline of cognition measured by EACG subscore found a significant difference in favour of naftidrofuryl (‐1.45 points, 95% CI ‐2.15 to ‐0.75, P < 0.0001) in Saldmann 1991.
(6) Combination scales: There was a significant difference in the change of behaviour, mood and cognition, as measured by SCAG, in favour of naftidrofuryl (MD 1.00 points, 95% CI 0.03 to 1.97, P = 0.04) assessed by Cohn 1984.
(7) Death: Only Saldmann 1991 reported the number of deaths in participants. The analysis found no relationship between death and naftidrofuryl use (OR 0.88, 95% CI 0.05 to 14.73).
Section 3. Subgroup analysis of duration of treatment
3.1 Effect of naftidrofuryl on patients with dementia: short‐term studies
Six trials were pooled in which patients were treated for less than six months (Branconnier 1977, Cohn 1984, Cox 1981, Gottschalk 1980, Grossmann 1990, Saldmann 1991). Since no available data were obtained from Gottschalk 1980, the original conclusions are presented in the following corresponding outcomes. All of the trials followed up patients for two to four months.
(1) Global Impression: There was a significant difference in the clinical impression of change, as measured by item 19 of SCAG, in favour of naftidrofuryl (MD 2.70 points, 95% CI 0.07 to 5.33, P = 0.04) assessed by Cohn 1984. Since no data were reported in Branconnier 1977, we have to present the conclusion of this study as "no significant differences were observed on the severity of illness, global improvement, or efficacy index scores on the CGI".
(2) Adverse events (Figure 12): Four studies (Branconnier 1977, Cox 1981, Grossmann 1990, Saldmann 1991) contributed to these results. A pooled analysis found no significant difference between naftidrofuryl and placebo (OR 1.90, 95% CI 0.78 to 4.59). No heterogeneity was detected between the studies (I2 = 0%).
(3) Functional performance and behaviour (Figure 4): Standardized mean differences were used here due to the different rating scales used. There was a significant difference in change of activities of daily living and behavioural disturbances, as assessed using CBRS (Cox 1981) and SGRS (Saldmann 1991), in favour of naftidrofuryl (‐1.04 standardized points, 95% CI ‐1.73 to ‐0.35, P = 0.003), with a high‐level heterogeneity (I2 = 54%). The possible reason for high‐level heterogeneity had been mentioned above (Section 1 (4)).
(4) Mood: Patients taking naftidrofuryl had significantly less worsening of mood (MD ‐5.50 points, 95% CI ‐9.82 to ‐1.18, P = 0.01), as assessed by the Depressive Scale (Grossmann 1990). Moreover, Saldmann 1991 assessed change of mood by EACG sub‐score and found a significant difference in favour of naftidrofuryl (MD ‐0.90 points, 95% CI ‐1.73 to ‐0.07, P = 0.03).
(5) Cognition: There was no relationship between naftidrofuryl use and cognitive function (MD ‐0.90 points, 95% CI ‐3.84 to 2.04, P = 0.55), as measured by EST (Grossmann 1990). Moreover, Gottschalk 1980 concluded that "No significant change occurred on the Gottschalk Cognitive Impairment Scale scores after 1 to 3 months on either Praxilene or placebo". However, change from baseline of cognition measured by EACG sub‐score found a significant difference in favour of naftidrofuryl (‐1.45 points, 95% CI ‐2.15 to ‐0.75, P < 0.0001) in Saldmann 1991.
(6) Combination scales: The analysis found a significant difference in the change of behaviour, mood and cognition, as measured by SCAG , in favour of naftidrofuryl (MD 1.00 points, 95% CI 0.03 to 1.97, P = 0.04) assessed by Cohn 1984.
(7) Death: Only Saldmann 1991 reported the number of deaths in participants. The analysis found no relationship between death and naftidrofuryl use (OR 0.88, 95% CI 0.05 to 14.73).
3.2 Effect of naftidrofuryl on patients with dementia: long‐term studies
Three trials were identified that treated patients for more than six months (Cucinotta 1987, Emeriau 2000, Möller 2001). Möller 2001 followed up patients for six months, while the other two studies followed up for 12 months.
(1) Global Impression: There was a significant difference in the response rate of clinical impression, as measured by the CGI, in favour of naftidrofuryl (OR 1.83, 95% CI 1.16 to 2.91, P = 0.01) assessed by Möller 2001. However, the larger dose group (600 mg/day) in this trial produced a non‐significant finding in favour of naftidrofuryl (OR 1.62, 95% CI 0.85 to 3.10), while the lower dose group (400 mg/day) led to a positive result (OR 2.08, 95% CI 1.08 to 4.03).
(2) Adverse events (Figure 13): Emeriau 2000 and Möller 2001 described the number of adverse events occurred. A pooled analysis of these results indicated no significant difference between naftidrofuryl and placebo (OR 0.76, 95% CI 0.43 to 1.34). No heterogeneity was detected between the studies (I2 = 0%).
(3) Mood: Patients taking naftidrofuryl had significantly less worsening of mood (MD ‐1.03 points, 95% CI ‐1.80 to ‐0.26, P = 0.009), as assessed on HRSD (Cucinotta 1987).
(4) Cognition: There was a significant difference in favour of naftidrofuryl use (MD ‐0.48 points, 95% CI ‐0.92 to ‐0.05, P = 0.03), as measured by ADAS‐Cog (Emeriau 2000). Moreover, the response rate of cognition measured by ADAS‐Cog also found a significant difference in favour of naftidrofuryl (OR 2.46, 95% CI 1.46 to 4.14, P = 0.0007) in Möller 2001. In addition, Emeriau 2000 assessed improvement of cognition by MMSE found a significant difference in favour of naftidrofuryl (2.08 points, P = 0.008).
(5) Combination scales : The analysis of Cucinotta 1987 found no difference between naftidrofuryl and placebo in functional performance and behaviour, mood and cognition as measured by both GBS (MD 1.40 points, 95% CI ‐9.29 to 12.09, P = 0.80) and BDRS (MD 0.90 points, 95% CI ‐1.47 to 3.27, P = 0.46). On the other hand, Möller 2001 found a significant difference between naftidrofuryl and placebo in functional performance, behaviour, mood and cognition measured by the response rate on SCAG (OR 2.83, 95% CI 1.68 to 4.78, P < 0.0001), but not on NOSGER (OR 1.54, 95% CI 0.98 to 2.42, P = 0.06).
(6) Death (Figure 14): Emeriau 2000 and Möller 2001 reported the number of deaths in participants. A pooled analysis found no relationship between death and naftidrofuryl use (OR 1.19, 95% CI 0.32 to 4.46).
Discusión
Los resultados indican un efecto beneficioso del naftidrofurilo sobre el rendimiento funcional, la conducta, la función cognitiva y los trastornos del estado de ánimo en pacientes con demencia. Sin embargo, hay pocas pruebas que apoyen sus efectos sobre la impresión clínica global. Cohn 1984 informó un resultado positivo sobre este resultado, Branconnier 1977/1978 no lo informó y Möller 2000/2001 encontró un resultado positivo limitado al grupo de dosis inferior. Por lo tanto, es difícil señalar si los efectos beneficiosos del naftidrofurilo sobre diversas escalas de síntomas se traducen confiablemente en cambios clínicamente detectables.
El estudio de Möller (Möller 2001) que informó un beneficio significativo del naftidrofurilo sobre la impresión global se realizó en pacientes con demencia vascular y mixta moderadas a graves. Debido a que el resultado positivo se limitó al grupo de dosis inferior, los resultados se deben observar con cierta precaución. Sin embargo, los resultados de todos los otros resultados informados de los pacientes con demencia vascular y mixta también fueron positivos. En los pacientes con demencia senil no especificada, los resultados también mostraron que el rendimiento funcional, el estado de ánimo y la conducta de los pacientes se beneficiaron del uso del naftidrofurilo, pero no mostraron pruebas de un beneficio sobre la función cognitiva. Un estudio (Cohn 1984) informó efectos beneficiosos sobre la impresión clínica global, pero otro estudio (Branconnier 1977) no informó sobre este resultado. En la enfermedad de Alzheimer, se encontró un efecto beneficioso en el estado de ánimo en una escala de un ensayo; los resultados con escalas de síntomas más globales fueron negativos.
Al dividir los estudios por la duración, los estudios más cortos indican efectos beneficiosos tempranos sobre el rendimiento funcional, la cognición, la conducta y el deterioro del estado de ánimo, mientras que el análisis agrupado de los estudios más largos encontró un efecto beneficioso similar sobre la cognición y el estado de ánimo.
Con respecto a la seguridad, existen algunas pruebas de que el naftidrofurilo es bien tolerado por los pacientes con demencia. Cuando se agruparon todos los análisis de subgrupos, se demostró que no pareció haber un número desproporcionado de eventos adversos graves ni de muertes en el grupo de naftidrofurilo en comparación con el grupo placebo. Además, ningún ensayo incluido informó efectos adversos graves debido al tratamiento con naftidrofurilo y dos ensayos (Emeriau 2000, Möller 2000/2001) informaron que en el grupo de naftidrofurilo, no se observaron con mayor frecuencia anomalías clínicamente significativas en los resultados de las pruebas de laboratorio. Sin embargo, Cohn 1984 informó que en el grupo de naftidrofurilo, hubo más trastornos gastrointestinales, pero no proporcionó detalles adicionales. Todos los estudios incluidos en esta revisión suministraron naftidrofurilo por vía oral. Las revisiones sistemáticas anteriores informaron que el naftidrofurilo intravenoso administrado a pacientes con isquemia crítica de las extremidades (Smith 2008) y accidente cerebrovascular agudo (Leonardi‐Bee 2007) se puede asociar con más eventos adversos incluidos los eventos adversos graves, y De Backer 2005 encontró un aumento en el riesgo de eventos adversos leves en pacientes con claudicación intermitente que recibieron naftidrofurilo por vía oral (OR 1,99; IC del 95%: 0,96 a 4,11; p = 0,06).
Los estudios identificados abordaron parcialmente los objetivos de la revisión. Primero, los participantes de la mayoría de los ensayos estaban limitados a demencia no especificada o senil. La enfermedad de Alzheimer grave no se incluyó en los estudios identificados y la demencia vascular grave y la demencia mixta figuraron en un único ensayo (Möller 2001). Además, el diseño de los estudios incluidos ignora algunos resultados importantes, por ejemplo, la calidad de vida, la dependencia y el efecto sobre el cuidador. Estos resultados se deben explorar en estudios adicionales para evaluar de forma más completa el naftidrofurilo en la demencia.
Aunque en el análisis se agruparon 847 participantes asignados al azar, el conjunto general de pruebas está deteriorado por el riesgo de sesgo potencialmente grande de los estudios identificados. Los estudios son diversos en cuanto a los criterios de diagnóstico, los tipos de participantes y la selección de los resultados. Los estudios utilizaron una variedad de escalas de calificación para evaluar el resultado del tratamiento, algunas de las cuales ya no se utilizan. Debido a que la mayoría de los estudios se realizaron entre 1980 y 1990, los métodos de asignación al azar, asignación y cegamiento no se describieron de forma detallada. Algunos estudios realizaron un análisis de intención de tratar y algunos tuvieron un gran número de pérdidas durante el seguimiento (Cohn 1984, Gottschalk 1980). Además, solo un ensayo (Cox 1981) proporcionó los datos completos como media ± DE, mientras que otros estudios solo informaron la media o solo presentaron los valores de p de su propio análisis.
En resumen, actualmente pruebas de calidad deficiente indican que el naftidrofurilo puede tener efectos beneficiosos sobre el rendimiento, la conducta, la cognición y el estado de ánimo en los pacientes con demencia. Sin embargo, las pruebas del efecto beneficioso sobre la impresión global son muy débiles. Al parecer, el naftidrofurilo es seguro y no tiene efectos secundarios excesivos comparado con placebo.
Methodological quality graph: review authors' judgements about each methodological quality item presented as percentages across all included studies.
Methodological quality summary: review authors' judgements about each methodological quality item for each included study.
Forest plot of comparison: 1 Naftidrofuryl vs. placebo for all included studies, outcome: 1.15 Adverse events.
Forest plot of comparison: 1 Naftidrofuryl vs. placebo for all included studies, outcome: 1.3 Functional performance and behaviour: change from baseline.
Forest plot of comparison: 1 Naftidrofuryl vs. placebo for all included studies, outcome: 1.4 Mood.
Forest plot of comparison: 3 Naftidrofuryl vs. placebo for vascular dementia and mixed dementia, outcome: 3.3 Cognition.

Comparison 1 Naftidrofuryl versus placebo for all included studies, Outcome 1 Global impression (SCAG).

Comparison 1 Naftidrofuryl versus placebo for all included studies, Outcome 2 Global impression (CGI).

Comparison 1 Naftidrofuryl versus placebo for all included studies, Outcome 3 Adverse events.
Comparison 1 Naftidrofuryl versus placebo for all included studies, Outcome 4 Functional performance and behaviour.

Comparison 1 Naftidrofuryl versus placebo for all included studies, Outcome 5 Mood.

Comparison 1 Naftidrofuryl versus placebo for all included studies, Outcome 6 Mood: change from baseline.

Comparison 1 Naftidrofuryl versus placebo for all included studies, Outcome 7 Cognition.

Comparison 1 Naftidrofuryl versus placebo for all included studies, Outcome 8 Cognition: EACG, change from baseline.

Comparison 1 Naftidrofuryl versus placebo for all included studies, Outcome 9 Cognition (ADAS‐Cog, dichotomous data).

Comparison 1 Naftidrofuryl versus placebo for all included studies, Outcome 10 Combination scales: SCAG, change from baseline.

Comparison 1 Naftidrofuryl versus placebo for all included studies, Outcome 11 Combination scales: SCAG, dichotomous data.

Comparison 1 Naftidrofuryl versus placebo for all included studies, Outcome 12 Combination scales (GBS).

Comparison 1 Naftidrofuryl versus placebo for all included studies, Outcome 13 Combination scales (BDRS).

Comparison 1 Naftidrofuryl versus placebo for all included studies, Outcome 14 Combination scales: NOSGER, dichotomous data.

Comparison 1 Naftidrofuryl versus placebo for all included studies, Outcome 15 Death.

Comparison 2 Naftidrofuryl versus placebo for Alzheimer's disease, Outcome 1 Adverse events.
Comparison 2 Naftidrofuryl versus placebo for Alzheimer's disease, Outcome 2 Mood.

Comparison 2 Naftidrofuryl versus placebo for Alzheimer's disease, Outcome 3 Cognition (EST).

Comparison 2 Naftidrofuryl versus placebo for Alzheimer's disease, Outcome 4 Combination scales: GBS.
Comparison 2 Naftidrofuryl versus placebo for Alzheimer's disease, Outcome 5 Combination scales: BDRS.

Comparison 3 Naftidrofuryl versus placebo for vascular dementia and mixed dementia, Outcome 1 Global impression (CGI).
Comparison 3 Naftidrofuryl versus placebo for vascular dementia and mixed dementia, Outcome 2 Adverse events.
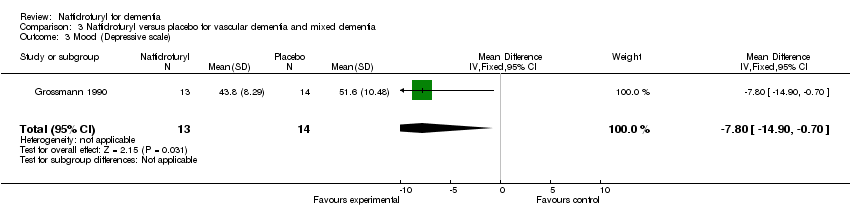
Comparison 3 Naftidrofuryl versus placebo for vascular dementia and mixed dementia, Outcome 3 Mood (Depressive scale).

Comparison 3 Naftidrofuryl versus placebo for vascular dementia and mixed dementia, Outcome 4 Cognition.
Comparison 3 Naftidrofuryl versus placebo for vascular dementia and mixed dementia, Outcome 5 Cognition: ADAS‐Cog, dichotomous data.

Comparison 3 Naftidrofuryl versus placebo for vascular dementia and mixed dementia, Outcome 6 Combination scales: NOSGER, dichotomous data.
Comparison 3 Naftidrofuryl versus placebo for vascular dementia and mixed dementia, Outcome 7 Combination scales: SCAG, dichotomous data.

Comparison 3 Naftidrofuryl versus placebo for vascular dementia and mixed dementia, Outcome 8 Death.

Comparison 4 Naftidrofuryl versus placebo for unspecified dementia, Outcome 1 Global impression: change from baseline.

Comparison 4 Naftidrofuryl versus placebo for unspecified dementia, Outcome 2 Adverse events.

Comparison 4 Naftidrofuryl versus placebo for unspecified dementia, Outcome 3 Functional performance and behaviour: change from baseline.
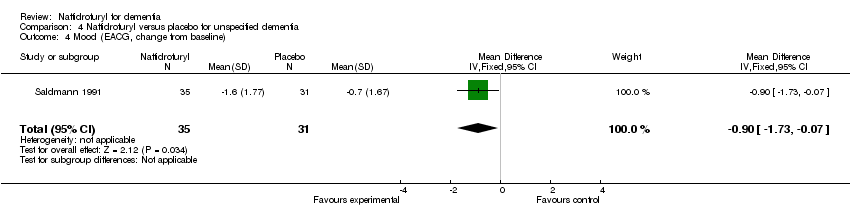
Comparison 4 Naftidrofuryl versus placebo for unspecified dementia, Outcome 4 Mood (EACG, change from baseline).

Comparison 4 Naftidrofuryl versus placebo for unspecified dementia, Outcome 5 Cognition (EACG, change from baseline).

Comparison 4 Naftidrofuryl versus placebo for unspecified dementia, Outcome 6 Combination scales (SCAG).

Comparison 4 Naftidrofuryl versus placebo for unspecified dementia, Outcome 7 Death.

Comparison 5 Naftidrofuryl versus placebo for dementia, all 2 to 3 months studies, Outcome 1 Global impression (SCAG).

Comparison 5 Naftidrofuryl versus placebo for dementia, all 2 to 3 months studies, Outcome 2 Adverse events.

Comparison 5 Naftidrofuryl versus placebo for dementia, all 2 to 3 months studies, Outcome 3 Functional performance and behaviour: change from baseline.

Comparison 5 Naftidrofuryl versus placebo for dementia, all 2 to 3 months studies, Outcome 4 Mood (Depressive scale).

Comparison 5 Naftidrofuryl versus placebo for dementia, all 2 to 3 months studies, Outcome 5 Mood (EACG, change from baseline).

Comparison 5 Naftidrofuryl versus placebo for dementia, all 2 to 3 months studies, Outcome 6 Cognition (EST).

Comparison 5 Naftidrofuryl versus placebo for dementia, all 2 to 3 months studies, Outcome 7 Cognition (EACG change from baseline).
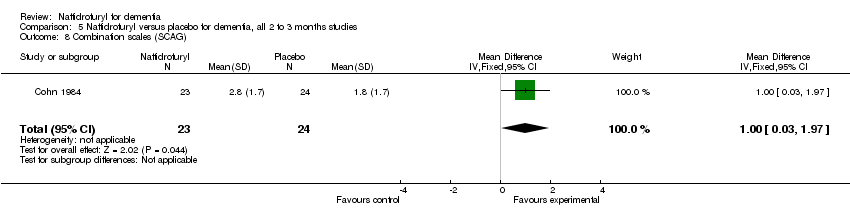
Comparison 5 Naftidrofuryl versus placebo for dementia, all 2 to 3 months studies, Outcome 8 Combination scales (SCAG).
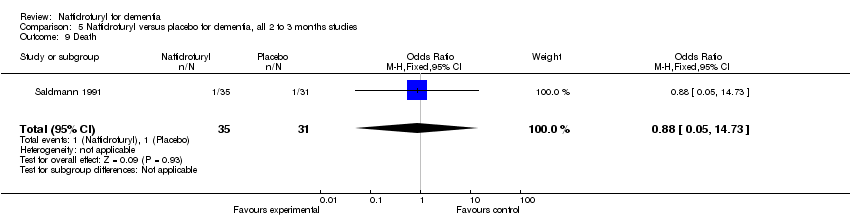
Comparison 5 Naftidrofuryl versus placebo for dementia, all 2 to 3 months studies, Outcome 9 Death.
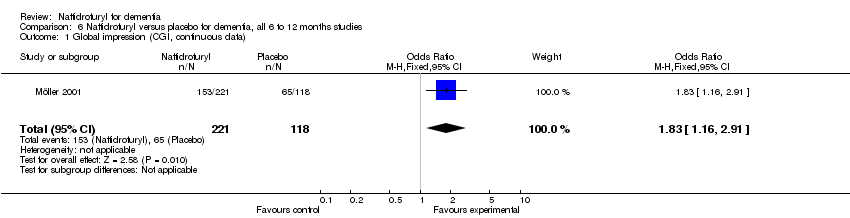
Comparison 6 Naftidrofuryl versus placebo for dementia, all 6 to 12 months studies, Outcome 1 Global impression (CGI, continuous data).

Comparison 6 Naftidrofuryl versus placebo for dementia, all 6 to 12 months studies, Outcome 2 Adverse effects.

Comparison 6 Naftidrofuryl versus placebo for dementia, all 6 to 12 months studies, Outcome 3 Mood (HRSD).

Comparison 6 Naftidrofuryl versus placebo for dementia, all 6 to 12 months studies, Outcome 4 Cognition (ADAS‐Cog, continuous data).

Comparison 6 Naftidrofuryl versus placebo for dementia, all 6 to 12 months studies, Outcome 5 Cognition (ADAS‐Cog, dichotomous data).
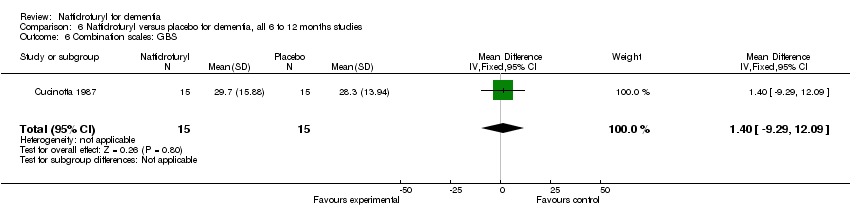
Comparison 6 Naftidrofuryl versus placebo for dementia, all 6 to 12 months studies, Outcome 6 Combination scales: GBS.

Comparison 6 Naftidrofuryl versus placebo for dementia, all 6 to 12 months studies, Outcome 7 Combination scales: BDRS.

Comparison 6 Naftidrofuryl versus placebo for dementia, all 6 to 12 months studies, Outcome 8 Combination scales: SCAG, dichotomous data.

Comparison 6 Naftidrofuryl versus placebo for dementia, all 6 to 12 months studies, Outcome 9 Combination scales: NOSGER, dichotomous data.

Comparison 6 Naftidrofuryl versus placebo for dementia, all 6 to 12 months studies, Outcome 10 Death.
| Study | Number randomised | Diagnosis | Severity of disease | Mean age (SD) | % female | Active Rx | duration (months) |
| 60 | senile organic brain syndrome | mild | Active: 69.7 (6.2) Control: 68.5 (5.4) | 45.0 | 300 mg/day | 3 | |
| 75 | senile dementia | moderate | 75 | not reported | 400 mg/day | 3 | |
| 32 | senile dementia | mild to moderate | Active: 82.6 (5.7) Control: 80.9 (6.4) | 18.8 | 300 mg/day plus daily multi‐vitamin preparation and potassium 600mg t.i.d. | 2 | |
| 30 | SDAT | mild | Active: 82.6 (5.7) Control: 80.9 (6.4) | 66.7 | 600 mg/day | 12 | |
| 96 | VD and MD | mild to moderate | Active: 77 (5.7) Control: 76.5 (6.3) | 79.8 | 600 mg/day | 12 | |
| 38 | dementia | moderate to severe | 76 | 57.9 | 400 mg/day | 3 | |
| 60 | SDAT (47%) MID (24%) MD (29%) | mild to moderate | Active: 77.8 (5.3) Control: 77.3 (6.3) | 60.8 | 600 mg/day | 2 | |
| 378 | VD or MD | mild to severe | Active 1: 71.5 (7.7) Active 2: 70.6 (8.2) Control: 72 (8.0) | 54.6 | Active 1: 600 mg/day Active 2: 400 mg/day | 6 | |
| 78 | senile dementia | mild to moderate | Active: 77.1 (4.6) Control: 78.9 (5.4) | 84.8 | 400 mg/day | 3 | |
| Abbreviations: MD = mixed Alzheimer's disease and vascular dementia; MID = multi‐infarct dementia; Rx = treatment; SDAT= Senile Dementia of the Alzheimer Type; t.i.d. = three times daily; VD = vascular dementia. | |||||||
| Study | SCAG/EACG | CGI | ADAS‐Cog | MMSE | NOSGER | SGRS | BDRS | CBRS | Others |
| √ | Neuropsychology test | ||||||||
| √ | |||||||||
| √ | |||||||||
| √ | GBS, HRSD | ||||||||
| √ | √ | ||||||||
| GCIS | |||||||||
| EST, Depressiveness Scale | |||||||||
| Psychometric tests | |||||||||
| √ | √ | √ | √ | ||||||
| √ | √ | Psychometric tests | |||||||
| Abbreviations: ADAS‐Cog= The cognitive part of the Alzheimer's Disease Assessment Scale; BDRS= Blessed Dementia Rating Scale; CBRS= Crichton Behavioural Rating Scale; CGI= Clinical Global Impression; EACG= Echelle d'Appreciation Clinique en Geriatrie, French version of SCAG; EST= Erzigkeit's Short Syndrome test; HRSD= Hamilton Rating Scale for Depression; GBS= Gottfries‐Brane‐Steen Scale; GCIS= Gottschalk Cognitive Impairment Scale; MMSE= Mini Mental State Examination; NOSGER= Nurse's Observational Scale for Geriatric Patients; SCAG= Sandoz Clinical Assessment Geriatric Scale; SGRS= Stockton Geriatric Rating Scale; | |||||||||
| Outcome or subgroup title | No. of studies | No. of participants | Statistical method | Effect size |
| 1 Global impression (SCAG) Show forest plot | 1 | 47 | Mean Difference (IV, Fixed, 95% CI) | 2.7 [0.07, 5.33] |
| 2 Global impression (CGI) Show forest plot | 1 | 339 | Odds Ratio (M‐H, Fixed, 95% CI) | 1.83 [1.16, 2.91] |
| 3 Adverse events Show forest plot | 6 | 615 | Odds Ratio (M‐H, Fixed, 95% CI) | 1.00 [0.63, 1.60] |
| 4 Functional performance and behaviour Show forest plot | 2 | 96 | Std. Mean Difference (IV, Random, 95% CI) | ‐1.04 [‐1.73, ‐0.35] |
| 4.1 CBRS | 1 | 30 | Std. Mean Difference (IV, Random, 95% CI) | ‐1.47 [‐2.29, ‐0.65] |
| 4.2 SGRS | 1 | 66 | Std. Mean Difference (IV, Random, 95% CI) | ‐0.75 [‐1.25, ‐0.25] |
| 5 Mood Show forest plot | 2 | 81 | Std. Mean Difference (IV, Fixed, 95% CI) | ‐0.80 [‐1.26, ‐0.34] |
| 5.1 HRSD | 1 | 30 | Std. Mean Difference (IV, Fixed, 95% CI) | ‐1.03 [‐1.80, ‐0.26] |
| 5.2 Depressive Scale | 1 | 51 | Std. Mean Difference (IV, Fixed, 95% CI) | ‐0.67 [‐1.24, ‐0.10] |
| 6 Mood: change from baseline Show forest plot | 1 | 66 | Mean Difference (IV, Fixed, 95% CI) | ‐0.90 [‐1.73, ‐0.07] |
| 7 Cognition Show forest plot | 2 | 135 | Std. Mean Difference (IV, Random, 95% CI) | ‐0.36 [‐0.71, ‐0.02] |
| 7.1 ADAS‐Cog | 1 | 84 | Std. Mean Difference (IV, Random, 95% CI) | ‐0.48 [‐0.92, ‐0.05] |
| 7.2 EST | 1 | 51 | Std. Mean Difference (IV, Random, 95% CI) | ‐0.17 [‐0.72, 0.38] |
| 8 Cognition: EACG, change from baseline Show forest plot | 1 | 66 | Mean Difference (IV, Fixed, 95% CI) | ‐1.45 [‐2.15, ‐0.75] |
| 9 Cognition (ADAS‐Cog, dichotomous data) Show forest plot | 1 | 339 | Odds Ratio (M‐H, Fixed, 95% CI) | 2.46 [1.46, 4.14] |
| 10 Combination scales: SCAG, change from baseline Show forest plot | 1 | 47 | Mean Difference (IV, Fixed, 95% CI) | 1.00 [0.03, 1.97] |
| 11 Combination scales: SCAG, dichotomous data Show forest plot | 1 | 339 | Odds Ratio (M‐H, Fixed, 95% CI) | 2.83 [1.68, 4.78] |
| 12 Combination scales (GBS) Show forest plot | 1 | 30 | Mean Difference (IV, Fixed, 95% CI) | 1.40 [‐9.29, 12.09] |
| 13 Combination scales (BDRS) Show forest plot | 1 | 30 | Mean Difference (IV, Fixed, 95% CI) | 0.90 [‐1.47, 3.27] |
| 14 Combination scales: NOSGER, dichotomous data Show forest plot | 1 | 339 | Odds Ratio (M‐H, Fixed, 95% CI) | 1.54 [0.98, 2.42] |
| 15 Death Show forest plot | 3 | 499 | Odds Ratio (M‐H, Fixed, 95% CI) | 1.13 [0.34, 3.72] |
| Outcome or subgroup title | No. of studies | No. of participants | Statistical method | Effect size |
| 1 Adverse events Show forest plot | 1 | 60 | Odds Ratio (M‐H, Fixed, 95% CI) | 1.38 [0.45, 4.17] |
| 2 Mood Show forest plot | 2 | 54 | Std. Mean Difference (IV, Fixed, 95% CI) | ‐0.82 [‐1.38, ‐0.25] |
| 3 Cognition (EST) Show forest plot | 1 | 24 | Mean Difference (IV, Fixed, 95% CI) | 0.30 [‐3.99, 4.59] |
| 4 Combination scales: GBS Show forest plot | 1 | 30 | Mean Difference (IV, Fixed, 95% CI) | 1.40 [‐9.29, 12.09] |
| 5 Combination scales: BDRS Show forest plot | 1 | 30 | Mean Difference (IV, Fixed, 95% CI) | 0.90 [‐1.47, 3.27] |
| Outcome or subgroup title | No. of studies | No. of participants | Statistical method | Effect size |
| 1 Global impression (CGI) Show forest plot | 1 | 339 | Odds Ratio (M‐H, Fixed, 95% CI) | 1.83 [1.15, 2.91] |
| 1.1 400mg/day | 1 | 172 | Odds Ratio (M‐H, Fixed, 95% CI) | 2.08 [1.08, 4.03] |
| 1.2 600mg/day | 1 | 167 | Odds Ratio (M‐H, Fixed, 95% CI) | 1.62 [0.85, 3.10] |
| 2 Adverse events Show forest plot | 3 | 460 | Odds Ratio (M‐H, Fixed, 95% CI) | 0.85 [0.49, 1.45] |
| 3 Mood (Depressive scale) Show forest plot | 1 | 27 | Mean Difference (IV, Fixed, 95% CI) | ‐7.80 [‐14.90, ‐0.70] |
| 4 Cognition Show forest plot | 2 | 111 | Std. Mean Difference (IV, Fixed, 95% CI) | ‐0.46 [‐0.84, ‐0.08] |
| 4.1 ADAS‐Cog | 1 | 84 | Std. Mean Difference (IV, Fixed, 95% CI) | ‐0.48 [‐0.92, ‐0.05] |
| 4.2 EST | 1 | 27 | Std. Mean Difference (IV, Fixed, 95% CI) | ‐0.39 [‐1.15, 0.38] |
| 5 Cognition: ADAS‐Cog, dichotomous data Show forest plot | 1 | 278 | Odds Ratio (M‐H, Fixed, 95% CI) | 2.44 [1.36, 4.35] |
| 5.1 400mg/day | 1 | 140 | Odds Ratio (M‐H, Fixed, 95% CI) | 2.67 [1.16, 6.11] |
| 5.2 600mg/day | 1 | 138 | Odds Ratio (M‐H, Fixed, 95% CI) | 2.24 [0.99, 5.04] |
| 6 Combination scales: NOSGER, dichotomous data Show forest plot | 1 | 339 | Odds Ratio (M‐H, Fixed, 95% CI) | 1.54 [0.98, 2.41] |
| 6.1 400 mg/day | 1 | 172 | Odds Ratio (M‐H, Fixed, 95% CI) | 1.63 [0.86, 3.09] |
| 6.2 600 mg/day | 1 | 167 | Odds Ratio (M‐H, Fixed, 95% CI) | 1.45 [0.77, 2.74] |
| 7 Combination scales: SCAG, dichotomous data Show forest plot | 1 | 339 | Odds Ratio (M‐H, Fixed, 95% CI) | 2.83 [1.68, 4.78] |
| 7.1 400 mg/day | 1 | 172 | Odds Ratio (M‐H, Fixed, 95% CI) | 2.71 [1.29, 5.66] |
| 7.2 600 mg/day | 1 | 167 | Odds Ratio (M‐H, Fixed, 95% CI) | 2.96 [1.41, 6.22] |
| 8 Death Show forest plot | 2 | 433 | Odds Ratio (M‐H, Fixed, 95% CI) | 1.19 [0.32, 4.46] |
| Outcome or subgroup title | No. of studies | No. of participants | Statistical method | Effect size |
| 1 Global impression: change from baseline Show forest plot | 1 | 47 | Mean Difference (IV, Fixed, 95% CI) | 2.7 [0.07, 5.33] |
| 2 Adverse events Show forest plot | 3 | 122 | Odds Ratio (M‐H, Fixed, 95% CI) | 3.31 [0.72, 15.31] |
| 3 Functional performance and behaviour: change from baseline Show forest plot | 2 | 96 | Std. Mean Difference (IV, Random, 95% CI) | ‐1.04 [‐1.73, ‐0.35] |
| 3.1 CBRS | 1 | 30 | Std. Mean Difference (IV, Random, 95% CI) | ‐1.47 [‐2.29, ‐0.65] |
| 3.2 SGRS | 1 | 66 | Std. Mean Difference (IV, Random, 95% CI) | ‐0.75 [‐1.25, ‐0.25] |
| 4 Mood (EACG, change from baseline) Show forest plot | 1 | 66 | Mean Difference (IV, Fixed, 95% CI) | ‐0.90 [‐1.73, ‐0.07] |
| 5 Cognition (EACG, change from baseline) Show forest plot | 1 | 66 | Mean Difference (IV, Fixed, 95% CI) | ‐1.45 [‐2.15, ‐0.75] |
| 6 Combination scales (SCAG) Show forest plot | 1 | 47 | Mean Difference (IV, Fixed, 95% CI) | 1.00 [0.03, 1.97] |
| 7 Death Show forest plot | 1 | 66 | Odds Ratio (M‐H, Fixed, 95% CI) | 0.88 [0.05, 14.73] |
| Outcome or subgroup title | No. of studies | No. of participants | Statistical method | Effect size |
| 1 Global impression (SCAG) Show forest plot | 1 | 47 | Mean Difference (IV, Fixed, 95% CI) | 2.7 [0.07, 5.33] |
| 2 Adverse events Show forest plot | 4 | 182 | Odds Ratio (M‐H, Fixed, 95% CI) | 1.90 [0.78, 4.59] |
| 3 Functional performance and behaviour: change from baseline Show forest plot | 2 | 82 | Std. Mean Difference (IV, Fixed, 95% CI) | ‐0.81 [‐1.28, ‐0.34] |
| 3.1 CBRS | 1 | 16 | Std. Mean Difference (IV, Fixed, 95% CI) | ‐1.23 [‐2.58, 0.12] |
| 3.2 SGRS | 1 | 66 | Std. Mean Difference (IV, Fixed, 95% CI) | ‐0.75 [‐1.25, ‐0.25] |
| 4 Mood (Depressive scale) Show forest plot | 1 | 51 | Mean Difference (IV, Fixed, 95% CI) | ‐5.5 [‐9.82, ‐1.18] |
| 5 Mood (EACG, change from baseline) Show forest plot | 1 | 66 | Mean Difference (IV, Fixed, 95% CI) | ‐0.90 [‐1.73, ‐0.07] |
| 6 Cognition (EST) Show forest plot | 1 | 51 | Mean Difference (IV, Fixed, 95% CI) | ‐0.90 [‐3.84, 2.04] |
| 7 Cognition (EACG change from baseline) Show forest plot | 1 | 66 | Mean Difference (IV, Fixed, 95% CI) | ‐1.45 [‐2.15, ‐0.75] |
| 8 Combination scales (SCAG) Show forest plot | 1 | 47 | Mean Difference (IV, Fixed, 95% CI) | 1.00 [0.03, 1.97] |
| 9 Death Show forest plot | 1 | 66 | Odds Ratio (M‐H, Fixed, 95% CI) | 0.88 [0.05, 14.73] |
| Outcome or subgroup title | No. of studies | No. of participants | Statistical method | Effect size |
| 1 Global impression (CGI, continuous data) Show forest plot | 1 | 339 | Odds Ratio (M‐H, Fixed, 95% CI) | 1.83 [1.16, 2.91] |
| 2 Adverse effects Show forest plot | 2 | 433 | Odds Ratio (M‐H, Fixed, 95% CI) | 0.76 [0.43, 1.34] |
| 3 Mood (HRSD) Show forest plot | 1 | 30 | Std. Mean Difference (IV, Fixed, 95% CI) | ‐1.03 [‐1.80, ‐0.26] |
| 4 Cognition (ADAS‐Cog, continuous data) Show forest plot | 1 | 84 | Std. Mean Difference (IV, Fixed, 95% CI) | ‐0.48 [‐0.92, ‐0.05] |
| 5 Cognition (ADAS‐Cog, dichotomous data) Show forest plot | 1 | 339 | Odds Ratio (M‐H, Fixed, 95% CI) | 2.46 [1.46, 4.14] |
| 6 Combination scales: GBS Show forest plot | 1 | 30 | Mean Difference (IV, Fixed, 95% CI) | 1.40 [‐9.29, 12.09] |
| 7 Combination scales: BDRS Show forest plot | 1 | 30 | Mean Difference (IV, Fixed, 95% CI) | 0.90 [‐1.47, 3.27] |
| 8 Combination scales: SCAG, dichotomous data Show forest plot | 1 | 339 | Odds Ratio (M‐H, Fixed, 95% CI) | 2.83 [1.68, 4.78] |
| 9 Combination scales: NOSGER, dichotomous data Show forest plot | 1 | 339 | Odds Ratio (M‐H, Fixed, 95% CI) | 1.54 [0.98, 2.42] |
| 10 Death Show forest plot | 2 | 433 | Odds Ratio (M‐H, Fixed, 95% CI) | 1.19 [0.32, 4.46] |