Scolaris Content Display Scolaris Content Display

Methodological quality graph: review authors' judgements about each methodological quality item presented as percentages across all included studies.
Figuras y tablas -
Figure 1

Methodological quality graph: review authors' judgements about each methodological quality item presented as percentages across all included studies.

Methodological quality summary: review authors' judgements about each methodological quality item for each included study.
Figuras y tablas -
Figure 2

Methodological quality summary: review authors' judgements about each methodological quality item for each included study.

Comparison 1 Intraoperative Mitomycin C versus control, Outcome 1 Failure at 12 months.
Figuras y tablas -
Analysis 1.1

Comparison 1 Intraoperative Mitomycin C versus control, Outcome 1 Failure at 12 months.

Comparison 1 Intraoperative Mitomycin C versus control, Outcome 2 Mean intraocular pressure at 12 months.
Figuras y tablas -
Analysis 1.2

Comparison 1 Intraoperative Mitomycin C versus control, Outcome 2 Mean intraocular pressure at 12 months.

Comparison 1 Intraoperative Mitomycin C versus control, Outcome 3 Complications ‐ wound leak.
Figuras y tablas -
Analysis 1.3

Comparison 1 Intraoperative Mitomycin C versus control, Outcome 3 Complications ‐ wound leak.

Comparison 1 Intraoperative Mitomycin C versus control, Outcome 4 Complications ‐ hypotony.
Figuras y tablas -
Analysis 1.4

Comparison 1 Intraoperative Mitomycin C versus control, Outcome 4 Complications ‐ hypotony.

Comparison 1 Intraoperative Mitomycin C versus control, Outcome 5 Complications ‐ late endophthalmitis.
Figuras y tablas -
Analysis 1.5

Comparison 1 Intraoperative Mitomycin C versus control, Outcome 5 Complications ‐ late endophthalmitis.

Comparison 1 Intraoperative Mitomycin C versus control, Outcome 6 Complications ‐ expulsive haemorrhage.
Figuras y tablas -
Analysis 1.6

Comparison 1 Intraoperative Mitomycin C versus control, Outcome 6 Complications ‐ expulsive haemorrhage.

Comparison 1 Intraoperative Mitomycin C versus control, Outcome 7 Complications ‐ shallow anterior chamber.
Figuras y tablas -
Analysis 1.7

Comparison 1 Intraoperative Mitomycin C versus control, Outcome 7 Complications ‐ shallow anterior chamber.

Comparison 1 Intraoperative Mitomycin C versus control, Outcome 8 Complications ‐ cataract.
Figuras y tablas -
Analysis 1.8

Comparison 1 Intraoperative Mitomycin C versus control, Outcome 8 Complications ‐ cataract.

Intraoperative Mitomycin C compared with no antimetabolite or placebo for trabeculectomy surgery for glaucoma

Patient or population: People undergoing trabeculectomy surgery with glaucoma

Settings: Eye clinics and hospitals

Intervention: Intraoperative Mitomycin C applied in any dose for any duration

Comparison: Placebo application or nothing

Outcomes

Illustrative comparative risks* (95% CI)

Relative effect
(95% CI)

No of Participants
(studies)

Quality of the evidence
(GRADE)

Comments

Assumed risk

Corresponding risk

control

mitomycin C

Trabeculectomy

failure

at 12 months

Low risk population

RR 0.37 (0.26 to 0.51)

698
(11)

+++O
moderate

medium risk population

poorly designed studies may underestimate
effect

280 per 1000

77 per 1000
([value] to [value])

Medium risk population

127 per 1000

135 per 1000
([value] to [value])

High risk population

505 per 1000

156 per 1000
([value] to [value])

mean

intraocular

pressure

mmHg

at 12 months

The mean IOP ranged across control groups from
15.9 to 23.9 mmHg

The mean IOP in the intervention groups was
11.1 to 14.6 mmHg

the WMD was

‐4.1 mmHg

[‐4.68 to ‐3.34]

mmHg

380
[8]

+++O
moderate

complications

wound leak by 12 months

Low risk population

RR 1.84 (0.72 to 4.66)

333
(7)

++OO
low

no events reported in trials of high risk
patients

45 per 1000

114 per 1000
([value] to [value])

Medium risk population

84 per 1000

112 per 1000
([value] to [value])

High risk population

inestimable

inestimable

complications

hypotony occurring

up to 12 months

Low risk population

RR 1.8 (0.79 to 4.12)

488
(10)

++OO
low

inconsistently defined and reported

58 per 1000

61 per 1000
([value] to [value])

Medium risk population

14 per 1000

37 per 1000
([value] to [value])

High risk population

31 per 1000

83 per 1000
([value] to [value])

complications

shallow anterior chamber

occurring within 12 months

Low risk population

RR 1.14 (0.42 to 3.07)

441
(10)

++OO
low

inconsistently defined and reported

169 per 1000

151 per 1000
([value] to [value])

Medium risk population

0 per 1000

9 per 1000
([value] to [value])

High risk population

145 per 1000

200 per 1000
([value] to [value])

cataract formation by 12 months

Low risk population

RR 1.8 (1.00 to 3.22)

482
(7)

+++O
moderate

outcome not relevant to medium risk population because these are combined cataract extraction and glaucoma procedures

93 per 1000

190 per 1000
([value] to [value])

High risk population

57 per 1000

80 per 1000
([value] to [value])

*The basis for the assumed risk (e.g. the median control group risk across studies) is provided in footnotes. The corresponding risk (and its 95% confidence interval) is based on the assumed risk in the comparison group and the relative effect of the intervention (and its 95% CI).

CI: Confidence interval; RR: Risk Ratio; [other abbreviations, e.g.. OR, etc]

GRADE Working Group grades of evidence
High quality: Further research is very unlikely to change our confidence in the estimate of effect.
Moderate quality: Further research is likely to have an important impact on our confidence in the estimate of effect and may change the estimate.
Low quality: Further research is very likely to have an important impact on our confidence in the estimate of effect and is likely to change the estimate.
Very low quality: We are very uncertain about the estimate.

Figuras y tablas -
Table 1. Mean baseline IOP and failure criteria

Trial

Mean baseline IOP

Failure criterion

Shin 1995

20.8 mmHg

< 20 mmHg plus > 20% fall in baseline IOP, without topical medication

Cohen 1996

21.3 mmHg

Eye requires additional glaucoma surgery

Costa 1996

25.6 mmHg

< 15 mmHg, without topical medication

Turacli 1996

31.9 mmHg

< 20 mmHg or > 25% fall in baseline IOP, without topical medication

Wu 1996

40.3 mmHg

< 21 mmHg , without topical medication

Andreanos 1997

32.4 mmHg

< 21 mmHg, without topical medication

Carlson 1997

18.8 mmHg

Not specified but results show all eyes were < 21 mmHg, topical medication was used

Martini 1997

28.2 mmHg

< 18 mmHg on or off topical medication

Robin 1997

29.7 mmHg

< 19 mmHg on or off topical medication

Szymanski 1997

Not specified

< 15 mmHg on topical medication

Shin 1998

17.6 mmHg

Eye requires glaucoma surgery, needling or topical medication

Figuras y tablas -
Table 1. Mean baseline IOP and failure criteria
Comparison 1. Intraoperative Mitomycin C versus control

Outcome or subgroup title

No. of studies

No. of participants

Statistical method

Effect size

1 Failure at 12 months Show forest plot

11

698

Risk Ratio (M‐H, Fixed, 95% CI)

0.37 [0.26, 0.51]

1.1 High risk

4

193

Risk Ratio (M‐H, Fixed, 95% CI)

0.32 [0.20, 0.53]

1.2 Cataract extraction combined with trabeculectomy

3

167

Risk Ratio (M‐H, Fixed, 95% CI)

0.81 [0.37, 1.80]

1.3 Primary trabeculectomy

4

338

Risk Ratio (M‐H, Fixed, 95% CI)

0.29 [0.16, 0.53]

2 Mean intraocular pressure at 12 months Show forest plot

8

380

Mean Difference (IV, Fixed, 95% CI)

‐4.01 [‐4.68, ‐3.34]

2.1 High risk

3

144

Mean Difference (IV, Fixed, 95% CI)

‐5.31 [‐6.76, ‐3.85]

2.2 Cataract extraction combined with trabeculectomy

3

148

Mean Difference (IV, Fixed, 95% CI)

‐3.34 [‐4.16, ‐2.51]

2.3 Primary trabeculectomy

2

88

Mean Difference (IV, Fixed, 95% CI)

‐5.41 [‐7.34, ‐3.49]

3 Complications ‐ wound leak Show forest plot

7

333

Odds Ratio (M‐H, Fixed, 95% CI)

1.84 [0.72, 4.66]

3.1 High risk

2

98

Odds Ratio (M‐H, Fixed, 95% CI)

0.0 [0.0, 0.0]

3.2 Cataract extraction combined with trabeculectomy

3

178

Odds Ratio (M‐H, Fixed, 95% CI)

1.88 [0.68, 5.16]

3.3 Primary trabeculectomy

2

57

Odds Ratio (M‐H, Fixed, 95% CI)

1.65 [0.16, 17.47]

4 Complications ‐ hypotony Show forest plot

10

488

Odds Ratio (M‐H, Fixed, 95% CI)

1.80 [0.79, 4.12]

4.1 High risk

4

193

Odds Ratio (M‐H, Fixed, 95% CI)

2.83 [0.76, 10.48]

4.2 Cataract extraction combined with trabeculectomy

3

178

Odds Ratio (M‐H, Fixed, 95% CI)

1.65 [0.34, 7.94]

4.3 Primary trabeculectomy

3

117

Odds Ratio (M‐H, Fixed, 95% CI)

1.05 [0.23, 4.68]

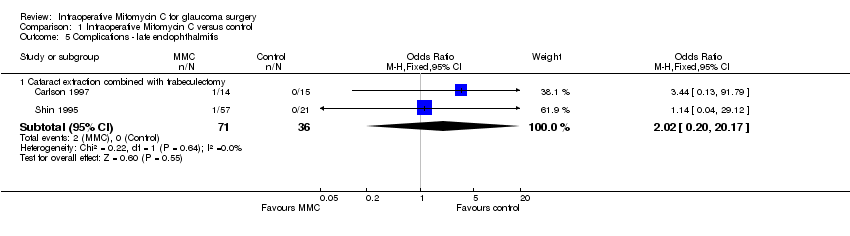
5 Complications ‐ late endophthalmitis Show forest plot

2

Odds Ratio (M‐H, Fixed, 95% CI)

Subtotals only

5.1 Cataract extraction combined with trabeculectomy

2

107

Odds Ratio (M‐H, Fixed, 95% CI)

2.02 [0.20, 20.17]

6 Complications ‐ expulsive haemorrhage Show forest plot

10

Odds Ratio (M‐H, Fixed, 95% CI)

Totals not selected

6.1 High risk

3

Odds Ratio (M‐H, Fixed, 95% CI)

0.0 [0.0, 0.0]

6.2 Cataract extraction combined with trabeculectomy

3

Odds Ratio (M‐H, Fixed, 95% CI)

0.0 [0.0, 0.0]

6.3 Primary trabeculectomy

4

Odds Ratio (M‐H, Fixed, 95% CI)

0.0 [0.0, 0.0]

7 Complications ‐ shallow anterior chamber Show forest plot

10

441

Odds Ratio (M‐H, Fixed, 95% CI)

1.38 [0.73, 2.63]

7.1 High risk

3

144

Odds Ratio (M‐H, Fixed, 95% CI)

1.49 [0.62, 3.60]

7.2 Cataract extraction combined with trabeculectomy

3

178

Odds Ratio (M‐H, Fixed, 95% CI)

3.44 [0.13, 91.79]

7.3 Primary trabeculectomy

4

119

Odds Ratio (M‐H, Fixed, 95% CI)

1.14 [0.42, 3.07]

8 Complications ‐ cataract Show forest plot

7

482

Risk Ratio (M‐H, Fixed, 95% CI)

1.80 [1.00, 3.22]

8.1 High risk

3

144

Risk Ratio (M‐H, Fixed, 95% CI)

1.38 [0.45, 4.24]

8.2 Primary trabeculectomy

4

338

Risk Ratio (M‐H, Fixed, 95% CI)

1.93 [0.98, 3.80]

Figuras y tablas -
Comparison 1. Intraoperative Mitomycin C versus control