Phosphodiesterase 4 inhibitors for chronic obstructive pulmonary disease
Abstract
Background
Chronic obstructive pulmonary disease (COPD) is associated with cough, sputum production or dyspnoea and a reduction in lung function, quality of life and life expectancy. Apart from smoking cessation, there are no other treatments that slow lung function decline. Roflumilast and cilomilast are oral phosphodiesterase 4 (PDE4) inhibitors proposed to reduce the airway inflammation and bronchoconstriction seen in COPD. This is an update of a Cochrane review first published in 2011 and updated in 2013.
Objectives
To evaluate the efficacy and safety of oral PDE4 inhibitors in the management of stable COPD.
Search methods
We identified randomised controlled trials (RCTs) from the Cochrane Airways Trials Register (date of last search October 2016). We found other trials from web‐based clinical trials registers.
Selection criteria
We included RCTs if they compared oral PDE4 inhibitors with placebo in people with COPD. We allowed co‐administration of standard COPD therapy.
Data collection and analysis
One review author extracted data and a second review author checked the data. We reported pooled data in Review Manager as mean differences (MD), standardised mean differences (SMD) or odds ratios (OR). We converted the odds ratios into absolute treatment effects in a 'Summary of findings' table.
Main results
Thirty‐four separate RCTs studying roflumilast (20 trials with 17,627 participants) or cilomilast (14 trials with 6457 participants) met the inclusion criteria, with a duration of between six weeks and one year. These included people across international study centres with moderate to very severe COPD (Global Initiative for Chronic Obstructive Lung Disease (GOLD) grades II‐IV), with a mean age of 64 years.
We considered that the methodological quality of the 34 published and unpublished trials was acceptable overall. Treatment with a PDE4 inhibitor was associated with a significant improvement in forced expiratory volume in one second (FEV1) over the trial period compared with placebo (MD 51.53 mL, 95% confidence interval (CI) 43.17 to 59.90, 27 trials with 20,585 participants, moderate‐quality evidence due to moderate levels of heterogeneity and risk of reporting bias). There were small improvements in quality of life (St George's Respiratory Questionnaire (SGRQ), MD ‐1.06 units, 95% CI ‐1.68 to ‐0.43, 11 trials with 7645 participants, moderate‐quality evidence due to moderate levels of heterogeneity and risk of reporting bias) and COPD‐related symptoms, but no significant change in exercise tolerance. Treatment with a PDE4 inhibitor was associated with a reduced likelihood of COPD exacerbation (OR 0.78, 95% CI 0.73 to 0.83; 23 trials with 19,948 participants, high‐quality evidence). For every 100 people treated with PDE4 inhibitors, five more remained exacerbation‐free during the study period compared with placebo (number needed to treat for an additional beneficial outcome (NNTB) 20, 95% CI 16 to 26). More participants in the treatment groups experienced non‐serious adverse events compared with controls, particularly a range of gastrointestinal symptoms such as diarrhoea, nausea, vomiting or dyspepsia. For every 100 people treated with PDE4 inhibitors, seven more suffered from diarrhoea during the study period compared with placebo (number needed to treat for an additional harmful outcome (NNTH) 15, 95% CI 13 to 17). Roflumilast in particular was associated with weight loss during the trial period and an increase in insomnia and depressive mood symptoms. There was no significant effect of treatment on non‐fatal serious adverse events (OR 0.99, 95% CI 0.91 to 1.07) or mortality (OR 0.97, 95% CI 0.76 to 1.23), although mortality was a rare event during the trials. Participants treated with PDE4 inhibitors were more likely to withdraw from the trials because of adverse effects; on average 14% in the treatment groups withdrew compared with 8% in the control groups.
Authors' conclusions
In people with COPD, PDE4 inhibitors offered benefit over placebo in improving lung function and reducing the likelihood of exacerbations; however, they had little impact on quality of life or symptoms. Gastrointestinal adverse effects and weight loss were common, and safety data submitted to the US Food and Drug Administration (FDA) have raised concerns over psychiatric adverse events with roflumilast. The findings of this review give cautious support to the use of PDE4 inhibitors in COPD. They may be best used as add‐on therapy in a subgroup of people with persistent symptoms or exacerbations despite optimal COPD management. This is in accordance with the GOLD 2017 guidelines. Longer‐term trials are needed to determine whether or not PDE4 inhibitors modify FEV1 decline, hospitalisation or mortality in COPD.
PICO
Plain language summary
In people with chronic obstructive pulmonary disease (COPD), what are the benefits and risks of phosphodiesterase 4 inhibitors?
Background of the review
Chronic obstructive pulmonary disease (COPD) is a progressive lung condition caused by damage from harmful chemicals that are breathed in and is predominantly seen in people who smoke tobacco. These chemicals set up a cascade of inflammatory reactions, which damage structures in the lung but also increase mucus production in the airways. These processes lead to intermittent symptoms of breathlessness and decreased capacity to perform day‐to‐day tasks. In addition, people with COPD are at greater risk of developing exacerbations ('flare ups'), which become more frequent and severe over time. People vary in terms of how they are affected by COPD. This is in part related to the severity of the disease but also to differences in response to medicines, an individual's fitness and coexistent conditions. The only way to prevent further lung damage in most people is to stop smoking.
Medicines prescribed to manage COPD generally aim to improve symptoms, reduce exacerbations or both. In the early stages, bronchodilator medicines are helpful because these relax the small muscles in the airway allowing more air to move freely in and out of the lungs. Some long‐acting agents may reduce exacerbations. Steroid‐containing inhalers may be added specifically to target inflammation in the lungs and thus modestly reduce the number of exacerbations.
Phosphodiesterase 4 (PDE4) inhibitors are a relatively new class of medicines that have been marketed to improve COPD. They have both bronchodilator and anti‐inflammatory effects. Moreover, the two currently available medicines, roflumilast and cilomilast, are taken as a tablet. Our review collated and analysed existing trials to define the benefits and risks of PDE4 inhibitors in COPD.
What did we look at?
We found 34 completed trials involving 24,084 adults, with results reported up to October 2016. These consisted mainly of trials in people with moderate to very severe disease who discontinued other regular COPD medications. However, there were seven trials that allowed continuation of usual COPD medicines. The trials ranged from 6 to 52 weeks' duration and the average age of participants was 64 years. The trials were all sponsored by the manufacturers of PDE4 inhibitors.
What did we find out?
Compared with placebo, these medicines provide a small improvement in lung function measurements and reduce the likelihood of an exacerbation of COPD. Based on these results, we would expect that out of 100 people who took PDE4 inhibitors every day for a year, 28 would experience at least one exacerbation which is five fewer than for others who did not receive these medicines.
However, people reported that these medicines only provided a small effect on levels of breathlessness and quality of life. Furthermore, around 5% to 10% of people in trials who received roflumilast or cilomilast reported side effects such as diarrhoea, nausea and vomiting. We would expect that out of 100 people who took PDE4 inhibitors every day for a year, 11 would experience diarrhoea, which is seven more than for others who did not receive these medicines. There was also a two‐ to three‐fold increase in the risk of sleep or mood disturbance for the roflumilast 500 μg dose, although overall the total number of reported incidents was still small. There was no effect on rates of hospitalisation and deaths. The effects were the same regardless of the severity of COPD, or whether other medicines for COPD were being taken.
Quality of the evidence
The studies were generally well designed, as people did not know if they were receiving this new treatment or a placebo medicine. Overall we rated the evidence as being of moderate to high quality.
It is of concern that results seen in trials published in journals by pharmaceutical companies showed a greater benefit of these medicines than those which were unpublished. Therefore, this relies on unpublished trial data being made accessible and up to date. The psychiatric adverse effects data remain unpublished. Longer‐term trials are necessary to get a more accurate estimate of the benefits and safety of these medicines over time, including whether they slow COPD disease progression.
Authors' conclusions
Summary of findings
| Phosphodiesterase 4 inhibitors compared to placebo for chronic obstructive pulmonary disease | ||||||
| Patient or population: people with stable chronic obstructive pulmonary disease | ||||||
| Outcomes | Illustrative comparative risks* (95% CI) | Relative effect | No of participants | Quality of the evidence | Comments | |
| Assumed risk | Corresponding risk | |||||
| Placebo | Phosphodiesterase IV inhibitors | |||||
| Change in FEV1 lung function | The mean change in FEV1 lung function in the control groups was | The mean change in FEV1 lung function in the intervention groups was | 20,585 | ⊕⊕⊕⊝ | ||
| Change in quality of life | The mean change in quality of life in the control groups was an improvement of | The mean change in quality of life in the intervention groups was | 7645 | ⊕⊕⊕⊝ | Lower scores on SGRQ represent improved quality of life. This result does not reach the minimum clinically important difference for this scale. | |
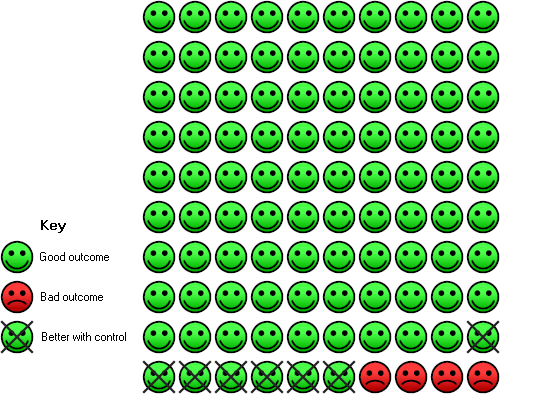
| COPD exacerbations | 33 per 100 | 28 per 100 | OR 0.78 | 19,948 | ⊕⊕⊕⊕ | See Figure 1 |
| Adverse events | 64 per 100 | 69 per 100 | OR 1.29 | 20,988 | ⊕⊕⊕⊝ | This outcome includes participants who reported COPD exacerbations as an adverse event |
| Gastrointestinal side effects | 4 per 100 | 11 per 100 | OR 3.13 | 20,181 | ⊕⊕⊕⊕ | Diarrhoea was the most commonly reported gastrointestinal side effect. See Figure 2 Weight loss was more common, and may be a result of diarrhoea |
| Psychiatric adverse events (roflumilast 500 µg) | 35 per 1000 | 71 per 1000 | OR 2.13 | 11,168 | ⊕⊕⊕⊝ | Pooled data from FDA website, not individual trial reports |
| Mortality (all‐cause) | 1 per 100 | 1 per 100 | OR 0.97 | 19,344 | ⊕⊕⊕⊝ | |
| *The basis for the assumed risk (e.g. the median control group risk across studies) is provided in footnotes. The corresponding risk (and its 95% confidence interval) is based on the assumed risk in the comparison group and the relative effect of the intervention (and its 95% CI). | ||||||
| GRADE Working Group grades of evidence | ||||||
| 1There was a greater proportion of participant withdrawals in the treatment (24%) compared with the control group (19%), but not sufficient to warrant downgrading the quality of evidence. 6There were very few events, leading to wide confidence intervals. | ||||||

In the control group 33 people out of 100 had an exacerbation of COPD over 6‐52 weeks, compared to 28 (95% CI 27 to 29) out of 100 for the active treatment group.

In the control group 4 people out of 100 had diarrhoea over 6‐52 weeks, compared to 11 (95% CI 10 to 12) out of 100 for the active treatment group.
Background
Description of the condition
Chronic obstructive pulmonary disease (COPD) is one of the leading causes of global morbidity and mortality, resulting in a growing social and economic burden (GOLD 2017). In 2002, it was estimated to be the fifth leading cause of death, responsible for approximately 4.8% of total deaths worldwide and it is projected to rise to fourth position by the year 2030 (Mathers 2005).
This diagnosis of COPD by the Global Initiative for Chronic Obstructive Lung Disease (GOLD 2017) says that it is a "common, preventable and treatable disease, characterized by persistent respiratory symptoms and airflow limitation that is due to airway and/or alveolar abnormalities usually caused by exposure to noxious particles or gases." COPD may be punctuated by periods of acute worsening of respiratory symptoms, called exacerbations. Besides exposures, host factors predispose individuals to develop COPD. Co‐morbidities contribute to the overall severity and mortality in individual people. (GOLD 2017). Diagnosis is based on a history of exposure to risk factors for this disease and symptoms of cough, sputum production or dyspnoea (shortness of breath). Spirometry is required for diagnosis, with airflow obstruction being confirmed by a post‐bronchodilator forced expiratory volume in one second (FEV1)/forced vital capacity (FVC) of 0.7 or lower (Celli 2004). Life expectancy is reduced in people diagnosed with COPD and, although prognosis is variable, age and FEV1 are the strongest predictors of mortality.
The predominant risk factor for COPD is tobacco smoking, with other environmental pollutants also known to contribute. Cigarette smoke leads to the activation of macrophages and CD8 T lymphocytes that release inflammatory mediators and cytokines. The process also involves neutrophil attraction and cell apoptosis (Barnes 2000). To date, smoking cessation is the only intervention known to slow the decline in lung function associated with COPD (GOLD 2017).
Pharmacotherapy is commonly used to treat people with COPD, with effects on symptoms, quality of life, or frequency and severity of exacerbations (Celli 2004; GOLD 2017). Mainstays of treatment include short‐ and long‐acting inhaled beta‐2 agonists and anticholinergics, corticosteroids and methylxanthines. New approaches to treatment are needed, as no individual agent slows the decline in lung function or survival. In the TORCH study (Calverley 2007) a combination of salmeterol 50 μg and fluticasone 500 μg twice daily reduced the risk of death by 17% compared with placebo over the three‐year trial period; however, this did not reach the pre‐defined level of statistical significance for the study.
An exacerbation of COPD is an acute and sustained increase in symptoms that result in additional therapy (GOLD 2017). The risk of exacerbation significantly increases in more severe COPD. Exacerbations have a negative impact on quality of life and lead to more rapid COPD progression, as well as higher health care utilisation and associated costs. Common triggers are respiratory viral infections, bacterial infections or air pollution (Wedzicha 2007; White 2003), which may lead to an increase in airway inflammation, production of mucus, acute deterioration in lung function, hyperinflation from gas trapping, or a combination of these symptoms (Van Geffen 2015). These processes contribute to the symptoms of increased dyspnoea and cough, as well as to changes in the character or volume of sputum.
Description of the intervention
The intervention is an oral medicine that is a selective inhibitor of the isoenzyme phosphodiesterase 4 (PDE4). This isoenzyme has a role in airway inflammation and bronchoconstriction, both of which are pathological features of COPD (Boswell‐Smith 2006). Two medicines in this class that have been studied are roflumilast and cilomilast.
How the intervention might work
Cyclic adenosine monophosphate (cAMP) is a secondary messenger that suppresses the activity of inflammatory cells and mediates the process of smooth muscle relaxation in the airways. Phosphodiesterases, in turn, hydrolyse and turn off the biological activity of cAMP (Boswell‐Smith 2006). Therefore, inhibitors of phosphodiesterase action should theoretically provide improvements in the extent of airway narrowing and damage from inflammation.
Non‐selective phosphodiesterase (PDE) inhibitors such as theophylline, a methylxanthine, have been used in the management of people with COPD for years. These are recommended by current international guidelines as part of adjunctive therapy to long‐acting bronchodilators (GOLD 2017). Limitations to their use include a narrow therapeutic margin, and the frequency of adverse effects, which may occur even when the plasma level is within the therapeutic range (Boswell‐Smith 2006). Common adverse effects associated with theophylline include headache, nausea, vomiting, diarrhoea, restlessness, nervousness, insomnia and gastrointestinal effects (Barnes 2003). Less common, but more serious, are the increased risks of cardiac arrhythmias and seizures (Barnes 2003). Some of the adverse effects associated with theophylline have been attributed to its non‐selective PDE inhibition and concurrent adenosine receptor antagonism (Barnes 2005).
The isoenzyme PDE4 is the predominant isoenzyme involved with metabolising cAMP in immune and inflammatory immune cells, such as neutrophils, macrophages, T cells and endothelial cells in COPD, in airway smooth muscle and pulmonary nerves (Agusti 2005; Boswell‐Smith 2006; Torphy 1998; Vignola 2004). Inhibition of PDE4 leads to elevation of cAMP in inflammatory and immunomodulatory cells, resulting in suppression of inflammatory cell function, relaxation of airways smooth muscle and modulation of pulmonary nerves (Boswell‐Smith 2006; Essayan 2001; Torphy 1999). Thus, PDE4 is an attractive target for inhibition in COPD. Furthermore, the central nervous system (CNS) and cardiovascular adverse effects experienced in patients treated with the non‐selective PDE inhibitor, theophylline, are a result of adenosine receptor antagonism. This feature is not present with PDE4 specific inhibitors (Vignola 2004).
Why it is important to do this review
The development of selective PDE4 inhibitors offers new hope for therapy offering both anti‐inflammatory and bronchodilatory effects in COPD, with fewer of the adverse effects encountered with non‐selective inhibitors. Additionally, PDE4 inhibitors may be easier to use because there is less pharmacokinetic variability and lower potential for drug interactions compared with theophylline (Barnes 2005). Several PDE4 inhibitors have been developed, with some progressing to phase III clinical trials. These include the second‐generation PDE4 inhibitors roflumilast (Nycomed, formerly Altana) and cilomilast (GlaxoSmithKline).
The 2017 GOLD guidelines (GOLD 2017) state that roflumilast may be considered in patients on triple inhaled therapy who still have exacerbations, an FEV1 of less than 50% predicted and chronic bronchitis, especially if they have had a hospitalisation in the last year.
This review focuses on the effect of PDE4 inhibitors in the management of people with stable COPD, using clinically important outcomes. Collating this evidence into a systematic review allows an assessment as to whether or not the theoretical benefits of PDE4 inhibitors translate into useful clinical effects, and may suggest the potential place of PDE4 inhibitors within the increasing pharmacopoeia of COPD treatments.
Objectives
To evaluate the efficacy and safety of oral PDE4 inhibitors in the management of stable COPD.
Methods
Criteria for considering studies for this review
Types of studies
We included randomised controlled trials (RCTs) that compared orally administered PDE4 inhibitors with placebo. We included any chronic treatment trials, but excluded single‐dose trials, as well as trials in acute exacerbations of COPD. We also excluded cross‐over trials.
Types of participants
Adults (over 18 years of age) with COPD, as defined by the American Thoracic Society, European Respiratory Society or GOLD, with airflow obstruction evident by spirometry with post‐bronchodilator FEV1/FVC of 0.7 or less (GOLD 2017). We considered trials that included participants with both COPD and asthma only if data from participants with COPD could be extracted separately from the study report, or through correspondence with the study authors. We excluded ex‐vivo experiments and trials with participants requiring mechanical ventilation on presentation.
Types of interventions
We included trials if they compared outcomes for participants who received an orally administered PDE4 inhibitor with those of control participants who received placebo.
In this latest update of the review, although not mentioned in the initial protocol, we have excluded cross‐over design studies as a way to minimise non‐random sources of bias between studies.
Types of outcome measures
Primary outcomes
-
Changes in lung function from baseline including forced expiratory volume in one second (FEV1), forced vital capacity (FVC) or peak expiratory flow rate (PEF)
-
Quality of life (e.g. total score on St George's Respiratory Questionnaire (SGRQ))
Secondary outcomes
-
Incidence of COPD exacerbations
-
Symptoms (breathlessness on Borg and other scales and Shortness of Breath Questionnaire; composite measures (summary symptom score))
-
Exercise tolerance (six‐minute walk test)
-
Adverse effects (number of participants experiencing one or more adverse event, e.g. gastrointestinal, central nervous system (CNS) and cardiovascular adverse events, change in weight, withdrawal rates)
-
Serious adverse events and mortality
Search methods for identification of studies
Electronic searches
We identified trials from the Cochrane Airways Trials Register, which is maintained by the Information Specialist for the Group. The Cochrane Airways Specialised Register contains studies identified from several sources:
-
monthly searches of the Cochrane Central Register of Controlled Trials (CENTRAL), through the Cochrane Register of Studies Online (crso.cochrane.org);
-
weekly searches of MEDLINE Ovid SP 1946 to date;
-
weekly searches of Embase Ovid SP 1974 to date;
-
Monthly searches of PsycINFO Ovid SP;
-
Monthly searches of CINAHL EBSCO (Cumulative Index to Nursing and Allied Health Literature);
-
Monthly searches of AMED EBSCO (Allied and Complementary Medicine);
-
handsearches of the proceedings of major respiratory conferences.
Studies contained in the Specialised Register are identified through search strategies based on the scope of Cochrane Airways. Details of these strategies, as well as a list of handsearched conference proceedings are in Appendix 1. See Appendix 2 for search terms used to identify studies for this review.
We conducted the most recent search in October 2016, with no restriction on language of publication. The original strategy for this review, which was more sensitive but less specific, is in Appendix 3.
Searching other resources
We reviewed the reference lists of all primary trials and review articles for additional references. We contacted investigators in this area and pharmaceutical companies manufacturing PDE4 inhibitors to ascertain if they could provide any potentially relevant trial data. We also searched the US Food & Drug Administration (FDA) website and US National Institutes of Health (NIH) clinical trials registry, ClinicalTrials.gov (last accessed 31 May 2017).
Data collection and analysis
Selection of studies
Two review authors (JC, PP) independently screened the search results to select citations to retrieve in full text. The same two review authors then screened the full‐text articles to identify studies for inclusion.
Data extraction and management
One review author (JC) extracted data from the eligible studies and a second review author (BL or PP) checked the data. We entered data into Review Manager 5 (RevMan 5) RevMan 2014. In some cases, we estimated information regarding outcomes from graphs. Where standard errors (SE) were reported, we converted them to standard deviations (SD).
We extracted the following data.
-
Methods: trial design, duration of follow‐up
-
Participants: age, gender, smoking status, study setting, inclusion and exclusion criteria
-
Intervention: drug name, dose, duration of treatment, control and/or standard therapy
-
Outcome measures
We categorised references according to the trial name (by drug name and number, or by author and year). We obtained data on additional outcomes from other references to the same trial, and more detailed descriptions of study populations from information submitted by the drug manufacturer to the FDA website.
Where there were data from more than one report of the same trial, we considered the data from the primary published reference with the most complete data on the primary outcome(s) to take priority. For primary outcomes, we used intention‐to‐treat analysis in preference to per‐protocol analysis. On the other hand, the trial data on the company website for Cilomilast 076 provided more complete details of adverse events than Gamble 2003, and we used this preferentially.
Our initial plan had been to perform meta‐analysis on the change from baseline in post‐bronchodilator FEV1. Only pre‐bronchodilator values were reported for the majority of cilomilast trials, with pre‐ and post‐bronchodilator values available for most trials of roflumilast, with the exception of Roflumilast DAL‐MD‐01, Roflumilast FK1 101, Roflumilast FK1 103, Roflumilast FLUI‐2011‐77 and Roflumilast IN‐108 for which only post‐bronchodilator measures were available and only predose measurements available for Roflumilast ROF‐MD‐07(RE2SPOND).
In order to increase the number of trials in the meta‐analysis, we decided to use the change in the pre‐bronchodilator FEV1 for all trials, except for the five just mentioned, where it was not available. Between them, these three trials contributed only 3.4% to the mean difference (MD), with the mean change seen from baseline in FEV1 similar to other trials.
Lung function is reported in millilitres (mL). Exercise tolerance is reported in metres (m).
The outcome 'total adverse events' included the participants in each group experiencing one or more adverse events, including an acute exacerbation of COPD. Similarly, serious adverse events included conditions requiring hospital‐level treatment and encompassed more serious COPD exacerbations.
Assessment of risk of bias in included studies
We assessed trials using the 'Risk of bias' methods outlined in Chapter 8 of the Cochrane Handbook for Systematic Reviews of Interventions (Higgins 2011) as low, unclear or high.
Measures of treatment effect
Where appropriate, we combined data from trials using RevMan 2014. We expressed results for continuous variables using a fixed‐effect MD, or standardised mean difference (SMD), with 95% confidence intervals (CI). We expressed results for pooled outcomes with dichotomous variables using a fixed‐effect odds ratio (OR) with 95% CI. We considered a P value of less than 0.05 statistically significant. We combined rate ratios on a natural logarithm scale and weighted them by the inverse of the variance of the log rate ratio.
Unit of analysis issues
The unit of analysis was the participant, with the exception of analysis of exacerbation rates
Dealing with missing data
We contacted the respective pharmaceutical companies for missing trial data. In particular, Nycomed and Forest Laboratories provided us with some study details and results extracted from published articles and abstracts that were not identified in our initial search.
Assessment of heterogeneity
We used Chi2and I² statistics, along with P values (Higgins 2003) to measure heterogeneity among the trials in each analysis. Where we identified substantial heterogeneity we planned to report it and explore possible causes by prespecified subgroup analysis.
Assessment of reporting biases
We compared available published outcomes with prescribed methods and, where available, original study protocols.
Data synthesis
We presented the findings of our primary outcomes in a 'Summary of findings' table generated using GRADEpro GDT 2015 software and based on the recommendations in the Cochrane Handbook for Systematic Reviews of Interventions (Schünemann 2011).
Subgroup analysis and investigation of heterogeneity
We planned the following subgroup analyses a priori.
-
Severity of airflow obstruction at baseline (FEV1 % predicted GOLD Grade II 50% to 80%, Grade III 30% to 50%, Grade IV less than 30%) (GOLD 2017)
-
Drug (e.g. roflumilast, cilomilast)
-
Dose (e.g. roflumilast 250 μg or 500 μg)
-
Duration of therapy (12 weeks or less; 24 to 26 weeks; 52 weeks)
-
Concomitant therapy (inhaled or oral corticosteroids, inhaled long‐acting beta‐2 agonists, or anticholinergics, or both)
Sensitivity analysis
We planned the following sensitivity analyses a priori.
-
Fixed‐effect versus random‐effects models for studies with unexplained heterogeneity
-
Methodological quality
We did not anticipate the large number of unpublished trials at the protocol stage. Consequently, we undertook a sensitivity analysis of the effect sizes of the primary outcomes seen in published and unpublished trials.
Results
Description of studies
Results of the search
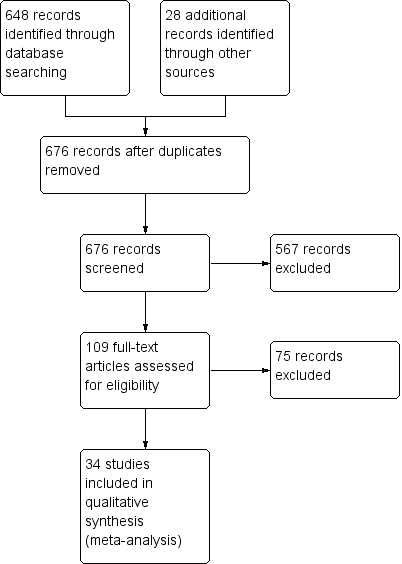
See Figure 3 for study flow diagram (Moher 2009).

Study flow diagram
For the initial search in October 2006, we identified 477 abstracts of potentially relevant trials, which was narrowed to 71 abstracts using a less sensitive search of the Cochrane Airways Specialised Register. We searched again in 2008 and located 79 abstracts; in 2010 finding 17 abstracts; and in 2013, locating 20 abstracts. For the present update, the search found 55 abstracts (48 excluding duplicates). In total 648 records were identified from database screening. Many abstracts were reports of earlier trials. We decided whether or not to seek the full text based on a review of the abstract text, title and MeSH headings of all identified citations, with the numbers of full papers sought outlined in Table 1.
| Search date: | No. of references for which we sought full text |
| December 2008 | 53 |
| January 2010 | 5 |
| August 2010 | 12 |
| June 2013 | 20 |
| October 2016 | 28 |
For this update we sought full papers for 28 abstracts. For each update, two review authors (JC and PP) assessed the full‐text versions of the trials to determine whether or not they met the inclusion criteria. We resolved any differences by discussion. We then assessed trials that met the inclusion criteria for methodological quality.
In addition, in the course of earlier updates we found 15 completed trials for roflumilast and one for cilomilast in participants with COPD in a search of the online clinical trials registry of the US National Institutes of Health (NIH). After attempting to correlate each unique NIH study number with trials already identified in the above searches of the Airways registry, there were seven studies of roflumilast on the NIH clinical trials registry that had not been published elsewhere in any form. For the 2016 update, no new completed trials were located on the NIH websites that had not already been published.
For cilomilast, we identified one trial (Compton 2001) from the literature search and obtained the full text. Further, we found a summary of the study design, along with a report of results, for 12 individual phase II or III trials on the GlaxoSmithKline (GSK) website.
We identified another two trials, both through the literature search and from the GSK website (Cilomilast 039; Cilomilast 076). Gamble 2003 is the primary published reference for the latter study.
During the 2016 update we identified 5 new studies of roflumilast but none of cilomilast. All the roflumilast studies used a study dose of 500 μg (RO‐2455‐301‐RD (ACROSS); RO‐2455‐404‐RD (REACT); Roflumilast DAL‐MD‐01; Roflumilast FLUI‐2011‐77; Roflumilast ROF‐MD‐07(RE2SPOND)).
Included studies
Thirty‐four separate RCTs studying roflumilast (20 trials with 17,627 participants) or cilomilast (14 trials with 6457 participants) met the inclusion criteria. Twenty‐one of these 34 studies have been published in full in a peer‐reviewed journal. Further details may be found in the Characteristics of included studies table.
Those for roflumilast included the following.
-
An early‐dose selection study comparing participants given roflumilast 250 μg and 500 μg (Roflumilast M2‐107) for 24 weeks. Subsequent studies all used 500 µg of roflumilast in the intervention group and this is the dose that appears in the analyses except where otherwise stipulated.
-
The first published one‐year study of PDE4 inhibitor treatment in COPD (Roflumilast M2‐112). This was the only trial included in this review that allowed concomitant corticosteroid use during the treatment period. Since then, the results of a replicate study have been published (Roflumilast M2‐111).
-
This was followed by two, year‐long studies (Roflumilast M2‐124; Roflumilast M2‐125) investigating the effect in a specific subgroup ‐ severe to very severe COPD associated with chronic bronchitis in participants at risk of exacerbations.
-
Two studies (Roflumilast M2‐127; Roflumilast M2‐128) that evaluated the add‐on use of roflumilast with long‐acting bronchodilator agents, the first with salmeterol and the second with tiotropium. Both studies ran for 24 weeks. A further two RO‐2455‐404‐RD (REACT) and Roflumilast ROF‐MD‐07(RE2SPOND) added roflumilast or placebo to a fixed‐dose inhaled corticosteroid–long‐acting beta‐2 agonist combination.
-
Roflumilast M2‐118 was a 12‐week study that focused on airway physiology during rest and exercise in participants with moderate to severe disease. In addition, Roflumilast M2‐119 investigated pulmonary function and safety in a group of participants recruited in centres across the Asia‐Pacific regions. Roflumilast DAL‐MD‐01 was mainly interested in effect on sputum and other biomarkers, and Roflumilast FLUI‐2011‐77, airway architecture by imaging techniques.
-
More recent large RCTs were RO‐2455‐301‐RD (ACROSS), a 24 week trial across three centres in mainland China, Hong Kong and Singapore, and RO‐2455‐404‐RD (REACT) and Roflumilast ROF‐MD‐07(RE2SPOND) year‐long multi‐centre trials.
There were two trials reported only as conference posters: Roflumilast FK1 101 and Roflumilast FK1 103. The first compared roflumilast 500 µg, roflumilast 250 µg and placebo for 26 weeks; the second compared roflumilast 500 µg once daily for 24 weeks with roflumilast 500 µg once daily for 12 weeks, then placebo once daily for the following 12 weeks.
Unpublished results were identified for two further studies: Roflumilast IN‐108 compared the safety and efficacy of roflumilast 250 μg and 500 μg in participants recruited from five centres across India; however, no inclusion criteria were stated, concomitant medications were poorly described and only 15 participants in the placebo group completed the protocol; Roflumilast JP‐706 was a 24‐week study sponsored by a different collaborator that, in addition to treatment effects, monitored pharmacokinetic levels of roflumilast and its metabolite roflumilast‐N‐oxide.
All of these were designed as randomised, double‐blind, placebo‐controlled studies and, apart from Roflumilast JP‐706, all studies prior to 2013 were included in combined safety figures for roflumilast that have been made available through publications on the FDA website (https://www.accessdata.fda.gov/drugsatfda_docs/nda/2011/022522Orig1s000MedR.pdf). This also includes participants in two other 24‐week studies (Roflumilast M2‐110; Roflumilast M2‐121), which have results that have not been published (roflumilast 500 µg: 5970, roflumilast 250 µg: 1002 and placebo: 5682).
For cilomilast, data were mainly from phase III clinical trials with one phase II/III trial. These included unpublished studies. All used a 15 mg dose twice daily except for Compton 2001.
The trials fell into four groups:
-
Compton 2001 was a parallel, six‐week, dose‐ranging study comparing placebo with 5 mg, 10 mg and 15 mg doses of cilomilast, with FEV1 as the primary outcome.
-
Pivotal efficacy studies (Cilomilast 039; Cilomilast 042; Cilomilast 091; Cilomilast 156), all of which were 24 weeks in duration. The studies Cilomilast 039 and Cilomilast 156 were conducted in North America, while Cilomilast 042 and Cilomilast 091 were conducted in the European Union. Here the primary study outcomes were change in FEV1, lung function and SGRQ quality‐of‐life score.
-
Supporting studies (Cilomilast 076; Cilomilast 110; Cilomilast 111; Cilomilast 168), all of which lasted for less than 24 weeks, with an average trial duration of 10.8 weeks, where neither FEV1 lung function nor SGRQ were the primary outcomes.
-
Other studies were Cilomilast 121 (phase II/III 24 weeks), Cilomilast 157 (52 weeks) and Cilomilast 103657 (24 weeks), which followed the pivotal efficacy studies and were smaller in sample size. Cilomilast 180 (18 weeks) had a primary lung function endpoint, functional residual capacity, and Cilomilast 181 (13 weeks) assessed the number of inflammatory cells in a bronchial biopsy.
Almost all studies used inclusion criteria of spirometry and a history of smoking. Only four of the 29 studies mandated a history of exacerbation in the previous year (Cilomilast 103657; Cilomilast 121; Roflumilast M2‐124; Roflumilast M2‐125).
The mean age of participants in the trials ranged from 60 to 70 years with the proportion of male participants between 49% and 96%. Mean FEV1 (% predicted) in the trials that reported it ranged from 33% to 51%. The majority of trials included participants at all stages of COPD, however limitation to those with severe and very severe COPD occurred in Roflumilast M2‐124; Roflumilast M2‐125; RO‐2455‐301‐RD (ACROSS); RO‐2455‐404‐RD (REACT); Roflumilast DAL‐MD‐01; Roflumilast M2‐111; Roflumilast M2‐112; Roflumilast ROF‐MD‐07(RE2SPOND).
Excluded studies
We excluded 75 records after studying the full text. We provided reasons for the exclusion of 26 studies, which can be found in Characteristics of excluded studies. For some of these the reason was that data were unusable (e.g. Borker 2003; Knobil 2003).
Risk of bias in included studies
We considered that the methodological quality of the 34 published and unpublished trials was acceptable overall.
Allocation
In the roflumilast trials, there were adequate descriptions of allocation concealment and method of blinding in nine out of 20 trials. Information about allocation concealment and blinding was only provided for one of the 14 cilomilast trials, while further details for the remaining trials were unclear. The risk of bias for each parameter in the 34 studies is shown in Figure 4.

Methodological quality summary: review authors' judgements about each methodological quality item for each included study.
Blinding
All studies included in this review were double‐blind, RCTs.
Incomplete outcome data
The percentage of participant withdrawals varied among the 34 trials that reported this outcome. Withdrawals were significantly higher in the PDE4 inhibitor‐treated groups compared with control groups. The mean withdrawal rate for roflumilast studies, because of adverse events, was 13% in the treatment group (range 3% to 37%) and 8% in the control group (range 3% to 27%). In the cilomilast studies a mean of 25% of the participants withdrew due to adverse events in the treatment group (range 13% to 34%) and 21% (range 9% to 40%) in the control group.
Since the participants who withdraw tended to have poorer outcome measures than those remaining, the higher withdrawal rates for the PDE4 inhibitor‐treated groups may have inflated the apparent benefits of treatment.
Selective reporting
There were 23 published and 11 unpublished trials. We performed analyses of differences in treatment effect between published and unpublished treatment groups for primary outcomes and this is reported in the subgroup and sensitivity analysis below.
Other potential sources of bias
In some trials there were minor differences in baseline characteristics such as age, gender, FEV1 and smoking history.
Effects of interventions
Change in lung function from baseline
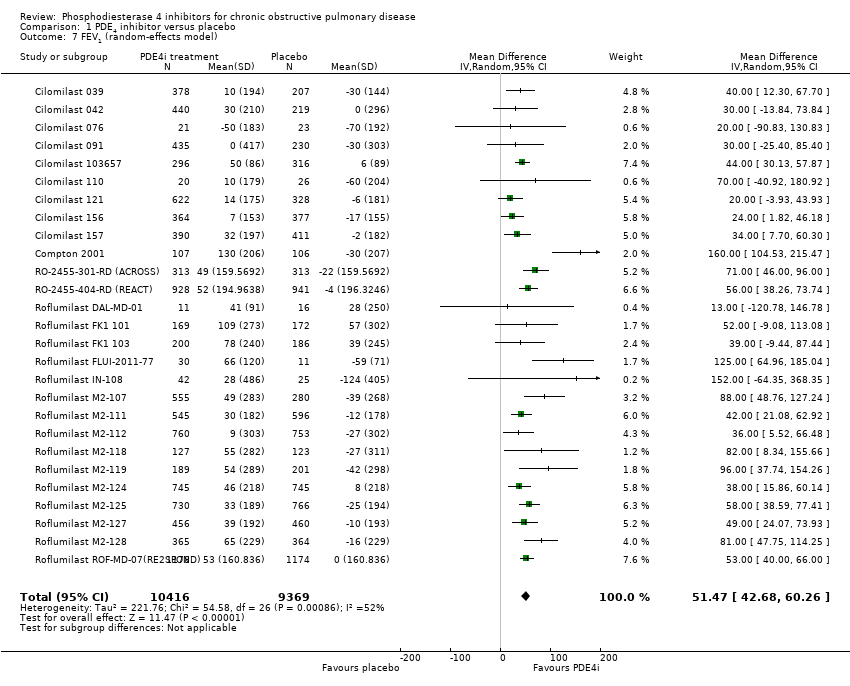
Based on the 27 trials that reported this outcome, there was a statistically significant improvement in FEV1 from baseline in the PDE4 inhibitor‐treated participants compared with controls (MD 51.53 mL, 95% CI 43.17 to 59.90, 20,585 participants), over the study period (Analysis 1.1).
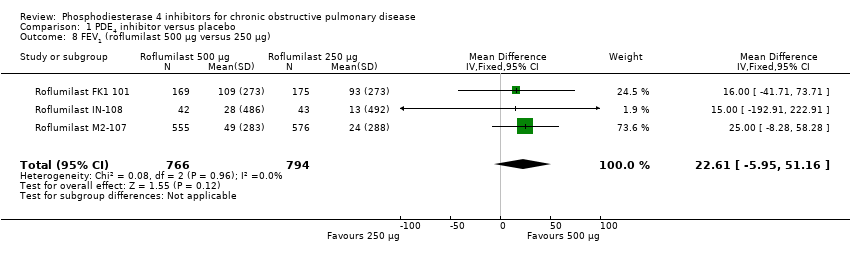
The effect on FEV1 was seen for roflumilast 500 µg (MD 56.45 mL, 95% CI 48.01 to 64.89), roflumilast 250 µg (MD 56.88 mL, 95% CI 24.38 to 89.38) and for cilomilast 15 mg twice daily (MD 41.03 mL ,95% CI 23.93 to 58.13). A moderate level of heterogeneity existed for this outcome (Chi² = 56, df = 29, P = 0.002; I² = 48%), which is only partially explained by investigating differences between roflumilast and cilomilast. This is discussed further in the sensitivity analysis below. Analysis of a dose effect was possible in three trials: Roflumilast FK1 101; Roflumilast M2‐107 and Roflumilast IN‐108. Roflumilast 500 μg was associated with a greater change in FEV1 than roflumilast 250 μg, but this was not statistically significant (MD 22.61, 95% CI ‐5.95 to 51.16).
With respect to PDE4 inhibitor use with concomitant therapies (Analysis 1.5), the largest increases in FEV1 were seen in the two trials where participants were taking regular, long‐acting bronchodilators: in one, salmeterol (Roflumilast M2‐127) and in the other, tiotropium (Roflumilast M2‐128) (overall MD 60.52 mL, 95% CI 40.57 to 80.46). The next largest improvements were seen in trials where all concomitant medications (including long‐acting bronchodilators if previously received) were continued (RO‐2455‐301‐RD (ACROSS); RO‐2455‐404‐RD (REACT); Roflumilast ROF‐MD‐07(RE2SPOND) (MD 56.58 mL, 95% CI 46.91 to 66.25).
Similar improvements were seen in trials where all medications apart from short‐acting beta 2 agonists were stopped (MD 44.78 mL, 95% CI 37.67 to 51.90) and in the three trials (Roflumilast M2‐111; Roflumilast M2‐112; Roflumilast M2‐118) where both treatment and control groups continued on an inhaled corticosteroid (MD 42.26 mL, 95% CI 25.46 to 59.05).
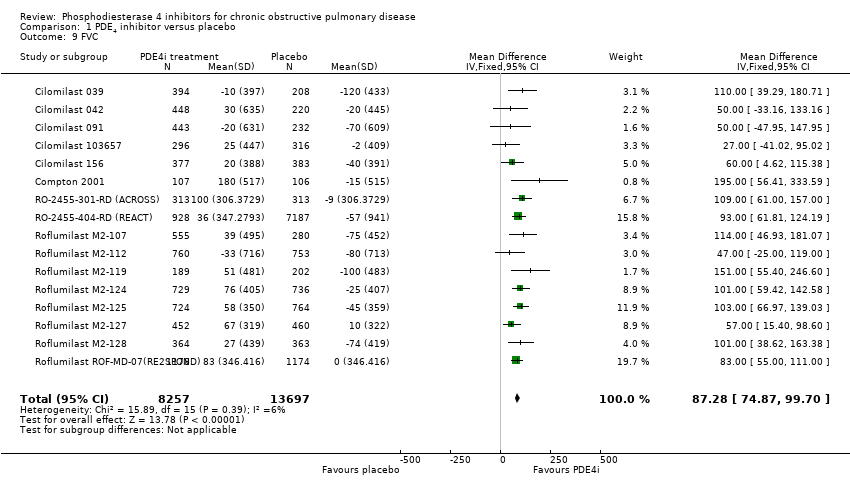
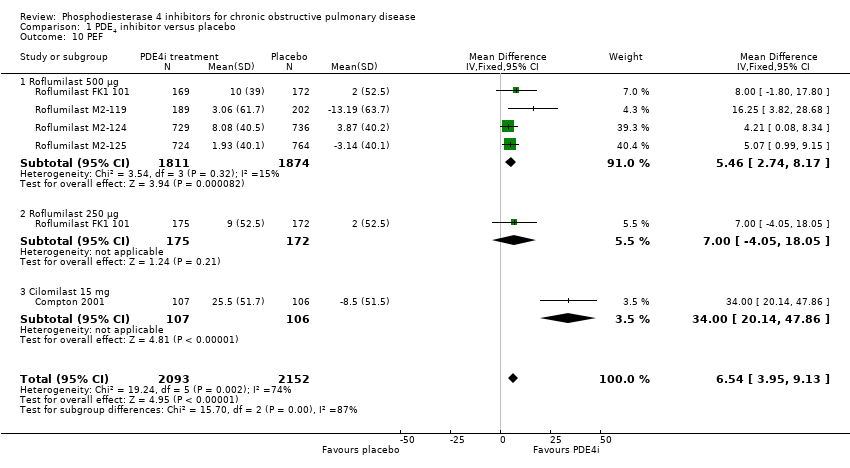
Treatment with a PDE4 inhibitor was associated with a statistically greater change in FVC from baseline than placebo (MD 87.28 mL, 95% CI 74.87 to 99.70) with minimal heterogeneity among the 16 trials (Analysis 1.9). Change in PEF was measured in only five of the 34 trials, but was significantly higher with treatment than in controls (MD 6.54 L/min, 95% CI 3.95 to 9.13) (Analysis 1.10).
Quality of life
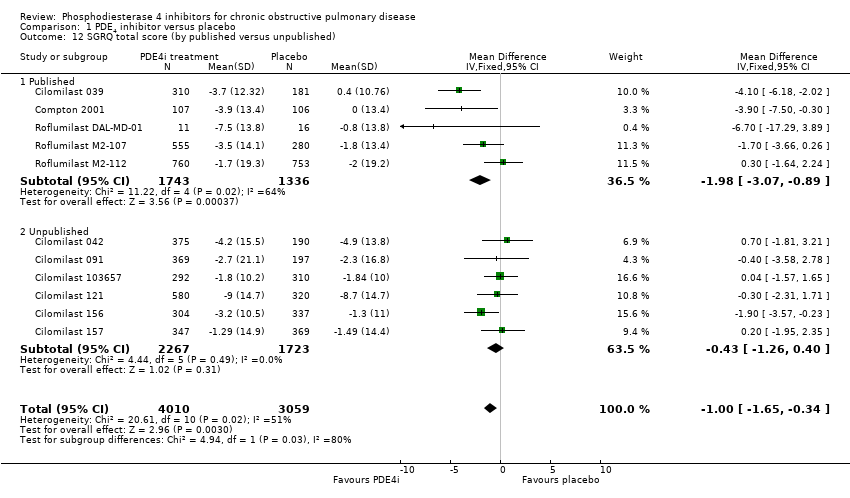
Note that with the SGRQ, a decrease in the total score represents an improvement in the quality of life. We noted a small but statistically significant decrease in total score on the SGRQ from baseline in participants treated with PDE4 inhibitors compared with those in the control groups (MD ‐1.06, 95% CI ‐1.68 to ‐0.43, P = 0.0009) (Analysis 1.11). There was heterogeneity in this observation (Chi² = 21, df = 11, P = 0.03, I² = 47%).
It was notable that in the two trials with a duration of one year that reported total SGRQ, there was no significant change in quality of life seen with treatment compared with control (MD 0.26, 95% CI ‐1.18 to 1.69). We did not include outcome data for Roflumilast M2‐111 as data were provided in the form of a 'repeated measures analysis' and pooled data did not equal the sum of numbers in each of the individual studies.
Exacerbations
Use of PDE4 inhibitors was associated with a statistically significant reduction in the numbers of participants experiencing one or more COPD exacerbations. This is a relative reduction of more than 20% (OR 0.78, 95% CI 0.73 to 0.83) (Analysis 1.16), from a representative risk of 33 per 100 on placebo to 28 per hundred on PDE4 inhibitors over 12 to 52 weeks (Figure 1 and summary of findings Table for the main comparison). There was little heterogeneity among trials (Chi² = 23, df = 22, P = 0.38, I² = 6%). Similar efficacy was seen for both roflumilast and cilomilast and where use of concomitant long‐acting bronchodilators was permitted (Analysis 1.17).
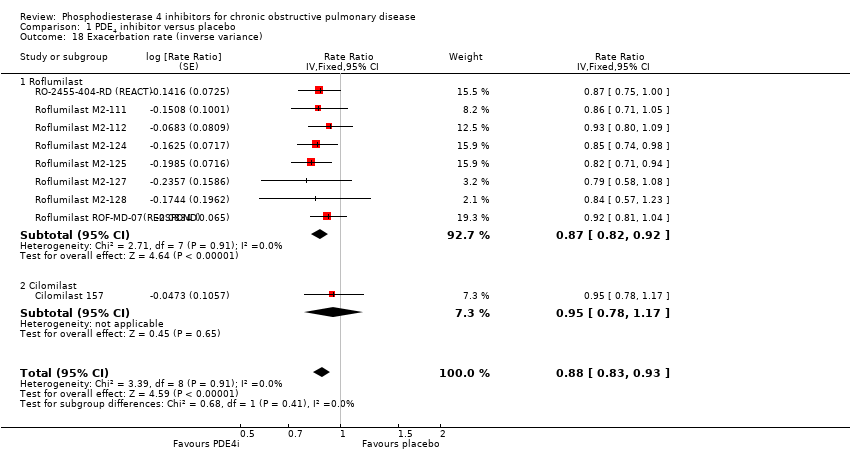
In terms of exacerbation rate and the number of exacerbations experienced on average per participant per year (Analysis 1.18), we observed a small significant benefit with treatment, representing a 12% reduction in the rate ratio (rate ratio 0.88, 95% CI 0.83 to 0.93).
The Roflumilast FK1 101 trial reported that the probability of experiencing an exacerbation was reduced by 8% with 250 μg of roflumilast and 48% with 500 μg, although the absolute value was not reported, nor whether this was statistically significant.
Symptoms and exercise tolerance
Overall, the mean difference in change from baseline with PDE4 inhibitor treatment compared with controls on COPD‐related symptoms was small, regardless of the scale used to measure it. The only statistically significant effect was seen in one trial of cilomilast, for breathlessness scored using a Borg scale (MD ‐0.19, 95% CI ‐0.33 to ‐0.05) (Analysis 1.19). This is a small absolute difference so is of doubtful clinical relevance.
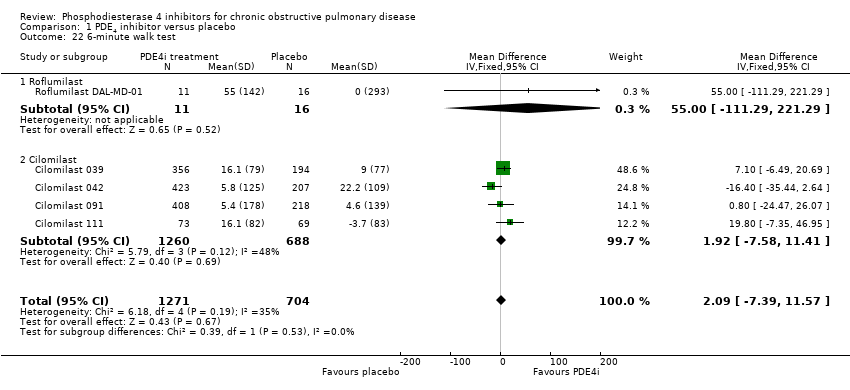
Exercise tolerance using the six‐minute walk test was measured in four cilomilast trials. There was no significant difference in walk test distance between treatment and controls (MD 2.09 m, 95% CI ‐7.39 to 11.57) (Analysis 1.22).
Adverse events
The likelihood of a participant experiencing an adverse event was higher with PDE4 inhibitor treatment than with placebo (OR 1.29, 95% CI 1.22 to 1.37) (Analysis 1.23). This effect was seen for both roflumilast and cilomilast.
We noted a range of adverse effects that occurred more frequently in PDE4 inhibitor‐treated participants. Diarrhoea was more common in PDE4 inhibitor‐treated groups than in controls (OR 3.13, 95% CI 2.76 to 3.54) (Analysis 1.25 and Figure 2), as was nausea (OR 3.78, 95% CI 3.23 to 4.43) (Analysis 1.26), headache (OR 1.69, 95% CI 1.47 to 1.95) (Analysis 1.27), vomiting (OR 4.01, 95% CI 2.80 to 5.74) (Analysis 1.28), dyspepsia (OR 3.17, 95% CI 2.33 to 4.30) (Analysis 1.29) and abdominal pain (OR 2.04, (95% CI 1.63 to 2.55) (Analysis 1.30). More than 10% of participants in the treatment group experienced gastrointestinal‐related side effects, with the most frequently reported symptom being diarrhoea Figure 2 (number needed to treat for an additional harmful outcome (NNTH): 15, 95% CI 13 to 17). Weight loss was more likely in the treatment groups in the 10 roflumilast trials (OR 3.76, 95% CI 3.11 to 4.54) (Analysis 1.31), but was not reported in the cilomilast trials. There were no significant differences in the incidence of either influenza‐like symptoms (Analysis 1.32) or upper respiratory tract infections (Analysis 1.33) between treatment and control groups.
The higher dose of roflumilast (500 μg) was associated with more adverse effects than the 250 μg dose; however, this was based on only four trials and confidence intervals were wide (OR 1.21, 95% CI 1.01 to 1.46) (Analysis 1.24). In the trial of Compton 2001 that studied the effects of varying doses of cilomilast, adverse effects were seen in 52% of the placebo group, 48% of the cilomilast 5 mg group, 47% of the 10 mg group and 61% of the 15 mg group, with rates of serious adverse events similar across the groups.
An increase in withdrawals attributed to adverse effects was recorded for both roflumilast and cilomilast treatment groups (OR 1.90, 95% CI 1.74 to 2.09) (Analysis 1.34). There was, however, no significant effect of treatment on non‐fatal serious adverse events (OR 0.99, 95% CI 0.91 to 1.07) (Analysis 1.35) or mortality (OR 0.97, 95% CI 0.76 to 1.23) (Analysis 1.36), although mortality was a relatively rare event during the trials.
We recorded the number of psychiatric adverse events from pooled data from all parallel‐design, double‐blind studies investigating roflumilast collated and presented to the FDA. This included data from the 15 fully published trials, but excluded Roflumilast JP‐706, which was conducted by a different study collaborator. These results reported symptoms of depression separately from depressed mood, depressive symptoms or major depression. There was a higher risk in the roflumilast 500 μg treatment group, compared with placebo, of experiencing a psychiatric‐related adverse event (OR 2.13, 95% CI 1.79 to 2.54) (Analysis 1.37). This was reported in three people out of 100 in the placebo group, compared to seven (95% CI 6 to 8) out of 100 for the PDE4 inhibitor‐treated group (NNTH 28, 95% CI 21 to 39). Based on outcomes reported in more recent roflumilast trials the numbers of participants experiencing insomnia or sleep disorders (OR 1.48, 95% CI 0.81 to 2.70) (Analysis 1.38), symptoms of anxiety (OR 1.81, 95% CI 1.26 to 2.62) (Analysis 1.39) or depression (OR 1.59, 95% CI 1.11 to 2.27) (Analysis 1.40) were higher in the roflumilast group compared with the placebo. There was no statistically significant difference in the rate of psychiatric adverse events in the roflumilast 250 μg treatment group compared with placebo as in each of the analyses, the 95% confidence intervals crossed the midline.
In the roflumilast COPD safety database (n = 12,054 participants), there were three reports of completed suicides and two suicide attempts in roflumilast‐treated participants compared to none in participants treated with placebo.
Subgroup and sensitivity analyses
A moderate but significant level of heterogeneity existed for the change in FEV1 outcome when all trials were pooled (I² = 48%). Using a random‐effects model made no difference to the levels of statistical significance or degree of heterogeneity for the change in FEV1 (Analysis 1.7). There were too many 'Risk of bias' domains judged to be at 'unclear' risk of bias to do subgroup analysis according to study quality. Of note, some effect sizes were greater in the published trials; for example, the treatment effect on FEV1 was MD 55.75 mL (95% CI 49.44 to 62.06) in the 19 published trials, and MD 34.82 (95% CI 25.44 to 44.19) in the eight unpublished trials (Analysis 1.6), which was a statistically significant difference (test for subgroup differences: Chi² = 13.18, df = 1 (P = 0.0003)). This is illustrated in the funnel plot with more unpublished studies showing a smaller treatment effect (Figure 5).

Funnel plot of comparison: 1 PDE4 inhibitor versus placebo, outcome: 1.6 FEV1 (published versus unpublished).
By visual analysis of the forest plot and sequential elimination, the six‐week Compton 2001 cilomilast trial was identified as a major contributor towards the heterogeneity of pooled FEV1 results. When it was removed, the overall I2 statistic decreased from 48% to 31% and in the cilomilast subgroup from 62% to 0%. It is notable that this study had the shortest treatment duration of six weeks and showed the largest improvement in FEV1 lung function from baseline in the treatment group across all studies.
To see whether the size of the treatment effect varied with COPD severity, we conducted subgroup analyses of trials where the mean per cent predicted FEV1 at baseline was available (Analysis 1.2). The effects seen in both old GOLD grades I or II (FEV1 50% or more) predicted and old GOLD grades III or IV (FEV1 less than 50%) were both statistically significant, and of similar magnitude, test for subgroup differences: Chi² = 0.03, df = 1 (P = 0.86).
Similarly, there was a difference in the effect size of the total SGRQ score between published and unpublished trials (MD ‐1.98, 95% CI ‐3.07 to ‐0.89 versus MD ‐0.43, 95% CI ‐1.26 to 0.40, test for subgroup differences: Chi² = 4.94, df = 1 (P = 0.03)) (Analysis 1.12). Subgroup analysis showed COPD severity had no bearing on the size of the change in quality‐of‐life score test for subgroup differences: Chi² = 0.02, df = 1 (P = 0.89) (Analysis 1.14).
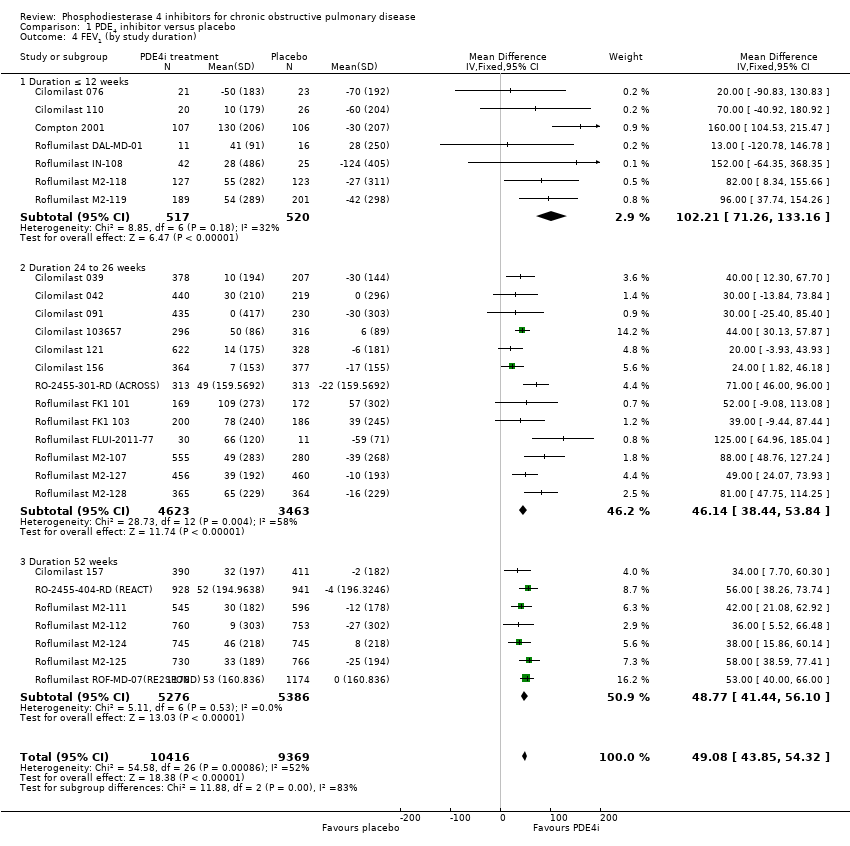
For both primary outcomes, that is, FEV1 and SGRQ score, the size of the treatment effect, that is, the mean difference between PDE4 and placebo groups, was significantly greater in short studies of 6 to 12 weeks, compared with 24‐ and 52‐week studies (Analysis 1.4; Analysis 1.13).
Discussion
Summary of main results
This systematic review evaluated randomised controlled trials (RCTs) that assessed the efficacy and safety of oral phosphodiesterase 4 (PDE4) inhibitors in people with chronic obstructive pulmonary disease (COPD). The first major finding, based on data from 34 trials, was that both roflumilast and cilomilast led to significantly greater improvements in lung function from baseline, as measured by forced expiratory volume in one second (FEV1), forced vital capacity (FVC) or peak expiratory flow rate (PEF), than placebo. Furthermore, the improvement in lung function was seen regardless of the severity of the disease. This improvement in FEV1 lung function occurred whether or not treatment was given in addition to other COPD treatments, such as long‐acting beta‐2 agonists or anticholinergics, compared to treatment alone or with inhaled corticosteroids (ICS).
The mean change in FEV1 was, however, below what is usually considered a minimum clinically important difference (100 mL, Donohue 2005), but comparable to those seen with other COPD treatments in recent large RCTs. For example, the mean improvement in FEV1 of 49 mL with treatment seen in moderate to severe COPD in this review is of similar magnitude to that seen with fluticasone (47 mL), salmeterol (42 mL), and fluticasone and salmeterol combined (92 mL) in the TORCH 2007 study in people with severe COPD.
A second major finding, based on data from 23 trials, was that participants were more likely to be exacerbation‐free while being treated with PDE4 inhibitors compared with controls. Overall, participants were 22% less likely to have an exacerbation, translating to a number needed to treat for an additional beneficial outcome (NNTB) of around 20 (95% CI 16 to 26), for one person to be exacerbation‐free in the study period Figure 1. While the likelihood of an individual experiencing an exacerbation was lowered with PDE4 inhibitor treatment, the decrease in the overall rate of exacerbations was less marked, with a relative reduction of 13%.
Taken together, these two major findings suggest that PDE4 inhibitors in people with COPD are acting independently of other treatments, particularly bronchodilators. This is an encouraging finding that could be consistent with a broad anti‐inflammatory effect (Fabbri 2009). On the other hand, short‐duration studies showed more favourable results than the longer studies, but the reasons for this are unclear. Significant heterogeneity was noted among the trials, suggesting that unmeasured differences between the trials may be having an impact.
A third major finding of the review was that, despite significant improvements in lung function and a reduction in exacerbations in participants treated with PDE4 inhibitors, there was only a small improvement in quality of life as assessed by the St George's Respiratory Questionnaire (SGRQ) total score. Quality of life had been chosen as a primary outcome because of concerns as to whether or not the adverse effects of PDE4 inhibitors might outweigh any beneficial COPD‐related effects. The average change in SGRQ total score was 1.06 units (over a duration of between six and 12 months), and was of similar magnitude among trials of participants with milder or more severe COPD. Although this improvement was statistically significant, a change of greater than four units is usually regarded as the minimum clinically important difference (Jones 2005). While symptom scores were marginally better in the treatment groups, there was no change seen in exercise tolerance, suggesting that improvements in respiratory symptoms may not necessarily translate into enhancement of physical functioning. There were, though, fewer trials assessable for these outcomes, raising the possibility of type 1 or type 2 errors.
This review found that adverse effects were greater in the roflumilast and cilomilast‐treated participants than in those receiving placebo, particularly gastrointestinal‐related effects such as diarrhoea, nausea, vomiting and dyspepsia. More recently, there has been greater awareness of the risk of psychiatric adverse events associated with roflumilast treatment, in particular the increased likelihood of experiencing sleep disturbances, anxiety and depressed mood. Participants in the treatment groups were also more likely to withdraw from the trials because of adverse effects; on average 14% in the treatment groups withdrew compared with 8% in the control groups. Similarly, there is a slight excess in the total number of participants in the treatment groups experiencing any adverse effect, compared with controls (Analysis 1.23). As this analysis included symptoms as well as exacerbations, which were reduced in the treatment groups, this analysis will tend to under‐estimate the excess of non COPD‐related adverse effects occurring with PDE4 inhibitor treatment.
It was notable that treatment with roflumilast was associated with a significant chance of weight loss. Whether this was due to anorexia from gastrointestinal adverse effects, or another effect, is not yet clear. Also not clear is whether cilomilast has the same effect, as it has not been studied. Weight loss may be a beneficial effect in people with COPD who are obese. In contrast, low body mass in the later stages of COPD is associated with a worse prognosis and is notoriously difficult to reverse (GOLD 2017). This adverse effect warrants further investigation. Reassuringly, there was no increase in serious adverse effects or mortality, although trials were of relatively short duration, and analyses were underpowered to report on the latter outcome.
While a lower dose (250 μg) of roflumilast produced similar improvements in FEV1 (Analysis 1.8) and was associated with slightly fewer adverse effects (Analysis 1.24) than the larger dose, this was associated with a smaller reduction in rate of exacerbations than the 500 μg dose, in the one trial that reported this (Roflumilast FK1 101). Moreover, data on the lower dose were only available in a limited number of studies and it has not been studied as add‐on therapy to other bronchodilators.
Overall completeness and applicability of evidence
We have reviewed all known published and unpublished trials identified from standard Cochrane searches, as well as from the trials register for the NIH and from pharmaceutical websites.
We have not been able to verify the pooled endpoint data for psychiatric‐ (treatment possibly harmful) and cardiovascular‐related adverse events (treatment possibly beneficial) as they were obtained from reports on the US Food and Drug Administration (FDA) website and from White 2013, respectively.
To ensure our Cochrane systematic review accurately reflects all known outcomes of roflumilast therapy, for the previous update we approached the manufacturer of roflumilast for study‐level data on each of the cardiovascular outcomes (cardiovascular death, non‐fatal myocardial infarction or non‐fatal stroke) as well as the composite outcome, major adverse cardiovascular events (MACE). This would have allowed us to perform comparisons both within (i.e. between roflumilast and placebo groups) and among the studies. Unfortunately, our request for individual trial data was refused with the following reasons being cited:
-
it is inappropriate from a statistical perspective to look into individual trials with too small a sample size for this kind of relatively rare endpoint;
-
it was part of the retrospective analyses to evaluate the whole data set with a sufficiently broad database and not to go into subcuts per study that would comprise studies with numbers in each treatment arm that were too low for conclusive interpretation;
-
in none of the studies was the blinded adjudication of the events implemented as a prospective analysis, which would have required a data release in terms of transparency in each individual study (which is the reason why it was not mentioned in the original publications of the individual trials).
In response to the statement by representatives of Takeda Pharmaceuticals Limited, we have urged that these issues be reconsidered for future studies and that study data be made more widely available. Finally, caution must be used when interpreting associations between COPD exacerbations and MACE, because although the treatment groups were matched at baseline, it cannot be assumed that these groups are equivalent when looking only at the group of participants who experienced exacerbations. These concerns could not be assessed in this review as further study data were not provided.
Quality of the evidence
For the key outcomes of changes in lung function and quality of life, there were greater beneficial effects of PDE4 inhibitors reported in the published studies than in the unpublished studies, raising concerns about publication bias. There was a moderate level of heterogeneity identified in both of the primary outcomes for this review, which is not fully explained by subgroup or sensitivity analyses according to study duration or concomitant medication use. This suggests unknown factors that may impact on the effect size, and has led us to downgrade the quality of the evidence and certainty of our findings (summary of findings Table for the main comparison). In contrast, the blinded design of the studies comparing roflumilast or cilomilast with placebo protected against detection bias in our view. The quality of evidence for a reduction in exacerbation was therefore higher for this comparison. On balance, we believe the true beneficial effect of PDE4 inhibitors is likely to be no greater than we have reported, and probably less; equally the harms may have been understated (partly due to higher withdrawal rates in active treatment arms). On the other hand, as subgroup analyses for COPD severity are based on the mean predicted lung function for the study group and not individual participants, we cannot rule out that there is a benefit for individuals of a specific COPD phenotype.
Potential biases in the review process
Potential biases in the review process were minimised by double‐checking of data extraction and input. The authors have no conflicts of interest to declare and have not been involved in prescribing these medicines as neither roflumilast nor cilomilast are available on the New Zealand pharmaceutical schedule.
Agreements and disagreements with other studies or reviews
There have been several other meta analyses conducted, such as Oba 2013; Yan 2014 and Luo 2016. Each of these had fewer studies than the present review, but had findings and conclusions that were similar.
In a post hoc pooled analysis (n =5595) of four trials in this review (Rennard 2014), roflumilast significantly improved transition dyspnoea index (TDI) focal scores of breathlessness versus placebo at week 52 (treatment difference, 0.327; P < 0.0001). Roflumilast was associated with significantly greater TDI responders and significantly fewer TDI deteriorators (≥ 1‐unit increase or decrease from baseline, respectively) versus placebo at week 52 (P < 0.01, both). Rates of MACE in COPD participants treated with PDE4 inhibitors have been meta‐analysed and reported in a paper published by White 2013. This found that the risk of cardiovascular death, non‐fatal myocardial infarction or non‐fatal stroke, when combined into a composite outcome (MACE), was reduced in the roflumilast group compared with placebo (hazard ratio 0.65, 95% CI 0.45 to 0.93; P = 0.019). On the other hand, hazard ratios for treatment effects for each of these types of event individually were statistically different. Cardiovascular events were higher in participants with baseline cardiovascular risk factors than in those without baseline cardiovascular risk (defined as the presence of hypertension, diabetes mellitus, hyperlipidaemia and/or a history of heart disease). In addition, it was found that the difference between treatment and placebo was only statistically significant in the group of participants without baseline risk factors. Event rates in a subgroup of trials that were one year in duration found no significant difference between treatment and placebo groups in the proportion of participants who reported a MACE, even when divided into those who did, or did not experience a COPD exacerbation. Similarly, between participants with and without MACE events, the proportions of participants experiencing exacerbations was similar (43.2% and 42.1%, respectively).

In the control group 33 people out of 100 had an exacerbation of COPD over 6‐52 weeks, compared to 28 (95% CI 27 to 29) out of 100 for the active treatment group.
In the control group 4 people out of 100 had diarrhoea over 6‐52 weeks, compared to 11 (95% CI 10 to 12) out of 100 for the active treatment group.
Study flow diagram

Methodological quality summary: review authors' judgements about each methodological quality item for each included study.
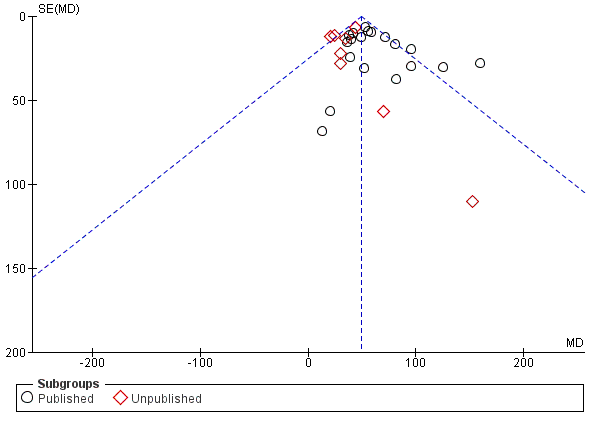
Funnel plot of comparison: 1 PDE4 inhibitor versus placebo, outcome: 1.6 FEV1 (published versus unpublished).

Comparison 1 PDE4 inhibitor versus placebo, Outcome 1 FEV1 (by drug).

Comparison 1 PDE4 inhibitor versus placebo, Outcome 2 FEV1 (by mean COPD severity).

Comparison 1 PDE4 inhibitor versus placebo, Outcome 3 FEV1 (Roflumilast 500 μg by mean COPD severity).
Comparison 1 PDE4 inhibitor versus placebo, Outcome 4 FEV1 (by study duration).

Comparison 1 PDE4 inhibitor versus placebo, Outcome 5 FEV1 (additional medication).

Comparison 1 PDE4 inhibitor versus placebo, Outcome 6 FEV1 (published versus unpublished).
Comparison 1 PDE4 inhibitor versus placebo, Outcome 7 FEV1 (random‐effects model).
Comparison 1 PDE4 inhibitor versus placebo, Outcome 8 FEV1 (roflumilast 500 μg versus 250 μg).
Comparison 1 PDE4 inhibitor versus placebo, Outcome 9 FVC.
Comparison 1 PDE4 inhibitor versus placebo, Outcome 10 PEF.

Comparison 1 PDE4 inhibitor versus placebo, Outcome 11 SGRQ total score.
Comparison 1 PDE4 inhibitor versus placebo, Outcome 12 SGRQ total score (by published versus unpublished).

Comparison 1 PDE4 inhibitor versus placebo, Outcome 13 SGRQ total score (by duration).

Comparison 1 PDE4 inhibitor versus placebo, Outcome 14 SGRQ total score (by mean COPD severity).
Comparison 1 PDE4 inhibitor versus placebo, Outcome 15 SGRQ symptom score.

Comparison 1 PDE4 inhibitor versus placebo, Outcome 16 Number of participants with one or more exacerbations (by drug).

Comparison 1 PDE4 inhibitor versus placebo, Outcome 17 Number of participants on roflumilast with one or more exacerbations (additional medication).
Comparison 1 PDE4 inhibitor versus placebo, Outcome 18 Exacerbation rate (inverse variance).

Comparison 1 PDE4 inhibitor versus placebo, Outcome 19 Borg Scale.

Comparison 1 PDE4 inhibitor versus placebo, Outcome 20 Summary symptom score.

Comparison 1 PDE4 inhibitor versus placebo, Outcome 21 Shortness of breath questionnaire.
Comparison 1 PDE4 inhibitor versus placebo, Outcome 22 6‐minute walk test.

Comparison 1 PDE4 inhibitor versus placebo, Outcome 23 Number of participants experiencing an adverse effect.
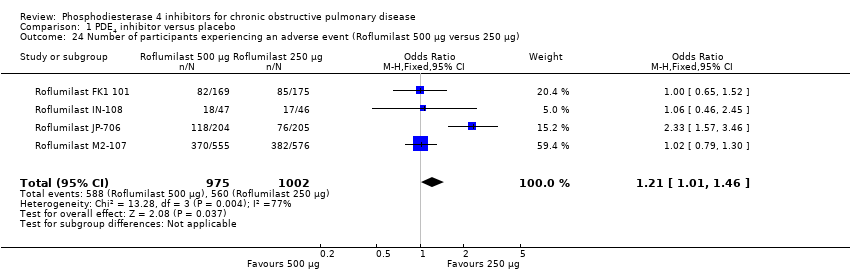
Comparison 1 PDE4 inhibitor versus placebo, Outcome 24 Number of participants experiencing an adverse event (Roflumilast 500 μg versus 250 μg).
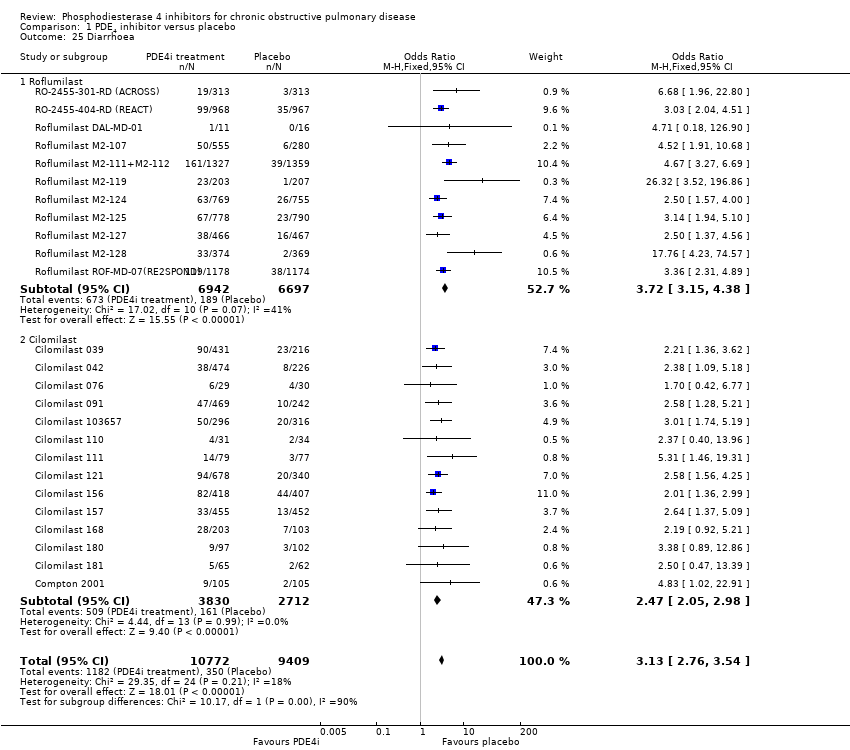
Comparison 1 PDE4 inhibitor versus placebo, Outcome 25 Diarrhoea.

Comparison 1 PDE4 inhibitor versus placebo, Outcome 26 Nausea.
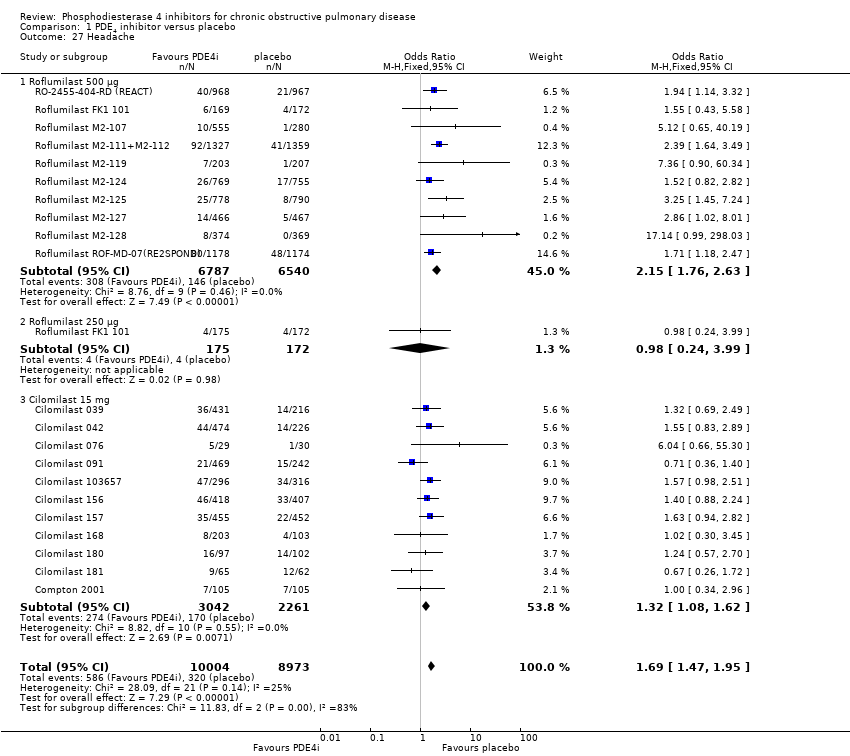
Comparison 1 PDE4 inhibitor versus placebo, Outcome 27 Headache.

Comparison 1 PDE4 inhibitor versus placebo, Outcome 28 Vomiting.
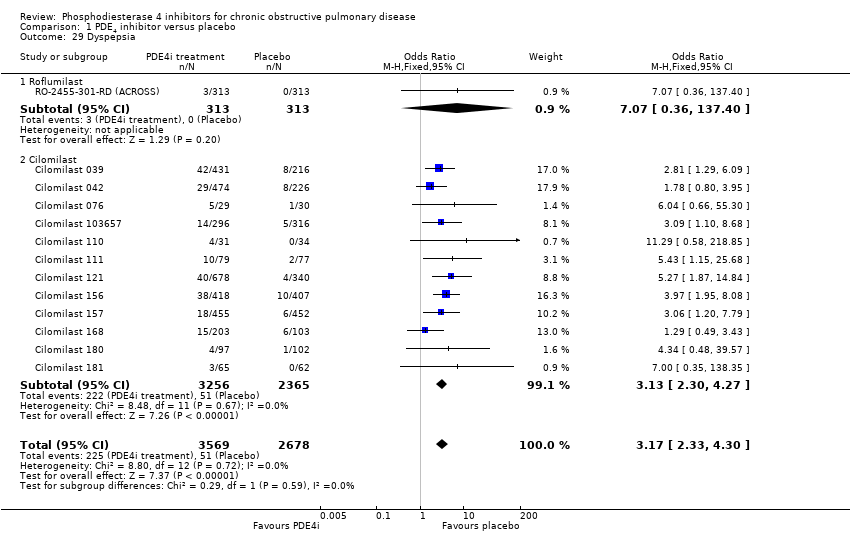
Comparison 1 PDE4 inhibitor versus placebo, Outcome 29 Dyspepsia.
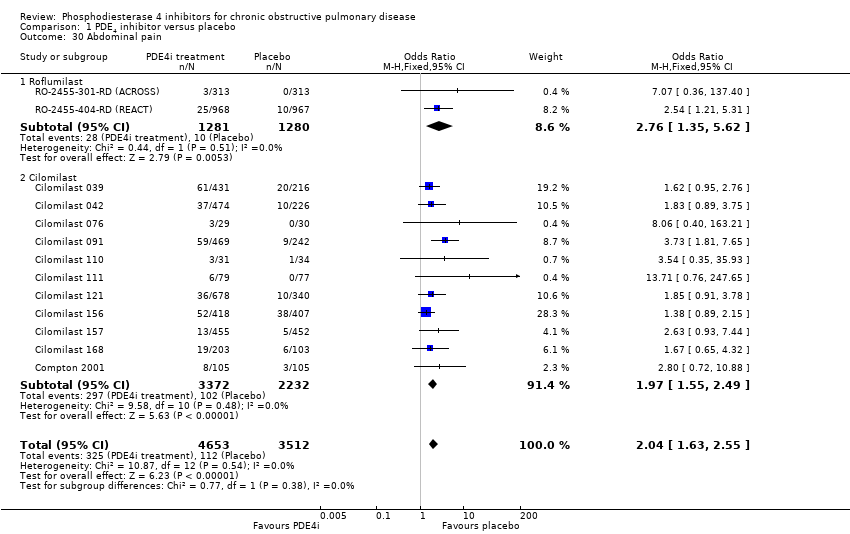
Comparison 1 PDE4 inhibitor versus placebo, Outcome 30 Abdominal pain.

Comparison 1 PDE4 inhibitor versus placebo, Outcome 31 Weight loss.

Comparison 1 PDE4 inhibitor versus placebo, Outcome 32 Influenza‐like symptoms.

Comparison 1 PDE4 inhibitor versus placebo, Outcome 33 Upper respiratory tract infection.
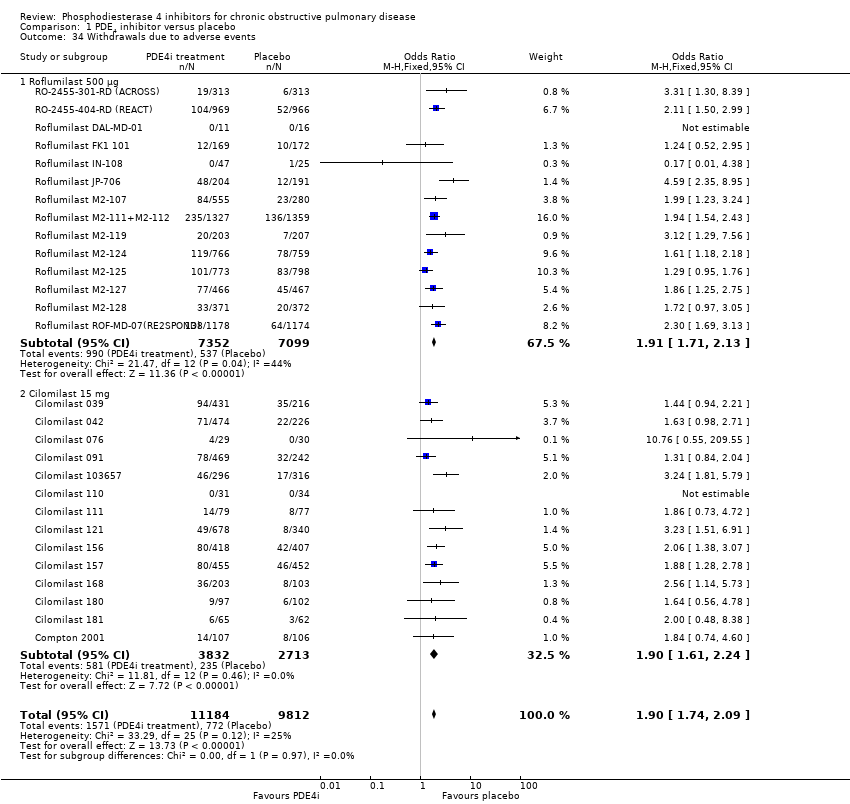
Comparison 1 PDE4 inhibitor versus placebo, Outcome 34 Withdrawals due to adverse events.

Comparison 1 PDE4 inhibitor versus placebo, Outcome 35 Non‐fatal serious adverse events.

Comparison 1 PDE4 inhibitor versus placebo, Outcome 36 Mortality.

Comparison 1 PDE4 inhibitor versus placebo, Outcome 37 All psychiatric disorders (roflumilast).
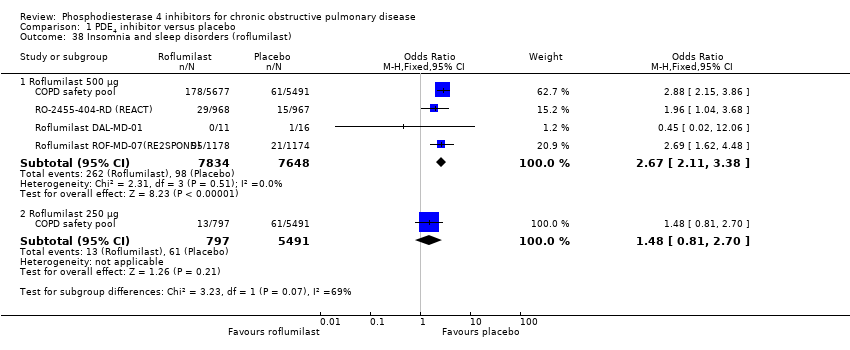
Comparison 1 PDE4 inhibitor versus placebo, Outcome 38 Insomnia and sleep disorders (roflumilast).

Comparison 1 PDE4 inhibitor versus placebo, Outcome 39 Anxiety or anxiety disorder (roflumilast).

Comparison 1 PDE4 inhibitor versus placebo, Outcome 40 Depression (roflumilast).
| Phosphodiesterase 4 inhibitors compared to placebo for chronic obstructive pulmonary disease | ||||||
| Patient or population: people with stable chronic obstructive pulmonary disease | ||||||
| Outcomes | Illustrative comparative risks* (95% CI) | Relative effect | No of participants | Quality of the evidence | Comments | |
| Assumed risk | Corresponding risk | |||||
| Placebo | Phosphodiesterase IV inhibitors | |||||
| Change in FEV1 lung function | The mean change in FEV1 lung function in the control groups was | The mean change in FEV1 lung function in the intervention groups was | 20,585 | ⊕⊕⊕⊝ | ||
| Change in quality of life | The mean change in quality of life in the control groups was an improvement of | The mean change in quality of life in the intervention groups was | 7645 | ⊕⊕⊕⊝ | Lower scores on SGRQ represent improved quality of life. This result does not reach the minimum clinically important difference for this scale. | |
| COPD exacerbations | 33 per 100 | 28 per 100 | OR 0.78 | 19,948 | ⊕⊕⊕⊕ | See Figure 1 |
| Adverse events | 64 per 100 | 69 per 100 | OR 1.29 | 20,988 | ⊕⊕⊕⊝ | This outcome includes participants who reported COPD exacerbations as an adverse event |
| Gastrointestinal side effects | 4 per 100 | 11 per 100 | OR 3.13 | 20,181 | ⊕⊕⊕⊕ | Diarrhoea was the most commonly reported gastrointestinal side effect. See Figure 2 Weight loss was more common, and may be a result of diarrhoea |
| Psychiatric adverse events (roflumilast 500 µg) | 35 per 1000 | 71 per 1000 | OR 2.13 | 11,168 | ⊕⊕⊕⊝ | Pooled data from FDA website, not individual trial reports |
| Mortality (all‐cause) | 1 per 100 | 1 per 100 | OR 0.97 | 19,344 | ⊕⊕⊕⊝ | |
| *The basis for the assumed risk (e.g. the median control group risk across studies) is provided in footnotes. The corresponding risk (and its 95% confidence interval) is based on the assumed risk in the comparison group and the relative effect of the intervention (and its 95% CI). | ||||||
| GRADE Working Group grades of evidence | ||||||
| 1There was a greater proportion of participant withdrawals in the treatment (24%) compared with the control group (19%), but not sufficient to warrant downgrading the quality of evidence. 6There were very few events, leading to wide confidence intervals. | ||||||
| Search date: | No. of references for which we sought full text |
| December 2008 | 53 |
| January 2010 | 5 |
| August 2010 | 12 |
| June 2013 | 20 |
| October 2016 | 28 |
| Outcome or subgroup title | No. of studies | No. of participants | Statistical method | Effect size |
| 1 FEV1 (by drug) Show forest plot | 27 | 20585 | Mean Difference (IV, Random, 95% CI) | 51.53 [43.17, 59.90] |
| 1.1 Roflumilast 500 μg | 17 | 14230 | Mean Difference (IV, Random, 95% CI) | 56.45 [48.01, 64.89] |
| 1.2 Roflumilast 250 μg | 3 | 1033 | Mean Difference (IV, Random, 95% CI) | 56.88 [24.38, 89.38] |
| 1.3 Cilomilast 15 mg | 10 | 5322 | Mean Difference (IV, Random, 95% CI) | 41.03 [23.93, 58.13] |
| 2 FEV1 (by mean COPD severity) Show forest plot | 21 | 16659 | Mean Difference (IV, Fixed, 95% CI) | 52.77 [46.73, 58.82] |
| 2.1 GOLD grade I + II (FEV1 ≥ 50% predicted) | 9 | 4647 | Mean Difference (IV, Fixed, 95% CI) | 51.79 [38.99, 64.59] |
| 2.2 GOLD grade III + IV (FEV1 < 50% predicted) | 12 | 12012 | Mean Difference (IV, Fixed, 95% CI) | 53.06 [46.19, 59.92] |
| 3 FEV1 (Roflumilast 500 μg by mean COPD severity) Show forest plot | 15 | 13742 | Mean Difference (IV, Fixed, 95% CI) | 55.51 [48.88, 62.14] |
| 3.1 GOLD grade I + II (FEV1 ≥ 50% predicted) | 6 | 3187 | Mean Difference (IV, Fixed, 95% CI) | 69.86 [53.34, 86.38] |
| 3.2 GOLD grade III + IV (FEV1 < 50% predicted) | 9 | 10555 | Mean Difference (IV, Fixed, 95% CI) | 52.75 [45.52, 59.99] |
| 4 FEV1 (by study duration) Show forest plot | 27 | 19785 | Mean Difference (IV, Fixed, 95% CI) | 49.08 [43.85, 54.32] |
| 4.1 Duration ≤ 12 weeks | 7 | 1037 | Mean Difference (IV, Fixed, 95% CI) | 102.21 [71.26, 133.16] |
| 4.2 Duration 24 to 26 weeks | 13 | 8086 | Mean Difference (IV, Fixed, 95% CI) | 46.14 [38.44, 53.84] |
| 4.3 Duration 52 weeks | 7 | 10662 | Mean Difference (IV, Fixed, 95% CI) | 48.77 [41.44, 56.10] |
| 5 FEV1 (additional medication) Show forest plot | 27 | 19565 | Mean Difference (IV, Fixed, 95% CI) | 49.08 [43.84, 54.31] |
| 5.1 Long‐acting bronchodilator | 2 | 1645 | Mean Difference (IV, Fixed, 95% CI) | 60.52 [40.57, 80.46] |
| 5.2 Corticosteroids | 3 | 2904 | Mean Difference (IV, Fixed, 95% CI) | 42.26 [25.46, 59.05] |
| 5.3 PDE4i treatment only | 19 | 10169 | Mean Difference (IV, Fixed, 95% CI) | 44.78 [37.67, 51.90] |
| 5.4 Various concomitant treatments | 3 | 4847 | Mean Difference (IV, Fixed, 95% CI) | 56.58 [46.91, 66.25] |
| 6 FEV1 (published versus unpublished) Show forest plot | 27 | 19785 | Mean Difference (IV, Fixed, 95% CI) | 49.23 [43.99, 54.46] |
| 6.1 Published | 19 | 15244 | Mean Difference (IV, Fixed, 95% CI) | 55.75 [49.44, 62.06] |
| 6.2 Unpublished | 8 | 4541 | Mean Difference (IV, Fixed, 95% CI) | 34.82 [25.44, 44.19] |
| 7 FEV1 (random‐effects model) Show forest plot | 27 | 19785 | Mean Difference (IV, Random, 95% CI) | 51.47 [42.68, 60.26] |
| 8 FEV1 (roflumilast 500 μg versus 250 μg) Show forest plot | 3 | 1560 | Mean Difference (IV, Fixed, 95% CI) | 22.61 [‐5.95, 51.16] |
| 9 FVC Show forest plot | 16 | 21954 | Mean Difference (IV, Fixed, 95% CI) | 87.28 [74.87, 99.70] |
| 10 PEF Show forest plot | 5 | 4245 | Mean Difference (IV, Fixed, 95% CI) | 6.54 [3.95, 9.13] |
| 10.1 Roflumilast 500 μg | 4 | 3685 | Mean Difference (IV, Fixed, 95% CI) | 5.46 [2.74, 8.17] |
| 10.2 Roflumilast 250 μg | 1 | 347 | Mean Difference (IV, Fixed, 95% CI) | 7.0 [‐4.05, 18.05] |
| 10.3 Cilomilast 15 mg | 1 | 213 | Mean Difference (IV, Fixed, 95% CI) | 34.0 [20.14, 47.86] |
| 11 SGRQ total score Show forest plot | 11 | 7645 | Mean Difference (IV, Fixed, 95% CI) | ‐1.06 [‐1.68, ‐0.43] |
| 11.1 Roflumilast 500 μg | 3 | 2235 | Mean Difference (IV, Fixed, 95% CI) | ‐0.79 [‐2.16, 0.58] |
| 11.2 Roflumilast 250 μg | 1 | 716 | Mean Difference (IV, Fixed, 95% CI) | ‐1.60 [‐3.56, 0.36] |
| 11.3 Cilomilast 15 mg | 8 | 4694 | Mean Difference (IV, Fixed, 95% CI) | ‐1.06 [‐1.81, ‐0.31] |
| 12 SGRQ total score (by published versus unpublished) Show forest plot | 11 | 7069 | Mean Difference (IV, Fixed, 95% CI) | 1.00 [‐1.65, ‐0.34] |
| 12.1 Published | 5 | 3079 | Mean Difference (IV, Fixed, 95% CI) | ‐1.98 [‐3.07, ‐0.89] |
| 12.2 Unpublished | 6 | 3990 | Mean Difference (IV, Fixed, 95% CI) | ‐0.43 [‐1.26, 0.40] |
| 13 SGRQ total score (by duration) Show forest plot | 11 | 7069 | Mean Difference (IV, Fixed, 95% CI) | ‐0.99 [‐1.65, ‐0.33] |
| 13.1 Duration < 12 weeks | 2 | 240 | Mean Difference (IV, Fixed, 95% CI) | ‐4.19 [‐7.60, ‐0.78] |
| 13.2 Duration 24 to 26 weeks | 7 | 4600 | Mean Difference (IV, Fixed, 95% CI) | ‐1.18 [‐1.94, ‐0.42] |
| 13.3 Duration 52 weeks | 2 | 2229 | Mean Difference (IV, Fixed, 95% CI) | 0.26 [‐1.18, 1.69] |
| 14 SGRQ total score (by mean COPD severity) Show forest plot | 8 | 4851 | Mean Difference (IV, Fixed, 95% CI) | ‐1.56 [‐2.39, ‐0.74] |
| 14.1 GOLD grade I and II | 3 | 2042 | Mean Difference (IV, Fixed, 95% CI) | ‐1.62 [‐2.80, ‐0.44] |
| 14.2 GOLD grade III and IV | 5 | 2809 | Mean Difference (IV, Fixed, 95% CI) | ‐1.51 [‐2.67, ‐0.34] |
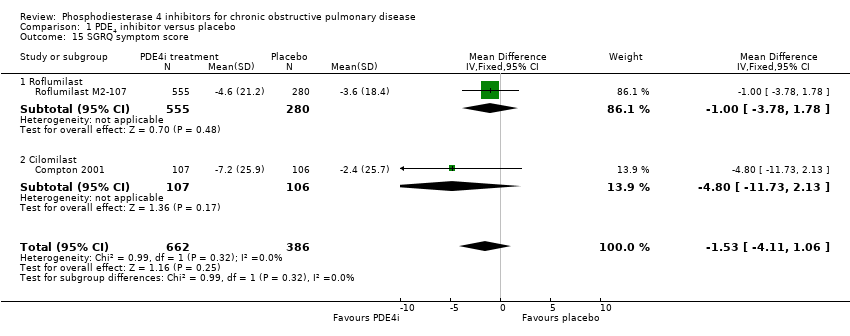
| 15 SGRQ symptom score Show forest plot | 2 | 1048 | Mean Difference (IV, Fixed, 95% CI) | ‐1.53 [‐4.11, 1.06] |
| 15.1 Roflumilast | 1 | 835 | Mean Difference (IV, Fixed, 95% CI) | 1.00 [‐3.78, 1.78] |
| 15.2 Cilomilast | 1 | 213 | Mean Difference (IV, Fixed, 95% CI) | ‐4.80 [‐11.73, 2.13] |
| 16 Number of participants with one or more exacerbations (by drug) Show forest plot | 23 | 19948 | Odds Ratio (M‐H, Fixed, 95% CI) | 0.78 [0.73, 0.83] |
| 16.1 Roflumilast 500 μg | 13 | 14420 | Odds Ratio (M‐H, Fixed, 95% CI) | 0.79 [0.73, 0.86] |
| 16.2 Cilomilast | 10 | 5528 | Odds Ratio (M‐H, Fixed, 95% CI) | 0.76 [0.67, 0.85] |
| 17 Number of participants on roflumilast with one or more exacerbations (additional medication) Show forest plot | 13 | 14420 | Odds Ratio (M‐H, Fixed, 95% CI) | 0.79 [0.73, 0.86] |
| 17.1 Long‐acting bronchodilators | 2 | 1676 | Odds Ratio (M‐H, Fixed, 95% CI) | 0.69 [0.54, 0.88] |
| 17.2 Corticosteroids | 1 | 2686 | Odds Ratio (M‐H, Fixed, 95% CI) | 0.81 [0.70, 0.95] |
| 17.3 Treatment only | 7 | 5145 | Odds Ratio (M‐H, Fixed, 95% CI) | 0.79 [0.67, 0.93] |
| 17.4 Various concomitant treatments | 3 | 4913 | Odds Ratio (M‐H, Fixed, 95% CI) | 0.81 [0.72, 0.91] |
| 18 Exacerbation rate (inverse variance) Show forest plot | 9 | Rate Ratio (Fixed, 95% CI) | 0.88 [0.83, 0.93] | |
| 18.1 Roflumilast | 8 | Rate Ratio (Fixed, 95% CI) | 0.87 [0.82, 0.92] | |
| 18.2 Cilomilast | 1 | Rate Ratio (Fixed, 95% CI) | 0.95 [0.78, 1.17] | |
| 19 Borg Scale Show forest plot | 6 | 2860 | Mean Difference (IV, Fixed, 95% CI) | ‐0.19 [‐0.33, ‐0.05] |
| 19.1 Cilomilast | 6 | 2860 | Mean Difference (IV, Fixed, 95% CI) | ‐0.19 [‐0.33, ‐0.05] |
| 20 Summary symptom score Show forest plot | 5 | 6186 | Std. Mean Difference (IV, Fixed, 95% CI) | ‐0.02 [‐0.07, 0.03] |
| 20.1 Roflumilast | 2 | 4287 | Std. Mean Difference (IV, Fixed, 95% CI) | ‐0.02 [‐0.08, 0.04] |
| 20.2 Cilomilast | 3 | 1899 | Std. Mean Difference (IV, Fixed, 95% CI) | ‐0.04 [‐0.13, 0.06] |
| 21 Shortness of breath questionnaire Show forest plot | 2 | 1633 | Mean Difference (IV, Fixed, 95% CI) | ‐1.09 [‐2.47, 0.28] |
| 22 6‐minute walk test Show forest plot | 5 | 1975 | Mean Difference (IV, Fixed, 95% CI) | 2.09 [‐7.39, 11.57] |
| 22.1 Roflumilast | 1 | 27 | Mean Difference (IV, Fixed, 95% CI) | 55.0 [‐111.29, 221.29] |
| 22.2 Cilomilast | 4 | 1948 | Mean Difference (IV, Fixed, 95% CI) | 1.92 [‐7.58, 11.41] |
| 23 Number of participants experiencing an adverse effect Show forest plot | 27 | 20988 | Odds Ratio (M‐H, Fixed, 95% CI) | 1.29 [1.22, 1.37] |
| 23.1 Roflumilast 500 μg | 13 | 14446 | Odds Ratio (M‐H, Fixed, 95% CI) | 1.33 [1.24, 1.42] |
| 23.2 Cilomilast 15 mg | 14 | 6542 | Odds Ratio (M‐H, Fixed, 95% CI) | 1.21 [1.08, 1.36] |
| 24 Number of participants experiencing an adverse event (Roflumilast 500 μg versus 250 μg) Show forest plot | 4 | 1977 | Odds Ratio (M‐H, Fixed, 95% CI) | 1.21 [1.01, 1.46] |
| 25 Diarrhoea Show forest plot | 25 | 20181 | Odds Ratio (M‐H, Fixed, 95% CI) | 3.13 [2.76, 3.54] |
| 25.1 Roflumilast | 11 | 13639 | Odds Ratio (M‐H, Fixed, 95% CI) | 3.72 [3.15, 4.38] |
| 25.2 Cilomilast | 14 | 6542 | Odds Ratio (M‐H, Fixed, 95% CI) | 2.47 [2.05, 2.98] |
| 26 Nausea Show forest plot | 24 | 20627 | Odds Ratio (M‐H, Fixed, 95% CI) | 3.78 [3.23, 4.43] |
| 26.1 Roflumilast 500 μg | 10 | 13229 | Odds Ratio (M‐H, Fixed, 95% CI) | 3.21 [2.57, 4.03] |
| 26.2 Roflumilast 250 μg | 1 | 856 | Odds Ratio (M‐H, Fixed, 95% CI) | 3.97 [0.91, 17.39] |
| 26.3 Cilomilast 15 mg | 14 | 6542 | Odds Ratio (M‐H, Fixed, 95% CI) | 4.37 [3.49, 5.47] |
| 27 Headache Show forest plot | 21 | 18977 | Odds Ratio (M‐H, Fixed, 95% CI) | 1.69 [1.47, 1.95] |
| 27.1 Roflumilast 500 μg | 10 | 13327 | Odds Ratio (M‐H, Fixed, 95% CI) | 2.15 [1.76, 2.63] |
| 27.2 Roflumilast 250 μg | 1 | 347 | Odds Ratio (M‐H, Fixed, 95% CI) | 0.98 [0.24, 3.99] |
| 27.3 Cilomilast 15 mg | 11 | 5303 | Odds Ratio (M‐H, Fixed, 95% CI) | 1.32 [1.08, 1.62] |
| 28 Vomiting Show forest plot | 11 | 5828 | Odds Ratio (M‐H, Fixed, 95% CI) | 4.01 [2.80, 5.74] |
| 28.1 Roflumilast | 1 | 835 | Odds Ratio (M‐H, Fixed, 95% CI) | 1.52 [0.06, 37.37] |
| 28.2 Cilomilast | 10 | 4993 | Odds Ratio (M‐H, Fixed, 95% CI) | 4.06 [2.83, 5.82] |
| 29 Dyspepsia Show forest plot | 13 | 6247 | Odds Ratio (M‐H, Fixed, 95% CI) | 3.17 [2.33, 4.30] |
| 29.1 Roflumilast | 1 | 626 | Odds Ratio (M‐H, Fixed, 95% CI) | 7.07 [0.36, 137.40] |
| 29.2 Cilomilast | 12 | 5621 | Odds Ratio (M‐H, Fixed, 95% CI) | 3.13 [2.30, 4.27] |
| 30 Abdominal pain Show forest plot | 13 | 8165 | Odds Ratio (M‐H, Fixed, 95% CI) | 2.04 [1.63, 2.55] |
| 30.1 Roflumilast | 2 | 2561 | Odds Ratio (M‐H, Fixed, 95% CI) | 2.76 [1.35, 5.62] |
| 30.2 Cilomilast | 11 | 5604 | Odds Ratio (M‐H, Fixed, 95% CI) | 1.97 [1.55, 2.49] |
| 31 Weight loss Show forest plot | 9 | 12178 | Odds Ratio (M‐H, Fixed, 95% CI) | 3.76 [3.11, 4.54] |
| 31.1 Roflumilast | 9 | 12178 | Odds Ratio (M‐H, Fixed, 95% CI) | 3.76 [3.11, 4.54] |
| 32 Influenza‐like symptoms Show forest plot | 9 | 11460 | Odds Ratio (M‐H, Fixed, 95% CI) | 1.09 [0.87, 1.36] |
| 32.1 Roflumilast 500 μg | 7 | 10147 | Odds Ratio (M‐H, Fixed, 95% CI) | 1.11 [0.87, 1.41] |
| 32.2 Roflumilast 250 μg | 1 | 347 | Odds Ratio (M‐H, Fixed, 95% CI) | 1.98 [0.18, 22.00] |
| 32.3 Cilomilast 15 mg | 2 | 966 | Odds Ratio (M‐H, Fixed, 95% CI) | 0.88 [0.44, 1.75] |
| 33 Upper respiratory tract infection Show forest plot | 20 | 16902 | Odds Ratio (M‐H, Fixed, 95% CI) | 0.90 [0.79, 1.02] |
| 33.1 Roflumilast 500 μg | 10 | 11419 | Odds Ratio (M‐H, Fixed, 95% CI) | 0.90 [0.75, 1.07] |
| 33.2 Roflumilast 250 μg | 2 | 1203 | Odds Ratio (M‐H, Fixed, 95% CI) | 0.84 [0.54, 1.31] |
| 33.3 Cilomilast 15 mg | 10 | 4280 | Odds Ratio (M‐H, Fixed, 95% CI) | 0.92 [0.75, 1.13] |
| 34 Withdrawals due to adverse events Show forest plot | 28 | 20996 | Odds Ratio (M‐H, Fixed, 95% CI) | 1.90 [1.74, 2.09] |
| 34.1 Roflumilast 500 μg | 14 | 14451 | Odds Ratio (M‐H, Fixed, 95% CI) | 1.91 [1.71, 2.13] |
| 34.2 Cilomilast 15 mg | 14 | 6545 | Odds Ratio (M‐H, Fixed, 95% CI) | 1.90 [1.61, 2.24] |
| 35 Non‐fatal serious adverse events Show forest plot | 24 | 18689 | Odds Ratio (M‐H, Fixed, 95% CI) | 0.99 [0.91, 1.07] |
| 35.1 Roflumilast 500 μg | 10 | 12144 | Odds Ratio (M‐H, Fixed, 95% CI) | 1.01 [0.93, 1.11] |
| 35.2 Cilomilast 15 mg | 14 | 6545 | Odds Ratio (M‐H, Fixed, 95% CI) | 0.87 [0.72, 1.06] |
| 36 Mortality Show forest plot | 23 | 19344 | Odds Ratio (M‐H, Fixed, 95% CI) | 0.97 [0.76, 1.23] |
| 36.1 Roflumilast | 10 | 13012 | Odds Ratio (M‐H, Fixed, 95% CI) | 1.01 [0.78, 1.29] |
| 36.2 Cilomilast | 13 | 6332 | Odds Ratio (M‐H, Fixed, 95% CI) | 0.70 [0.34, 1.45] |
| 37 All psychiatric disorders (roflumilast) Show forest plot | 1 | Odds Ratio (M‐H, Fixed, 95% CI) | Subtotals only | |
| 37.1 Roflumilast 500 μg | 1 | 11168 | Odds Ratio (M‐H, Fixed, 95% CI) | 2.13 [1.79, 2.54] |
| 37.2 Roflumilast 250 μg | 1 | 6288 | Odds Ratio (M‐H, Fixed, 95% CI) | 0.87 [0.56, 1.33] |
| 38 Insomnia and sleep disorders (roflumilast) Show forest plot | 4 | Odds Ratio (M‐H, Fixed, 95% CI) | Subtotals only | |
| 38.1 Roflumilast 500 μg | 4 | 15482 | Odds Ratio (M‐H, Fixed, 95% CI) | 2.67 [2.11, 3.38] |
| 38.2 Roflumilast 250 μg | 1 | 6288 | Odds Ratio (M‐H, Fixed, 95% CI) | 1.48 [0.81, 2.70] |
| 39 Anxiety or anxiety disorder (roflumilast) Show forest plot | 1 | Odds Ratio (M‐H, Fixed, 95% CI) | Subtotals only | |
| 39.1 Roflumilast 500 μg | 1 | 11168 | Odds Ratio (M‐H, Fixed, 95% CI) | 1.81 [1.26, 2.62] |
| 39.2 Roflumilast 250 μg | 1 | 6288 | Odds Ratio (M‐H, Fixed, 95% CI) | 0.94 [0.40, 2.21] |
| 40 Depression (roflumilast) Show forest plot | 1 | Odds Ratio (M‐H, Fixed, 95% CI) | Subtotals only | |
| 40.1 Roflumilast 500 μg | 1 | 11168 | Odds Ratio (M‐H, Fixed, 95% CI) | 1.59 [1.11, 2.27] |
| 40.2 Roflumilast 250 μg | 1 | 6288 | Odds Ratio (M‐H, Fixed, 95% CI) | 0.56 [0.20, 1.56] |