| 1 Maximum percent decrease in PFT Show forest plot | 12 | 543 | Mean Difference (IV, Random, 95% CI) | 6.84 [4.47, 9.22] |
|
| 1.1 Children | 7 | 183 | Mean Difference (IV, Random, 95% CI) | 7.30 [3.88, 10.73] |
| 1.2 Adults | 5 | 360 | Mean Difference (IV, Random, 95% CI) | 6.39 [2.67, 10.12] |
| 2 Complete protection: post exercise fall PFT <15% (entered as proportion achieved) Show forest plot | 9 | 451 | Odds Ratio (M‐H, Random, 95% CI) | 0.31 [0.18, 0.52] |
|
| 2.1 Children | 6 | 147 | Odds Ratio (M‐H, Random, 95% CI) | 0.18 [0.07, 0.46] |
| 2.2 Adults | 3 | 304 | Odds Ratio (M‐H, Random, 95% CI) | 0.40 [0.21, 0.75] |
| 3 Clinical Protection: 50% improvement over placebo (entered as proportion achieved) Show forest plot | 6 | 154 | Odds Ratio (M‐H, Random, 95% CI) | 0.37 [0.18, 0.77] |
|
| 3.1 Children | 4 | 108 | Odds Ratio (M‐H, Random, 95% CI) | 0.35 [0.14, 0.88] |
| 3.2 Adults | 2 | 46 | Odds Ratio (M‐H, Random, 95% CI) | 0.40 [0.12, 1.34] |
| 4 Mean degree of protection: PFT comparison Show forest plot | 7 | 180 | Mean Difference (IV, Random, 95% CI) | ‐22.67 [‐33.42, ‐11.92] |
|
| 4.1 Children | 5 | 134 | Mean Difference (IV, Random, 95% CI) | ‐21.55 [‐34.15, ‐8.96] |
| 4.2 Adults | 2 | 46 | Mean Difference (IV, Random, 95% CI) | ‐30.05 [‐52.52, ‐7.57] |
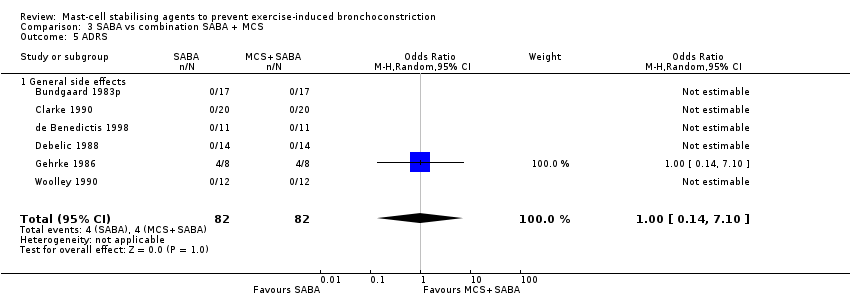
| 5 ADRS Show forest plot | 10 | 304 | Odds Ratio (M‐H, Random, 95% CI) | 0.16 [0.00, 8.24] |
|
| 5.1 General side effects | 10 | 304 | Odds Ratio (M‐H, Random, 95% CI) | 0.16 [0.00, 8.24] |
| 6 High vs low quality Show forest plot | 12 | 543 | Mean Difference (IV, Random, 95% CI) | 7.06 [4.60, 9.52] |
|
| 6.1 Low quality (Jadad 1‐2) | 5 | 356 | Mean Difference (IV, Random, 95% CI) | 7.51 [3.97, 11.04] |
| 6.2 High quality (Jadad 3‐5) | 7 | 187 | Mean Difference (IV, Random, 95% CI) | 6.32 [2.47, 10.18] |
| 7 Effect by severity Show forest plot | 12 | 543 | Mean Difference (IV, Random, 95% CI) | 6.85 [4.45, 9.24] |
|
| 7.1 Mild EIB (< 30% maximum fall on placebo) | 4 | 273 | Mean Difference (IV, Random, 95% CI) | 4.06 [1.73, 6.39] |
| 7.2 Severe EIB (=>30% maximum fall on placebo) | 8 | 270 | Mean Difference (IV, Random, 95% CI) | 10.80 [7.44, 14.17] |
| 8 By delivery method Show forest plot | 12 | 401 | Mean Difference (IV, Random, 95% CI) | 11.12 [7.65, 14.59] |
|
| 8.1 MDI | 2 | 52 | Mean Difference (IV, Random, 95% CI) | 11.12 [‐1.23, 23.48] |
| 8.2 Spinhaler (Top/Bottom Index) | 3 | 96 | Mean Difference (IV, Random, 95% CI) | 16.05 [11.95, 20.15] |
| 8.3 Nebulisation | 2 | 53 | Mean Difference (IV, Random, 95% CI) | 4.46 [‐3.14, 12.06] |
| 8.4 Two or more methods | 5 | 200 | Mean Difference (IV, Random, 95% CI) | 9.94 [6.34, 13.55] |
| 9 By Drug: MSC vs SABA Show forest plot | 16 | 507 | Mean Difference (IV, Random, 95% CI) | 11.00 [7.76, 14.23] |
|
| 9.1 Fenoterol | 3 | 82 | Mean Difference (IV, Random, 95% CI) | 9.88 [3.26, 16.49] |
| 9.2 Salbutamol | 4 | 159 | Mean Difference (IV, Random, 95% CI) | 8.15 [2.71, 13.59] |
| 9.3 Terbutaline | 2 | 46 | Mean Difference (IV, Random, 95% CI) | 5.85 [2.11, 9.58] |
| 9.4 Reproterol/procaterol | 2 | 56 | Mean Difference (IV, Random, 95% CI) | 11.11 [1.57, 20.64] |
| 9.5 Fenoterol (Top/Bottom Index) | 3 | 100 | Mean Difference (IV, Random, 95% CI) | 17.60 [12.95, 22.24] |
| 9.6 Salbutamol (Top/Bottom Index) | 2 | 64 | Mean Difference (IV, Random, 95% CI) | 10.50 [‐0.28, 21.28] |
| 10 By method used to calculate change Show forest plot | 16 | | Mean Difference (IV, Random, 95% CI) | Subtotals only |
|
| 10.1 Percent Change Index | 11 | 343 | Mean Difference (IV, Random, 95% CI) | 7.76 [5.23, 10.30] |
| 10.2 Top‐Bottom Index | 5 | 164 | Mean Difference (IV, Random, 95% CI) | 14.71 [9.14, 20.29] |
| 11 Effect by severity (TBI) Show forest plot | 4 | | Mean Difference (IV, Random, 95% CI) | Subtotals only |
|
| 11.3 Top/Bottom index (Severe EIB) | 4 | 130 | Mean Difference (IV, Random, 95% CI) | 15.18 [8.07, 22.29] |
| 12 Effect by steroid use Show forest plot | 7 | 232 | Mean Difference (IV, Random, 95% CI) | 7.41 [4.73, 10.09] |
|
| 12.1 No recent steroid use | 4 | 156 | Mean Difference (IV, Random, 95% CI) | 6.35 [3.16, 9.53] |
| 12.2 Some on ICS | 3 | 76 | Mean Difference (IV, Random, 95% CI) | 10.00 [5.03, 14.96] |