Techniques for preventing hypotension during spinal anaesthesia for caesarean section
Abstract
Background
Maternal hypotension is the most frequent complication of spinal anaesthesia for caesarean section. It can be associated with nausea or vomiting and may pose serious risks to the mother (unconsciousness, pulmonary aspiration) and baby (hypoxia, acidosis, neurological injury).
Objectives
To assess the effects of prophylactic interventions for hypotension following spinal anaesthesia for caesarean section.
Search methods
We searched Cochrane Pregnancy and Childbirth's Trials Register (9 August 2016) and reference lists of retrieved studies.
Selection criteria
Randomised controlled trials, including full texts and abstracts, comparing interventions to prevent hypotension with placebo or alternative treatment in women having spinal anaesthesia for caesarean section. We excluded studies if hypotension was not an outcome measure.
Data collection and analysis
Two review authors independently assessed study quality and extracted data from eligible studies. We report 'Summary of findings' tables using GRADE.
Main results
We included 126 studies involving 9565 participants. Interventions were to prevent maternal hypotension following spinal anaesthesia only, and we excluded any interventions considered active treatment. All the included studies reported the review's primary outcome. Across 49 comparisons, we identified three intervention groups: intravenous fluids, pharmacological interventions, and physical interventions. Authors reported no serious adverse effects with any of the interventions investigated. Most trials reported hypotension requiring intervention and Apgar score of less than 8 at five minutes as the only outcomes. None of the trials included in the comparisons we describe reported admission to neonatal intensive care unit.
Crystalloid versus control (no fluids)
Fewer women experienced hypotension in the crystalloid group compared with no fluids (average risk ratio (RR) 0.84, 95% confidence interval (CI) 0.72 to 0.98; 370 women; 5 studies; low‐quality evidence). There was no clear difference between groups in numbers of women with nausea and vomiting (average RR 0.19, 95% CI 0.01 to 3.91; 1 study; 69 women; very low‐quality evidence). No baby had an Apgar score of less than 8 at five minutes in either group (60 babies, low‐quality evidence).
Colloid versus crystalloid
Fewer women experienced hypotension in the colloid group compared with the crystalloid group (average RR 0.68, 95% CI 0.58 to 0.80; 2105 women; 28 studies; very low‐quality evidence). There were no clear differences between groups for maternal hypertension requiring intervention (average RR 0.64, 95% CI 0.09 to 4.46, 3 studies, 327 women;very low‐quality evidence), maternal bradycardia requiring intervention (average RR 0.99, 95% CI 0.55 to 1.79, 6 studies, 509 women; very low‐quality evidence), nausea and/or vomiting (average RR 0.83, 95% CI 0.61 to 1.13, 15 studies, 1154 women, I² = 37%; very low‐quality evidence), neonatal acidosis (average RR 0.83, 95% CI 0.15 to 4.52, 6 studies, 678 babies; very low‐quality evidence), or Apgar score of less than 8 at five minutes (average RR 0.24, 95% CI 0.03 to 2.05, 11 studies, 826 babies; very low‐quality evidence).
Ephedrine versus phenylephrine
There were no clear differences between ephedrine and phenylephrine groups for preventing maternal hypotension (average RR 0.92, 95% CI 0.71 to 1.18; 401 women; 8 studies; very low‐quality evidence) or hypertension (average RR 1.72, 95% CI 0.71 to 4.16, 2 studies, 118 women, low‐quality evidence). Rates of bradycardia were lower in the ephedrine group (average RR 0.37, 95% CI 0.21 to 0.64, 5 studies, 304 women, low‐quality evidence). There was no clear difference in the number of women with nausea and/or vomiting (average RR 0.76, 95% CI 0.39 to 1.49, 4 studies, 204 women, I² = 37%, very low‐quality evidence), or babies with neonatal acidosis (average RR 0.89, 95% CI 0.07 to 12.00, 3 studies, 175 babies, low‐quality evidence). No baby had an Apgar score of less than 8 at five minutes in either group (321 babies; low‐quality evidence).
Ondansetron versus control
Ondansetron administration was more effective than control (placebo saline) for preventing hypotension requiring treatment (average RR 0.67, 95% CI 0.54 to 0.83; 740 women, 8 studies, low‐quality evidence), bradycardia requiring treatment (average RR 0.49, 95% CI 0.28 to 0.87; 740 women, 8 studies, low‐quality evidence), and nausea and/or vomiting (average RR 0.35, 95% CI 0.24 to 0.51; 653 women, 7 studies, low‐quality evidence). There was no clear difference between the groups in rates of neonatal acidosis (average RR 0.48, 95% CI 0.05 to 5.09; 134 babies; 2 studies, low‐quality evidence) or Apgar scores of less than 8 at five minutes (284 babies, low‐quality evidence).
Lower limb compression versus control
Lower limb compression was more effective than control for preventing hypotension (average RR 0.61, 95% CI 0.47 to 0.78, 11 studies, 705 women, I² = 65%, very low‐quality evidence). There was no clear difference between the groups in rates of bradycardia (RR 0.63, 95% CI 0.11 to 3.56, 1 study, 74 women, very low‐quality evidence) or nausea and/or vomiting (average RR 0.42 , 95% CI 0.14 to 1.27, 4 studies, 276 women, I² = 32%, very‐low quality evidence). No baby had an Apgar score of less than 8 at five minutes in either group (130 babies, very low‐quality evidence).
Walking versus lying
There was no clear difference between the groups for women with hypotension requiring treatment (RR 0.71, 95% CI 0.41 to 1.21, 1 study, 37 women, very low‐quality evidence).
Many included studies reported little to no information that would allow an assessment of their risk of bias, limiting our ability to draw meaningful conclusions. GRADE assessments of the quality of evidence ranged from very low to low. We downgraded evidence for limitations in study design, imprecision, and indirectness; most studies assessed only women scheduled for elective caesarean sections.
External validity also needs consideration. Readers should question the use of colloids in this context given the serious potential side effects such as allergy and renal failure associated with their administration.
Authors' conclusions
While interventions such as crystalloids, colloids, ephedrine, phenylephrine, ondansetron, or lower leg compression can reduce the incidence of hypotension, none have been shown to eliminate the need to treat maternal hypotension in some women. We cannot draw any conclusions regarding rare adverse effects associated with use of the interventions (for example colloids) due to the relatively small numbers of women studied.
PICO
Plain language summary
Techniques for preventing a decrease in blood pressure during spinal anaesthesia for caesarean section
What is the issue?
Spinal anaesthesia is a commonly used technique for caesarean birth as the mother is able to be awake for the birth and usually remains comfortable afterwards. In addition, the technique avoids the risks of general anaesthesia. The most common adverse effect of spinal anaesthesia is a fall in blood pressure (hypotension).
This study reviews the evidence for preventing hypotension following spinal anaesthesia for caesarean birth.
Why is this important?
Hypotension following spinal anaesthesia for caesarean birth occurs frequently. When it occurs, the mother may feel faint or nauseous and may vomit. If her blood pressure falls excessively, the mother runs serious risks (such as loss of consciousness), as does the baby (such as lack of oxygen and brain damage). Hypotension may be prevented by administering intravenous fluids, giving medications (such as ephedrine, phenylephrine, and ondansetron), by leg compression, or by the mother either lying down or walking around before the spinal anaesthesia.
What evidence did we find?
We searched the evidence in August 2016 and found a total of 126 studies involving 9565 women. Included studies investigated 49 different comparisons, which we split into three groups: intravenous fluid therapy, medications, and physical methods. Here we describe the results of the six main comparisons (crystalloid versus control; colloid versus crystalloid; ephedrine versus phenylephrine; ondansetron versus control; leg compression versus control; walking versus lying).
Fluid therapy (crystalloid versus control; colloid versus crystalloid)
It is uncertain whether crystalloids prevent hypotension because the quality of the evidence is very low. Giving colloids instead of crystalloids may mean that fewer women have low blood pressure after having spinal anaesthesia.
We cannot be certain due to the very low quality evidence whether crystalloid or colloid are better at preventing maternal low heart rate (bradycardia), high blood pressure, nausea and vomiting, neonatal acidosis, or low Apgar scores. Whether women received crystalloids or no fluids did not affect the number of women who experienced nausea and/or vomiting.
Medications (ephedrine versus phenylephrine; ondansetron versus control)
Lower rates of bradycardia occurred in women receiving ephedrine versus phenylephrine, and with ondansetron versus no ondansetron, but the evidence is low quality. Ondansetron may prevent low blood pressure and nausea/vomiting but made little or no difference to neonatal acidosis or Apgar scores. There was little difference between ephedrine and phenylephrine for low or high blood pressure, nausea and vomiting, neonatal acidosis, or Apgar scores. We cannot be certain of these results due to the low or very low quality of the evidence.
Physical methods (leg compression versus control; walking versus lying)
It is uncertain whether leg compression reduces the number of women with hypotension compared with no leg compression because the quality of evidence is very low. Similarly, we cannot be certain whether leg compression made any difference to women experiencing bradycardia or nausea and vomiting, or to babies' Apgar scores. It is also uncertain whether walking or lying down before the spinal anaesthesia reduces low blood pressure.
What does this mean?
We found that no single method completely prevents hypotension in women receiving spinal anaesthesia during caesarean birth. Administering intravenous fluids or certain medications, and compressing the legs with bandages, stockings, or inflatable devices may reduce the incidence of hypotension. However, we found the quality of the evidence to be low or very low, so there is still a need for large, high‐quality studies using these clinically relevant interventions, either alone or in combination.
Future research in this setting could focus on combinations of these effective strategies or on new innovative strategies.
Authors' conclusions
Summary of findings
| Techniques for preventing hypotension during spinal anaesthesia for caesarean section | |||||
| Patient or population: women having spinal anaesthesia for caesarean section Setting: hospital (inpatient) Outcome: maternal hypotension requiring intervention | |||||
| Comparisons | Anticipated absolute effects* (95% CI) | Relative effect | № of participants | Quality of the evidence | |
| Risk with control | Risk with Intervention | ||||
| Crystalloid vs control | Control | Crystalloid | average RR 0.84 | 370 | ⊕⊕⊝⊝ |
| 535 per 1000 | 449 per 1000 | ||||
| Colloid vs crystalloid | Crystalloid | Colloid | average RR 0.68 (0.58 to 0.80) | 2105 | ⊕⊝⊝⊝ |
| 586 per 1000 | 398 per 1000 | ||||
| Ephedrine vs phenylephrine | Phenylephrine | Ephedrine | average RR 0.92 | 401 | ⊕⊝⊝⊝ |
| 465 per 1000 | 428 per 1000 | ||||
| Ondansetron vs control | Control | Ondansetron | average RR 0.67 | 740 | ⊕⊕⊝⊝ |
| 579 per 1000 | 388 per 1000 | ||||
| Lower limb compression vs control | Control | Lower limb compression | average RR 0.61 | 705 | ⊕⊝⊝⊝ |
| 663 per 1000 | 404 per 1000 | ||||
| Walking vs lying | Lying | Walking | RR 0.71 (0.41 to 1.21) | 37 (1 RCT) | ⊕⊝⊝⊝ Very lowf,g |
| 706 per 1000 | 501 per 1000 | ||||
| *The risk in the intervention group (and its 95% confidence interval) is based on the assumed risk in the comparison group and the relative effect of the intervention (and its 95% CI). | |||||
| GRADE Working Group grades of evidence | |||||
| aInclusion criteria not representative of wider population (e.g. only elective caesarean sections) (−1). | |||||
| Crystalloid versus control for preventing hypotension during spinal anaesthesia for caesarean section | |||||
| Patient or population: women having spinal anaesthesia for caesarean section | |||||
| Outcomes | Anticipated absolute effects* (95% CI) | Relative effect | № of participants | Quality of the evidence | |
| Risk with control | Risk with crystalloid | ||||
| Maternal hypotension requiring intervention | Study population | RR 0.84 | 370 | ⊕⊕⊝⊝ | |
| 535 per 1000 | 449 per 1000 | ||||
| Maternal hypertension requiring intervention | No studies reported this outcome. | ||||
| Maternal bradycardia requiring intervention | No studies reported this outcome. | ||||
| Maternal nausea and/or vomiting | Study population | RR 0.19 (0.01 to 3.91) | 69 (1 RCT) | ⊕⊝⊝⊝ Very lowa,c | |
| 59 per 1000 | 11 per 1000 (1 to 230) | ||||
| Neonatal acidosis as defined by cord or neonatal blood with a pH < 7.2 | No studies reported this outcome. | ||||
| Neonatal Apgar score < 8 at 5 minutes | Study population | Not estimable | 60 | ⊕⊕⊝⊝ | |
| 0 per 1000 | 0 per 1000 | ||||
| Admission to neonatal intensive care unit | No studies reported this outcome. | ||||
| *The risk in the intervention group (and its 95% confidence interval) is based on the assumed risk in the comparison group and the relative effect of the intervention (and its 95% CI). | |||||
| GRADE Working Group grades of evidence High quality: we are very confident that the true effect lies close to that of the estimate of the effect. | |||||
| aOnly elective caesarean sections included (−1). | |||||
| Colloid versus crystalloid for preventing hypotension during spinal anaesthesia for caesarean section | |||||
| Patient or population: women having spinal anaesthesia for caesarean section | |||||
| Outcomes | Anticipated absolute effects* (95% CI) | Relative effect | № of participants | Quality of the evidence | |
| Risk with crystalloid | Risk with colloid | ||||
| Maternal hypotension requiring intervention | Study population | RR 0.68 (0.58 to 0.80) | 2105 | ⊕⊝⊝⊝ | |
| 586 per 1000 | 398 per 1000 | ||||
| Maternal hypertension requiring intervention | Study population | RR 0.64 | 327 | ⊕⊝⊝⊝ | |
| 55 per 1000 | 35 per 1000 | ||||
| Maternal bradycardia requiring intervention | Study population | RR 0.99 | 509 | ⊕⊝⊝⊝ | |
| 76 per 1000 | 75 per 1000 | ||||
| Maternal nausea and/or vomiting | Study population | RR 0.83 | 1154 | ⊕⊝⊝⊝ | |
| 228 per 1000 | 189 per 1000 | ||||
| Neonatal acidosis as defined by cord or neonatal blood with a pH < 7.2 | Study population | RR 0.83 | 678 | ⊕⊝⊝⊝ | |
| 26 per 1000 | 21 per 1000 | ||||
| Neonatal Apgar score < 8 at 5 minutes | Study population | RR 0.24 | 826 | ⊕⊝⊝⊝ | |
| 10 per 1000 | 2 per 1000 | ||||
| Admission to neonatal intensive care unit | No studies reported this outcome. | ||||
| *The risk in the intervention group (and its 95% confidence interval) is based on the assumed risk in the comparison group and the relative effect of the intervention (and its 95% CI). | |||||
| GRADE Working Group grades of evidence High quality: we are very confident that the true effect lies close to that of the estimate of the effect. | |||||
| aDowngraded one level for serious risk of bias (due to unclear risk of selection bias in most included studies) (−1). | |||||
| Ephedrine versus phenylephrine for preventing hypotension during spinal anaesthesia for caesarean section | ||||||
| Patient or population: women having spinal anaesthesia for caesarean section | ||||||
| Outcomes | Anticipated absolute effects* (95% CI) | Relative effect | № of participants | Quality of the evidence | Comments | |
| Risk with phenylephrine | Risk with ephedrine | |||||
| Maternal hypotension requiring intervention | Study population | RR 0.92 | 401 | ⊕⊝⊝⊝ | — | |
| 465 per 1000 | 428 per 1000 | |||||
| Maternal hypertension requiring intervention | Study population | RR 1.72 | 118 | ⊕⊕⊝⊝ | — | |
| 113 per 1000 | 194 per 1000 | |||||
| Maternal bradycardia requiring intervention | Study population | RR 0.37 | 304 | ⊕⊕⊝⊝ | — | |
| 243 per 1000 | 90 per 1000 | |||||
| Maternal nausea and/or vomiting | Study population | RR 0.76 | 204 | ⊕⊝⊝⊝ | — | |
| 216 per 1000 | 164 per 1000 | |||||
| Neonatal acidosis as defined by cord or neonatal blood with a pH < 7.2 | Study population | RR 0.89 | 175 | ⊕⊕⊝⊝ | — | |
| 11 per 1000 | 10 per 1000 | |||||
| Neonatal Apgar score < 8 at 5 minutes | Study population | Not estimable | 321 | ⊕⊕⊝⊝ | No events observed in any studies. Relative effect could not be estimated. | |
| Not pooled | Not pooled | |||||
| Admission to neonatal intensive care unit | No studies reported this outcome. | |||||
| *The risk in the intervention group (and its 95% confidence interval) is based on the assumed risk in the comparison group and the relative effect of the intervention (and its 95% CI). | ||||||
| GRADE Working Group grades of evidence High quality: we are very confident that the true effect lies close to that of the estimate of the effect. | ||||||
| aSubstantial heterogeneity (−1). | ||||||
| Ondansetron versus saline placebo for preventing hypotension during spinal anaesthesia for caesarean section | |||||
| Patient or population: women having spinal anaesthesia for caesarean section | |||||
| Outcomes | Anticipated absolute effects* (95% CI) | Relative effect | № of participants | Quality of the evidence | |
| Risk with control | Risk with ondansetron | ||||
| Maternal hypotension requiring intervention | Study population | RR 0.67 | 740 | ⊕⊕⊝⊝ | |
| 579 per 1000 | 388 per 1000 | ||||
| Maternal hypertension requiring intervention | No studies reported this outcome. | ||||
| Maternal bradycardia requiring intervention | Study population | RR 0.49 | 740 | ⊕⊕⊝⊝ | |
| 100 per 1000 | 49 per 1000 | ||||
| Maternal nausea and/or vomiting | Study population | RR 0.35 | 653 | ⊕⊕⊝⊝ | |
| 296 per 1000 | 103 per 1000 | ||||
| Neonatal Apgar score < 8 at 5 minutes | Study population | Not estimable | 284 | ⊕⊕⊝⊝ | |
| Not pooled | Not pooled | ||||
| Neonatal acidosis as defined by cord or neonatal blood with a pH < 7.2 | Study population | RR 0.48 | 134 | ⊕⊕⊝⊝ | |
| 30 per 1000 | 15 per 1000 | ||||
| Admission to neonatal care unit | No studies reported this outcome. | ||||
| *The risk in the intervention group (and its 95% confidence interval) is based on the assumed risk in the comparison group and the relative effect of the intervention (and its 95% CI). | |||||
| GRADE Working Group grades of evidence High quality: we are very confident that the true effect lies close to that of the estimate of the effect. | |||||
| a Inclusion criteria not representative of wider population (e.g. elective caesarean section only) (−1). | |||||
| Leg compression versus control for preventing hypotension during spinal anaesthesia for caesarean section | ||||||
| Patient or population: women having spinal anaesthesia for caesarean section | ||||||
| Outcomes | Anticipated absolute effects* (95% CI) | Relative effect | № of participants | Quality of the evidence | Comments | |
| Risk with control | Risk with lower limb compression | |||||
| Maternal hypotension requiring intervention | Study population | RR 0.61 | 705 | ⊕⊝⊝⊝ | — | |
| 663 per 1000 | 404 per 1000 | |||||
| Maternal hypertension requiring intervention | No studies reported this outcome. | |||||
| Maternal bradycardia requiring intervention | Study population | RR 0.63 (0.11 to 3.56) | 74 (1 RCTs) | ⊕⊝⊝⊝ | — | |
| 83 per 1000 | 53 per 1000 (9 to 297) | |||||
| Maternal nausea and/or vomiting | Study population | RR 0.42 | 276 | ⊕⊝⊝⊝ | — | |
| 162 per 1000 | 68 per 1000 | |||||
| Neonatal acidosis as defined by cord or neonatal blood with a pH < 7.2 | No studies reported this outcome. | |||||
| Neonatal Apgar score < 8 at 5 minutes | Study population | Not estimable | 130 | ⊕⊝⊝⊝ | No events observed in any studies. Relative effect could not be estimated. | |
| Not pooled | Not pooled | |||||
| Admission to neonatal intensive care unit | No studies reported this outcome. | |||||
| *The risk in the intervention group (and its 95% confidence interval) is based on the assumed risk in the comparison group and the relative effect of the intervention (and its 95% CI). | ||||||
| GRADE Working Group grades of evidence High quality: we are very confident that the true effect lies close to that of the estimate of the effect. | ||||||
| aDowngraded one level for serious risk of bias (due to unclear risk of selection bias in the majority of included studies (−1). | ||||||
| Walking versus lying for reducing risk of maternal hypotension during spinal anaesthesia for caesarean section | |||||
| Patient or population: women having spinal anaesthesia for caesarean section | |||||
| Outcomes | Anticipated absolute effects* (95% CI) | Relative effect | № of participants | Quality of the evidence | |
| Risk with lying | Risk with walking | ||||
| Maternal hypotension requiring intervention | Study population | RR 0.71 | 37 | ⊕⊝⊝⊝ | |
| 706 per 1000 | 501 per 1000 | ||||
| Maternal hypertension requiring intervention | No studies reported this outcome. | ||||
| Maternal bradycardia requiring intervention | No studies reported this outcome. | ||||
| Maternal nausea and/or vomiting | No studies reported this outcome. | ||||
| Neonatal acidosis as defined by cord or neonatal blood with a pH < 7.2 | No studies reported this outcome. | ||||
| Neonal Apgar score < 8 at 5 minutes | No studies reported this outcome. | ||||
| Admission to neonatal intensive care unit | No studies reported this outcome. | ||||
| *The risk in the intervention group (and its 95% confidence interval) is based on the assumed risk in the comparison group and the relative effect of the intervention (and its 95% CI). | |||||
| GRADE Working Group grades of evidence | |||||
| aParticipants and anaesthetists not blinded in 1 study with 100% weight in analysis (−1). | |||||
Background
The choice of anaesthesia for caesarean birth is made by balancing women's preferences with the risks and benefits of a particular technique to the mother and her baby (Glosten 2000).
Anaesthesia‐related maternal mortality occurs most frequently when using general anaesthesia for caesarean delivery (Hawkins 1997; Hibbard 1996; Rasmussen 1994). Other risks of general anaesthesia include: failed endotracheal intubation, failed ventilation, aspiration pneumonitis, dental trauma, postoperative nausea and vomiting, delayed breastfeeding, and sedation of the baby (Atlee 1999; Reisner 1999). Regional techniques such as epidural or spinal anaesthesia avoid these risks, allow the mother to be awake at the baby's birth, and may reduce the need for systemic opioid administration postoperatively. Epidural analgesia during labour can be extended to provide surgical anaesthesia should caesarean section be necessary (Lucas 1999). However, a spinal anaesthetic technique has the advantage of simplicity, rapid onset, low failure rate, minimal drug dose, and excellent muscle relaxation during surgery (Glosten 2000). This frequently makes it the anaesthetic technique of choice for both elective and emergency caesarean delivery when a functioning epidural catheter is not in place. Indeed, at least 40% of women having caesarean sections in the USA receive spinal anaesthesia (Hawkins 1997), as do most women undergoing elective caesarean operations in the UK (Husaini 1998; Shibli 2000).
Spinal anaesthesia to the level of T4 is necessary to provide an adequate block for caesarean birth (Glosten 2000; Ousley 2012; Russell 1995). As a consequence, an almost inevitable complete sympathetic block occurs, and decreased venous return to the heart – exacerbated by a degree of inferior vena caval compression – results in hypotension and decreased cardiac output (Rocke 1995). Hypotension during spinal anaesthesia for elective caesarean delivery occurs in as many as 70% to 80% of women receiving pharmacological prophylaxis (Mercier 2013).
Despite all regional techniques being associated with maternal hypotension, the slower onset and lower incidence of this complication during epidural anaesthesia may make the need for prophylactic medications such as ephedrine unnecessary (Glosten 2000; May 1995). In contrast, the frequent occurrence and rapid onset of hypotension during spinal anaesthesia has encouraged anaesthetists to try and prevent or minimise the associated maternal symptoms of vomiting, nausea, and impaired consciousness during the establishment of the block. The concomitant reduction in the utero‐placental blood supply associated with maternal hypotension has deleterious effects such as fetal acidosis (Roberts 1995; Robson 1992), which may result in weak rooting and sucking reflexes of infants (Hollmen 1978); these can severely compromise the establishment of breastfeeding postdelivery (May 1995).
Preventing spinal hypotension appears more likely to decrease the frequency and severity of associated adverse maternal symptoms than treating established hypotension (Datta 1982; Husaini 1998; Kang 1982). Surprisingly few pre‐eclamptic women having caesarean birth under spinal anaesthesia require intervention for hypotension (Clark 2005; Sharwood‐Smith 1999), so routine prophylaxis is probably unnecessary in this particular patient group. Women in established labour who subsequently undergo spinal anaesthesia seem similarly unaffected by hypotension (Lapins 2001).
Description of the condition
Maternal hypotension is the most frequent complication of spinal anaesthesia, with an incidence approaching 100% (Glosten 2000; May 1995). Untreated severe hypotension can pose serious risks to both mother (unconsciousness, pulmonary aspiration, apnoea, or even cardiac arrest) and baby (impaired placental perfusion leading to hypoxia, fetal acidosis, and neurological injury). Although there is some variation, most workers define hypotension as a maternal systolic blood pressure below 70% to 80% of baseline recordings, an absolute value of less than 90 mmHg to 100 mmHg, or both (Glosten 2000).
Description of the intervention
Clinicians currently use a range of strategies including intravenous fluids, pharmacological treatments, and physical interventions to minimise or prevent hypotension. These strategies may include proper maternal position with the uterus displaced off the vena cava, infusion of fluids to increase effective blood volume, and the administration of ephedrine to vasoconstrict the peripheral circulation and increase heart rate (Glosten 2000). Other workers have administered the alpha agonists phenylephrine or metaraminol, which act primarily by vasoconstriction (Alahuhta 1992; Morgan 1994). Physical interventions such as leg wrappings are also used and may act by minimising venous pooling of blood in the legs (Van Bogaert 1998). All these methods aim to maintain blood pressure by increasing venous return to the heart, increasing the resistance of the peripheral circulation, or both. There is, however, no established ideal technique.
How the intervention might work
Health professionals can administer intravenous fluids, including crystalloids and colloids, to increase maternal blood volume, resulting in an increase in venous return, stroke volume, and blood pressure. Intravenous fluid administration prior to spinal anaesthesia for caesarean birth is accepted standard practice (Rout 1993b). The choice of fluid depends on individual and institutional habit, material cost (crystalloid is considerably cheaper), and the perceived relative benefits and risks. Uncommon but potentially serious adverse effects of colloids include anaphylactoid reactions (MIMS 1995), impaired coagulation (Sharma 1999), and the risk of infection such as hepatitis C from human albumin preparations. In addition, some authors have raised concerns regarding prior transmission of bovine spongiform encephalopathy from bovine‐derived pharmaceuticals such as the gelatin Haemaccel (Wickham 1996).
Vasopressors, such as the alpha‐agonist phenylephrine, cause peripheral vasoconstriction and an increase in systemic vascular resistance. This subsequently results in an increase in blood pressure. Combined alpha and beta‐agonists, such as ephedrine, may also prevent hypotension by increasing both heart rate and systemic vascular resistance. Furthermore, anti‐muscarinic agents, such as glycopyrrolate, may be useful to increase heart rate, resulting in a subsequent increase in blood pressure. Possible adverse effects of vasopressors include anaphylaxis, hypertension, and cardiac dysrhythmias (MIMS 1995). Furthermore, there is the potential for impaired utero‐placental perfusion secondary to vasoconstriction (despite maintenance or restoration of maternal blood pressure) with fetal or neonatal consequences as described above.
Physical interventions, such as leg wrapping and calf compression devices, may be helpful in improving venous return and therefore can improve blood pressure. However, these techniques may also have unintentional effects such as localised ischaemia, nerve injury, or unacceptable maternal discomfort.
Why it is important to do this review
Most women will experience hypotension after spinal anaesthesia for caesarean section if they do not receive a preventive intervention. There is no single widely accepted and evidence‐based ideal intervention to prevent maternal hypotension associated with spinal anaesthesia.
Objectives
To assess the effects of prophylactic interventions for hypotension following spinal anaesthesia for caesarean section.
Methods
Criteria for considering studies for this review
Types of studies
All published or unpublished randomised controlled trials that compare an intervention to prevent hypotension with placebo or alternative treatment in women having spinal anaesthesia for caesarean section. We did not include quasi‐randomised, cluster or cross‐over trials in this review update, in a departure from the protocol of the original version. We included abstracts if they reported sufficient information to enable an adequate assessment of methodology and risk of bias.
We excluded studies if hypotension was not an outcome measure or was not clearly defined prior to administering a rescue treatment.
Types of participants
Women having spinal anaesthesia for caesarean section.
Types of interventions
Intravenous fluids
-
Colloids
-
Crystalloids
Drugs
-
Sympathomimetics: ephedrine, metaraminol, phenylephrine
-
Other medications used to prevent hypotension, for example, ondansetron
Physical methods
-
Leg bindings
-
Compression stockings
-
Other manoeuvres
We did not make comparisons between different anaesthetic techniques since this review question is concerned with preventive techniques in the context of standardised anaesthetic methods. We excluded studies in which women received combined spinal‐epidural anaesthesia or epidural anaesthesia.
Types of outcome measures
Primary outcomes
The incidence of maternal hypotension requiring pharmacological intervention (after intrathecal injection and prior to delivery), where hypotension was a certain decrease in systolic or mean blood pressure, as defined and measured by the authors of included studies (Table 1).
MAP: mean arterial pressure; SAP: systolic arterial pressure.
We excluded studies if hypotension was not an outcome measure or was not clearly defined prior to administering a rescue treatment.
Secondary outcomes
We considered any maternal or neonatal outcome that could reflect a consequence of the intervention.
Maternal
-
Hypertension requiring intervention
-
Cardiac dysrhythmia defined as any rhythm requiring intervention (e.g. bradycardia, tachycardia)
-
Nausea, vomiting
-
Anaphylaxis
-
Impaired consciousness, dizziness
Neonatal
-
Acidosis as defined by cord or neonatal bloods with a pH of less than 7.2
-
Apgar scores of less than 7 or 8 at five minutes
-
Admission to neonatal intensive care unit
The included studies rarely reported these secondary outcomes.
Search methods for identification of studies
The following Methods section of this review is based on a standard template used by Cochrane Pregnancy and Childbirth.
Electronic searches
We searched Cochrane Pregnancy and Childbirth Trials Register by contacting their information specialist (9 August 2016).
The register is a database containing over 22,000 reports of controlled trials in the field of pregnancy and childbirth. For full search methods used to populate Pregnancy and Childbirth’s Trials Register, including the detailed search strategies for CENTRAL, MEDLINE, Embase and CINAHL; the list of handsearched journals and conference proceedings; and the list of journals reviewed via the current awareness service, please follow the link to the editorial information about the Cochrane Pregnancy and Childbirth in the Cochrane Library and select the 'Specialized Register' section from the options on the left side of the screen.
Briefly, Cochrane Pregnancy and Childbirth's Trials Register is maintained by their information specialist and contains trials identified from:
-
monthly searches of the Cochrane Central Register of Controlled Trials (CENTRAL);
-
weekly searches of MEDLINE (Ovid);
-
weekly searches of Embase (Ovid);
-
monthly searches of CINAHL (EBSCO);
-
handsearches of 30 journals and the proceedings of major conferences;
-
weekly current awareness alerts for a further 44 journals plus monthly BioMed Central email alerts.
Two people screen search results, and the full text or abstract (where full text was unavailable) of all relevant trial reports identified is reviewed. Based on the intervention described, each trial report is assigned a number that corresponds to a specific Pregnancy and Childbirth review topic (or topics) and is then added to the register. The information specialist searches the register for each review using this topic number rather than keywords. This results in a more specific search set which has been fully accounted for in the relevant review sections (Included studies; Excluded studies; Studies awaiting classification; Ongoing studies).
Searching other resources
We also retrieved additional relevant references referred to in the reviewed papers to see if they met the criteria for inclusion in this review.
We did not apply any language or date restrictions.
Data collection and analysis
For methods used in the previous version of this review, see Cyna 2006.
For this update, we used the following methods for assessing the reports identified during the updated search.
Selection of studies
Two review authors independently assessed for inclusion all the potential studies we identified as a result of the search strategy. We resolved any disagreement through discussion or, if required, consulted a third author.
We excluded studies for the following reasons.
-
Hypotension was not an outcome measure or was not clearly defined prior to administering a rescue treatment.
-
The study did not explicitly report incidence of hypotension.
-
The report did not mention randomisation.
-
Randomisation is clearly unsatisfactory.
-
The spinal anaesthetic technique or dose of local anaesthetic is compared, or varies between participants, and is therefore not controlled.
-
The studies investigated combined spinal‐epidural anaesthetic technique.
-
The studied intervention is implemented in response to a fall in blood pressure rather than for prevention (for the purposes of this specific update, review authors felt that the use of automated infusion devices responding to a perceived drop in blood pressure fell into this category, so we excluded these).
Data extraction and management
We designed a form to extract data. For eligible studies, at least two review authors extracted the data using the agreed form. We resolved discrepancies through discussion or, if required, consulted a third person. We entered data into Review Manager 5 software (RevMan 5) and checked for accuracy (RevMan 2014).
When information regarding any of the above was unclear, we attempted to contact authors of the original reports to provide further details.
Assessment of risk of bias in included studies
At least two review authors independently assessed risk of bias for each study using the criteria outlined in the Cochrane Handbook for Systematic Reviews of Interventions (Higgins 2011). We resolved any disagreement by discussion or by involving a third assessor.
Random sequence generation (checking for possible selection bias)
We described for each included study the method used to generate the allocation sequence in sufficient detail to allow an assessment of whether it should produce comparable groups.
We assessed the method as being at:
-
low risk of bias (any truly random process, e.g. random number table, computer random number generator);
-
high risk of bias (any non‐random process, e.g. odd or even date of birth, hospital or clinic record number);
-
unclear risk of bias.
Allocation concealment (checking for possible selection bias)
We described for each included study the method used to conceal the allocation sequence and determined whether intervention allocation could have been foreseen in advance of, or during recruitment, or changed after assignment.
We assessed the methods as being at:
-
low risk of bias (e.g. telephone or central randomisation, consecutively numbered sealed opaque envelopes);
-
high risk of bias (open random allocation, unsealed or non‐opaque envelopes, alternation, date of birth);
-
unclear risk of bias.
Blinding of participants and personnel (checking for possible performance bias)
We described for each included study the methods used, if any, to blind study participants and personnel from knowledge of which intervention a participant received. We considered that studies were at low risk of bias if they were blinded or if we judged that the lack of blinding would be unlikely to affect results. We assessed blinding separately for different outcomes or classes of outcomes.
We assessed the methods as being at:
-
low, high,or unclear risk of bias for participants;
-
low, high, or unclear risk of bias for personnel.
Blinding of outcome assessment (checking for possible detection bias)
We described for each included study the methods used, if any, to blind outcome assessors from knowledge of which intervention a participant received. We assessed blinding separately for different outcomes or classes of outcomes.
We assessed methods used to blind outcome assessment as being at low, high, or unclear risk of bias.
Incomplete outcome data (checking for possible attrition bias through withdrawals, dropouts, protocol deviations)
We described for each included study, and for each outcome or class of outcomes, the completeness of data including attrition and exclusions from the analysis. We stated whether studies reported attrition and exclusions, the numbers included in the analysis at each stage (compared with the total randomised participants), reasons for attrition or exclusion where reported, and whether missing data were balanced across groups or were related to outcomes. Where trial authors reported or could supply sufficient information, we re‐included missing data in the analyses. We assessed methods as being at:
-
low risk of bias (e.g. no missing outcome data, missing outcome data balanced across groups);
-
high risk of bias (e.g. numbers or reasons for missing data imbalanced across groups, 'as treated' analysis done with substantial departure of intervention received from that assigned at randomisation, missing more than 20% of total outcome data collected);
-
unclear risk of bias.
Selective reporting bias
We described for each included study how we investigated the possibility of selective outcome reporting bias and what we found.
We assessed the methods as being at:
-
low risk of bias (where it is clear that authors reported all of the study's pre‐specified outcomes and all expected outcomes of interest to the review);
-
high risk of bias (where authors did not report all the study's pre‐specified outcomes; did not pre‐specify one or more reported primary outcomes; incompletely reported outcomes of interest, rendering them unusable; or failed to include results of a key outcome that would have been expected to have been reported);
-
unclear risk of bias.
Other sources of bias
We described for each included study any important concerns we had about other possible sources of bias. This may have included concerns regarding specific study design or extreme baseline characteristic imbalance between study groups.
We assessed whether each study was free of other problems that could put it at risk of bias, assessing this domain as being at:
-
low risk of other bias;
-
high risk of other bias;
-
unclear risk of other bias.
Overall risk of bias
We made explicit judgements about whether studies were at high risk of bias according to the criteria given in Higgins 2011. With reference to random sequence generation and other sources of bias, we assessed the likely magnitude and direction of the bias and whether we considered it likely to impact on the findings. We explored the impact of the level of bias through undertaking sensitivity analyses – see Sensitivity analysis.
Measures of treatment effect
Dichotomous data
For dichotomous data, we presented the results as summary risk ratio (RR) with 95% confidence intervals (CI).
Continuous data
This update does not include any continuous data. In future updates, if appropriate, we will use the mean difference for continuous data if trials measure outcomes in the same way. We will use the standardised mean difference to combine trials that measure the same outcome but use different methods.
Unit of analysis issues
Cluster‐randomised trials
Cluster‐randomised trials were not eligible for inclusion in this review.
Cross‐over trials
Cross‐over trials were not were not eligible for inclusion in this review.
Trials with more than two treatment groups
We describe all intervention groups for multi‐intervention studies in the Characteristics of included studies table. Depending on the comparisons investigated in the study, we used the methods for data analysis as detailed in section 16.5.4 of Higgins 2011. We combined groups to create a single pair‐wise comparison, or we split the 'shared' or control group into two or more groups with smaller sample size and included two or more (reasonably independent) comparisons.
Dealing with missing data
For included studies, we noted levels of attrition. We explored the impact of including studies with high levels of missing data in the overall assessment of treatment effect by using sensitivity analysis.
For all outcomes, we carried out analyses, as far as possible, on an intention‐to‐treat basis, that is, we attempted to include all participants randomised to each group in the analyses, and we analysed all participants in the group to which they were allocated, regardless of whether or not they received the allocated intervention. The denominator for each outcome in each trial was the number randomised minus any participants whose outcomes were known to be missing.
Assessment of heterogeneity
We assessed statistical heterogeneity in each meta‐analysis using the Tau², I² and Chi² statistics and used a random‐effects model throughout to account for heterogeneity resulting from the relatively small number of participants in each study (less than 200 participants).
Assessment of reporting biases
If there were 10 or more studies in the meta‐analysis, we investigated reporting biases (such as publication bias) using funnel plots. We assessed funnel plot asymmetry visually. If a visual assessment suggested asymmetry, we discussed possible reasons for this. We only performed this analysis for the primary outcome.
Data synthesis
We carried out statistical analysis using RevMan 2014. We planned to use fixed‐effect meta‐analysis for combining data where it was reasonable to assume that studies were estimating the same underlying treatment effect, that is, where trials examined the same intervention and used sufficiently similar trial populations and methods. However, due to the small number of participants in trials contributing data, we used a random‐effects model throughout this review. We treated the random‐effects summary as the average range of possible treatment effects, and we discussed the clinical implications of treatment effects differing between trials. If the average treatment effect was not clinically meaningful, we did not combine trials.
For the random‐effects analyses, we presented the results as the average treatment effect with its 95% CI along with the estimates of Tau² and I².
Subgroup analysis and investigation of heterogeneity
In exploring heterogeneity when a comparison with three or more trials had an I² of more than 40%, we originally planned to investigate this using subgroup analyses and sensitivity analyses. Due to the small number of participants in each trial, we opted to use random‐effects analysis.
We carried out the following subgroup analyses where possible.
-
Doses or volume of the intervention given.
-
Fluid preloading or coloading in addition to the intervention.
We used the outcome of maternal hypotension requiring intervention in subgroup analysis.
We assessed subgroup differences by interaction tests available within RevMan 2014. We reported the results of subgroup analyses, quoting the Chi² statistic and P value, plus the interaction test I² value. We did not perform subgroup analysis where we thought the different regimens or types of the interventions meant that subgroup analysis would not be appropriate or helpful (Analysis 7.1; Analysis 8.1; Analysis 12.1; Analysis 24.1; Analysis 37.1). Instead, we explored the different regimens in separate comparisons.
Sensitivity analysis
We performed sensitivity analyses by removing studies in which one or more factors indicated a higher risk of bias than in the rest of studies. We assessed only 2 trials as being at high risk of bias in two or more domains (Calvache 2011; Sutherland 2001), while another 15 were at high risk of bias in one domain (Bhagwanjee 1990; Bottiger 2010; Cardoso 2004a; Carvalho 2009; Cyna 2010; Dahlgren 2005; Dyer 2004; Eldaba 2015; Gulhas 2012; Magalhaes 2009; Mercier 2014; Muzlifah 2009; Pouliou 2006; Romdhani 2014; Ueyama 1999).
Summary of findings tables
For this update, we assessed the quality of the body of evidence using the GRADE approach, as outlined in the GRADE handbook and in relation to the following outcomes for the main comparisons. We chose six key comparisons for a specific focus, as they represent the most clinically relevant comparisons in this updated review.
Comparisons
-
Crystalloid versus control
-
Colloid versus crystalloid
-
Ephedrine versus phenylephrine
-
Ondansetron versus control
-
Lower limb compression versus control
-
Walking versus lying
Outcomes
-
Incidence of maternal hypotension requiring intervention
-
Incidence of maternal hypertension requiring intervention
-
Incidence of maternal bradycardia
-
Incidence of maternal nausea and/or vomiting
-
Neonatal acidosis as defined by cord or neonatal bloods with a pH of less than 7.2
-
Neonatal Apgar score of less than 8 at five minutes
-
Admission to neonatal intensive care unit
We also prepared a 'Summary of findings' table for the primary outcome (women with hypotension requiring intervention) for all of the six key comparisons for illustrative purposes.
We used the GRADEpro Guideline Development Tool to import data from RevMan 2014 in order to create 'Summary of findings' tables, creating a summary of the intervention effect and a measure of quality for each of the above outcomes. The GRADE approach uses five considerations (study limitations, consistency of effect, imprecision, indirectness and publication bias) to assess the quality of the body of evidence for each outcome. We downgraded the evidence from 'high quality' by one level for serious (or by two levels for very serious) limitations, depending on assessments for risk of bias, indirectness of evidence, serious inconsistency, imprecision of effect estimates or potential publication bias.
Results
Description of studies
For details of included and excluded studies, see Characteristics of included studies and Characteristics of excluded studies tables. Studies took place in Europe, North America, India, and the Middle East.
Results of the search
We assessed 380 studies in total. Our review includes 126 studies involving 9565 women. We excluded 228 studies; 13 of these were included in Cyna 2006, but we excluded them from this updated version due to a change in the inclusion criteria (see below for reasons). There are 25 studies awaiting further classification and 1 ongoing study.
Included studies
Interventions
We grouped the 126 included trials into three main categories of interventions.
Administration of fluids
-
Crystalloid versus control (Idehen 2014; Imam 2012; King 1998; Morgan 2000; Ouerghi 2010)
-
Different regimens of crystalloids (Alimian 2014; Dyer 2004; Farid 2016; Faydaci 2011; Jacob 2012; Jorgensen 2000; Khan 2013; Muzlifah 2009; Oh 2014; Rout 1992; Tercanli 2005; Wilson 1999)
-
Colloids versus crystalloids (Alimian 2014; Arora 2015; Bottiger 2010; Bouchnak 2012; Cardoso 2004a; Dahlgren 2005; Dahlgren 2007; El‐Mekawy 2012; Embu 2011; French 1999; Gunaydin 2009; Hasan 2012; Jabalameli 2011; Karinen 1995; Lin 1999; Madi‐Jebara 2008; Mercier 2014; Mitra 2014; Ozkan 2004; Perumal 2004; Romdhani 2014; Selvan 2004; Siddik 2000; Singh 2009; Ueyama 1999; Unlugenc 2015; Upadya 2016; Yorozu 2002)
-
Different regimens of colloids (Arora 2015; Carvalho 2009; Davies 2006; Nishikawa 2007; Selvan 2004; Siddik‐Sayyid 2009; Ueyama 1999)
-
Colloid versus control (Hasan 2012; Mathru 1980; Nishikawa 2007; Riley 1995; Tawfik 2014)
-
Colloid plus crystalloid versus another colloid or crystalloid (Marciniak 2015; Mathru 1980)
Drugs
-
Ephedrine versus control (Carvalho 1999a; Carvalho 1999b; Carvalho 2000; Damevski 2011; Gomaa 2003; Grubb 2004; Hall 1994; Imam 2012; King 1998; Loughrey 2002; Mathru 1980; Morgan 2000; Moslemi 2015; Ngan Kee 2000; Olsen 1994; Ozkan 2004; Ramin 1994; Singh 2016; Torres unpub; Tsen 2000; Turkoz 2002; Ueyama 1992; Webb 1998)
-
Ephedrine versus crystalloids (Carvalho 2000; Chan 1997; Damevski 2011; El‐Mekawy 2012; Imam 2012; Jabalameli 2011; King 1998; Kundra 2008; Morgan 2000)
-
Ephedrine plus crystalloid versus colloid (Ozkan 2004)
-
Ephedrine plus colloid versus crystalloid (Ozkan 2004)
-
Ephedrine versus phenylephrine (Alahuhta 1992; Bhardwaj 2013; Gomaa 2003; Hall 1994; Magalhaes 2009; Moslemi 2015; Nazir 2012; Ueyama 2002)
-
Ephedrine versus angiotensin (Ramin 1994)
-
Different regimens of ephedrine (Carvalho 1999a; Carvalho 1999b; Carvalho 2000; Chohedri 2007; Hall 1994; King 1998; Loughrey 2002; Morgan 2000; Ngan Kee 2000; Ozkan 2004; Pouliou 2006)
-
Ephedrine versus colloid (El‐Mekawy 2012; Jabalameli 2011)
-
Ephedrine versus metaraminol (Bhardwaj 2013)
-
Phenylephrine versus control (Gomaa 2003; Kuhn 2016; Loughrey 2005; Moslemi 2015; Ngan Kee 2004a)
-
Different regimens of phenylephrine (Doherty 2012)
-
Phenylephrine versus mephentermine (Mohta 2010)
-
Phenylephrine versus metaraminol (Bhardwaj 2013)
-
Phenylephrine plus crystalloid different regimens (Ansari 2011)
-
Phenyleprine versus leg compression (Kuhn 2016)
-
Glycopyrrolate versus control (Ngan Kee 2013a; Ure 1999)
-
Ondansetron versus control (Marciniak 2015; Nivatpumin 2016; Ortiz‐Gomez 2014; Sahoo 2012; Terkawi 2015; Trabelsi 2015; Wang 2014a; Wang 2014b)
-
Ondansetron versus ephedrine (Nivatpumin 2016)
-
Granisetron versus control (Eldaba 2015)
-
Ketamine versus saline (Gulhas 2012)
-
Angiotension versus control (Ramin 1994)
-
Dopamine versus control (Yokoyama 1997)
Physical methods
-
Lower limb compression versus control (Adsumelli 2003; Bhagwanjee 1990; James 1973; Jorgensen 1996; Kohli 2013; Kuhn 2016; Rout 1993a; Singh 2014; Sood 1996; Sujata 2012; Sutherland 2001)
-
Wedge versus supine (Calvache 2011)
-
Head‐up tilt versus horizontal (Loke 2002)
-
Head‐down tilt versus horizontal (Miyabe 1997)
-
Crawford's wedge versus manual uterine displacement (Amaro 1998)
-
Supine versus sitting (Kohler 2002)
-
Walking versus lying (Cyna 2010)
-
Lateral versus supine wedged position (Hartley 2001; Hwang 2012)
-
Left lateral versus left lateral tilt (Rees 2002)
-
Left lateral tilt versus left manual uterine displacement (Kundra 2007)
-
Leg elevation versus control (Rout 1993a)
-
Acupressure versus placebo (Stein 1997)
-
Acupressure versus metoclopramide (Stein 1997)
Furthermore, we chose to focus on six key comparisons (crystalloid versus control, colloid versus crystalloid, ephedrine versus phenylephrine, ondansetron versus control, lower limb compression versus control, walking versus lying) in the summary of findings Table for the main comparison, as we felt these represented the most important clinical comparisons.
Methods and techniques
Although definitions of hypotension in the included studies varied, most fell within the generally accepted range. Table 1 presents details (where trials did not specify systolic or mean arterial pressure, we assumed the definition to be systolic).
Participants
All but one of the included trials assessed women having (or probably having) elective caesarean sections. In Ueyama 1992, 40 women in labour were scheduled for emergency caesareans and 60 women not in labour were scheduled for elective caesareans.
Reviewed interventions were not necessarily applied prior to spinal injection. Clinicians administered pharmacological interventions prior or immediately after spinal injection, before onset of hypotension.
Excluded studies
Please see Characteristics of excluded studies.
We excluded 228 studies for the following reasons.
-
Women received combined spinal epidural anaesthesia.
-
Women received epidural anaesthesia.
-
Trials did not report incidence of hypotension requiring intervention.
-
Researchers did not investigate prevention of hypotension due to spinal anaesthesia (including studies investigating treatment of hypotension or prevention of oxytocin‐induced hypotension)
-
Authors reporting of data was inadequate for analysis (for example, the number of women in each study group).
-
Anaesthetic regimen differed between study groups.
-
Not a prospective randomised study.
-
Quasi‐randomised study.
-
Unclear definition of hypotension.
-
Study compared prevention of hypotension to treatment of hypotension.
We excluded 13 studies from the original 2006 review for the following reasons (Cyna 2006).
-
Combined spinal‐epidural (Mendonca 2003; Rucklidge 2002; Rucklidge 2005; Russell 2002; Vercauteren 2000; Yun 1998; Yentis 2000).
-
Number of women allocated to each study group not reported (Miller 2000).
-
Incidence of hypotension not reported (Van Bogaert 1998).
-
Quasi‐randomised (Rout 1993b).
-
Intervention was to treat, not prevent, hypotension (Cooper 2007; Yadav 2012; Young 1996).
Risk of bias in included studies
Please see Figure 1 and Figure 2 for a summary of 'Risk of bias' assessments.

Risk of bias graph: review authors' judgements about each risk of bias item presented as percentages across all included studies.

Risk of bias summary: review authors' judgements about each risk of bias item for each included study.
Allocation
Fifty‐two studies reported adequate randomisation sequence generation, so we considered them to be at low risk of selection bias (Alimian 2014; Allen 2010; Arora 2015; Bhardwaj 2013; Bottiger 2010; Calvache 2011; Cardoso 2004a; Carvalho 2009; Cyna 2010; Dahlgren 2007; Das Neves 2010; Doherty 2012; Eldaba 2015; Faydaci 2011; Gulhas 2012; Gunusen 2010; Hwang 2012; Idehen 2014; Jabalameli 2011; Jacob 2012; Jorgensen 1996; Jorgensen 2000; Kohler 2002; Kuhn 2016; Kundra 2007; Loughrey 2002; Magalhaes 2009; Marciniak 2015; Mercier 2014; Mitra 2014; Moslemi 2015; Muzlifah 2009; Ngan Kee 2004a; Ngan Kee 2013a; Nishikawa 2007; Nivatpumin 2016; Oh 2014; Ortiz‐Gomez 2014; Rees 2002; Romdhani 2014; Sahoo 2012; Siddik‐Sayyid 2009; Singh 2016; Tawfik 2014; Terkawi 2015; Torres unpub; Trabelsi 2015; Ueyama 1999; Unlugenc 2015; Wang 2014a; Wang 2014b; Wilson 1999). The remaining 74 studies reported that the study was randomised; however, authors did not report the method of random sequence generation.
Only 22 studies contained a description of adequate allocation concealment (Bhardwaj 2013; Cyna 2010; Faydaci 2011; French 1999; Hasan 2012; Hwang 2012; King 1998; Kohler 2002; Kuhn 2016; Loughrey 2002; Magalhaes 2009; Marciniak 2015; Ngan Kee 2000; Ngan Kee 2004a; Ngan Kee 2013a; Nivatpumin 2016; Ortiz‐Gomez 2014; Tawfik 2014; Tercanli 2005; Trabelsi 2015; Unlugenc 2015; Wang 2014b), mostly of opaque, sealed envelopes. One hundred and three studies did not report whether allocation was concealed or not, while one study did not conceal allocation at all (Ueyama 1999).
The Characteristics of included studies table includes details of the randomisation and allocation concealment processes.
Blinding
Participants and anaesthetists were blinded in 54 studies (Adsumelli 2003; Alahuhta 1992; Allen 2010; Ansari 2011; Bhardwaj 2013; Dahlgren 2005; Dahlgren 2007; Davies 2006; Doherty 2012; Eldaba 2015; El‐Mekawy 2012; Embu 2011; French 1999; Gomaa 2003; Gulhas 2012; Gunaydin 2009; Hall 1994; Hasan 2012; Hwang 2012; Idehen 2014; Inglis 1995; Karinen 1995; Khan 2013; King 1998; Kuhn 2016; Loughrey 2002; Loughrey 2005; Marciniak 2015; Mercier 2014; Mitra 2014; Moslemi 2015; Nazir 2012; Ngan Kee 2004a; Ngan Kee 2013a; Nishikawa 2007; Nivatpumin 2016; Oh 2014; Ortiz‐Gomez 2014; Ouerghi 2010; Riley 1995; Siddik 2000; Siddik‐Sayyid 2009; Singh 2014; Singh 2016; Sujata 2012; Tawfik 2014; Terkawi 2015; Trabelsi 2015; Unlugenc 2015; Ure 1999; Wang 2014a; Wang 2014b; Wilson 1998; Wilson 1999). In the remaining studies, blinding was either not performed (8 studies) or not reported (64 studies). We assessed the eight studies in which it was clear that the participants and anaesthetists were not blinded as being at high risk of bias (Bhagwanjee 1990; Calvache 2011; Carvalho 2009; Cyna 2010; Dyer 2004; Pouliou 2006; Romdhani 2014; Sutherland 2001).
The outcome assessors were blinded in 43 studies (Ansari 2011; Bhardwaj 2013; Dahlgren 2007; Das Neves 2010; Davies 2006; Doherty 2012; Eldaba 2015; El‐Mekawy 2012; Embu 2011; French 1999; Gomaa 2003; Gulhas 2012; Gunaydin 2009; Hall 1994; Hasan 2012; Hwang 2012; Idehen 2014; Khan 2013; Kohler 2002; Kuhn 2016; Loke 2002; Loughrey 2005; Marciniak 2015; Mercier 2014; Mitra 2014; Moslemi 2015; Nazir 2012; Ngan Kee 2013a; Nivatpumin 2016; Oh 2014; Ortiz‐Gomez 2014; Ouerghi 2010; Sahoo 2012; Siddik‐Sayyid 2009; Singh 2014; Singh 2016; Sujata 2012; Tawfik 2014; Terkawi 2015; Trabelsi 2015; Unlugenc 2015; Wang 2014a; Wang 2014b), and they were not blinded in 2 (Magalhaes 2009; Sutherland 2001). The remaining 81 studies did not report blinding of the outcome assessor.
Incomplete outcome data
There were no or only unlikely losses to follow‐up in 70 studies. In 52 studies there was some evidence of incomplete data and small losses to follow‐up, or insufficient information reported to assess this domain adequately (Adsumelli 2003; Alimian 2014; Allen 2010; Amaro 1998; Ansari 2011; Bhagwanjee 1990; Carvalho 1999a; Carvalho 1999b; Davies 2006; Farid 2016; Faydaci 2011; Grubb 2004; Gunusen 2010; Hall 1994; Imam 2012; Inglis 1995; Jacob 2012; James 1973; Jorgensen 1996; Jorgensen 2000; King 1998; Kohli 2013; Lin 1999; Loo 2002; Loughrey 2005; Marciniak 2013; Mathru 1980; Miyabe 1997; Morgan 2000; Ngan Kee 2000; Olsen 1994; Ozkan 2004; Pouliou 2006; Pouta 1996; Riley 1995; Romdhani 2014; Rout 1992; Rout 1993a; Selvan 2004; Siddik 2000; Singh 2009; Sood 1996; Stein 1997; Turkoz 2002; Ueyama 1992; Ueyama 1999; Webb 1998; Wilson 1998; Wilson 1999; Yokoyama 1997; Yorozu 2002). We assessed these studies as being at unclear risk of attrition bias. We considered the remaining four studies to be at high risk of bias due to losses to follow‐up (Bottiger 2010 reported the exclusion of 3 women for unspecified reasons at an unclear point along the study pathway; Eldaba 2015 reported 5/200 exclusions due to failed blocks; Gulhas 2012 excluded 3/105 patients due to failed blocks; Sutherland 2001 reported 46/100 protocol violations).
The Characteristics of included studies table provides reasons for losses to follow‐up.
Selective reporting
Selective reporting was not present in 71 studies (Adsumelli 2003; Alimian 2014; Allen 2010; Amaro 1998; Ansari 2011; Arora 2015; Bhagwanjee 1990; Bhardwaj 2013; Bottiger 2010; Dahlgren 2007; Das Neves 2010; Dyer 2004; Eldaba 2015; El‐Mekawy 2012; Embu 2011; Farid 2016; Faydaci 2011; French 1999; Gomaa 2003; Grubb 2004; Gulhas 2012; Gunaydin 2009; Gunusen 2010; Hall 1994; Hartley 2001; Hasan 2012; Hwang 2012; Idehen 2014; Imam 2012; Inglis 1995; Jabalameli 2011; Jorgensen 2000; Khan 2013; King 1998; Kohler 2002; Kuhn 2016; Loke 2002; Loughrey 2002; Loughrey 2005; Magalhaes 2009; Marciniak 2015; Mercier 2014; Mitra 2014; Mohta 2010; Moslemi 2015; Nazir 2012; Ngan Kee 2000; Ngan Kee 2004a; Ngan Kee 2013a; Nishikawa 2007; Nivatpumin 2016; Oh 2014; Ortiz‐Gomez 2014; Romdhani 2014; Sahoo 2012; Singh 2014; Singh 2016; Stein 1997; Sujata 2012; Tawfik 2014; Tercanli 2005; Terkawi 2015; Torres unpub; Trabelsi 2015; Tsen 2000; Ueyama 2002; Unlugenc 2015; Upadya 2016; Ure 1999; Wang 2014a; Wang 2014b). It was not clear in a further 51 studies whether selective reporting was present, with the remaining four studies demonstrating evidence of selective reporting (Calvache 2011; Cardoso 2004a; Dahlgren 2005; Muzlifah 2009).
Other potential sources of bias
We found no other potential sources of bias in 84 studies. It was unclear in a further 37 studies whether there was potential source of bias (Ansari 2011; Carvalho 1999a; Carvalho 1999b; Carvalho 2000; Das Neves 2010; Jacob 2012; James 1973; Jorgensen 1996; Kohli 2013; Lin 1999; Magalhaes 2009; Miyabe 1997; Morgan 2000; Nishikawa 2007; Olsen 1994; Ouerghi 2010;; Perumal 2004; Pouliou 2006; Pouta 1996; Ramin 1994; Rees 2002; Riley 1995; Rout 1992; Rout 1993a; Selvan 2004; Siddik 2000; Singh 2009; Singh 2016; Sood 1996; Sutherland 2001; Turkoz 2002; Ueyama 1992; Ueyama 1999; Webb 1998; Wilson 1999; Yokoyama 1997; Yorozu 2002). There was a potential source of bias with respect to funding source in one study: Mercier 2014 performed a study comparing colloid (HES) preload to crystalloid (Ringer's lactate) preload, which was fully funded by Fresenius Kabi, the company that produces HES. We assessed this study as being at high risk of other bias. Some evidence of asymmetry is apparent in two of the three funnel plots (Figure 3, Figure 4 and Figure 5), which suggests possible publication bias due to the number of small studies.

Funnel plot of comparison: 7 Colloid vs crystalloid, outcome: 7.1 Women with hypotension requiring intervention.

Funnel plot of comparison: 13 Ephedrine vs control, outcome: 13.1 Women with hypotension requiring intervention.

Funnel plot of comparison: 47 Lower limb compression vs control, outcome: 47.1 Women with hypotension requiring intervention.
There were 2 studies assessed as high risk as study participants received variable doses of local anaesthetic in their spinal block (Alahuhta 1992; Mathru 1980). Also, there were 2 studies assessed as high risk of bias as it was unclear whether the spinal anaesthetic technique and dose was standardised between the study groups (Ozkan 2004; Wilson 1998). It was unlikely that with randomisation this source of bias would have an important effect on the review findings.
Effects of interventions
See: Summary of findings for the main comparison Techniques for preventing hypotension during spinal anaesthesia for caesarean section: key interventions for the primary outcome (women with hypotension requiring intervention); Summary of findings 2 Crystalloid versus control; Summary of findings 3 Colloid versus crystalloid; Summary of findings 4 Ephedrine versus phenylephrine; Summary of findings 5 Ondansetron versus control; Summary of findings 6 Lower limb compression versus control; Summary of findings 7 Walking versus lying
We included 126 studies, involving 9565 women and assessing 49 comparisons of different methods to prevent hypotension following spinal anaesthesia at caesarean.
As noted above, we grouped the comparisons into three main categories of interventions: fluids (data and analyses 1 to 11), drugs (data and analyses 12 to 36), and physical methods (data and analyses 37 to 49). Comparisons 1, 7, 16, 31, 37, and 43 constitute our key review comparisons; see summary of findings Table for the main comparison for a summary of the findings of each for our main review outcome: maternal hypotension requiring pharmacological intervention.
Fluids
This group of interventions comprises comparisons corresponding to data analyses 1 to 11. The section first presents comparisons with crystalloids, including crystalloid versus control (comparison 1; see summary of findings Table 2), different regimens of crystalloids, and different types of crystalloids. Comparison 7 assesses colloid versus crystalloid directly (see summary of findings Table 3), while the remaining comparisons focus on colloids alone (versus control: different regimens of colloids: and different types of colloids).
Crystalloids
Crystalloid versus control
See summary of findings Table 2.
Primary outcome: maternal hypotension requiring pharmacological intervention
Crystalloids appeared to be more effective than control for preventing maternal hypotension requiring intervention (average RR 0.84, 95% CI 0.72 to 0.98; 5 studies; 370 women; low‐quality evidence; Analysis 1.1).
Secondary outcomes
Maternal
-
Nausea and/or vomiting
There was insufficient evidence to determine whether there was a difference between the groups (RR 0.19, 95% CI 0.01 to 3.91; 1 study; 69 women; very low‐quality evidence; Analysis 1.2).
-
Anaphylaxis
One study reported this outcome (Idehen 2014, 69 women). There were no events in either group (Analysis 1.3).
Neonatal
-
Apgar scores of less than 7 or 8 at five minutes
One study reported this outcome (Idehen 2014, 60 babies; low‐quality evidence). There were no events in either group (Analysis 1.4).
No trials reported other secondary outcomes for this comparison.
Different regimens of crystalloids
Crystalloid: rapid infusion versus slow infusion
Primary outcome: maternal hypotension requiring pharmacological intervention
There was insufficient evidence to determine whether there was a difference between the groups (RR 0.86, 95% CI 0.45 to 1.64; 1 study, 20 women; Analysis 2.1).
Secondary outcomes
No trials reported secondary outcomes for this comparison.
Crystalloid: high versus low preload volume
Primary outcome: maternal hypotension requiring pharmacological intervention
There was no conclusive evidence of a difference between the groups in rates of hypotension when comparing high volume preload (15 mL/kg to 20 mL/kg) to lower volume preload (10 mL/kg or less) (average RR 0.55, 95% CI 0.29 to 1.02; I² = 57%, 3 studies, 192 women; Analysis 3.1). There was considerable heterogeneity in the 20 mL subgroup (I² = 85%) but no evidence of subgroup differences (test for subgroup differences: Chi² = 0.01, df = 1 (P = 0.92), I² = 0%).
Secondary outcomes
Maternal
-
Nausea and/or vomiting
There was insufficient evidence to determine whether there was a difference between the groups (RR 1.20, 95% CI 0.40 to 3.62, one study, 80 women; Analysis 3.2).
Neonatal
-
Apgar scores of less than 7 or 8 at five minutes
One study reported this outcome (Faydaci 2011, 90 babies). There were no events in either group (Analysis 3.3).
No trials reported other secondary outcomes for this comparison.
Sensitivity analysis
Removing Muzlifah 2009 from Analysis 3.1 resulted in fewer women in the high volume preloading group experiencing hypotension than in the low volume group (average RR 0.43, 95% CI 0.23 to 0.78); data not shown.
Crystalloid: rapid coload versus preload
Primary outcome: maternal hypotension requiring pharmacological intervention
A rapid crystalloid coload was associated with a lower incidence of hypotension than a preload (average RR 0.70, 95% CI 0.59 to 0.83, 5 studies, 384 women; Analysis 4.1).
Secondary outcomes
Maternal
-
Hypertension requiring intervention
There was insufficient evidence to determine whether there was a difference between the groups (RR 1.67, 95% CI 0.42 to 6.60, 1 study, 100 women; Analysis 4.2).
-
Cardiac dysrhythmia
There was insufficient evidence to determine whether there was a difference between the groups in rates of bradycardia (RR 1.43, 95% CI 0.59 to 3.45, 1 study, 100 women; Analysis 4.3).
-
Nausea and/or vomiting
Rapid coload was associated with a higher risk of nausea than preload (average RR 1.98, 95% CI 1.26 to 3.12, 3 studies, 201 women; Analysis 4.4).
There was insufficient evidence to determine conclusively whether there was a difference between the groups in rates of vomiting (average RR 2.33, 95% CI 0.98 to 5.58, 2 studies, 160 women).
Neonatal
-
Acidosis
Two studies reported this outcome (Dyer 2004; Oh 2014, 110 babies). There were no events in either group (Analysis 4.5).
-
Apgar scores of less than 7 or 8 at five minutes
Three studies reported this outcome (Dyer 2004; Jacob 2012; Oh 2014, 210 babies). There were no events in either group (Analysis 4.6).
No trials reported other secondary outcomes for this comparison.
Sensitivity analysis
Removing Dyer 2004 from the analysis did not impact the results.
Crystalloid: warm versus cold saline
Primary outcome: maternal hypotension requiring pharmacological intervention
There was insufficient evidence to determine whether there was a difference between the groups (RR 1.03, 95% CI 0.65 to 1.62, one study,113 women; Analysis 5.1).
Secondary outcomes
-
Nausea and/or vomiting
There was insufficient evidence to determine whether warm or cold saline had an effect on nausea (RR 1.64, 95% CI 0.97 to 2.76, one study, 113 women) or vomiting (RR 2.95, 95% CI 0.12 to 70.87, one study, 113 women); see Analysis 5.2.
No trials reported other secondary outcomes for this comparison.
Different types of crystalloids
Dextrose plus saline versus saline alone
Primary outcome: maternal hypotension requiring pharmacological intervention
There was no clear evidence of a difference between the interventions (RR 0.88, 95% CI 0.68 to 1.14, 1 study, 120 women; Analysis 6.1.1).
Secondary outcomes
Neonatal
-
Acidosis
There was insufficient evidence to determine whether there was a difference between the groups (RR 1.20, 95% CI 0.39 to 3.72, 1 study, 120 babies; Analysis 6.3).
-
Apgar scores of less than 7 at five minutes
One study reported this outcome (Wilson 1999, 120 babies). There were no events in either group (Analysis 6.4).
No trials reported other secondary outcomes for this comparison.
Glucose versus saline
Primary outcome: maternal hypotension requiring pharmacological intervention
There was no clear evidence of a difference between the interventions (RR 1.05, 95% CI 0.74 to 1.48, 1 study, 70 women; Analysis 6.1.2).
Secondary outcomes
No studies reported secondary outcomes for this comparison.
Ringers lactate versus saline
Primary outcome: maternal hypotension requiring pharmacological intervention
There was insufficient evidence to determine whether there was a difference between the groups (RR 1.17, 95% CI 0.65 to 2.09, 1 study, 60 women; Analysis 6.1.3).
Secondary outcomes
Neonatal
-
Acidosis
One study reported this outcome (Alimian 2014, 60 babies). There were no events in either group (Analysis 6.2).
-
Apgar scores of less than 8 at five minutes
One study reported this outcome (Alimian 2014, 60 babies). There were no events in either group (Analysis 6.5).
No trials reported other secondary outcomes for this comparison.
Colloids versus crystalloids
See summary of findings Table 3.
Primary outcome: maternal hypotension requiring pharmacological intervention
The incidence of hypotension was lower with colloids compared to crystalloids (average RR 0.68, 95% CI 0.58 to 0.80; 28 studies, 2105 women; very low‐quality evidence; Analysis 7.1). Substantial heterogeneity (I² = 85%, Tau² = 0.16) was likely due to differences in formulation and volume of fluid administered between studies. However, due to the variation in regimens between studies, it was not possible to conduct formal subgroup analyses. There was some evidence of asymmetry on funnel plot (Figure 3), which could be due to the large number of small studies contributing to this analysis.
Secondary outcomes
Maternal
-
Hypertension requiring intervention
There was insufficient evidence to determine whether there was a difference between the groups (average RR 0.64, 95% CI 0.09 to 4.46, 3 studies, 327 women;very low‐quality evidence; Analysis 7.2).
-
Cardiac dysrhythmia
There was no clear evidence of a difference in the groups in rates of tachycardia (RR 1.10, 95% CI 0.79, 1.53, 1 study, 60 women) or bradycardia (RR 0.99, 95% CI 0.55 to 1.79, 6 studies, 509 women; very low‐quality evidence); see Analysis 7.3.
-
Nausea and/or vomiting
There was no clear evidence of a difference in the groups for rates of nausea or vomiting (average RR 0.83, 95% CI 0.61 to 1.13, 15 studies, 1154 women, I² = 37%; very low‐quality evidence), nausea alone (average RR 1.10, 95% CI 0.77 to 1.58, 5 studies, 390 women, I² = 10%), vomiting alone (average RR 1.35, 95% CI 0.55 to 3.27, 4 studies, 320 women, I² = 33%); see Analysis 7.4.
Neonatal
-
Acidosis
There was insufficient evidence to determine whether there was a difference between the groups (average RR 0.83, 95% CI 0.15 to 4.52, 6 studies, 678 babies, I² = 24%; very low‐quality evidence; Analysis 7.5).
-
Apgar scores of less than 7 or 8 at five minutes
There was insufficient evidence to determine whether there was a difference between the groups in the rates of Apgar scores of less than 7 (average RR 0.16, 95% CI 0.01 to 2.90, 2 studies ,127 babies) or of less than 8 (average RR 0.24, 95% CI 0.03 to 2.05, 11 studies, 826 babies; very low‐quality evidence) at five minutes; see Analysis 7.6.
No trials reported other secondary outcomes for this comparison.
Sensitivity analysis
Removing studies for at high risk of bias in one or more domain made little difference to the results of any analysis under this comparison (Bottiger 2010; Cardoso 2004a; Dahlgren 2005; Mercier 2014; Romdhani 2014; Ueyama 1999).
Colloids versus control
Primary outcome: maternal hypotension requiring pharmacological intervention
There was a reduced incidence of hypotension in the colloid group (average RR 0.40, 95% CI 0.16 to 0.96, 5 studies, 426 women; Analysis 8.1). There was substantial heterogeneity (I² = 85%, Tau² = 0.71), likely due to differences in formulation and volume of fluid administered. In addition, Tawfik 2014 reported higher event rates than other studies.
Secondary outcomes
Maternal
-
Cardiac dysrhythmia
There was insufficient evidence to determine whether there was a difference between the groups (RR 7.70, 95% CI 0.46 to 127.78; 54 women; 1 study; Analysis 8.2).
-
Nausea and/or vomiting
There was insufficient evidence to determine whether there was a difference between the groups (average RR 1.65, 95% CI 0.75 to 3.64, 2 studies, 245 women; Analysis 8.3).
Neonatal
-
Acidosis
There was insufficient evidence to determine whether there was a difference between the groups (RR 1.24, 95% CI 0.34 to 4.48, 1 study, 205 babies; Analysis 8.4).
-
Apgar scores of less than 7 or 8 at five minutes
There was insufficient evidence to determine whether there was a difference between the groups in Apgar scores of less than 7 at five minutes (average RR 0.07, 95% CI 0.00 to 1.24, 4 studies, 205 babies; Analysis 8.5). Three of the four studies in this analysis reported no events in either arm. One study reported Apgar score of less than 8 at five minutes (Tawfik 2014, 205 women), and there were no events in either arm (Analysis 8.6).
No trials reported other secondary outcomes for this comparison.
Different regimens of colloids
Colloids: high versus low volume
Primary outcome: maternal hypotension requiring pharmacological intervention
In three studies, there was no difference in the incidence of hypotension when comparing high volume versus low volume colloids (average RR 0.75, 95% CI 0.27 to 2.08; 134 women; Analysis 9.1). Substantial heterogeneity (I² = 78, Tau² = 0.63) was present. None of the studies contributing to the analysis were good quality, and all were at unclear or high risk of selection bias, which may have impacted results (Davies 2006; Selvan 2004; Ueyama 1999).
Secondary outcomes
Neonatal
-
Apgar of less than 9 at five minutes (non‐prespecified outcome)
One study reported this outcome (Davies 2006, 70 babies). There were no events in either arm (Analysis 9.2).
No trials reported other secondary outcomes for this comparison.
Colloid: preload versus coload
Note: the comparison for crystalloid is coload versus preload.
Primary outcome: maternal hypotension requiring pharmacological intervention
There was no clear evidence of a difference between the groups (average RR 0.93, 95% CI 0.78 to 1.10, 4 studies, 320 women; Analysis 10.1).
Secondary outcomes
Maternal
-
Cardiac dysrhythmia
There was insufficient evidence to determine whether there was a difference between the groups in rates of bradycardia (average RR 0.75, 95% CI 0.20 to 2.88, 2 studies, 82 women; Analysis 10.2. One study had no events). One study reported tachycardia (Carvalho 2009, 46 women); there were no events in either arm (Analysis 10.2).
-
Nausea and/or vomiting
There was insufficient evidence to determine whether there was a difference between the groups in rates of nausea or vomiting (RR 0.92, 95% CI 0.63 to 1.35, 1 study, 178 women), rates of nausea alone (RR 1.00, 95% CI 0.15 to 6.51, 1 study, 46 women). One study reported rates of vomiting alone (Carvalho 2009, 46 women); there were no events in either arm (Analysis 10.3).
-
Anaphylaxis
One study reported this outcome (Siddik‐Sayyid 2009, 178 women). There were no events in either group (Analysis 10.4).
Neonatal
-
Apgar scores of less than 7 or 8 at five minutes
One study reported this outcome (Nishikawa 2007, 36 babies): there were no events in either arm (Analysis 10.5).
No trials reported other secondary outcomes for this comparison.
Sensitivity analysis
Removing Carvalho 2009 made very little difference to Analysis 10.1 and Analysis 10.2.
Different types of colloids
Two studies compared colloid + crystalloid versus another colloid or dextrose + crystalloid (Marciniak 2015; Mathru 1980)
Albumen and dextrose plus crystalloid versus dextrose plus crystalloid
Primary outcome: maternal hypotension requiring pharmacological intervention
One study compared colloid plus crystalloid versus another colloid or dextrose plus crystalloid (Mathru 1980).There was insufficient evidence to determine whether there was a difference between the groups (RR 0.13, 95% CI 0.01 to 2.30, 1 study, 45 women; Analysis 11.1.1).
Secondary outcomes
Neonatal
-
Apgar scores of less than 7 at five minutes
There was insufficient evidence to determine whether there was a difference between the groups for Apgar scores of less than 7 (RR 0.13, 95% CI 0.01 to 2.30, 1 study, 45 babies; Analysis 11.2).
No trials reported other secondary outcomes for this comparison.
Unbalanced versus balanced hydroxyethyl starch
Primary outcome: maternal hypotension requiring pharmacological intervention
One study compared unbalanced versus balanced hydroxyethyl starch (Marciniak 2015). There was no clear evidence of a difference between the groups (RR 1.04, 95% CI 0.78 to 1.39, 1 study, 51 women; Analysis 11.1.2).
Secondary outcomes
Neonatal
-
Apgar scores of less than 8 at five minutes
Marciniak 2013 (51 women) reported this outcome. There were no events in either arm (Analysis 11.3).
No trials reported other secondary outcomes for this comparison.
Summary: fluids
In preventing hypotension following spinal anaesthesia at caesarean section, we found the following.
-
Crystalloids may be more effective than control.
-
Rapid crystalloid coload is more effective than crystalloid preload.
-
Colloids are more effective than crystalloids.
-
For colloids, there is no clear difference with high versus low volumes or with preloading versus coloading.
Drugs
This group of interventions comprises comparisons corresponding to data analyses 12 to 36. The section begins by reporting comparisons involving ephedrine, including ephedrine versus control, ephedrine versus other drugs; see summary of findings Table 4 for comparison 'ephedrine versus phenylephrine'), different regimens of ephedrine, and different ephedrine regimens plus crystalloid or colloid. Other comparisons assess phenylephrine versus control, other drugs, different regimens of phenylephrine, and phenylephrine combined with crystalloid. Finally, we assess other drugs: glycopyrrolate, ondansetron; see summary of findings Table 5 for 'ondansetron versus control'), granisetron, ketamine, angiotensin, and dopamine.
Ephedrine
Ephedrine versus control
Primary outcome: maternal hypotension requiring pharmacological intervention
There was a lower incidence of hypotension in the ephedrine prophylaxis groups than in controls (average RR 0.65, 95% CI 0.53 to 0.80; 22 studies, 1401 women; Analysis 12.1). Substantial heterogeneity was present (I² = 75%, Tau² = 0.14), which was most likely due to differences in dosing of prophylactic ephedrine, rescue treatments for hypotension when it occurred, and administration routes for the ephedrine. Of note, most studies were unclear in reporting methods of sequence generation, allocation concealment, and blinding.
All studies examined intravenous (IV) ephedrine except for two studies where ephedrine was given intramuscularly (Gomaa 2003; Grubb 2004). Excluding these two studies from analyses reduced heterogeneity only slightly (I² = 69%, Tau² = 0.09). The asymmetrical funnel plot (Figure 4) may be due to small study effects or publication‐type bias.
Secondary outcomes
Maternal
-
Hypertension requiring intervention
There was no conclusive evidence of a difference between the groups (average RR 1.61, 95% CI 1.00 to 2.61, 7 studies, 520 women; Analysis 12.2).
-
Cardiac dysrhythmia
There was no clear evidence of a difference between the groups in rates of tachycardia (average RR 1.12, 95% CI 0.74 to 1.70, 2 studies, 93 women) and no conclusive evidence with respect to bradycardia (average RR 14.46, 95% CI 0.87, 241.09, 2 studies, 103 women, no events in one study). There were only seven events in the analysis for bradycardia, but they were all in the ephedrine group (Analysis 12.3).
-
Nausea and/or vomiting
There was no conclusive evidence of a difference between the groups for rates of nausea or vomiting (average RR 0.71, 95% CI 0.22 to 2.34, 5 studies, 219 women, I² = 62%), or rates of vomiting alone (average RR 0.68, 95% CI 0.44 to 1.07, 6 studies, 516 women, I² = 47%). Rates of nausea alone were lower in the ephedrine group (average RR 0.68, 95% CI 0.48 to 0.96, 8 studies, 620 women, I² = 25%; Analysis 12.4).
Neonatal
-
Acidosis
There was insufficient evidence to determine whether there was a difference between the groups (RR 1.29, 95% CI 0.67 to 2.49, 9 studies, 576 babies; Analysis 12.5).
-
Apgar scores of less than 7 or 8 at five minutes
There was insufficient evidence to determine whether there was a difference between the groups in Apgar scores of less than 7 at five minutes (RR 1.14, 95% CI 0.34 to 3.81, 4 studies, 263 women). Ten studies (N = 579) reported Apgar score of less than 8 at five minutes and there were no events in either arm (Analysis 12.6).
No trials reported other secondary outcomes for this comparison.
Ephedrine versus other drug regimens
Ephedrine versus crystalloid
Primary outcome: maternal hypotension requiring pharmacological intervention
Fewer women in the ephedrine group developed hypotension compared with the crystalloid group (average RR 0.60, 95% CI 0.47 to 0.78, 9 studies, 613 women; Analysis 13.1). There was moderate heterogeneity between the studies (I² = 40%), which may be related to variation in methods and dose of ephedrine between the different studies.
Secondary outcomes
Maternal
-
Hypertension requiring intervention
There was insufficient evidence to determine whether there was a difference between the groups (average RR 1.10, 95% CI 0.37 to 3.28, 3 studies, 280 women, I² = 43%; Analysis 13.2).
-
Cardiac dysrhythmia
There was insufficient evidence to determine whether there was a difference between the groups in rates of bradycardia (RR 0.33, 95% CI 0.01 to 7.99, 1 study, 100 women; Analysis 13.3).
-
Nausea and/or vomiting
There was insufficient evidence to determine whether there was a difference between the groups for rates of nausea or vomiting (average RR 1.00, 95% CI 0.48 to 2.08, 2 studies, 146 women) and no conclusive evidence of a difference for rates of vomiting alone (average RR 0.57, 95% CI 0.31 to 1.05, 3 studies, 220 women, I² = 33%). Rates of nausea alone were lower in the ephedrine group (average RR 0.54, 95% CI 0.31 to 0.93, 3 studies, 220 women); see Analysis 13.4.
-
Impaired consciousness, dizziness
There was insufficient evidence to determine whether there was a difference between the groups (RR 0.40, 95% CI 0.37 to 3.28, 1 study, 46 women; Analysis 13.5).
Neonatal
-
Acidosis
There was insufficient evidence to determine whether there was a difference between the groups (average RR 1.41, 95% CI 0.48 to 4.15, 2 studies, 218 babies). There were no events in one of the two studies (Analysis 13.6).
-
Apgar scores of less than 7 or 8 at five minutes
One study (Carvalho 2000, 100 women) reported Apgar score of less than 7 at five minutes; no events occurred in either arm. Four studies (226 women) reported Apgar scores of less than 8 at five minutes; only one event occurred, which was in the ephedrine group (average RR 3.00, 95% CI 0.13 to 71.92; Analysis 13.7).
No trials reported other secondary outcomes for this comparison.
Ephedrine plus crystalloid versus colloid
Primary outcome: maternal hypotension requiring pharmacological intervention
One study investigating this comparison found no evidence of a difference in the incidence of hypotension (RR 0.65, 95% CI 0.38 to 1.12; Analysis 14.1).
Secondary outcomes
Maternal
-
Nausea and/or vomiting
One study investigating this comparison found nausea (RR 0.42, 95% CI 0.22 to 0.81; 75 women) and vomiting (RR 0.17, 95% CI 0.04 to 0.77; 75 women) were less common in the ephedrine plus crystalloid group than in the colloid group (Analysis 14.2).
Ephedrine plus colloid versus crystalloid
Primary outcome: maternal hypotension requiring pharmacological intervention
Hypotension was less common in the ephedrine plus colloid group than in the crystalloid group (RR 0.39, 95% CI 0.21 to 0.74, 1 study, 75 women; Analysis 15.1).
Secondary outcomes
Maternal
-
Nausea and/or vomiting
Nausea was less common in the ephedrine plus colloid group than in the crystalloid group (RR 0.27, 95% CI 0.11 to 0.65, 1 study, 75 women. There was insufficient evidence to determine whether there was a difference between the groups in rates of vomiting (RR 0.38, 95% CI 0.09 to 1.55, 1 study, 75 women); see Analysis 15.2.
No trials reported other secondary outcomes for this comparison.
Ephedrine versus phenylephrine
See summary of findings Table 4.
Primary outcome: maternal hypotension requiring pharmacological intervention
There was no clear evidence of a difference between the groups (average RR 0.92, 95% CI 0.71 to 1.18, 8 studies, 401 women, I² = 37%; very low‐quality evidence; Analysis 16.1).
Secondary outcomes
Maternal
-
Hypertension requiring intervention
There was insufficient evidence to determine whether there was a difference between the groups (average RR 1.72, 95% CI 0.71 to 4.16, 2 studies, 118 women, low‐quality evidence; Analysis 16.2).
-
Cardiac dysrhythmia
Rates of bradycardia were lower in the ephedrine group (average RR 0.37, 95% CI 0.21 to 0.64, 5 studies, 304 women, low‐quality evidence). There was insufficient evidence to determine whether there was a difference between the groups in rates of tachycardia (RR 2.22, 95% CI 0.44 to 11.18, 1 study, 57 women). See Analysis 16.3.
-
Nausea and/or vomiting
There was no clear evidence of a difference between the groups (average RR 0.76, 95% CI 0.39 to 1.49, 4 studies, 204 women, I² = 37%, very low‐quality evidence; Analysis 16.4).
Neonatal
-
Acidosis
There was no clear evidence of a difference between the groups (average RR 0.89, 95% CI 0.07 to 12.00, 3 studies, 175 babies, low‐quality evidence). Only two events occurred, both in the same study (Analysis 16.5).
-
Apgar scores of less than 7 or 8 at five minutes
Six studies (321 babies, low‐quality evidence) measured this outcome. There were no events in either group (Analysis 16.6).
No trials reported other secondary outcomes for this comparison.
Sensitivity analysis
Removing Magalhaes 2009 from Analysis 16.1, Analysis 16.3, Analysis 16.2, Analysis 16.6, and Analysis 16.4 made very little difference to the overall results.
Ephedrine versus angiotension
Primary outcome: maternal hypotension requiring pharmacological intervention
One study reported this outcome (Ramin 1994, 20 women). No events occurred in either arm (Analysis 17.1).
Secondary outcomes
Maternal
-
Nausea and/or vomiting
There was insufficient evidence to determine whether there was a difference between the groups (RR 3.00, 95% CI 0.14 to 65.90, 1 study, 20 women; Analysis 17.2).
Neonatal
-
Acidosis
There was insufficient evidence to determine whether there was a difference between the groups (RR 9.00, 95% CI 0.55 to 147.95, 1 study, 20 babies). Only four events occurred, all in the ephedrine arm (Analysis 17.3).
No trials reported other secondary outcomes for this comparison.
Ephedrine versus colloid
Primary outcome: maternal hypotension requiring pharmacological intervention
Rates of hypotension were lower in the ephedrine group (average RR 0.53, 95% CI 0.36 to 0.79, 2 studies, 160 women; Analysis 18.1).
Secondary outcomes
Maternal
-
Hypertension requiring intervention
There was insufficient evidence to determine whether there was a difference between the groups (RR 3.00, 95% CI 0.32 to 27.87, 1 study, 100 women; Analysis 18.2).
-
Cardiac dysrhythmia
One study reported bradycardia (Jabalameli 2011, 100 women). There were no events in either arm (Analysis 18.3).
-
Nausea and/or vomiting
There was insufficient evidence to determine whether there was a difference between the groups in rates of nausea or vomiting (RR 5.00, 95% CI 0.25 to 101.58, 1 study, 100 women) or in rates of vomiting alone (RR 0.14, 95% CI 0.01 to 2.65, 1 study, 60 women). Rates of nausea alone were lower in the ephedrine group (RR 0.22, 95% CI 0.05, 0.94, 1 study, 60 women); see Analysis 18.4.
Neonatal
-
Acidosis
One study reported this outcome (Jabalameli 2011, 100 babies). There were no events in either arm (Analysis 18.5).
-
Apgar scores of less than 7 or 8 at five minutes
There was insufficient evidence to determine whether there was a difference between the groups (RR 3.00, 95% CI 0.13 to 71.92, 1 study, 100 babies; Analysis 18.6).
No trials reported other secondary outcomes for this comparison.
Ephedrine versus metaraminol
Primary outcome: maternal hypotension requiring pharmacological intervention
There was insufficient evidence to determine whether there was a difference between the groups (RR 1.56,95% CI 0.50 to 4.89, 1 study, 53 women; Analysis 19.1).
Secondary outcomes
Maternal
-
Hypertension requiring intervention
There was insufficient evidence to determine whether there was a difference between the groups (RR 0.62, 95% CI 0.26 to 1.47, 1 study, 53 women; Analysis 19.2).
-
Cardiac dysrhythmia
One study reported bradycardia (Bhardwaj 2013, 53 women). There were no events in either arm (Analysis 19.3).
-
Nausea and/or vomiting
There was insufficient evidence to determine whether there was a difference between the groups (RR 7.26, 95% CI 0.39 to 134.01, 1 study, 53 women; Analysis 19.4).
Neonatal
-
Acidosis
One study reported this outcome (Bhardwaj 2013, 53 babies). There were no events in either arm (Analysis 19.5).
-
Apgar scores of less than 8 at five minutes
One study reported this outcome (Bhardwaj 2013, 53 babies). There were no events in either arm (Analysis 19.6).
No trials reported other secondary outcomes for this comparison.
Different ephedrine regimens
Ephedrine: lower dose versus higher dose
Primary outcome: maternal hypotension requiring pharmacological intervention
There was no clear evidence of a difference between the groups in dose comparisons of 5 mg versus 10 mg (RR 1.05, 95% CI 0.65 to 1.69, 2 studies, 100 women), 6 mg versus 12 mg (RR 1.83, 95% CI 0.83 to 4.04, 1 study, 46 women), 5 mg versus 15 mg (RR 2.00, 95% CI 0.94 to 4.27, 1 study, 40 women), 10 mg versus 15 mg (RR 1.83, 95% CI 0.84 to 3.99, 1 study, 40 women), 10 mg versus 20 mg (RR 1.06, 95% CI 0.80 to 1.39, 2 studies, 60 women), or 15 mg compared to 30 mg ephedrine (RR 2.11, 95% CI 1.06 to 4.21, 1 study, 100 women). However, rates of hypotension were higher with 10 mg compared to 30 mg (RR 2.43, 95% CI 1.30 to 4.54, 1 study, 40 women), and 20 mg compared to 30 mg (RR 2.29, 95% CI 1.21 to 4.32, 1 study, 40 women); see Analysis 20.1.
Secondary outcomes
Maternal
-
Hypertension requiring intervention
There was insufficient evidence to determine whether there was a difference between the groups in comparisons of 5 mg versus 10 mg ephedrine (RR 1.20, 95% CI 0.44 to 3.30, 1 study, 40 women), 5 mg versus 15 mg (RR 0.50, 95% CI 0.23 to 1.07, 1 study, 40 women), 10 mg versus 15 mg (RR 0.42, 95% CI 0.18 to 0.96, 1 study, 40 women), 10 mg versus 20mg (RR 0.20, 95% CI 0.03 to 1.56, 1 study, 40 women), 10 mg versus 30 mg (RR 0.11, 95% CI 0.02 to 0.80, 1 study, 40 women), or 20 mg versus 30 mg ephedrine (RR 0.56, 95% CI 0.23 to 1.37, 1 study, 40 women); see Analysis 20.2.
-
Nausea and/or vomiting
There was no clear evidence of a difference between the groups in rates of nausea and/or vomiting in comparisons of 6 mg versus 12 mg ephedrine (RR 0.81, 95% CI 0.38 to 1.74, 1 study, 46 women); see Analysis 20.3.1.
There was insufficient evidence to determine whether there was a difference between the dosing groups in rates of vomiting in comparisons of 5 mg versus 10 mg (RR 3.00, 95% CI 0.34 to 26.45, 1 study, 40 women), 5 mg versus 15 mg (RR 1.50, 95% CI 0.28 to 8.04, 1 study, 40 women), 10 mg versus 15 mg (RR 0.50, 95% CI 0.05 to 5.08, 1 study, 40 women), or 15 mg versus 30 mg ephedrine (RR 0.67, 95% CI 0.12 to 3.82, 1 study, 100 women); see Analysis 20.3.
There was insufficient evidence to determine whether there was a difference between the groups in rates of nausea, in comparisons of 5 mg versus 10 mg (RR 2.00, 95% CI 0.83 to 4.81, 1 study, 40 women), 5 mg versus 15 mg (RR 2.50, 95% CI 0.94 to 6.66, 1 study, 40 women), 10 mg versus 15 mg (RR 1.25, 95% CI 0.39 to 3.99, 1 study, 40 women, 10 mg versus 20 mg (RR 0.69, 95% CI 0.39 to 1.24, 1 study, 40 women), 10 mg versus 30 mg (RR 1.80, 95% CI 0.73 to 4.43, 1 study, 40 women), 15 mg versus 30 mg (RR 1.43, 95% CI 0.59 to 3.45, 1 study, 100 women), or 20 mg versus 30 mg ephedrine (RR 2.60, 95% CI 1.14 to 5.93, 1 study, 40 women); see Analysis 20.3.
Neonatal
-
Acidosis (pH less than 7.2)
There was insufficient evidence to determine whether there was a difference between the groups in comparisons of 5 mg versus 10 mg ephedrine (RR 0.20, 95% CI 0.01 to 3.92, 1 study, 40 babies), 5 mg versus 15 mg (RR 0.33, 95% CI 0.01 to 7.72, 1 study, 40 babies), 6 mg versus 12 mg (RR 0.31, 95% CI 0.01 to 7.16, 1 study, 46 babies), 10 mg versus 15 mg (RR 2.00, 95% CI 0.20 to 20.33, 1 study, 40 babies), 10 mg versus 20 mg (RR 0.59, 95% CI 0.24 to 1.50, 1 study, 39 babies), 10 mg versus 30 mg (RR 1.13, 95% CI 0.36 to 3.55, 1 study, 38 babies), or 20 mg versus 30 mg (RR 1.89, 95% CI 0.69 to 5.21, 1 study, 37 babies); see Analysis 20.4.
-
Apgar scores of less than 7 or 8 at five minutes
There was insufficient evidence to determine whether there was a difference between the groups, in comparisons of 6 mg versus 12 mg ephedrine (RR 0.31, 95% CI 0.01 to 7.16, 1 study, 46 babies).
No events occurred in comparisons of 5 mg versus 10 mg ephedrine (1 study, 40 babies), 5 mg versus 15 mg (1 study, 40 babies), 10 mg versus 15 mg (1 study, 40 babies), 10 mg versus 20 mg (1 study, 40 babies), 10 mg versus 30 mg (1 study, 40 babies), 20 mg versus 30 mg (1 study, 40 babies); see Analysis 20.5.
No trials reported other secondary outcomes for this comparison.
Ephedrine: slower rate versus faster rate
Primary outcome: maternal hypotension requiring pharmacological intervention
One study compared ephedrine given as a 10 mg in bolus followed by continuous infusion of 2 mg/min versus ephedrine 8 mg/min for 3 min, followed by 4 mg/min for 2 min, then 2 mg/min (Carvalho 2000). Rates of hypotension requiring intervention were higher in the bolus group (RR 3.50, 95% CI 1.26 to 9.72, 1 study, 80 women).
There was insufficient evidence to determine whether there was a difference between the groups, in comparisons of 0.5 mg/min versus 1 mg/min (RR 1.22, 95% CI 0.65 to 2.29, 1 study, 40 women), 0.5 mg/min versus 2 mg/min (RR 1.57, 95% CI 0.77 to 3.22, 1 study, 40 women), 0.5 mg/min versus 4 mg/min (1.22, 95% CI 0.65 to 2.29, 1 study, 40 women), 1 mg/min versus 2 mg/min (average RR 1.24, 95% CI 0.83 to 1.84, 3 studies, 107 women, I2=0%), 1 mg/min versus 3 to 4 mg/min (average RR 1.29, 95% CI 0.81 to 2.05, 2 studies, 99 women, I² = 0%), 2 mg/min versus 3 to 4 mg/min (average RR 1.21, 95% CI 0.60 to 2.43, 2 studies, 239 women, I² = 38%; Analysis 21.1).
Secondary outcomes
Maternal
-
Cardiac dysrhythmia
One study in 19 women comparing ephedrine 1 mg/min versus 2 mg/min reported bradycardia as an outcome (Hall 1994). There were no events in either arm (Analysis 21.3).
-
Nausea and/or vomiting
There was insufficient evidence to determine whether there was a difference between the groups in rates of nausea or vomiting, in a comparison of infusion at 1 mg/min versus 2 mg/min (RR 8.18, 95% CI 0.50 to 133.66, 1 study, 19 women; Analysis 21.4).
There was insufficient evidence to determine whether there was a difference between the groups in rates of nausea alone in comparisons of ephedrine bolus plus slow infusion versus faster infusion (as described above) (RR 1.83, 95% CI 0.75 to 4.48, 1 study, 80 women), or infusion of 0.5 mg/min versus 1 mg/min (RR 1.29, 95% CI 0.60 to 2.77, 1 study, 40 women), 0.5 mg/min versus 2 mg/min (RR 1.50, 95% CI 0.66 to 3.43, 1 study, 40 women), 0.5 mg/min versus 4 mg/min (RR 1.29, 95% CI 0.60 to 2.77, 1 study, 40 women), 1 mg/min versus 2 mg/min (RR 1.17, 95% CI 0.48, 2.86, 1 study, 40 women), 1 mg/min versus 4 mg/min (RR 1.00, 95% CI 0.43, 2.33, 1 study, 40 women), or 2 mg/min versus 4 mg/min (RR 0.86, 95% CI 0.35 to 2.10, 1 study, 40 women). See Analysis 21.4.
There was insufficient evidence to determine whether there was a difference between the groups in rates of vomiting alone, in comparisons of ephedrine bolus plus slow infusion versus faster infusion (as described above) (RR 1.67, 95% CI 0.43 to 6.51, 1 study, 80 women), or infusion of 0.5 mg/min versus 1 mg/min (RR 0.67, 95% CI 0.12, 3.57, 1 study, 40 women), 0.5 mg/min versus 2 mg/min (RR 2.00, 95% CI 0.20 to 20.33, 1 study, 40 women), 0.5 mg/min versus 4 mg/min (RR 2.00, 95% CI 0.20 to 20.33, 1 study, 40 women), 1 mg/min versus 2 mg/min (RR 3.00, 95% CI 0.34, 26.45, 1 study, 40 women), 1 mg/min versus 4 mg/min (RR 3.00, 95% CI 0.34 to 26.45, 1 study, 40 women) or 2 mg/min versus 4 mg/min (RR 1.00, 95% CI 0.07 to 14.90, 1 study, 40 women). See Analysis 21.4.
Neonatal
-
Acidosis
There was insufficient evidence to determine whether there was a difference between the groups in comparisons of ephedrine bolus plus slow infusion versus faster infusion (as described above) (RR 1.66, 95% CI 0.53 to 5.23, 1 study, 78 babies), or infusion of 0.5 mg/min versus 1 mg/min (RR 0.33, 95% CI 0.04 to 2.94, 1 study, 40 babies), 0.5 mg/min versus 2 mg/min (3.00, 95% CI 0.13 to 69.52, 1 study, 40 babies), 0.5 mg/min versus 4 mg/min (RR 0.25, 95% CI 0.03, 2.05, 1 study, 40 babies), 1 mg/min versus 2 mg/min (RR 7.00, 95% CI 0.38 to 127.32, 1 study, 40 babies), 1 mg/min versus 4 mg/min (RR 0.75, 95% CI 0.19 to 2.93, 1 study, 40 babies), or 2 mg/min versus 4 mg/min (RR 0.11, 95% CI 0.01 to 1.94, 1 study, 40 babies); see Analysis 21.5.
-
Apgar scores of less than 7 or 8 at five minutes
One study in 80 women reported this outcome (Carvalho 2000), comparing ephedrine bolus plus slow infusion versus faster infusion (as described above), and one study in 40 babies compared 0.5 mg/min versus 1 mg/min, 0.5 mg/min versus 2 mg/min, 0.5 mg/min versus 4 mg/min, 1 mg/min versus 2 mg/min, 1 mg/min versus 4 mg/min, and 2 mg/min versus 4 mg/min (Carvalho 1999b). There were no events in either arm of any of these studies (Analysis 21.6).
No trials reported other secondary outcomes for this comparison.
Ephedrine: oral versus intramuscular (IM) or intravenous (IV)
Primary outcome: maternal hypotension requiring pharmacological intervention
There was no conclusive evidence of a difference between the groups when comparing oral versus IM administration of ephedrine (RR 3.00, 95% CI 0.95 to 9.48, 1 study, 40 women). Rates of maternal hypotension were higher in the oral group compared with the IV group (RR 19.00, 95% CI 1.18 to 305.88, 1 study, 40 women). See Analysis 22.1.
Secondary outcomes
Maternal
-
Hypertension requiring intervention
There were no events in either arm when comparing oral ephedrine with IM or IV (1 study, 40 women; Analysis 22.2).
-
Nausea and/or vomiting
There was no conclusive evidence of a difference between the groups in rates of nausea or vomiting when comparing oral versus IM (RR 1.33, 95% CI 0.34 to 5.21, 1 study, 40 women) or IV administration (RR 9.00, 95% CI 0.52 to 156.91, 1 study, 40 women); see Analysis 22.3.
No trials reported other secondary outcomes for this comparison.
Ephedrine: IM versus IV
Primary outcome: maternal hypotension requiring pharmacological intervention
There was no clear evidence of a difference between the groups (RR 0.75, 95% CI 0.43 to 1.30, 1 study, 60 women; Analysis 23.1).
Secondary outcomes
Maternal
-
Hypertension requiring intervention
There were no events in either arm when comparing IM ephedrine versus IV (1 study, 60 women; Analysis 23.2).
Neonatal
-
Apgar scores of less than 7 or 8 at five minutes
There were no events in either arm when comparing IM ephedrine with IV (1 study, 60 babies; Analysis 23.3).
No trials reported other secondary outcomes for this comparison.
Sensitivity analysis
Sensitivity analysis was not possible for this comparison.
Phenylephrine versus control (placebo)
Primary outcome: maternal hypotension requiring pharmacological intervention
Five studies investigating this comparison found less hypotension with phenylephrine compared with control (average RR 0.45, 95% CI 0.26 to 0.80, 280 women, 5 studies, I² = 86%, Tau² = 0.34; Analysis 24.1).
Secondary outcomes
Maternal
-
Cardiac dysrhythmia
There was insufficient evidence to determine whether there was a difference between the groups in rates of tachycardia (RR 0.87, 95% CI 0.13 to 5.73, 1 study, 56 women) or bradycardia (average RR 3.23, 95% CI 0.17 to 61.85, 3 studies, 180 women, I² = 73%, Tau² = 4.97); see Analysis 24.2.
-
Nausea and/or vomiting
There was insufficient evidence to determine whether there was a difference between the groups in rates of nausea or vomiting (average RR 0.70, 95% CI 0.16 to 0.80, 3 studies, 180 women, I² = 67%, Tau² = 0.34; Analysis 24.3).
Neonatal
-
Acidosis
There was insufficient evidence to determine whether there was a difference between the groups (RR 0.96, 95% CI 0.06 to 14.50, 1 study, 49 babies; Analysis 24.4).
-
Apgar scores of less than 7 or 8 at five minutes
Three studies reported Apgar scores of less than 7 (Ngan Kee 2004a, 50 babies), or of less than 8 (Loughrey 2005; Moslemi 2015, 96 babies). There were no events in any study arm (Analysis 24.5; Analysis 24.6).
No trials reported other secondary outcomes for this comparison.
Phenylephrine versus other regimens or interventions
Phenylephrine versus mephentermine
Primary outcome: maternal hypotension requiring pharmacological intervention
There was insufficient evidence to determine whether there was a difference between the groups (RR 2.00, 95% CI 0.19 to 20.90, 1 study, 60 women; Analysis 25.1).
Secondary outcomes
Maternal
-
Hypertension requiring intervention
There was insufficient evidence to determine whether there was a difference between the groups (RR 17.00, 95% CI 1.03 to 281.91, 1 study, 60 women; Analysis 25.2).
-
Cardiac dysrhythmia
There was insufficient evidence to determine whether there was a difference between the groups in rates of bradycardia (RR 15.00, 95% CI 0.89 to 251.42, 1 study, 60 women; Analysis 25.3).
-
Nausea and/or vomiting
There was insufficient evidence to determine whether there was a difference between the groups in rates of nausea (RR 0.20, 95% CI 0.01 to 4.00, 1 study, 60 women) or vomiting (RR 1.00, 95% CI 0.07 to15.26 1 study, 60 women); see Analysis 25.4.
No trials reported other secondary outcomes for this comparison.
Phenylephrine versus metaraminol
Primary outcome: maternal hypotension requiring pharmacological intervention
There was insufficient evidence to determine whether there was a difference between the groups (RR 0.84, 95% CI 0.23 to 3.06, 1 study, 59 women; Analysis 26.1).
Secondary outcomes
Maternal
-
Hypertension requiring intervention
Rates of hypertension were lower in the phenylephrine arm (RR 0.25, 95% CI 0.08 to 0.83, 1 study, 59 women; Analysis 26.2).
-
Cardiac dysrhythmia
One study reported bradycardia (Bhardwaj 2013, 59 women). No events occurred in either arm (Analysis 26.3).
-
Nausea and/or vomiting
One study reported this outcome (Bhardwaj 2013, 59 women). No events occurred in either arm (Analysis 26.4).
Neonatal
-
Acidosis
One study reported this outcome (Bhardwaj 2013, 59 babies). No events occurred in either arm (Analysis 26.5).
-
Apgar scores of less than 7 or 8 at five minutes
One study reported this outcome (Bhardwaj 2013, 59 babies). No events occurred in either arm (Analysis 26.6).
No trials reported other secondary outcomes for this comparison.
Phenylephrine versus leg compression
Primary outcome: maternal hypotension requiring pharmacological intervention
There was insufficient evidence to determine whether there was a difference between the groups (RR 0.73, 95% CI 0.46 to 1.15, 1 study, 76 women; Analysis 27.1).
Secondary outcomes
Maternal
-
Cardiac dysrhythmia
There was insufficient evidence to determine whether there was a difference between the groups in rates of bradycardia (RR 0.50, 95% CI 0.05 to 5.28, 1 study, 76 women; Analysis 27.2).
-
Nausea and/or vomiting
There was insufficient evidence to determine whether there was a difference between the groups (RR 1.00, 95% CI 0.32 to 3.17 1 study, 76 women; Analysis 27.3).
No trials reported other secondary outcomes for this comparison.
Phenylephrine: different regimens
Phenylephrine infusion versus bolus
Primary outcome: maternal hypotension requiring pharmacological intervention
There was insufficient evidence to determine whether there was a difference between the groups (RR 1.40, 95% CI 0.50 to 3.92, 1 study, 60 women; Analysis 28.1).
Secondary outcomes
Maternal
-
Cardiac dysrhythmia
There was insufficient evidence to determine whether there was a difference between the groups in rates of bradycardia (RR 1.22, 95% CI 0.59 to 2.51, 1 study, 60 women; Analysis 28.2).
-
Nausea and/or vomiting
There was insufficient evidence to determine whether there was a difference between the groups in rates of nausea or vomiting (RR 0.45, 95% CI 0.18 to 1.15, 1 study, 60 women; Analysis 28.3).
Neonatal
-
Apgar scores of less than 8 at five minutes
One study reported this outcome (Doherty 2012, 60 babies). No events occurred in either arm (Analysis 28.4).
No trials reported other secondary outcomes for this comparison.
Phenylephrine: lower dose versus higher dose
Primary outcome: maternal hypotension requiring pharmacological intervention
When comparing 50 μg/mL phenylephrine versus 100 μg/mL phenylephrine used as an infusion starting at 60mL/h, rates of hypotension were higher in the lower dose group (RR 8.17, 95% CI 1.04 to 64.30, 1 study, 117 women; Analysis 29.1).
Secondary outcomes
Maternal
-
Hypertension requiring intervention
When comparing crystalloid plus 50 μg/mL versus 100 μg/mL phenylephrine, there was no conclusive evidence of a difference between the groups (RR 0.23, 95% CI 0.05 to 1.02, 1 study, 117 women; Analysis 29.2).
-
Cardiac dysrhythmia
When comparing crystalloid plus 50 μg/mL versus 100 μg/mL phenylephrine, fewer episodes of bradycardia occurred in the lower dose group (RR 0.11, 95% CI 0.01 to 0.80, 1 study, 117 women; Analysis 29.3).
-
Nausea and/or vomiting
When comparing crystalloid plus 50 μg/mL versus 100 μg/mL phenylephrine, there was insufficient evidence to determine whether there was a difference between the groups in rates of nausea or vomiting (RR 3.50, 95% CI 0.37 to 32.67, 1 study, 117 women; Analysis 29.4).
Neonatal
-
Acidosis
One study reported this outcome (Ansari 2011, 117 babies). No events occurred in either arm (Analysis 29.5).
-
Apgar scores of less than 7 or 8 at five minutes
One study reported this outcome (Ansari 2011, 117 babies). No events occurred in either arm (Analysis 29.6).
No trials reported other secondary outcomes for this comparison.
Glycopyrrolate versus control
Primary outcome: maternal hypotension requiring pharmacological intervention
There was insufficient evidence to determine whether there was a difference between the groups (average RR 0.63, 95% CI 0.21 to 1.91, 2 studies, 142 women; Analysis 30.1).
Secondary outcomes
Maternal
-
Hypertension requiring intervention
Rates of hypertension were higher in the glycopyrrolate group (RR 2.67, 95% CI 1.31 to 5.43, 1 study, 93 women; Analysis 30.2).
-
Cardiac dysrhythmia
There was insufficient evidence to determine whether there was a difference between the groups in rates of bradycardia (RR 0.21, 95% CI 0.01 to 4.32, 1 study, 93 women; Analysis 30.3).
-
Nausea and/or vomiting
There was insufficient evidence to determine whether there was a difference between the groups in rates of nausea or vomiting (RR 2.49, 95% CI 0.69 to 9.04, 1 study, 93 women), or rates of nausea alone (0.61, 95% CI 0.36 to 1.06, 1 study, 49 women) or vomiting alone (RR 0.52, 95% CI 0.10 to 2.59, 1 study, 49 women; Analysis 30.4).
Neonatal
-
Apgar scores of less than 7 or 8 at five minutes
Two studies reported this outcome (Ngan Kee 2013a, Ure 1999, 142 babies). No events occurred in either study (Analysis 30.5).
No trials reported other secondary outcomes for this comparison.
Ondansetron versus control
See summary of findings Table 5.
Primary outcome: maternal hypotension requiring pharmacological intervention
There was a lower incidence of hypotension in the ondansetron group (average RR 0.67, 95% CI 0.54 to 0.83, 8 studies, 740 women, I² = 35%, Tau² = 0.05,low‐quality evidence).
The studies compared doses of 2 mg, 4 mg, 6 mg, and 8 mg ondansetron versus control. The test for subgroup differences indicated a significant difference between the subgroups (Chi² = 11.97, df = 3 (P = 0.008), I² = 74.9%). The treatment effect was strongest in the 4 mg subgroup, and when we excluded this subgroup from the analysis there was no longer any indication of a difference between the subgroups (Chi² = 2.07, df = 2 (P = 0.36), I² = 3.3%). The possible explanation for the effectiveness of this lower dose compared with higher doses is unclear (Analysis 31.1).
Secondary outcomes
Maternal
-
Cardiac dysrhythmia
There was a lower rate of bradycardia in the ondansetron group (average RR 0.49, 95% CI 0.28 to 0.87, 8 studies, 740 women,low‐quality evidence; Analysis 31.2).
-
Nausea and/or vomiting
There was a lower rate of nausea or vomiting in the ondansetron group (average RR 0.35, 95% CI 0.24 to 0.51, 7 studies, 653 women, low‐quality evidence; Analysis 31.3).
-
Anaphylaxis
One study measured this outcome (Wang 2014a, 150 women). There were no events in either arm (Analysis 31.4).
Neonatal
-
Acidosis
Two studies measured this outcome. There was insufficient evidence to determine whether there was any difference between the groups (average RR 0.48, 95% CI 0.05 to 5.09, 2 studies, 134 babies, low‐quality evidence). There were no events in one of the studies (Analysis 31.6).
-
Apgar scores of less than 8 at five minutes
Three studies measured this outcome (Wang 2014a, Wang 2014b, Marciniak 2015, 284 babies, low‐quality evidence). There were no events in any of the studies (Analysis 31.5).
No trials reported other secondary outcomes for this comparison.
Ondansetron versus ephedrine
Primary outcome: maternal hypotension requiring pharmacological intervention
There was insufficient evidence to determine whether there was a difference between the groups (RR 1.07, 95% CI 0.76 to 1.49, 1 study, 112 women; Analysis 32.1).
Secondary outcomes
Maternal
-
Cardiac dysrhythmia
There was no clear evidence of a difference between the groups in the rate of bradycardia (RR 3.00, 95% CI 0.12 to 72.10, 1 study, 112 women; Analysis 32.2).
-
Nausea and/or vomiting
There was insufficient evidence to determine whether there was a difference between the groups in the rate of nausea or vomiting (RR 0.38, 95% CI 0.10 to 1.34, 1 study, 112 women; Analysis 32.3).
No trials reported other secondary outcomes for this comparison.
Granisetron versus control
Primary outcome: maternal hypotension requiring pharmacological intervention
One study, Eldaba 2015, investigated this comparison and found rates of hypotension were lower with granisetron than with saline control (RR 0.05, 95% CI 0.02 to 0.14, 1 study, 200 women; Analysis 33.1).
Secondary outcomes
No studies reported secondary outcomes for this comparison.
Sensitivity analysis
Sensitivity analysis was not possible under this comparison.
Ketamine versus saline
Primary outcome: maternal hypotension requiring pharmacological intervention
There was no conclusive evidence of a difference between the groups (RR 0.79, 95% CI 0.62 to 1.01, 1 study, 105 women). The study compared two different doses of IV ketamine (0.25 mg/kg and 0.5 mg/kg) versus saline.There was no evidence of a difference between the effects of the two doses (test for subgroup differences: Chi² = 0.25, df = 1 (P = 0.62), I² = 0%; Analysis 34.1).
Secondary outcomes
Maternal
-
Nausea and/or vomiting
There was insufficient evidence to determine whether there was a difference between the groups in rates of nausea or vomiting (RR 0.79, 95% CI 0.50 to 1.25, 1 study, 105 women; Analysis 34.2).
Neonatal
-
Apgar scores of less than 8 at five minutes
One study reported this outcome (Gulhas 2012, 105 women). No events occurred in either arm (Analysis 34.3).
No trials reported other secondary outcomes for this comparison.
Sensitivity analysis
Sensitivity analysis was not possible under this comparison.
Angiotensin versus control
Primary outcome: maternal hypotension requiring pharmacological intervention
There was insufficient evidence to determine whether there was a difference between the groups (RR 0.09, 95% CI 0.01 to 1.45, 1 study, 20 women; Analysis 35.1).
Secondary outcomes
Maternal
-
Nausea and/or vomiting
There was insufficient evidence to determine whether there was a difference between the groups (RR 0.20, 95% CI 0.01 to 3.70, 1 study, 20 women; Analysis 35.2).
Neonatal
-
Acidosis
One study reported this comparison (Ramin 1994, 20 babies). There were no events in either arm (Analysis 35.3).
No trials reported other secondary outcomes for this comparison.
Dopamine versus control
Primary outcome: maternal hypotension requiring pharmacological intervention
One small study, Yokoyama 1997, found that dopamine was more effective than control in preventing hypotension (RR 0.05, 95% CI 0.00 to 0.75, 1 study, 30 women; Analysis 36.1).
Secondary outcomes
Neonatal
-
Apgar scores of less than 8 at five minutes
One study reported this outcome (Yokoyama 1997, 30 babies). There were no events in either arm (Analysis 36.2).
No trials reported other secondary outcomes for this comparison.
Summary: drugs
In preventing hypotension following spinal anaesthesia at caesarean section, we found the following.
-
Ephedrine is more effective than control, crystalloid, or colloid.
-
There were no differences in hypotension between ephedrine and phenylephrine, ephedrine and metaraminol, or ephedrine and angiotension. Higher doses or higher rates of ephedrine infusions result in no differences in hypotension. IV ephedrine is associated with less hypotension than oral ephedrine. There is no difference when comparing IM to IV ephedrine.
-
Phenylephrine is more effective than control in preventing hypotension. We found no difference in hypotension between phenylephrine and metaraminol.
-
We found no clear differences in the incidence of hypotension between glycopyrrolate and control.
-
We found no clear differences between ondansetron and control.
-
We found no clear differences in hypotension between angiotensin and control, or between ketamine and control.
-
Dopamine appears effective for preventing hypotension.
Physical methods
This group of interventions comprises comparisons corresponding to data analyses 37 to 49. Comparison 37 assesses lower limb compression versus control (summary of findings Table 6), while other comparisons assess different positioning techniques (see summary of findings Table 7 on comparison, 'walking versus lying'), and acupressure.
Lower limb compression versus control
See summary of findings Table 6.
Primary outcome: maternal hypotension requiring pharmacological intervention
Lower limb compression was more effective than control for preventing hypotension (average RR 0.61, 95% CI 0.47 to 0.78, 11 studies, 705 women, very low‐quality evidence; Analysis 37.1). There was substantial heterogeneity (I² = 65, Tau² = 0.10), which may be due to the different types of compression used (bandages, boots, or stockings). We did not perform a subgroup analysis here as we did not feel it would be meaningful. It also may have been due to differences in formulation and volume of IV fluids given. The asymmetrical funnel plot (Figure 5) may be due to small study effects or publication‐type bias.
Secondary outcomes
Maternal
-
Cardiac dysrhythmia
There was insufficient evidence to determine whether there was a difference between the groups in rates of bradycardia (RR 0.63, 95% CI 0.11 to 3.56, 1 study, 74 women, very low‐quality evidence; Analysis 37.2).
-
Nausea and/or vomiting
There was insufficient evidence to determine whether there was a difference between the groups in rates of nausea or vomiting (average RR 0.42 , 95% CI 0.14 to 1.27, 4 studies, 276 women, I² = 32%, very‐low quality evidence) or rates of nausea alone (RR 1.44, 95% CI 0.25 to 8.20, 1 study, 92 women). One study in 92 women measured rates of vomiting; there were no events in either arm (Sujata 2012; Analysis 37.3).
Neonatal
-
Apgar scores of less than 7 or 8 at five minutes
Three studies measured this outcome (Adsumelli 2003; Jorgensen 1996; Sood 1996, 130 babies, very low‐quality evidence). There were no events in any of the studies (Analysis 37.4).
No trials reported other secondary outcomes for this comparison.
Sensitivity analysis
Removing Bhagwanjee 1990 and Sutherland 2001 made little difference to the overall results in Analysis 37.1.
Comparisons of positioning
Wedge versus supine
Primary outcome: maternal hypotension requiring pharmacological intervention
There was insufficient evidence to determine whether there was a difference between the groups in the incidence of hypotension (RR 0.85, 95% CI 0.53 to 1.37, 1 study, 80 women; Analysis 38.1).
Secondary outcomes
Maternal
-
Nausea and/or vomiting
There was insufficient evidence to determine whether there was a difference between the groups in rates of nausea (RR 0.27, 95% CI 0.12 to 0.60, 1 study, 80 women) or vomiting (RR 0.11, 95% CI 0.01 to 2.00, 1 study, 80 women); see Analysis 38.2.
No trials reported other secondary outcomes for this comparison.
Sensitivity analysis
Sensitivity analysis was not possible under this comparison.
Head‐up tilt versus horizontal
Primary outcome: maternal hypotension requiring pharmacological intervention
There was insufficient evidence to determine whether there was a difference between the groups (RR 0.71, 95% CI 0.47 to 1.06, 1 study, 40 women; Analysis 39.1).
Secondary outcomes
Neonatal
-
Apgar scores of less than 8 at five minutes
One study measured this outcome (Loke 2002, 40 babies). There were no events in either arm (Analysis 39.2).
No trials reported other secondary outcomes for this comparison.
Head‐down tilt versus horizontal
Primary outcome: maternal hypotension requiring pharmacological intervention
There was insufficient evidence to determine whether there was a difference between the groups (RR 1.07, 95% CI 0.81 to 1.42, 1 study, 40 women; Analysis 40.1).
No studies reported secondary outcomes for this comparison.
Crawford's wedge versus manual uterine displacement
Primary outcome: maternal hypotension requiring pharmacological intervention
There was insufficient evidence to determine whether there was a difference between the groups (RR 0.92, 95% CI 0.57 to 1.49, 1 study, 40 women; Analysis 41.1).
Secondary outcomes
Neonatal
-
Apgar scores of less than 8 at five minutes
One study measured this outcome (Amaro 1998, 40 babies). There were no events in either arm (Analysis 41.2).
No trials reported other secondary outcomes for this comparison.
Supine versus sitting
Primary outcome: maternal hypotension requiring pharmacological intervention
There was insufficient evidence to determine whether there was a difference between the groups (RR 0.81, 95% CI 0.58 to 1.12, 1 study, 98 women; Analysis 42.1).
Secondary outcomes
Maternal
-
Nausea and/or vomiting
There was insufficient evidence to determine whether there was a difference between the groups in rates of nausea (RR 0.65, 95% CI 0.40 to 1.07, 1 study, 98 women) or vomiting (RR 0.38, 95% CI 0.02 to 9.01, 1 study, 98 women; Analysis 42.2).
Neonatal
-
Acidosis
One study measured this outcome (Kohler 2002, 98 babies). There were no events in either arm (Analysis 42.3).
-
Apgar scores of less than 7 or 8 at five minutes
One study measured this outcome (Kohler 2002, 98 women). There were no events in either arm (Analysis 42.4).
No trials reported other secondary outcomes for this comparison.
Walking versus lying
See summary of findings Table 7.
Primary outcome: maternal hypotension requiring pharmacological intervention
There was insufficient evidence to determine whether there was a difference between the groups (RR 0.71, 95% CI 0.41 to 1.09, 1 study, 37 women, very low‐quality evidence; Analysis 43.1).
No studies reported secondary outcomes for this comparison.
Sensitivity analysis
Sensitivity analysis was not possible under this comparison.
Lateral versus supine wedged position
Primary outcome: maternal hypotension requiring pharmacological intervention
There was no clear evidence of a difference between the groups (average RR 0.91, 95% CI 0.75 to 1.09, 2 studies, 126 women; Analysis 44.1).
Secondary outcomes
Maternal
-
Nausea and/or vomiting
There was insufficient evidence to determine whether there was a difference between the groups in rates of nausea (RR 0.81, 95% CI 0.45 to 1.48, 1 study, 86 women; Analysis 44.4).
-
Cardiac dysrhythmia
There was insufficient evidence to determine whether there was a difference between the groups (RR 0.50, 95% CI 0.05 to 5.08, 1 study, 40 women; Analysis 44.2.
Neonatal
-
Admission to neonatal intensive care unit
One study measured this outcome (Hartley 2001, 40 babies). There were no events in either arm (Analysis 44.3).
No trials reported other secondary outcomes for this comparison.
Left lateral versus left lateral tilt
Primary outcome: maternal hypotension requiring pharmacological intervention
There was insufficient evidence to determine whether there was a difference between the groups (RR 1.20, 95% CI 0.80 to 1.79, 1 study, 58 women; Analysis 45.1).
Secondary outcomes
Maternal
-
Cardiac dysrhythmia
There was no conclusive evidence of a difference between the groups in rates of bradycardia (RR 0.10, 95% CI 0.01 to 1.68, 1 study, 58 women; Analysis 45.2).
-
Nausea and/or vomiting
There was insufficient evidence to determine whether there was a difference between the groups in rates of nausea (RR 0.45, 95% CI 0.18 to 1.11, 1 study, 58 women) or vomiting (RR 0.15, 95% CI 0.01 to 2.83, 1 study, 58 women; Analysis 45.3).
No trials reported other secondary outcomes for this comparison.
Left lateral tilt versus left manual uterine displacement
Primary outcome: maternal hypotension requiring pharmacological intervention
Left uterine displacement was associated with a reduced rate of hypotension compared to left lateral tilt (RR 0.63, 95% CI 0.49 to 0.80, 1 study, 90 women; Analysis 46.1).
No studies reported other outcomes for this comparison.
Leg elevation versus control
Primary outcome: maternal hypotension requiring pharmacological intervention
There was insufficient evidence to determine whether there was a difference between the groups (RR 0.73, 95% CI 0.42 to 1.26, 1 study, 63 women; Analysis 47.1).
No other outcomes were reported for this comparison
Comparisons of acupressure
Acupressure versus placebo
Primary outcome: maternal hypotension requiring pharmacological intervention
There was insufficient evidence to determine whether there was a difference between the groups (RR 0.84, 95% CI 0.58 to 1.22, 1 study, 50 women; Analysis 48.1).
Secondary outcomes
Maternal
-
Nausea and/or vomiting
Rates of nausea were lower in the acupressure group than in the placebo group (RR 0.32, 95% CI 0.15 to 0.66, 1 study, 50 women). There was no clear evidence of a difference between the groups in rates of vomiting (RR 0.50, 95% CI 0.14 to 1.78, 1 study, 50 women). See Analysis 48.2.
-
Apgar scores of less than 7 at five minutes
One study measured this outcome (Stein 1997, 50 babies). There were no events in either arm (Analysis 48.3).
No trials reported other secondary outcomes for this comparison.
Acupressure versus metoclopramide
Primary outcome: maternal hypotension requiring pharmacological intervention
There was insufficient evidence to determine whether there was a difference between the groups (RR 0.94, 95% CI 0.63 to 1.40, 1 study, 50 women; Analysis 49.1).
Secondary outcomes
Maternal
-
Nausea and/or vomiting
There was insufficient evidence to determine whether there was a difference between the groups in rates of nausea (RR 1.50, 95% CI 0.48 to 4.68, 1 study, 50 women) or vomiting (RR 3.00, 95% CI 0.33 to 26.92, 1 study, 50 women; Analysis 49.2).
Neonatal
-
Apgar scores of less than 7 or 8 at five minutes
One study measured Apgar scores of less than 7 at five minutes (Stein 1997, 50 babies). There were no events in either arm (Analysis 49.3).
No trials reported other secondary outcomes for this comparison.
Summary: physical methods
In preventing hypotension following spinal anaesthesia at caesarean section, we found the following.
-
Lower leg compression is more effective than control (i.e. no leg compression) for preventing hypotension, although different methods of compression appear to vary in their effectiveness.
-
Manual left uterine displacement while supine is more effective than left lateral tilt of the bed for preventing hypotension.
-
In other comparisons between different physical methods such as position, wedging or leg elevation, we found none to be effective, but these trials were often small and may benefit from further research. Similarly, walking into the operating theatre as opposed to lying on the barouche is a non‐invasive, safe, and simple intervention and may also be worth further investigating in a larger study.
-
There was insufficient evidence to show whether acupressure is more effective than placebo or metoclopramide.
Discussion
This review is the most comprehensive to date examining the effects of interventions used to prevent hypotension following spinal anaesthesia for caesarean section.
Summary of main results
Although some interventions assessed in this review (such as colloids, ephedrine, or lower leg compression) can reduce the incidence of hypotension, we found none that eliminate the need to treat maternal hypotension during spinal anaesthesia for caesarean section. It is likely that one or more interventions used together, as commonly occurs in clinical practice, is most effective.
Our key findings include the following.
Fluids
-
Crystalloids alone may be inadequate for preventing hypotension.
-
Crystalloids may be most effective when given in higher volume as a rapid coload.
-
Colloids may be more effective than crystalloids.
Drugs
-
Vasopressors, such as ephedrine, phenylephrine, and metaraminol appear to be effective and may be more effective than fluids alone or control.
-
Ondansetron may be more effective than control for preventing hypotension.
-
There is no clear evidence to show that glycopyrrolate, ketamine, or angiotensin are effective for preventing hypotension.
Physical methods
-
Lower leg compression is more effective than control for preventing hypotension.
-
Manual uterine displacement while supine may be more effective than left lateral tilt.
-
We did not find other physical methods such as position, wedging, or leg elevation to be effective, but these trials were often small and may benefit from further research.
Mortality and serious morbidity in this population are rare (Hibbard 1996). The reviewed trials report no serious adverse events such as anaphylaxis, cerebral haemorrhage, or maternal death. We did not see any differences in the incidence of fetal acidosis when comparing ephedrine with phenylephrine for preventing hypotension during spinal anaesthesia, although Ngan Kee 2006 has suggested an increased risk when using ephedrine to treat, rather than prevent, hypotension.
Overall completeness and applicability of evidence
This review is very likely to represent the key research findings to date and to be applicable to clinical practice. We suggest some caution about the magnitude of the findings of some intervention comparisons given that many of these comparisons are only supported by either a single study or several small studies of unclear quality. Despite our finding that colloids were more effective than crystalloids for reducing maternal hypotension after spinal anaesthesia, the included trials were too small to show the well‐recognised and serious potential risks that colloid administration represents.
The findings of this review will be less relevant for women with pre‐eclampsia, who appear less likely to require prophylactic measures or emergency procedures than normotensive women (Clark 2005). Most studies in this review excluded women with pre‐existing hypertension.
One of the main limitations of a review of this type is outcome definition. There were multiple different definitions of hypotension between studies (Table 1). In this review, we used the definition of hypotension provided by study authors to pool these data in our meta‐analyses.
All studies investigated women having elective caesarean births except for one study that included women undergoing emergency caesarean sections.
As can be seen from the Results section and from the meta‐analyses, we found a large number of small studies with little to no information for enabling an adequate 'Risk of bias' assessment. Many studies did not report details about their method of randomisation, allocation concealment, and blinding, which limits our ability to draw clear conclusions. Furthermore, several pooled results showed high levels of heterogeneity between studies, which is most likely due to differences in study design interventions, anaesthetic techniques and variations in definition of hypotension.
We note that there are several studies awaiting assessment and acknowledge that there will be a lag time in assessing and incorporating these studies in future reviews. However, it appears unlikely that these studies will impact our key findings.
Quality of the evidence
The GRADE assessments for the key outcomes (incidence of maternal hypotension/hypertension requiring intervention; incidence of maternal bradycardia; incidence of maternal nausea and/or vomiting; neonatal acidosis as defined by cord or neonatal bloods with a pH of less than 7.2; neonatal Apgar score of less than 8 at five minutes; admission to neonatal intensive care unit) showed either low or very low quality. We chose six key comparisons for GRADE quality assessments because they represent the most clinically relevant comparisons in the updated review (see summary of findings Table for the main comparison; summary of findings Table 2; summary of findings Table 3; summary of findings Table 4; summary of findings Table 5; summary of findings Table 6; summary of findings Table 7). Many studies were small, and their lack of detail in reporting led us to assess them as being at unclear risk of bias in method of randomisation, allocation concealment, and blinding. Seventeen studies had one or more factors designated as causing high risk of bias, but sensitivity analyses removing 12 studies where possible did not change the findings (Bhagwanjee 1990; Bottiger 2010; Cardoso 2004a; Carvalho 2009; Dahlgren 2005; Dyer 2004; Magalhaes 2009; Mercier 2014; Muzlifah 2009; Romdhani 2014; Sutherland 2001; Ueyama 1999). The remaining five studies were single studies for which sensitivity analyses were not possible (Calvache 2011; Cyna 2010; Eldaba 2015; Gulhas 2012; Pouliou 2006). As well as for study design, we downgraded evidence for indirectness (because most studies included only women having elective caesarean sections), inconsistency, and imprecision.
We noted significant heterogeneity for some comparisons, namely crystalloid versus colloid, colloid of different volumes, ephedrine versus control, ephedrine versus crystalloid, ephedrine versus phenylephrine. Sensitivity analysis showed minimal changes in overall findings.
Potential biases in the review process
There are several potential sources of bias in this review process.
Firstly, there were several differences between previous published versions and this version, including:
-
specific exclusion of quasi‐randomised, cluster, and cross‐over trials; and
-
specific exclusion of studies investigating prevention of hypotension with combined spinal‐epidural techniques.
Given the large number of randomised controlled trials investigating the core review objective (assessing the effects of prophylactic interventions for hypotension following spinal anaesthesia for caesarean section), the authors agreed that incorporating these trials into this review would contribute to a lower quality and less robust review.
Secondly, one of the review authors (AMC) was the lead author on an included study (Cyna 2010). We minimised this potential source of bias by ensuring that review authors independent of this study (RSL and CC) performed the data extraction.
Thirdly, there were 2 studies assessed as high risk as study participants received variable doses of local anaesthetic in their spinal block (Alahuhta 1992; Mathru 1980). Also, there were 2 studies assessed as high risk of bias as it was unclear whether the spinal anaesthetic technique and dose was standardised between the study groups (Ozkan 2004; Wilson 1998). It was unlikely that with randomisation this source of bias would have an important effect on the review findings.
Finally, for the purposes of this review, we specifically excluded the use of infusion pumps programmed with algorithms to address hypotension. It was difficult to determine whether this approach constituted prevention or treatment of hypotension, but discussion among review authors produced a consensus that it was the latter. Future reviews may consider whether it may be appropriate to include the results of these other computer‐controlled techniques.
Agreements and disagreements with other studies or reviews
Our results are consistent with one meta‐analysis that found that prophylactic ondansetron reduces the incidence of spinal induced hypotension (Gao 2015). This meta‐analysis also suggested that given the large heterogeneity and small sample sizes, there should be further large and high‐quality randomised trials investigating the efficacy of ondansetron for preventing hypotension in this setting.
Our results are also consistent with a systematic review that found limited evidence to support or clearly disprove the value of maternal positioning, including the use of table tilting and wedges (Cluver 2013). They also found that manual displacement of the uterus may be better than a left lateral tilt, but larger studies need to confirm this – a conclusion consistent with our results.
Finally, a recent review determined the effects of colloids and crystalloids in the incidence of hypotension induced by spinal anaesthesia in elective caesarean section and also showed that colloid administration reduced the incidence of hypotension associated with spinal anaesthesia in elective caesarean section compared with crystalloid use (Rippoles 2015). However, these authors make no mention of the serious potential risks that colloid administration may represent or the additional costs involved. Indeed, a recent Cochrane Review found no evidence that resuscitation with colloids reduces the risk of death compared to resuscitation with crystalloids in patients with trauma, burns, or following surgery. The review authors suggest that as colloids were no more effective for preventing mortality than crystalloid and were considerably more expensive, it is hard to see any justification for their continued use in clinical practice (Perel 2013).

Risk of bias graph: review authors' judgements about each risk of bias item presented as percentages across all included studies.

Risk of bias summary: review authors' judgements about each risk of bias item for each included study.
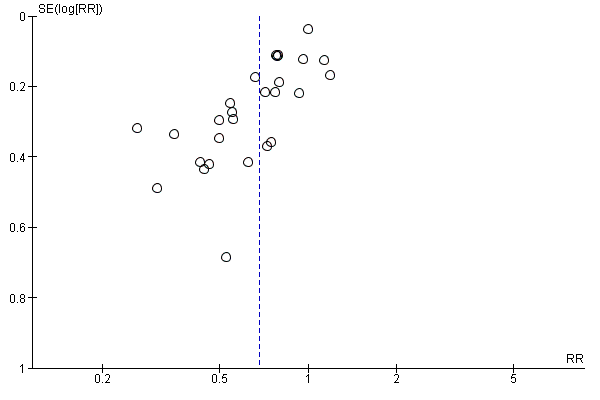
Funnel plot of comparison: 7 Colloid vs crystalloid, outcome: 7.1 Women with hypotension requiring intervention.

Funnel plot of comparison: 13 Ephedrine vs control, outcome: 13.1 Women with hypotension requiring intervention.
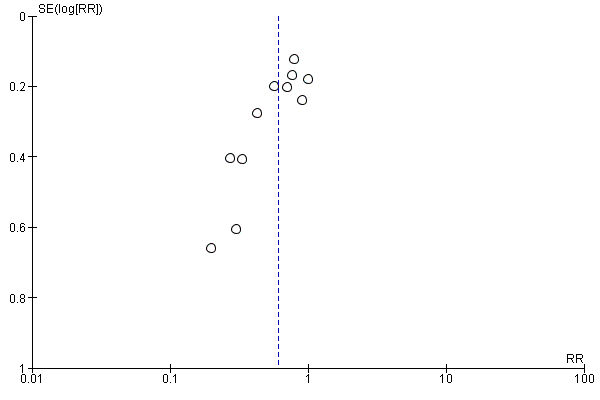
Funnel plot of comparison: 47 Lower limb compression vs control, outcome: 47.1 Women with hypotension requiring intervention.

Comparison 1 Crystalloid vs control, Outcome 1 Women with hypotension requiring intervention.
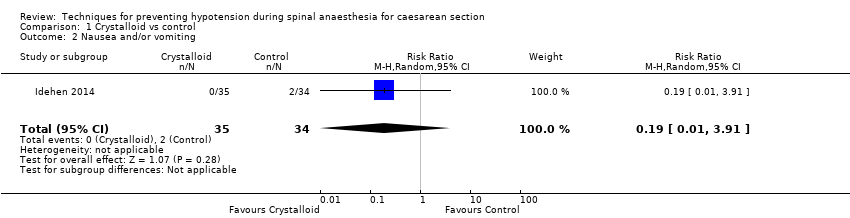
Comparison 1 Crystalloid vs control, Outcome 2 Nausea and/or vomiting.

Comparison 1 Crystalloid vs control, Outcome 3 Anaphylaxis.

Comparison 1 Crystalloid vs control, Outcome 4 Apgar < 8 at 5 min.

Comparison 2 Crystalloid: rapid infusion vs slow infusion, Outcome 1 Women with hypotension requiring intervention.

Comparison 3 Crystalloid: high vs low preload volume, Outcome 1 Women with hypotension requiring intervention.
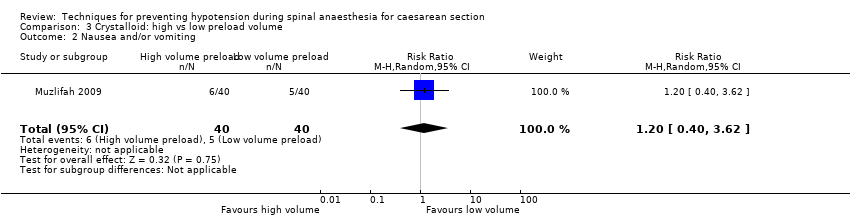
Comparison 3 Crystalloid: high vs low preload volume, Outcome 2 Nausea and/or vomiting.
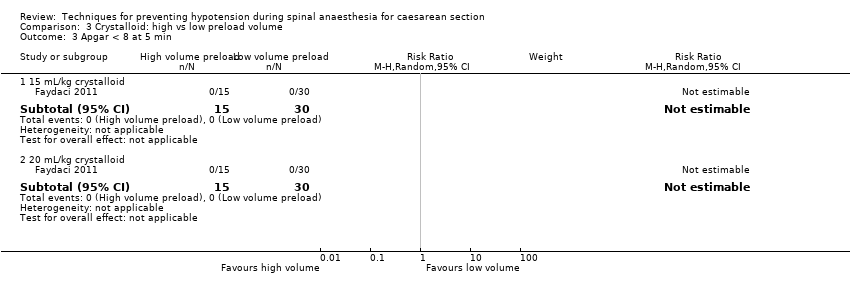
Comparison 3 Crystalloid: high vs low preload volume, Outcome 3 Apgar < 8 at 5 min.
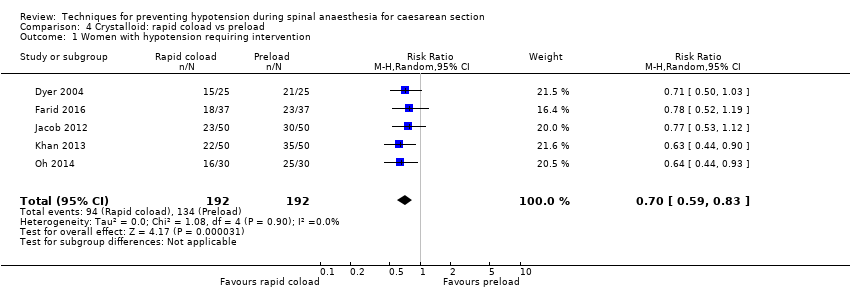
Comparison 4 Crystalloid: rapid coload vs preload, Outcome 1 Women with hypotension requiring intervention.

Comparison 4 Crystalloid: rapid coload vs preload, Outcome 2 Hypertension requiring intervention.

Comparison 4 Crystalloid: rapid coload vs preload, Outcome 3 Women with bradycardia.
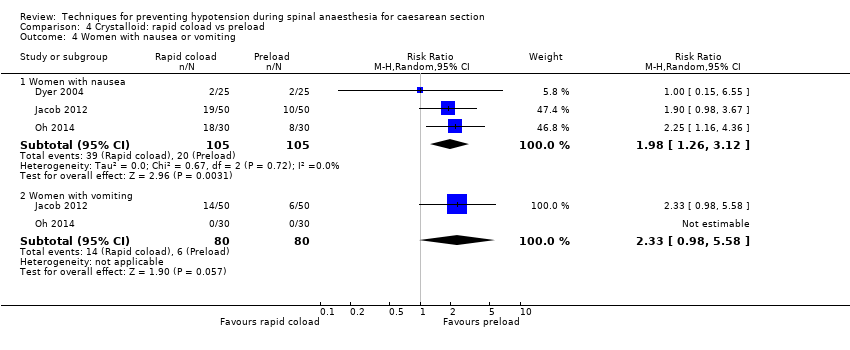
Comparison 4 Crystalloid: rapid coload vs preload, Outcome 4 Women with nausea or vomiting.
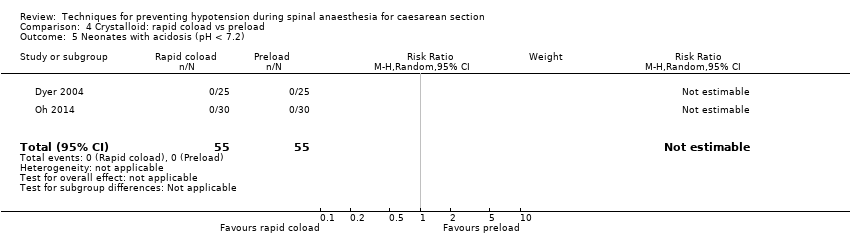
Comparison 4 Crystalloid: rapid coload vs preload, Outcome 5 Neonates with acidosis (pH < 7.2).

Comparison 4 Crystalloid: rapid coload vs preload, Outcome 6 Apgar < 8 at 5 min.

Comparison 5 Crystalloid: warm vs cold, Outcome 1 Women with hypotension requiring intervention.
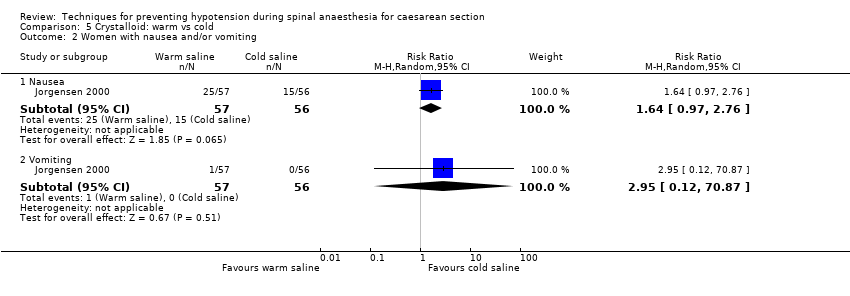
Comparison 5 Crystalloid: warm vs cold, Outcome 2 Women with nausea and/or vomiting.
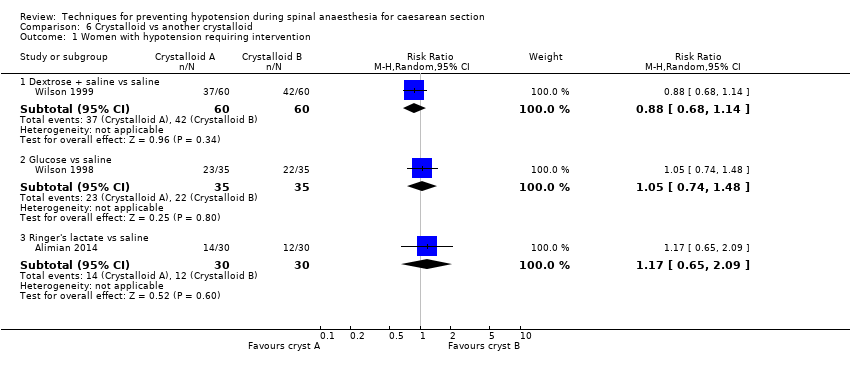
Comparison 6 Crystalloid vs another crystalloid, Outcome 1 Women with hypotension requiring intervention.
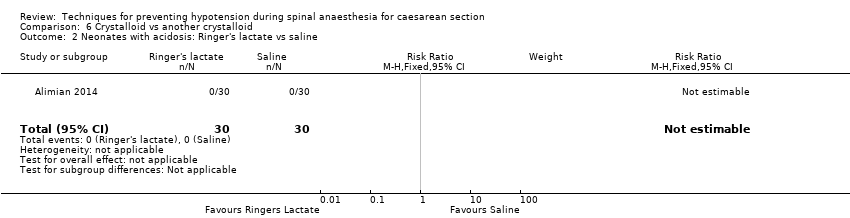
Comparison 6 Crystalloid vs another crystalloid, Outcome 2 Neonates with acidosis: Ringer's lactate vs saline.

Comparison 6 Crystalloid vs another crystalloid, Outcome 3 Neonates with acidosis: dextrose vs saline.

Comparison 6 Crystalloid vs another crystalloid, Outcome 4 Neonates with Apgar score < 7 at 5 min.
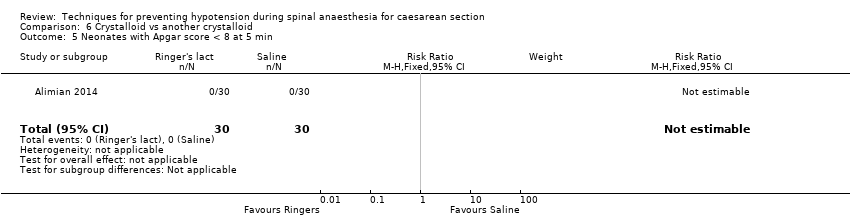
Comparison 6 Crystalloid vs another crystalloid, Outcome 5 Neonates with Apgar score < 8 at 5 min.
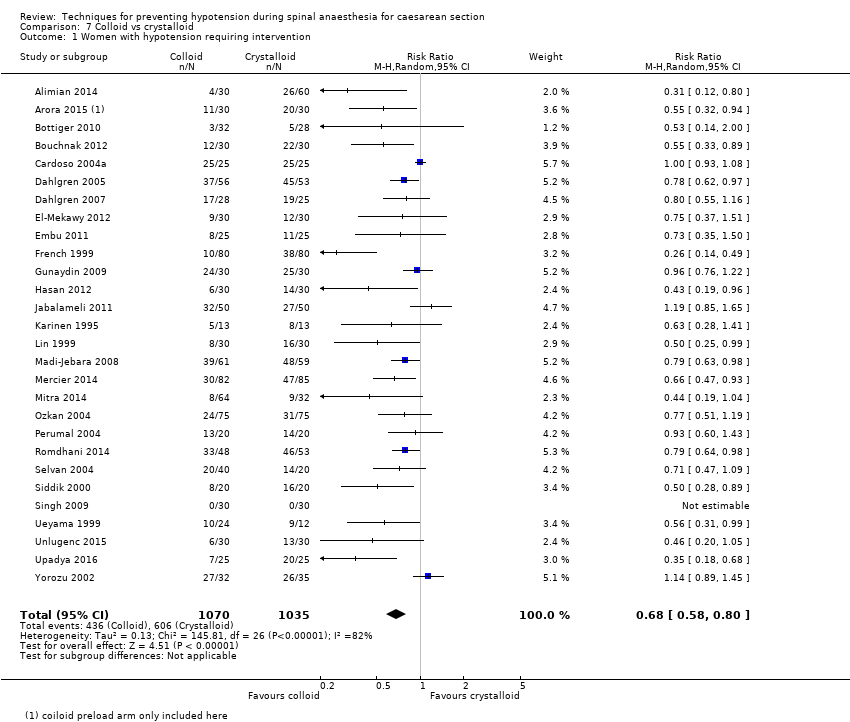
Comparison 7 Colloid vs crystalloid, Outcome 1 Women with hypotension requiring intervention.
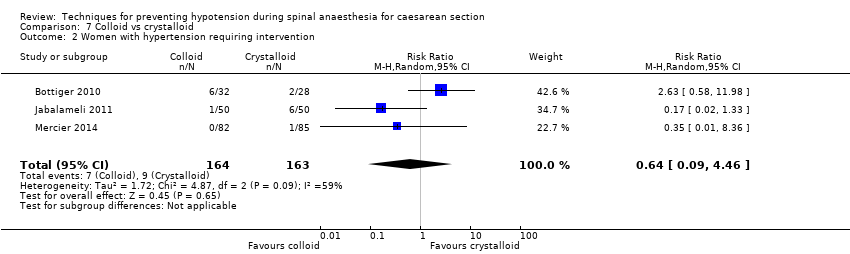
Comparison 7 Colloid vs crystalloid, Outcome 2 Women with hypertension requiring intervention.

Comparison 7 Colloid vs crystalloid, Outcome 3 Women with cardiac dysrhythmia.

Comparison 7 Colloid vs crystalloid, Outcome 4 Women with nausea and/or vomiting.
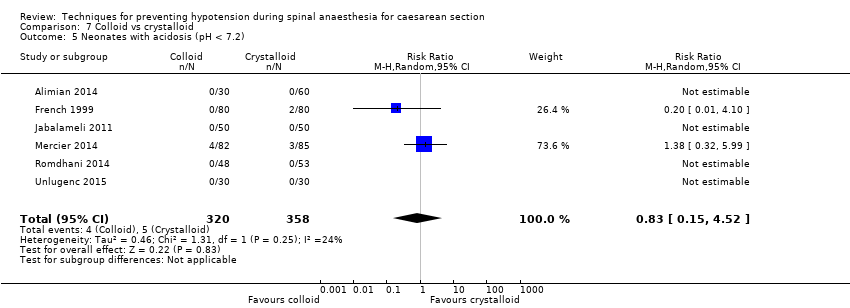
Comparison 7 Colloid vs crystalloid, Outcome 5 Neonates with acidosis (pH < 7.2).

Comparison 7 Colloid vs crystalloid, Outcome 6 Neonates: Apgar score.
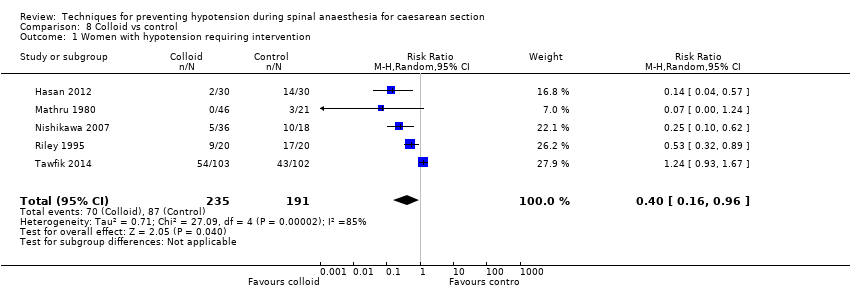
Comparison 8 Colloid vs control, Outcome 1 Women with hypotension requiring intervention.

Comparison 8 Colloid vs control, Outcome 2 Women with bradycardia.
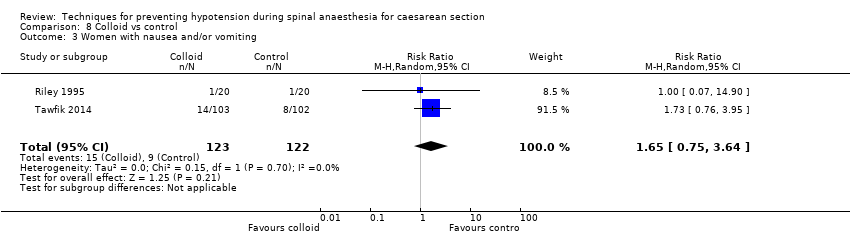
Comparison 8 Colloid vs control, Outcome 3 Women with nausea and/or vomiting.

Comparison 8 Colloid vs control, Outcome 4 Neonates with acidosis (pH < 7.2).

Comparison 8 Colloid vs control, Outcome 5 Neonates with Apgar score < 7 at 5 min.

Comparison 8 Colloid vs control, Outcome 6 Neonatal Apgar < 8 at 5 min.
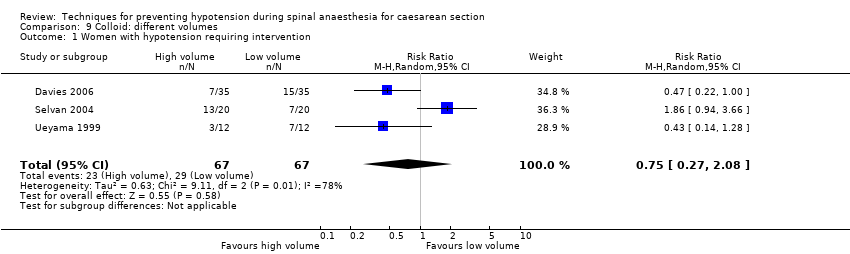
Comparison 9 Colloid: different volumes, Outcome 1 Women with hypotension requiring intervention.

Comparison 9 Colloid: different volumes, Outcome 2 Apgar < 9 at 5 min.

Comparison 10 Colloid preload vs colloid coload, Outcome 1 Women with hypotension requiring intervention.
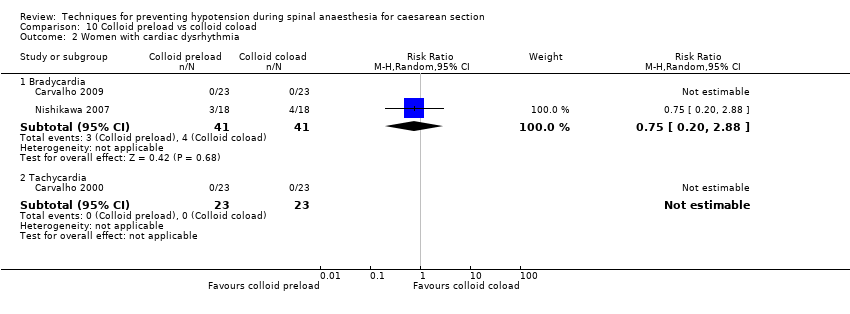
Comparison 10 Colloid preload vs colloid coload, Outcome 2 Women with cardiac dysrhythmia.

Comparison 10 Colloid preload vs colloid coload, Outcome 3 Women with nausea and/or vomiting.

Comparison 10 Colloid preload vs colloid coload, Outcome 4 Women with anaphylaxis.
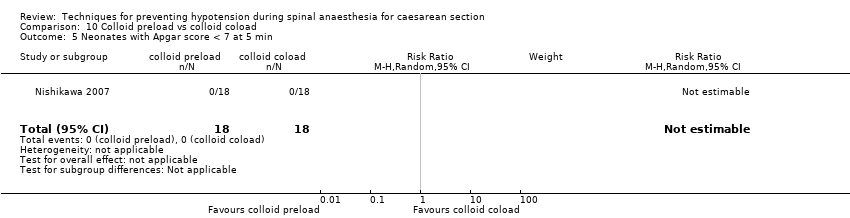
Comparison 10 Colloid preload vs colloid coload, Outcome 5 Neonates with Apgar score < 7 at 5 min.

Comparison 11 Colloid + crystalloid vs another colloid + crystalloid, Outcome 1 Women with hypotension requiring intervention.
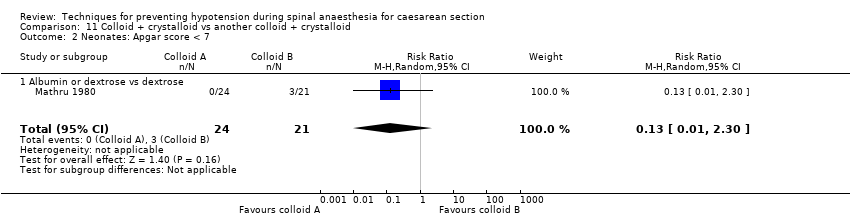
Comparison 11 Colloid + crystalloid vs another colloid + crystalloid, Outcome 2 Neonates: Apgar score < 7.

Comparison 11 Colloid + crystalloid vs another colloid + crystalloid, Outcome 3 Neonates with Apgar score < 8 at 5 min.
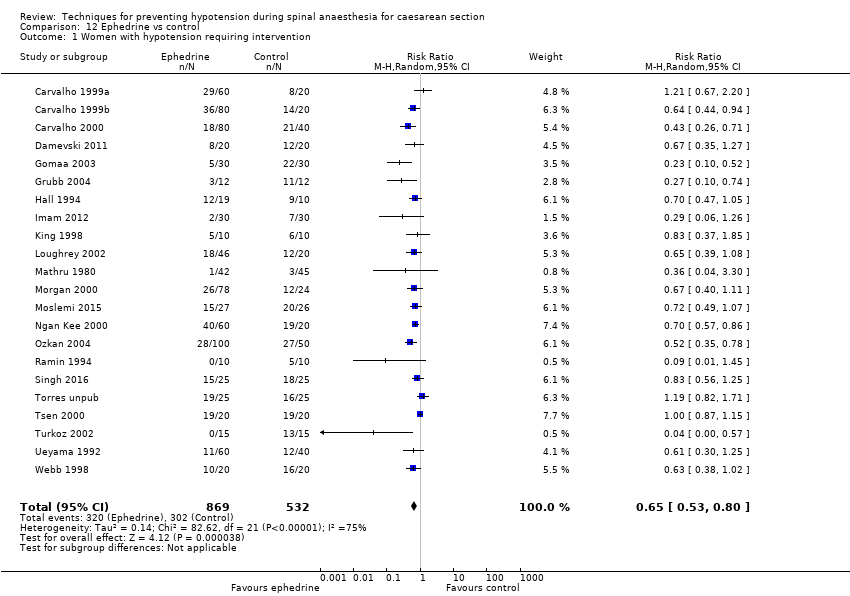
Comparison 12 Ephedrine vs control, Outcome 1 Women with hypotension requiring intervention.
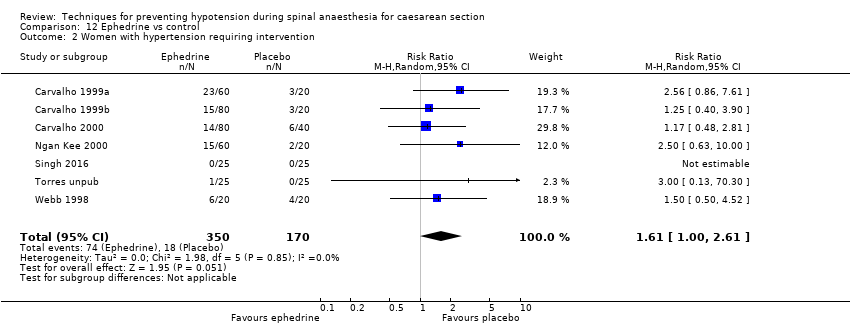
Comparison 12 Ephedrine vs control, Outcome 2 Women with hypertension requiring intervention.

Comparison 12 Ephedrine vs control, Outcome 3 Women with cardiac arrhythmia.
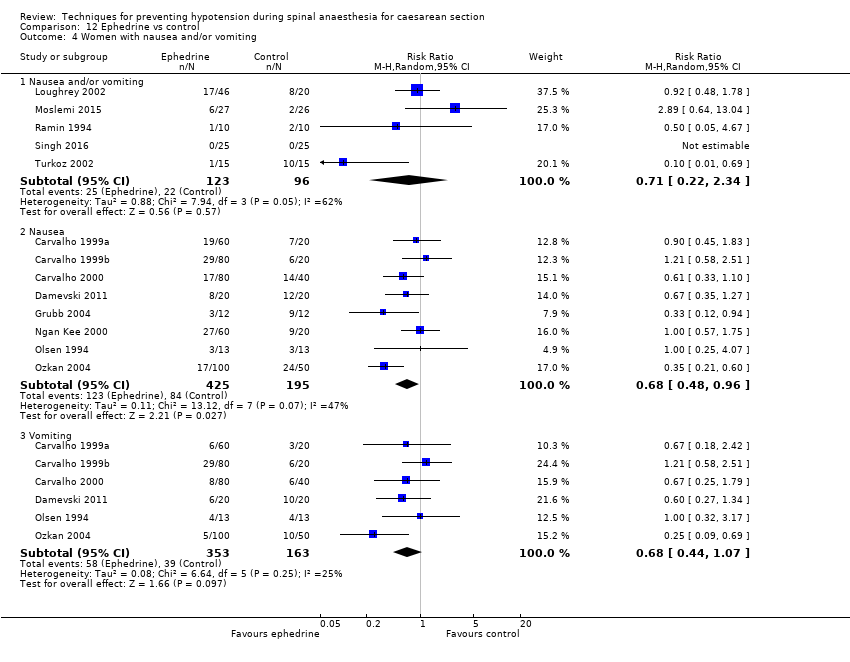
Comparison 12 Ephedrine vs control, Outcome 4 Women with nausea and/or vomiting.

Comparison 12 Ephedrine vs control, Outcome 5 Neonates with acidosis (pH < 7.2).

Comparison 12 Ephedrine vs control, Outcome 6 Neonates: Apgar score.

Comparison 13 Ephedrine vs crystalloid, Outcome 1 Women with hypotension requiring intervention.
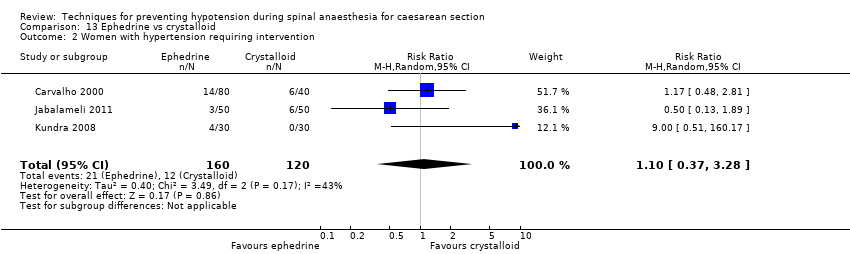
Comparison 13 Ephedrine vs crystalloid, Outcome 2 Women with hypertension requiring intervention.

Comparison 13 Ephedrine vs crystalloid, Outcome 3 Women with bradycardia.

Comparison 13 Ephedrine vs crystalloid, Outcome 4 Women with nausea and/or vomiting.

Comparison 13 Ephedrine vs crystalloid, Outcome 5 Women with impaired consciousness.
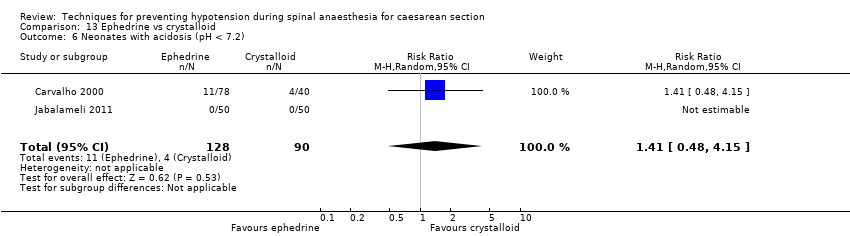
Comparison 13 Ephedrine vs crystalloid, Outcome 6 Neonates with acidosis (pH < 7.2).
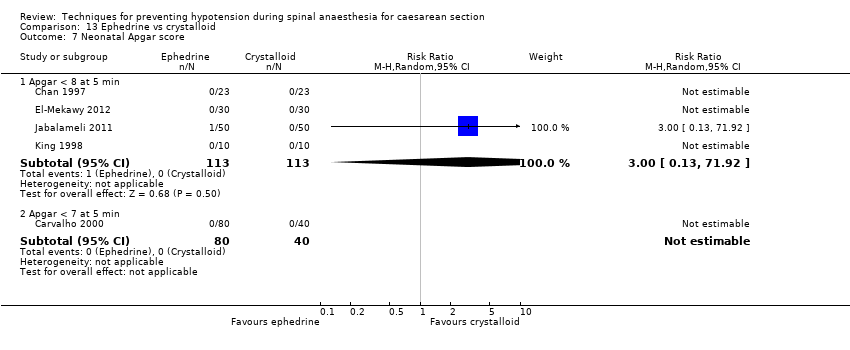
Comparison 13 Ephedrine vs crystalloid, Outcome 7 Neonatal Apgar score.

Comparison 14 Ephedrine + crystalloid vs colloid, Outcome 1 Women with hypotension requiring intervention.
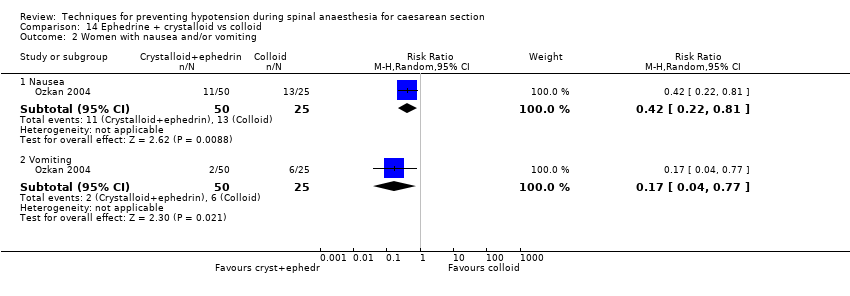
Comparison 14 Ephedrine + crystalloid vs colloid, Outcome 2 Women with nausea and/or vomiting.
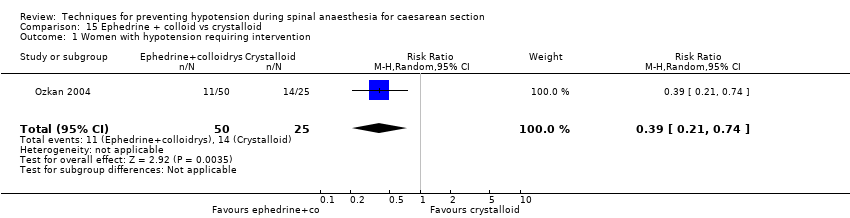
Comparison 15 Ephedrine + colloid vs crystalloid, Outcome 1 Women with hypotension requiring intervention.
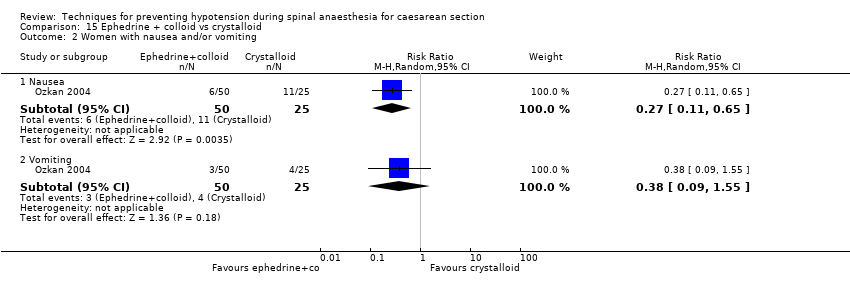
Comparison 15 Ephedrine + colloid vs crystalloid, Outcome 2 Women with nausea and/or vomiting.

Comparison 16 Ephedrine vs phenylephrine, Outcome 1 Women with hypotension requiring intervention.

Comparison 16 Ephedrine vs phenylephrine, Outcome 2 Women with hypertension requiring intervention.

Comparison 16 Ephedrine vs phenylephrine, Outcome 3 Cardiac dysrhythmia.

Comparison 16 Ephedrine vs phenylephrine, Outcome 4 Women with nausea and/or vomiting.
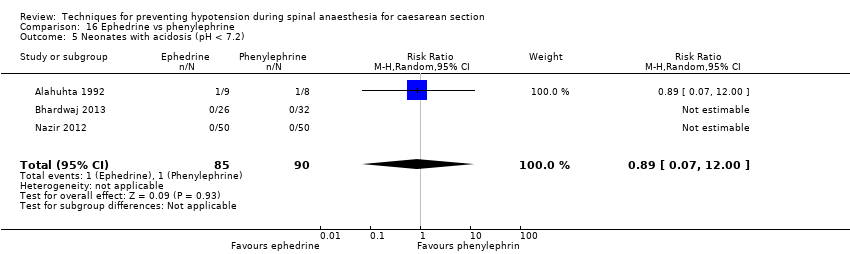
Comparison 16 Ephedrine vs phenylephrine, Outcome 5 Neonates with acidosis (pH < 7.2).

Comparison 16 Ephedrine vs phenylephrine, Outcome 6 Neonates with Apgar score < 8 at 5 min.

Comparison 17 Ephedrine vs angiotensin, Outcome 1 Women with hypotension requiring intervention.

Comparison 17 Ephedrine vs angiotensin, Outcome 2 Women with nausea and/or vomiting.

Comparison 17 Ephedrine vs angiotensin, Outcome 3 Neonates with acidosis (pH < 7.2).

Comparison 18 Ephedrine vs colloid, Outcome 1 Women with hypotension requiring intervention.

Comparison 18 Ephedrine vs colloid, Outcome 2 Women with hypertension requiring intervention.

Comparison 18 Ephedrine vs colloid, Outcome 3 Women with bradycardia.
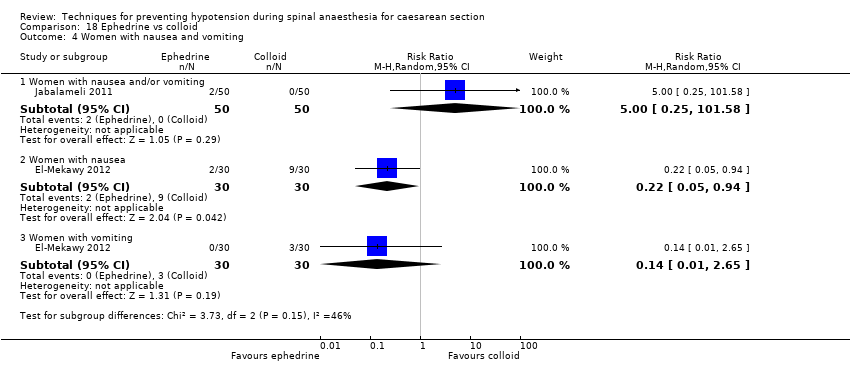
Comparison 18 Ephedrine vs colloid, Outcome 4 Women with nausea and vomiting.

Comparison 18 Ephedrine vs colloid, Outcome 5 5 Neonates with acidosis (pH < 7.2).

Comparison 18 Ephedrine vs colloid, Outcome 6 Apgar score < 8 at 5 min.

Comparison 19 Ephedrine vs metaraminol, Outcome 1 Women with hypotension requiring intervention.
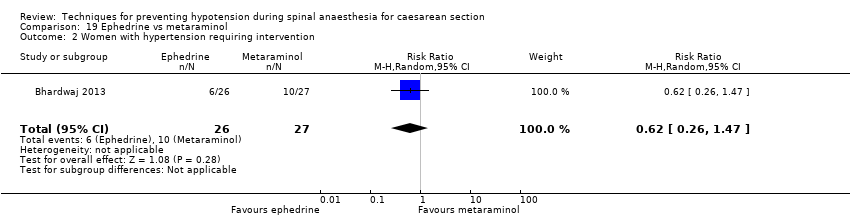
Comparison 19 Ephedrine vs metaraminol, Outcome 2 Women with hypertension requiring intervention.

Comparison 19 Ephedrine vs metaraminol, Outcome 3 Women with bradycardia.
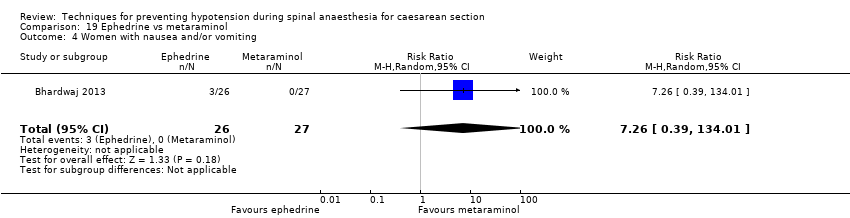
Comparison 19 Ephedrine vs metaraminol, Outcome 4 Women with nausea and/or vomiting.
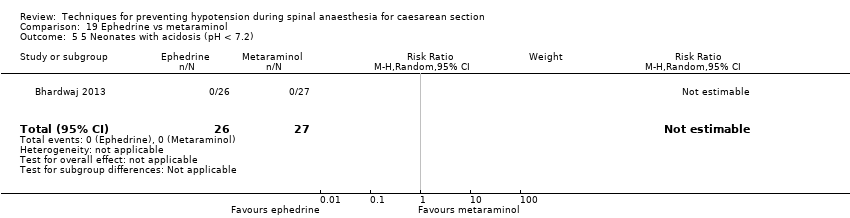
Comparison 19 Ephedrine vs metaraminol, Outcome 5 5 Neonates with acidosis (pH < 7.2).

Comparison 19 Ephedrine vs metaraminol, Outcome 6 Neonatal Apgar score < 8 at 5 min.

Comparison 20 Ephedrine: different doses, Outcome 1 Women with hypotension requiring intervention.

Comparison 20 Ephedrine: different doses, Outcome 2 Women with hypertension requiring intervention.

Comparison 20 Ephedrine: different doses, Outcome 3 Women with nausea and/or vomiting.
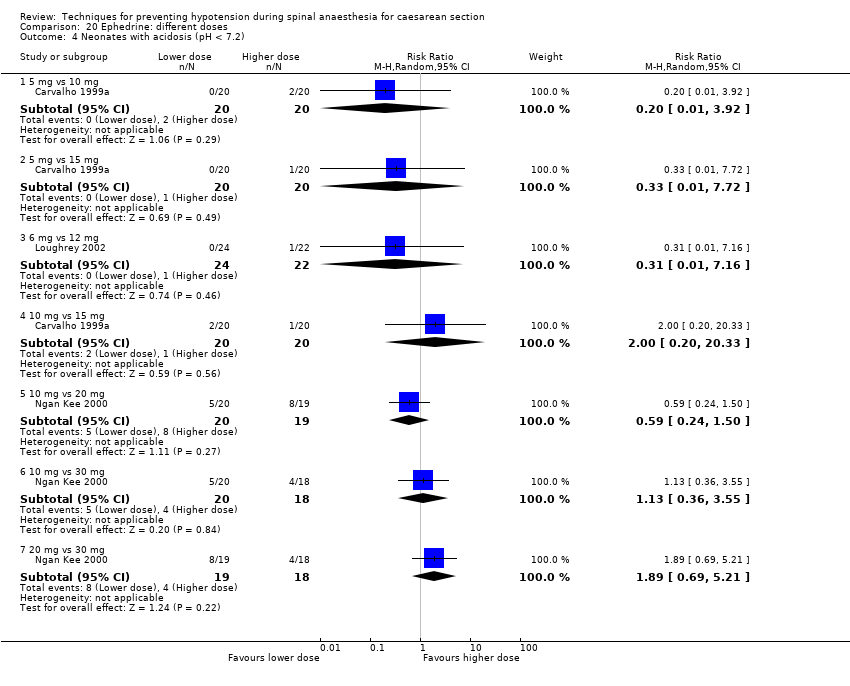
Comparison 20 Ephedrine: different doses, Outcome 4 Neonates with acidosis (pH < 7.2).
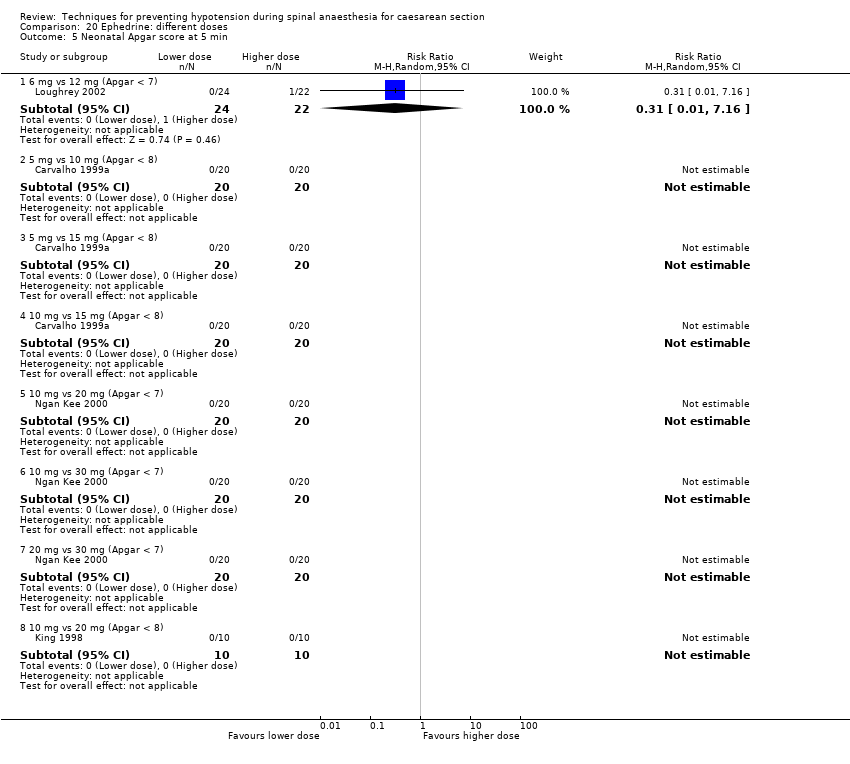
Comparison 20 Ephedrine: different doses, Outcome 5 Neonatal Apgar score at 5 min.

Comparison 21 Ephedrine: different rates, Outcome 1 Women with hypotension requiring intervention.

Comparison 21 Ephedrine: different rates, Outcome 2 Women with hypertension requiring intervention.

Comparison 21 Ephedrine: different rates, Outcome 3 Women with bradycardia.

Comparison 21 Ephedrine: different rates, Outcome 4 Women with nausea and/or vomiting.
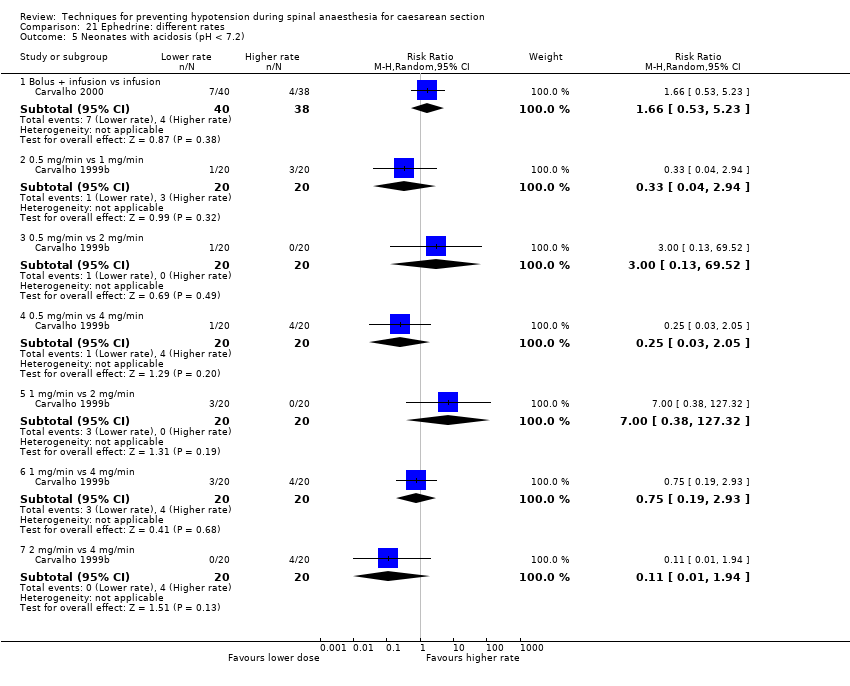
Comparison 21 Ephedrine: different rates, Outcome 5 Neonates with acidosis (pH < 7.2).

Comparison 21 Ephedrine: different rates, Outcome 6 Neonatal Apgar score at 5 min.

Comparison 22 Ephedrine: oral vs IM or IV, Outcome 1 Women with hypotension requiring intervention.
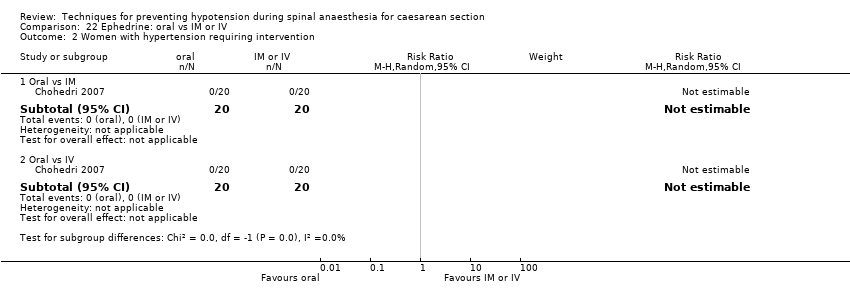
Comparison 22 Ephedrine: oral vs IM or IV, Outcome 2 Women with hypertension requiring intervention.

Comparison 22 Ephedrine: oral vs IM or IV, Outcome 3 Women with nausea and vomiting.
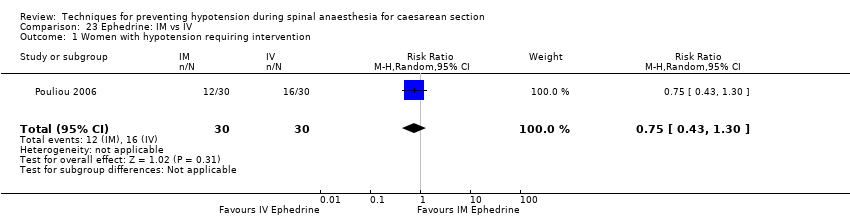
Comparison 23 Ephedrine: IM vs IV, Outcome 1 Women with hypotension requiring intervention.

Comparison 23 Ephedrine: IM vs IV, Outcome 2 Women with hypertension requiring intervention.

Comparison 23 Ephedrine: IM vs IV, Outcome 3 Apgar < 8 at 5 min.

Comparison 24 Phenylephrine vs control, Outcome 1 Women with hypotension requiring intervention.

Comparison 24 Phenylephrine vs control, Outcome 2 Women with cardiac dysrhythmia.

Comparison 24 Phenylephrine vs control, Outcome 3 Women with nausea and/or vomiting.

Comparison 24 Phenylephrine vs control, Outcome 4 Neonates with acidosis (pH < 7.2).
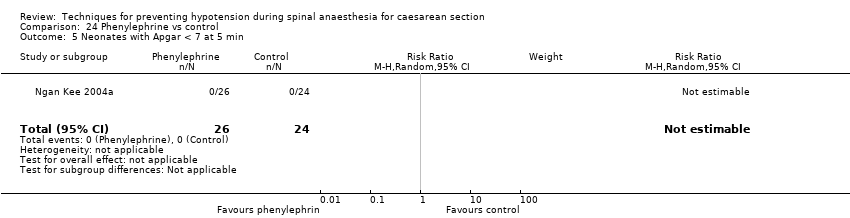
Comparison 24 Phenylephrine vs control, Outcome 5 Neonates with Apgar < 7 at 5 min.

Comparison 24 Phenylephrine vs control, Outcome 6 Neonates with Apgar < 8 at 5 min.
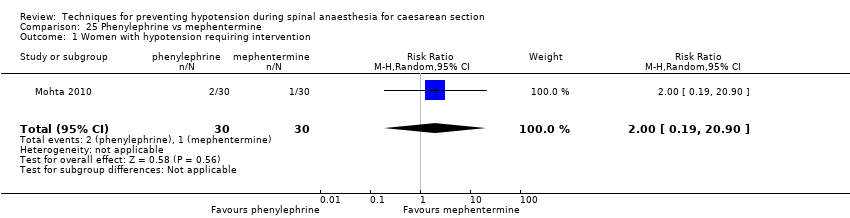
Comparison 25 Phenylephrine vs mephentermine, Outcome 1 Women with hypotension requiring intervention.
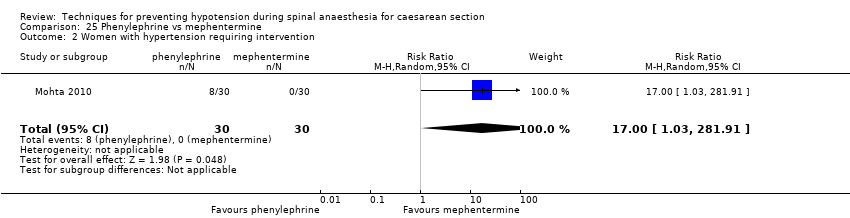
Comparison 25 Phenylephrine vs mephentermine, Outcome 2 Women with hypertension requiring intervention.

Comparison 25 Phenylephrine vs mephentermine, Outcome 3 Cardiac dysrhythmia.

Comparison 25 Phenylephrine vs mephentermine, Outcome 4 Nausea and/or vomiting.

Comparison 26 Phenylephrine vs metaraminol, Outcome 1 Women with hypotension requiring intervention.
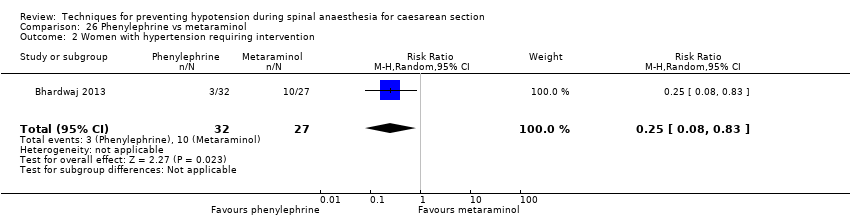
Comparison 26 Phenylephrine vs metaraminol, Outcome 2 Women with hypertension requiring intervention.

Comparison 26 Phenylephrine vs metaraminol, Outcome 3 Women with bradycardia.

Comparison 26 Phenylephrine vs metaraminol, Outcome 4 Women with nausea and/or vomiting.

Comparison 26 Phenylephrine vs metaraminol, Outcome 5 Neonatal pH < 7.2.
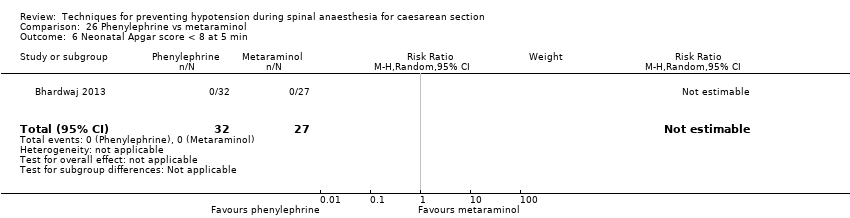
Comparison 26 Phenylephrine vs metaraminol, Outcome 6 Neonatal Apgar score < 8 at 5 min.
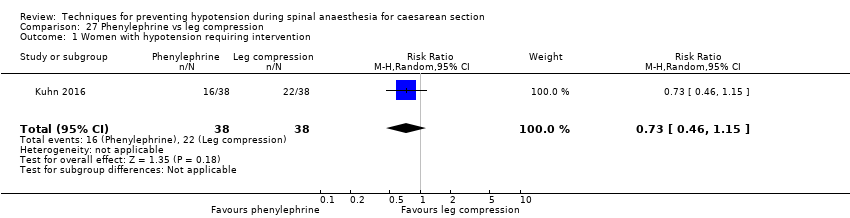
Comparison 27 Phenylephrine vs leg compression, Outcome 1 Women with hypotension requiring intervention.
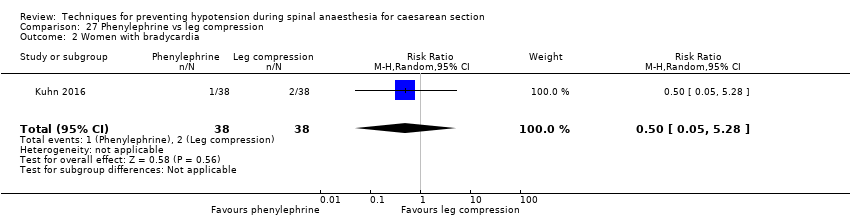
Comparison 27 Phenylephrine vs leg compression, Outcome 2 Women with bradycardia.

Comparison 27 Phenylephrine vs leg compression, Outcome 3 Women with nausea and/or vomiting.

Comparison 28 Phenylephrine: infusion vs bolus, Outcome 1 Women with hypotension requiring intervention.

Comparison 28 Phenylephrine: infusion vs bolus, Outcome 2 Women with cardiac dysrhythmia.
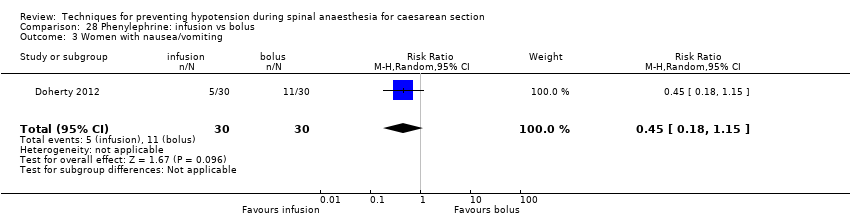
Comparison 28 Phenylephrine: infusion vs bolus, Outcome 3 Women with nausea/vomiting.

Comparison 28 Phenylephrine: infusion vs bolus, Outcome 4 Neonatal Apgar score < 8 at 5 min.
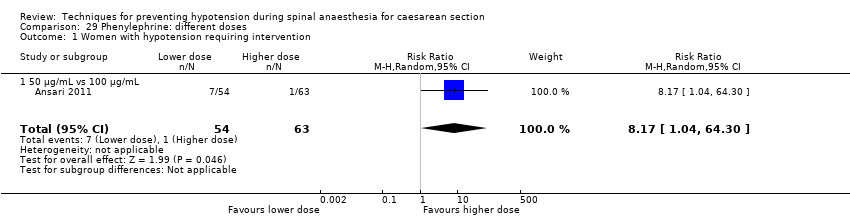
Comparison 29 Phenylephrine: different doses, Outcome 1 Women with hypotension requiring intervention.
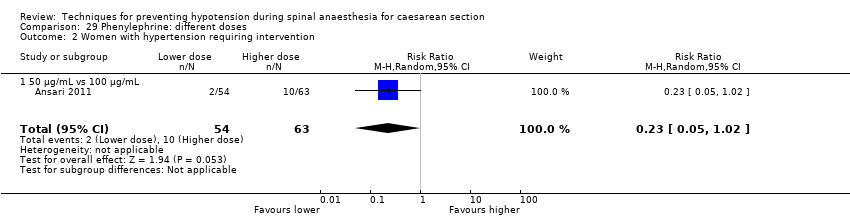
Comparison 29 Phenylephrine: different doses, Outcome 2 Women with hypertension requiring intervention.

Comparison 29 Phenylephrine: different doses, Outcome 3 Women with cardiac dysrhythmia.
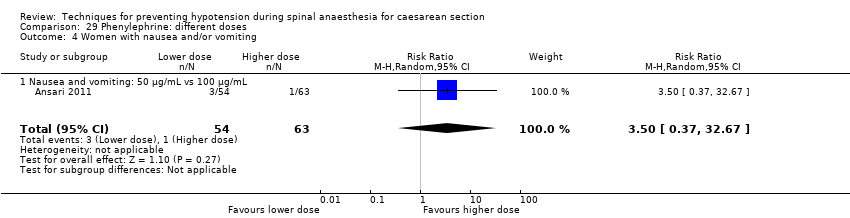
Comparison 29 Phenylephrine: different doses, Outcome 4 Women with nausea and/or vomiting.

Comparison 29 Phenylephrine: different doses, Outcome 5 Neonatal cord blood pH < 7.2.

Comparison 29 Phenylephrine: different doses, Outcome 6 Neonatal Apgar score < 8 at 5 min.

Comparison 30 Glycopyrrolate vs control, Outcome 1 Women with hypotension requiring intervention.
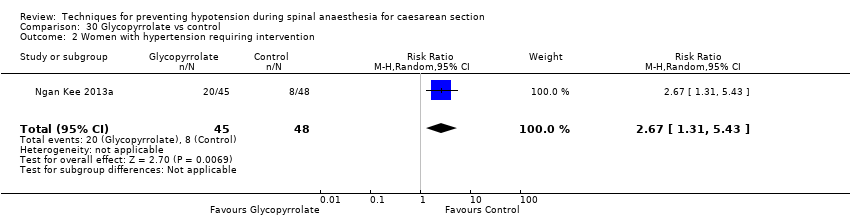
Comparison 30 Glycopyrrolate vs control, Outcome 2 Women with hypertension requiring intervention.
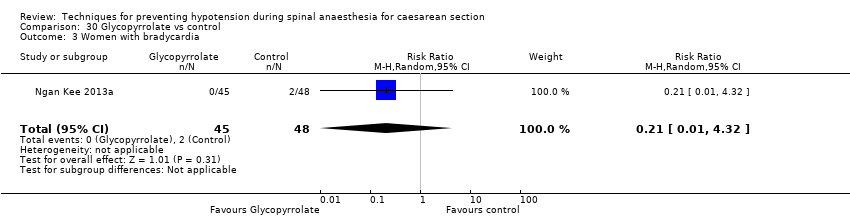
Comparison 30 Glycopyrrolate vs control, Outcome 3 Women with bradycardia.
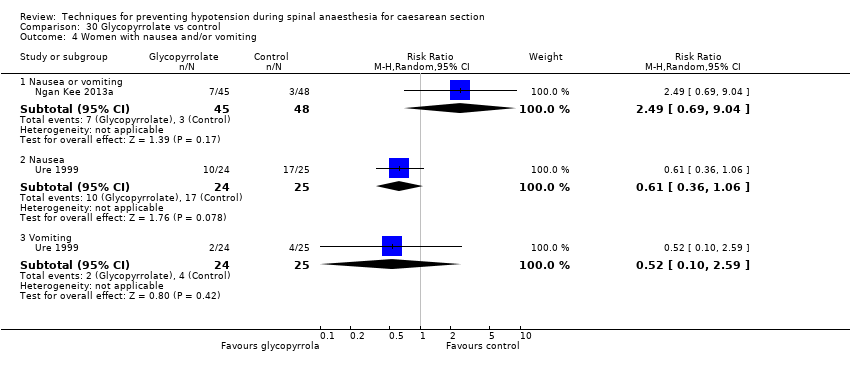
Comparison 30 Glycopyrrolate vs control, Outcome 4 Women with nausea and/or vomiting.

Comparison 30 Glycopyrrolate vs control, Outcome 5 Neonates with Apgar score < 8 at 5 min.

Comparison 31 Ondansetron vs control, Outcome 1 Women with hypotension requiring intervention.
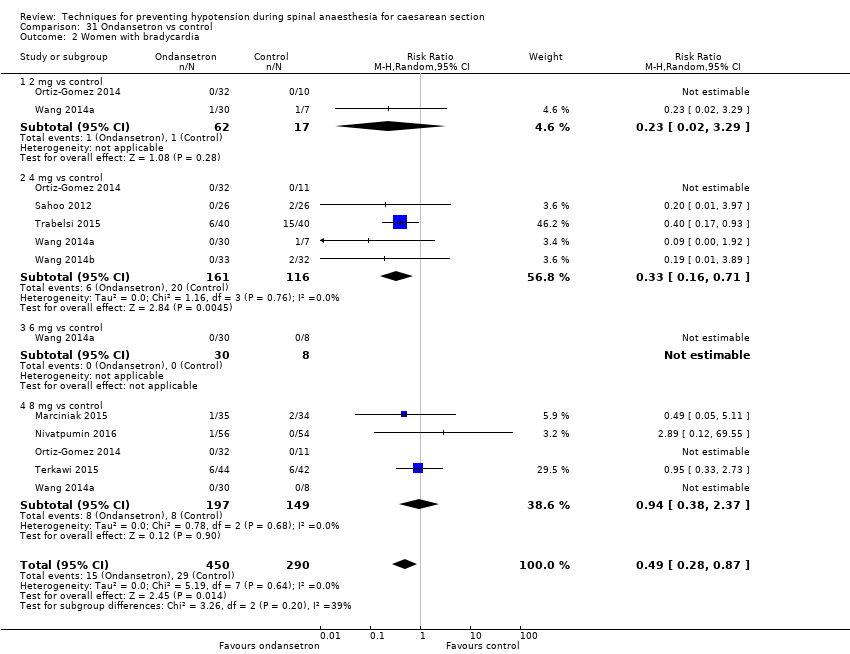
Comparison 31 Ondansetron vs control, Outcome 2 Women with bradycardia.

Comparison 31 Ondansetron vs control, Outcome 3 Women with nausea or vomiting.
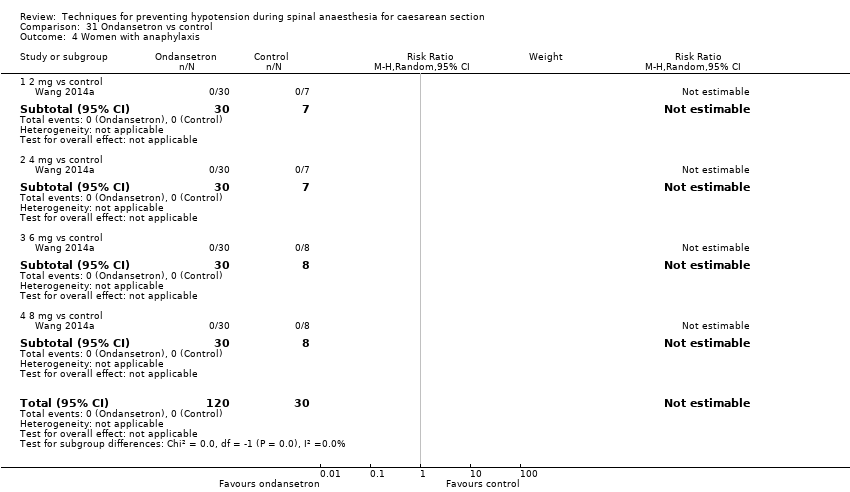
Comparison 31 Ondansetron vs control, Outcome 4 Women with anaphylaxis.
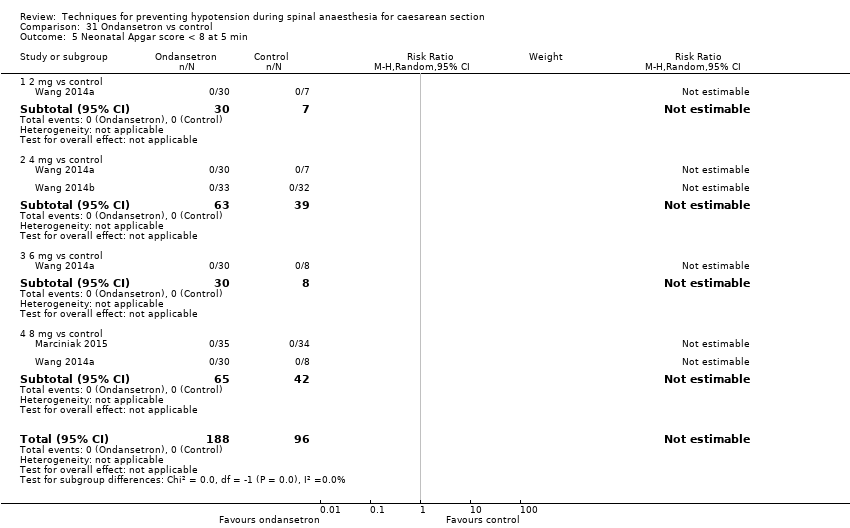
Comparison 31 Ondansetron vs control, Outcome 5 Neonatal Apgar score < 8 at 5 min.

Comparison 31 Ondansetron vs control, Outcome 6 Neonatal pH < 7.2.

Comparison 32 Ondansetron vs ephedrine, Outcome 1 Women with hypotension requiring intervention.
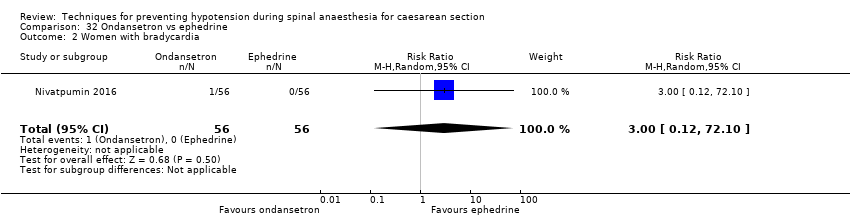
Comparison 32 Ondansetron vs ephedrine, Outcome 2 Women with bradycardia.
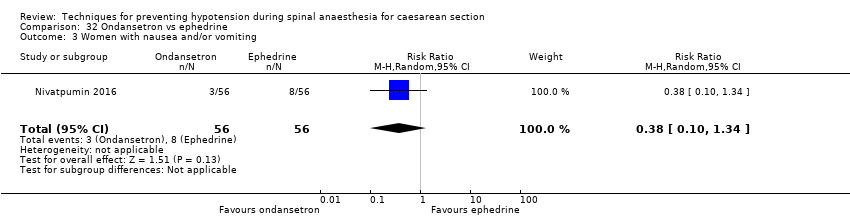
Comparison 32 Ondansetron vs ephedrine, Outcome 3 Women with nausea and/or vomiting.

Comparison 33 Granisetron vs control, Outcome 1 Women with hypotension requiring intervention.
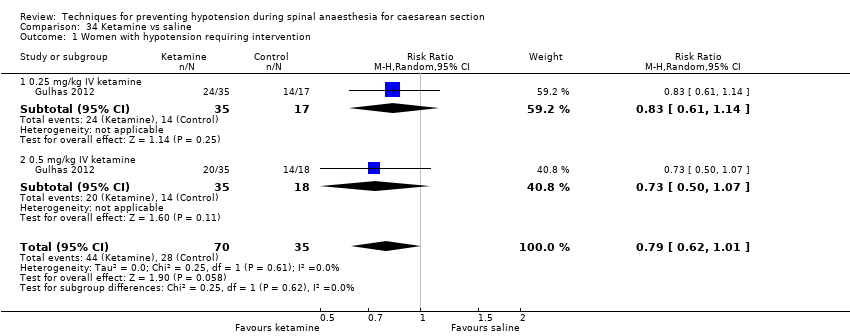
Comparison 34 Ketamine vs saline, Outcome 1 Women with hypotension requiring intervention.
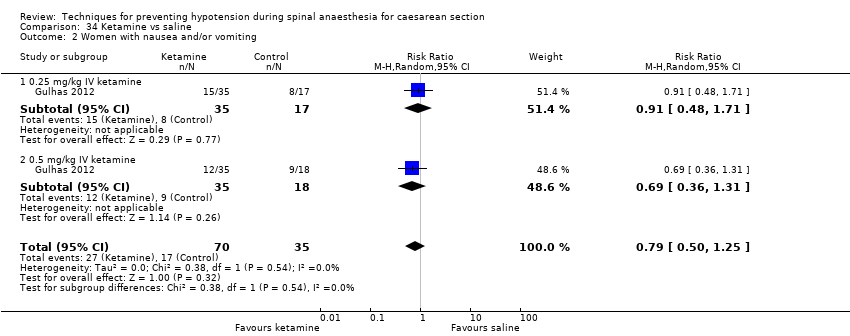
Comparison 34 Ketamine vs saline, Outcome 2 Women with nausea and/or vomiting.

Comparison 34 Ketamine vs saline, Outcome 3 Apgar score < 8 at 5 min.

Comparison 35 Angiotensin vs control, Outcome 1 Women with hypotension requiring intervention.

Comparison 35 Angiotensin vs control, Outcome 2 Women with nausea and/or vomiting.

Comparison 35 Angiotensin vs control, Outcome 3 Neonates with acidosis (pH < 7.2).

Comparison 36 Dopamine vs control, Outcome 1 Women with hypotension requiring intervention.

Comparison 36 Dopamine vs control, Outcome 2 Neonatal Apgar score < 8 at 5 min.

Comparison 37 Lower limb compression vs control, Outcome 1 Women with hypotension requiring intervention.

Comparison 37 Lower limb compression vs control, Outcome 2 Women with bradycardia.
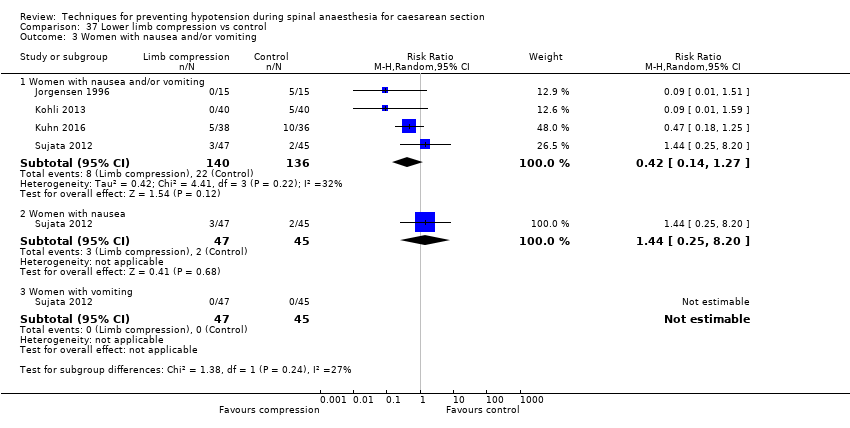
Comparison 37 Lower limb compression vs control, Outcome 3 Women with nausea and/or vomiting.

Comparison 37 Lower limb compression vs control, Outcome 4 Neonates with Apgar score < 8 at 5 min.

Comparison 38 Wedge vs supine, Outcome 1 Women with hypotension requiring intervention.

Comparison 38 Wedge vs supine, Outcome 2 Women with nausea and/or vomiting.
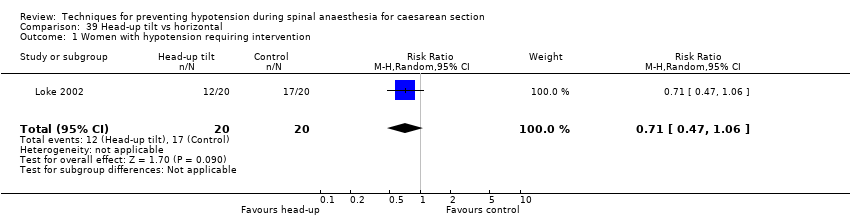
Comparison 39 Head‐up tilt vs horizontal, Outcome 1 Women with hypotension requiring intervention.

Comparison 39 Head‐up tilt vs horizontal, Outcome 2 Neonates with Apgar score < 8 at 5 min.
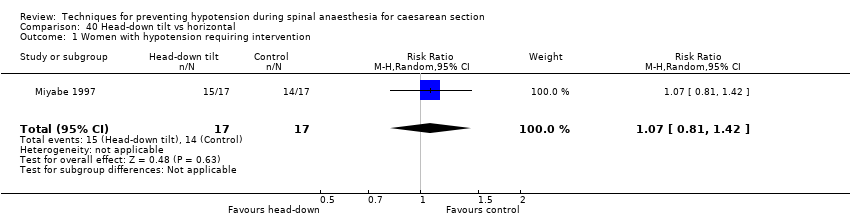
Comparison 40 Head‐down tilt vs horizontal, Outcome 1 Women with hypotension requiring intervention.

Comparison 41 Crawford's wedge vs manual uterine displacement, Outcome 1 Women with hypotension requiring intervention.

Comparison 41 Crawford's wedge vs manual uterine displacement, Outcome 2 Neonates with Apgar score < 8 at 5 min.

Comparison 42 Supine vs sitting, Outcome 1 Women with hypotension requiring intervention.

Comparison 42 Supine vs sitting, Outcome 2 Women with nausea and/or vomiting.

Comparison 42 Supine vs sitting, Outcome 3 Neonates with acidosis (pH < 7.2).

Comparison 42 Supine vs sitting, Outcome 4 Neonates with Apgar < 7 at 5 min.

Comparison 43 Walking vs lying, Outcome 1 Women requiring intervention for hypotension.

Comparison 44 Lateral vs supine wedged position, Outcome 1 Women with hypotension requiring intervention.

Comparison 44 Lateral vs supine wedged position, Outcome 2 Women with cardiac dysrhythmia requiring intervention.
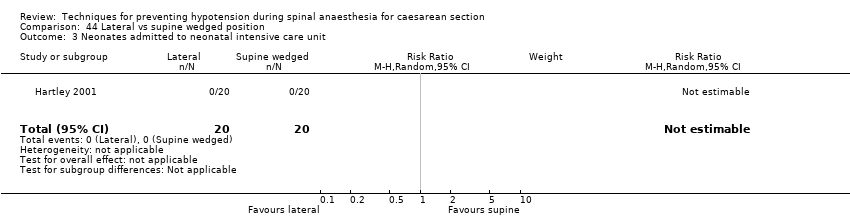
Comparison 44 Lateral vs supine wedged position, Outcome 3 Neonates admitted to neonatal intensive care unit.

Comparison 44 Lateral vs supine wedged position, Outcome 4 Women with nausea.
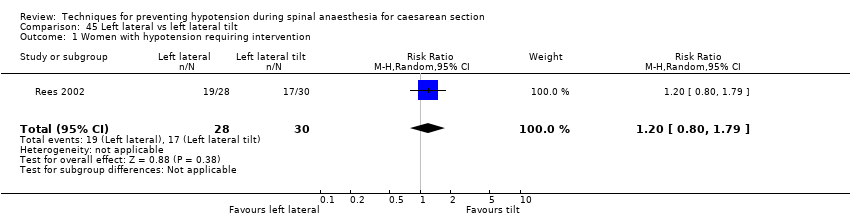
Comparison 45 Left lateral vs left lateral tilt, Outcome 1 Women with hypotension requiring intervention.

Comparison 45 Left lateral vs left lateral tilt, Outcome 2 Women with cardiac dysrhythmia requiring intervention.

Comparison 45 Left lateral vs left lateral tilt, Outcome 3 Women with nausea and/or vomiting.
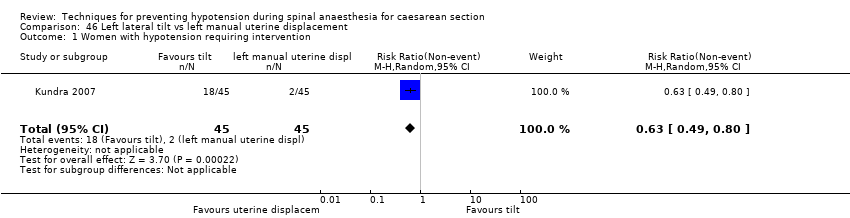
Comparison 46 Left lateral tilt vs left manual uterine displacement, Outcome 1 Women with hypotension requiring intervention.
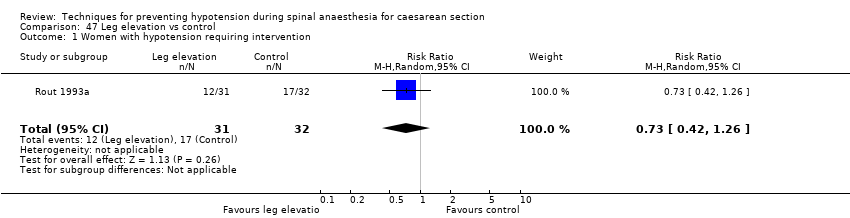
Comparison 47 Leg elevation vs control, Outcome 1 Women with hypotension requiring intervention.

Comparison 48 Acupressure vs placebo, Outcome 1 Women with hypotension requiring intervention.

Comparison 48 Acupressure vs placebo, Outcome 2 Women with nausea and/or vomiting.

Comparison 48 Acupressure vs placebo, Outcome 3 Neonates with Apgar < 7 at 5 min.
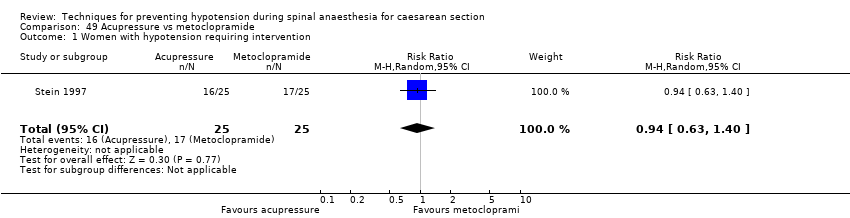
Comparison 49 Acupressure vs metoclopramide, Outcome 1 Women with hypotension requiring intervention.

Comparison 49 Acupressure vs metoclopramide, Outcome 2 Women with nausea and/or vomiting.

Comparison 49 Acupressure vs metoclopramide, Outcome 3 Neonates with Apgar < 7 at 5 min.
| Techniques for preventing hypotension during spinal anaesthesia for caesarean section | |||||
| Patient or population: women having spinal anaesthesia for caesarean section Setting: hospital (inpatient) Outcome: maternal hypotension requiring intervention | |||||
| Comparisons | Anticipated absolute effects* (95% CI) | Relative effect | № of participants | Quality of the evidence | |
| Risk with control | Risk with Intervention | ||||
| Crystalloid vs control | Control | Crystalloid | average RR 0.84 | 370 | ⊕⊕⊝⊝ |
| 535 per 1000 | 449 per 1000 | ||||
| Colloid vs crystalloid | Crystalloid | Colloid | average RR 0.68 (0.58 to 0.80) | 2105 | ⊕⊝⊝⊝ |
| 586 per 1000 | 398 per 1000 | ||||
| Ephedrine vs phenylephrine | Phenylephrine | Ephedrine | average RR 0.92 | 401 | ⊕⊝⊝⊝ |
| 465 per 1000 | 428 per 1000 | ||||
| Ondansetron vs control | Control | Ondansetron | average RR 0.67 | 740 | ⊕⊕⊝⊝ |
| 579 per 1000 | 388 per 1000 | ||||
| Lower limb compression vs control | Control | Lower limb compression | average RR 0.61 | 705 | ⊕⊝⊝⊝ |
| 663 per 1000 | 404 per 1000 | ||||
| Walking vs lying | Lying | Walking | RR 0.71 (0.41 to 1.21) | 37 (1 RCT) | ⊕⊝⊝⊝ Very lowf,g |
| 706 per 1000 | 501 per 1000 | ||||
| *The risk in the intervention group (and its 95% confidence interval) is based on the assumed risk in the comparison group and the relative effect of the intervention (and its 95% CI). | |||||
| GRADE Working Group grades of evidence | |||||
| aInclusion criteria not representative of wider population (e.g. only elective caesarean sections) (−1). | |||||
| Crystalloid versus control for preventing hypotension during spinal anaesthesia for caesarean section | |||||
| Patient or population: women having spinal anaesthesia for caesarean section | |||||
| Outcomes | Anticipated absolute effects* (95% CI) | Relative effect | № of participants | Quality of the evidence | |
| Risk with control | Risk with crystalloid | ||||
| Maternal hypotension requiring intervention | Study population | RR 0.84 | 370 | ⊕⊕⊝⊝ | |
| 535 per 1000 | 449 per 1000 | ||||
| Maternal hypertension requiring intervention | No studies reported this outcome. | ||||
| Maternal bradycardia requiring intervention | No studies reported this outcome. | ||||
| Maternal nausea and/or vomiting | Study population | RR 0.19 (0.01 to 3.91) | 69 (1 RCT) | ⊕⊝⊝⊝ Very lowa,c | |
| 59 per 1000 | 11 per 1000 (1 to 230) | ||||
| Neonatal acidosis as defined by cord or neonatal blood with a pH < 7.2 | No studies reported this outcome. | ||||
| Neonatal Apgar score < 8 at 5 minutes | Study population | Not estimable | 60 | ⊕⊕⊝⊝ | |
| 0 per 1000 | 0 per 1000 | ||||
| Admission to neonatal intensive care unit | No studies reported this outcome. | ||||
| *The risk in the intervention group (and its 95% confidence interval) is based on the assumed risk in the comparison group and the relative effect of the intervention (and its 95% CI). | |||||
| GRADE Working Group grades of evidence High quality: we are very confident that the true effect lies close to that of the estimate of the effect. | |||||
| aOnly elective caesarean sections included (−1). | |||||
| Colloid versus crystalloid for preventing hypotension during spinal anaesthesia for caesarean section | |||||
| Patient or population: women having spinal anaesthesia for caesarean section | |||||
| Outcomes | Anticipated absolute effects* (95% CI) | Relative effect | № of participants | Quality of the evidence | |
| Risk with crystalloid | Risk with colloid | ||||
| Maternal hypotension requiring intervention | Study population | RR 0.68 (0.58 to 0.80) | 2105 | ⊕⊝⊝⊝ | |
| 586 per 1000 | 398 per 1000 | ||||
| Maternal hypertension requiring intervention | Study population | RR 0.64 | 327 | ⊕⊝⊝⊝ | |
| 55 per 1000 | 35 per 1000 | ||||
| Maternal bradycardia requiring intervention | Study population | RR 0.99 | 509 | ⊕⊝⊝⊝ | |
| 76 per 1000 | 75 per 1000 | ||||
| Maternal nausea and/or vomiting | Study population | RR 0.83 | 1154 | ⊕⊝⊝⊝ | |
| 228 per 1000 | 189 per 1000 | ||||
| Neonatal acidosis as defined by cord or neonatal blood with a pH < 7.2 | Study population | RR 0.83 | 678 | ⊕⊝⊝⊝ | |
| 26 per 1000 | 21 per 1000 | ||||
| Neonatal Apgar score < 8 at 5 minutes | Study population | RR 0.24 | 826 | ⊕⊝⊝⊝ | |
| 10 per 1000 | 2 per 1000 | ||||
| Admission to neonatal intensive care unit | No studies reported this outcome. | ||||
| *The risk in the intervention group (and its 95% confidence interval) is based on the assumed risk in the comparison group and the relative effect of the intervention (and its 95% CI). | |||||
| GRADE Working Group grades of evidence High quality: we are very confident that the true effect lies close to that of the estimate of the effect. | |||||
| aDowngraded one level for serious risk of bias (due to unclear risk of selection bias in most included studies) (−1). | |||||
| Ephedrine versus phenylephrine for preventing hypotension during spinal anaesthesia for caesarean section | ||||||
| Patient or population: women having spinal anaesthesia for caesarean section | ||||||
| Outcomes | Anticipated absolute effects* (95% CI) | Relative effect | № of participants | Quality of the evidence | Comments | |
| Risk with phenylephrine | Risk with ephedrine | |||||
| Maternal hypotension requiring intervention | Study population | RR 0.92 | 401 | ⊕⊝⊝⊝ | — | |
| 465 per 1000 | 428 per 1000 | |||||
| Maternal hypertension requiring intervention | Study population | RR 1.72 | 118 | ⊕⊕⊝⊝ | — | |
| 113 per 1000 | 194 per 1000 | |||||
| Maternal bradycardia requiring intervention | Study population | RR 0.37 | 304 | ⊕⊕⊝⊝ | — | |
| 243 per 1000 | 90 per 1000 | |||||
| Maternal nausea and/or vomiting | Study population | RR 0.76 | 204 | ⊕⊝⊝⊝ | — | |
| 216 per 1000 | 164 per 1000 | |||||
| Neonatal acidosis as defined by cord or neonatal blood with a pH < 7.2 | Study population | RR 0.89 | 175 | ⊕⊕⊝⊝ | — | |
| 11 per 1000 | 10 per 1000 | |||||
| Neonatal Apgar score < 8 at 5 minutes | Study population | Not estimable | 321 | ⊕⊕⊝⊝ | No events observed in any studies. Relative effect could not be estimated. | |
| Not pooled | Not pooled | |||||
| Admission to neonatal intensive care unit | No studies reported this outcome. | |||||
| *The risk in the intervention group (and its 95% confidence interval) is based on the assumed risk in the comparison group and the relative effect of the intervention (and its 95% CI). | ||||||
| GRADE Working Group grades of evidence High quality: we are very confident that the true effect lies close to that of the estimate of the effect. | ||||||
| aSubstantial heterogeneity (−1). | ||||||
| Ondansetron versus saline placebo for preventing hypotension during spinal anaesthesia for caesarean section | |||||
| Patient or population: women having spinal anaesthesia for caesarean section | |||||
| Outcomes | Anticipated absolute effects* (95% CI) | Relative effect | № of participants | Quality of the evidence | |
| Risk with control | Risk with ondansetron | ||||
| Maternal hypotension requiring intervention | Study population | RR 0.67 | 740 | ⊕⊕⊝⊝ | |
| 579 per 1000 | 388 per 1000 | ||||
| Maternal hypertension requiring intervention | No studies reported this outcome. | ||||
| Maternal bradycardia requiring intervention | Study population | RR 0.49 | 740 | ⊕⊕⊝⊝ | |
| 100 per 1000 | 49 per 1000 | ||||
| Maternal nausea and/or vomiting | Study population | RR 0.35 | 653 | ⊕⊕⊝⊝ | |
| 296 per 1000 | 103 per 1000 | ||||
| Neonatal Apgar score < 8 at 5 minutes | Study population | Not estimable | 284 | ⊕⊕⊝⊝ | |
| Not pooled | Not pooled | ||||
| Neonatal acidosis as defined by cord or neonatal blood with a pH < 7.2 | Study population | RR 0.48 | 134 | ⊕⊕⊝⊝ | |
| 30 per 1000 | 15 per 1000 | ||||
| Admission to neonatal care unit | No studies reported this outcome. | ||||
| *The risk in the intervention group (and its 95% confidence interval) is based on the assumed risk in the comparison group and the relative effect of the intervention (and its 95% CI). | |||||
| GRADE Working Group grades of evidence High quality: we are very confident that the true effect lies close to that of the estimate of the effect. | |||||
| a Inclusion criteria not representative of wider population (e.g. elective caesarean section only) (−1). | |||||
| Leg compression versus control for preventing hypotension during spinal anaesthesia for caesarean section | ||||||
| Patient or population: women having spinal anaesthesia for caesarean section | ||||||
| Outcomes | Anticipated absolute effects* (95% CI) | Relative effect | № of participants | Quality of the evidence | Comments | |
| Risk with control | Risk with lower limb compression | |||||
| Maternal hypotension requiring intervention | Study population | RR 0.61 | 705 | ⊕⊝⊝⊝ | — | |
| 663 per 1000 | 404 per 1000 | |||||
| Maternal hypertension requiring intervention | No studies reported this outcome. | |||||
| Maternal bradycardia requiring intervention | Study population | RR 0.63 (0.11 to 3.56) | 74 (1 RCTs) | ⊕⊝⊝⊝ | — | |
| 83 per 1000 | 53 per 1000 (9 to 297) | |||||
| Maternal nausea and/or vomiting | Study population | RR 0.42 | 276 | ⊕⊝⊝⊝ | — | |
| 162 per 1000 | 68 per 1000 | |||||
| Neonatal acidosis as defined by cord or neonatal blood with a pH < 7.2 | No studies reported this outcome. | |||||
| Neonatal Apgar score < 8 at 5 minutes | Study population | Not estimable | 130 | ⊕⊝⊝⊝ | No events observed in any studies. Relative effect could not be estimated. | |
| Not pooled | Not pooled | |||||
| Admission to neonatal intensive care unit | No studies reported this outcome. | |||||
| *The risk in the intervention group (and its 95% confidence interval) is based on the assumed risk in the comparison group and the relative effect of the intervention (and its 95% CI). | ||||||
| GRADE Working Group grades of evidence High quality: we are very confident that the true effect lies close to that of the estimate of the effect. | ||||||
| aDowngraded one level for serious risk of bias (due to unclear risk of selection bias in the majority of included studies (−1). | ||||||
| Walking versus lying for reducing risk of maternal hypotension during spinal anaesthesia for caesarean section | |||||
| Patient or population: women having spinal anaesthesia for caesarean section | |||||
| Outcomes | Anticipated absolute effects* (95% CI) | Relative effect | № of participants | Quality of the evidence | |
| Risk with lying | Risk with walking | ||||
| Maternal hypotension requiring intervention | Study population | RR 0.71 | 37 | ⊕⊝⊝⊝ | |
| 706 per 1000 | 501 per 1000 | ||||
| Maternal hypertension requiring intervention | No studies reported this outcome. | ||||
| Maternal bradycardia requiring intervention | No studies reported this outcome. | ||||
| Maternal nausea and/or vomiting | No studies reported this outcome. | ||||
| Neonatal acidosis as defined by cord or neonatal blood with a pH < 7.2 | No studies reported this outcome. | ||||
| Neonal Apgar score < 8 at 5 minutes | No studies reported this outcome. | ||||
| Admission to neonatal intensive care unit | No studies reported this outcome. | ||||
| *The risk in the intervention group (and its 95% confidence interval) is based on the assumed risk in the comparison group and the relative effect of the intervention (and its 95% CI). | |||||
| GRADE Working Group grades of evidence | |||||
| aParticipants and anaesthetists not blinded in 1 study with 100% weight in analysis (−1). | |||||
| Outcome or subgroup title | No. of studies | No. of participants | Statistical method | Effect size |
| 1 Women with hypotension requiring intervention Show forest plot | 5 | 370 | Risk Ratio (M‐H, Random, 95% CI) | 0.84 [0.72, 0.98] |
| 2 Nausea and/or vomiting Show forest plot | 1 | 69 | Risk Ratio (M‐H, Random, 95% CI) | 0.19 [0.01, 3.91] |
| 3 Anaphylaxis Show forest plot | 1 | 69 | Risk Ratio (M‐H, Random, 95% CI) | 0.0 [0.0, 0.0] |
| 4 Apgar < 8 at 5 min Show forest plot | 1 | 60 | Risk Ratio (M‐H, Random, 95% CI) | 0.0 [0.0, 0.0] |
| Outcome or subgroup title | No. of studies | No. of participants | Statistical method | Effect size |
| 1 Women with hypotension requiring intervention Show forest plot | 1 | 20 | Risk Ratio (M‐H, Random, 95% CI) | 0.86 [0.45, 1.64] |
| Outcome or subgroup title | No. of studies | No. of participants | Statistical method | Effect size |
| 1 Women with hypotension requiring intervention Show forest plot | 3 | 192 | Risk Ratio (M‐H, Random, 95% CI) | 0.55 [0.29, 1.02] |
| 1.1 15 mL/kg crystalloid | 2 | 67 | Risk Ratio (M‐H, Random, 95% CI) | 0.56 [0.33, 0.96] |
| 1.2 20 mL/kg crystalloid | 2 | 125 | Risk Ratio (M‐H, Random, 95% CI) | 0.51 [0.11, 2.44] |
| 2 Nausea and/or vomiting Show forest plot | 1 | 80 | Risk Ratio (M‐H, Random, 95% CI) | 1.2 [0.40, 3.62] |
| 3 Apgar < 8 at 5 min Show forest plot | 1 | Risk Ratio (M‐H, Random, 95% CI) | Subtotals only | |
| 3.1 15 mL/kg crystalloid | 1 | 45 | Risk Ratio (M‐H, Random, 95% CI) | 0.0 [0.0, 0.0] |
| 3.2 20 mL/kg crystalloid | 1 | 45 | Risk Ratio (M‐H, Random, 95% CI) | 0.0 [0.0, 0.0] |
| Outcome or subgroup title | No. of studies | No. of participants | Statistical method | Effect size |
| 1 Women with hypotension requiring intervention Show forest plot | 5 | 384 | Risk Ratio (M‐H, Random, 95% CI) | 0.70 [0.59, 0.83] |
| 2 Hypertension requiring intervention Show forest plot | 1 | 100 | Risk Ratio (M‐H, Random, 95% CI) | 1.67 [0.42, 6.60] |
| 3 Women with bradycardia Show forest plot | 1 | 100 | Risk Ratio (M‐H, Random, 95% CI) | 1.43 [0.59, 3.45] |
| 4 Women with nausea or vomiting Show forest plot | 3 | Risk Ratio (M‐H, Random, 95% CI) | Subtotals only | |
| 4.1 Women with nausea | 3 | 210 | Risk Ratio (M‐H, Random, 95% CI) | 1.98 [1.26, 3.12] |
| 4.2 Women with vomiting | 2 | 160 | Risk Ratio (M‐H, Random, 95% CI) | 2.33 [0.98, 5.58] |
| 5 Neonates with acidosis (pH < 7.2) Show forest plot | 2 | 110 | Risk Ratio (M‐H, Random, 95% CI) | 0.0 [0.0, 0.0] |
| 6 Apgar < 8 at 5 min Show forest plot | 3 | 210 | Risk Ratio (M‐H, Random, 95% CI) | 0.0 [0.0, 0.0] |
| Outcome or subgroup title | No. of studies | No. of participants | Statistical method | Effect size |
| 1 Women with hypotension requiring intervention Show forest plot | 1 | 113 | Risk Ratio (M‐H, Random, 95% CI) | 1.03 [0.65, 1.62] |
| 2 Women with nausea and/or vomiting Show forest plot | 1 | Risk Ratio (M‐H, Random, 95% CI) | Subtotals only | |
| 2.1 Nausea | 1 | 113 | Risk Ratio (M‐H, Random, 95% CI) | 1.64 [0.97, 2.76] |
| 2.2 Vomiting | 1 | 113 | Risk Ratio (M‐H, Random, 95% CI) | 2.95 [0.12, 70.87] |
| Outcome or subgroup title | No. of studies | No. of participants | Statistical method | Effect size |
| 1 Women with hypotension requiring intervention Show forest plot | 3 | Risk Ratio (M‐H, Random, 95% CI) | Subtotals only | |
| 1.1 Dextrose + saline vs saline | 1 | 120 | Risk Ratio (M‐H, Random, 95% CI) | 0.88 [0.68, 1.14] |
| 1.2 Glucose vs saline | 1 | 70 | Risk Ratio (M‐H, Random, 95% CI) | 1.05 [0.74, 1.48] |
| 1.3 Ringer's lactate vs saline | 1 | 60 | Risk Ratio (M‐H, Random, 95% CI) | 1.17 [0.65, 2.09] |
| 2 Neonates with acidosis: Ringer's lactate vs saline Show forest plot | 1 | 60 | Risk Ratio (M‐H, Fixed, 95% CI) | 0.0 [0.0, 0.0] |
| 3 Neonates with acidosis: dextrose vs saline Show forest plot | 1 | 120 | Risk Ratio (M‐H, Random, 95% CI) | 1.2 [0.39, 3.72] |
| 4 Neonates with Apgar score < 7 at 5 min Show forest plot | 1 | 120 | Risk Ratio (M‐H, Random, 95% CI) | 0.0 [0.0, 0.0] |
| 5 Neonates with Apgar score < 8 at 5 min Show forest plot | 1 | 60 | Risk Ratio (M‐H, Fixed, 95% CI) | 0.0 [0.0, 0.0] |
| Outcome or subgroup title | No. of studies | No. of participants | Statistical method | Effect size |
| 1 Women with hypotension requiring intervention Show forest plot | 28 | 2105 | Risk Ratio (M‐H, Random, 95% CI) | 0.68 [0.58, 0.80] |
| 2 Women with hypertension requiring intervention Show forest plot | 3 | 327 | Risk Ratio (M‐H, Random, 95% CI) | 0.64 [0.09, 4.46] |
| 3 Women with cardiac dysrhythmia Show forest plot | 7 | Risk Ratio (M‐H, Random, 95% CI) | Subtotals only | |
| 3.1 Tachycardia | 1 | 60 | Risk Ratio (M‐H, Random, 95% CI) | 1.1 [0.79, 1.53] |
| 3.2 Bradycardia | 6 | 509 | Risk Ratio (M‐H, Random, 95% CI) | 0.99 [0.55, 1.79] |
| 4 Women with nausea and/or vomiting Show forest plot | 16 | Risk Ratio (M‐H, Random, 95% CI) | Subtotals only | |
| 4.1 Nausea and/or vomiting | 15 | 1154 | Risk Ratio (M‐H, Random, 95% CI) | 0.83 [0.61, 1.13] |
| 4.2 Nausea | 5 | 390 | Risk Ratio (M‐H, Random, 95% CI) | 1.10 [0.77, 1.58] |
| 4.3 Vomiting | 4 | 320 | Risk Ratio (M‐H, Random, 95% CI) | 1.35 [0.55, 3.27] |
| 5 Neonates with acidosis (pH < 7.2) Show forest plot | 6 | 678 | Risk Ratio (M‐H, Random, 95% CI) | 0.83 [0.15, 4.52] |
| 6 Neonates: Apgar score Show forest plot | 13 | Risk Ratio (M‐H, Random, 95% CI) | Subtotals only | |
| 6.1 Apgar < 7 at 5 min | 2 | 127 | Risk Ratio (M‐H, Random, 95% CI) | 0.16 [0.01, 2.90] |
| 6.2 Apgar < 8 at 5 min | 11 | 826 | Risk Ratio (M‐H, Random, 95% CI) | 0.24 [0.03, 2.05] |
| Outcome or subgroup title | No. of studies | No. of participants | Statistical method | Effect size |
| 1 Women with hypotension requiring intervention Show forest plot | 5 | 426 | Risk Ratio (M‐H, Random, 95% CI) | 0.40 [0.16, 0.96] |
| 2 Women with bradycardia Show forest plot | 1 | 54 | Risk Ratio (M‐H, Random, 95% CI) | 7.70 [0.46, 127.78] |
| 3 Women with nausea and/or vomiting Show forest plot | 2 | 245 | Risk Ratio (M‐H, Random, 95% CI) | 1.65 [0.75, 3.64] |
| 4 Neonates with acidosis (pH < 7.2) Show forest plot | 1 | 205 | Risk Ratio (M‐H, Random, 95% CI) | 1.24 [0.34, 4.48] |
| 5 Neonates with Apgar score < 7 at 5 min Show forest plot | 4 | 221 | Risk Ratio (M‐H, Random, 95% CI) | 0.07 [0.00, 1.24] |
| 6 Neonatal Apgar < 8 at 5 min Show forest plot | 1 | 205 | Risk Ratio (M‐H, Random, 95% CI) | 0.0 [0.0, 0.0] |
| Outcome or subgroup title | No. of studies | No. of participants | Statistical method | Effect size |
| 1 Women with hypotension requiring intervention Show forest plot | 3 | 134 | Risk Ratio (M‐H, Random, 95% CI) | 0.75 [0.27, 2.08] |
| 2 Apgar < 9 at 5 min Show forest plot | 1 | Risk Ratio (M‐H, Random, 95% CI) | Subtotals only | |
| Outcome or subgroup title | No. of studies | No. of participants | Statistical method | Effect size |
| 1 Women with hypotension requiring intervention Show forest plot | 4 | 320 | Risk Ratio (M‐H, Random, 95% CI) | 0.93 [0.78, 1.10] |
| 2 Women with cardiac dysrhythmia Show forest plot | 3 | Risk Ratio (M‐H, Random, 95% CI) | Subtotals only | |
| 2.1 Bradycardia | 2 | 82 | Risk Ratio (M‐H, Random, 95% CI) | 0.75 [0.20, 2.88] |
| 2.2 Tachycardia | 1 | 46 | Risk Ratio (M‐H, Random, 95% CI) | 0.0 [0.0, 0.0] |
| 3 Women with nausea and/or vomiting Show forest plot | 2 | Risk Ratio (M‐H, Random, 95% CI) | Subtotals only | |
| 3.1 Nausea and/or vomiting | 1 | 178 | Risk Ratio (M‐H, Random, 95% CI) | 0.92 [0.63, 1.35] |
| 3.2 Nausea | 1 | 46 | Risk Ratio (M‐H, Random, 95% CI) | 1.0 [0.15, 6.51] |
| 3.3 Vomiting | 1 | 46 | Risk Ratio (M‐H, Random, 95% CI) | 0.0 [0.0, 0.0] |
| 4 Women with anaphylaxis Show forest plot | 1 | 178 | Risk Ratio (M‐H, Random, 95% CI) | 0.0 [0.0, 0.0] |
| 5 Neonates with Apgar score < 7 at 5 min Show forest plot | 1 | 36 | Risk Ratio (M‐H, Random, 95% CI) | 0.0 [0.0, 0.0] |
| Outcome or subgroup title | No. of studies | No. of participants | Statistical method | Effect size |
| 1 Women with hypotension requiring intervention Show forest plot | 2 | Risk Ratio (M‐H, Random, 95% CI) | Subtotals only | |
| 1.1 Albumin or dextrose vs dextrose | 1 | 45 | Risk Ratio (M‐H, Random, 95% CI) | 0.13 [0.01, 2.30] |
| 1.2 Unbalanced vs balanced hydroxyethyl starch | 1 | 51 | Risk Ratio (M‐H, Random, 95% CI) | 1.04 [0.78, 1.39] |
| 2 Neonates: Apgar score < 7 Show forest plot | 1 | 45 | Risk Ratio (M‐H, Random, 95% CI) | 0.13 [0.01, 2.30] |
| 2.1 Albumin or dextrose vs dextrose | 1 | 45 | Risk Ratio (M‐H, Random, 95% CI) | 0.13 [0.01, 2.30] |
| 3 Neonates with Apgar score < 8 at 5 min Show forest plot | 1 | 51 | Risk Ratio (M‐H, Random, 95% CI) | 0.0 [0.0, 0.0] |
| 3.1 Unbalanced vs balanced hydroxyethyl starch | 1 | 51 | Risk Ratio (M‐H, Random, 95% CI) | 0.0 [0.0, 0.0] |
| Outcome or subgroup title | No. of studies | No. of participants | Statistical method | Effect size |
| 1 Women with hypotension requiring intervention Show forest plot | 22 | 1401 | Risk Ratio (M‐H, Random, 95% CI) | 0.65 [0.53, 0.80] |
| 2 Women with hypertension requiring intervention Show forest plot | 7 | 520 | Risk Ratio (M‐H, Random, 95% CI) | 1.61 [1.00, 2.61] |
| 3 Women with cardiac arrhythmia Show forest plot | 3 | Risk Ratio (M‐H, Random, 95% CI) | Subtotals only | |
| 3.1 Tachycardia | 2 | 93 | Risk Ratio (M‐H, Random, 95% CI) | 1.12 [0.74, 1.70] |
| 3.2 Bradycardia | 2 | 103 | Risk Ratio (M‐H, Random, 95% CI) | 14.46 [0.87, 241.09] |
| 4 Women with nausea and/or vomiting Show forest plot | 13 | Risk Ratio (M‐H, Random, 95% CI) | Subtotals only | |
| 4.1 Nausea and/or vomiting | 5 | 219 | Risk Ratio (M‐H, Random, 95% CI) | 0.71 [0.22, 2.34] |
| 4.2 Nausea | 8 | 620 | Risk Ratio (M‐H, Random, 95% CI) | 0.68 [0.48, 0.96] |
| 4.3 Vomiting | 6 | 516 | Risk Ratio (M‐H, Random, 95% CI) | 0.68 [0.44, 1.07] |
| 5 Neonates with acidosis (pH < 7.2) Show forest plot | 9 | 576 | Risk Ratio (M‐H, Random, 95% CI) | 1.29 [0.67, 2.49] |
| 6 Neonates: Apgar score Show forest plot | 14 | Risk Ratio (M‐H, Random, 95% CI) | Subtotals only | |
| 6.1 Apgar < 8 at 5 min | 10 | 579 | Risk Ratio (M‐H, Random, 95% CI) | 0.0 [0.0, 0.0] |
| 6.2 Apgar < 7 at 5 min | 4 | 263 | Risk Ratio (M‐H, Random, 95% CI) | 1.14 [0.34, 3.81] |
| Outcome or subgroup title | No. of studies | No. of participants | Statistical method | Effect size |
| 1 Women with hypotension requiring intervention Show forest plot | 9 | 613 | Risk Ratio (M‐H, Random, 95% CI) | 0.60 [0.47, 0.78] |
| 2 Women with hypertension requiring intervention Show forest plot | 3 | 280 | Risk Ratio (M‐H, Random, 95% CI) | 1.10 [0.37, 3.28] |
| 3 Women with bradycardia Show forest plot | 1 | 100 | Risk Ratio (M‐H, Fixed, 95% CI) | 0.33 [0.01, 7.99] |
| 4 Women with nausea and/or vomiting Show forest plot | 5 | Risk Ratio (M‐H, Random, 95% CI) | Subtotals only | |
| 4.1 Nausea and/or vomiting | 2 | 146 | Risk Ratio (M‐H, Random, 95% CI) | 1.0 [0.48, 2.08] |
| 4.2 Nausea | 3 | 220 | Risk Ratio (M‐H, Random, 95% CI) | 0.54 [0.31, 0.93] |
| 4.3 Vomiting | 3 | 220 | Risk Ratio (M‐H, Random, 95% CI) | 0.57 [0.31, 1.05] |
| 5 Women with impaired consciousness Show forest plot | 1 | 46 | Risk Ratio (M‐H, Random, 95% CI) | 0.4 [0.09, 1.86] |
| 6 Neonates with acidosis (pH < 7.2) Show forest plot | 2 | 218 | Risk Ratio (M‐H, Random, 95% CI) | 1.41 [0.48, 4.15] |
| 7 Neonatal Apgar score Show forest plot | 5 | Risk Ratio (M‐H, Random, 95% CI) | Subtotals only | |
| 7.1 Apgar < 8 at 5 min | 4 | 226 | Risk Ratio (M‐H, Random, 95% CI) | 3.0 [0.13, 71.92] |
| 7.2 Apgar < 7 at 5 min | 1 | 120 | Risk Ratio (M‐H, Random, 95% CI) | 0.0 [0.0, 0.0] |
| Outcome or subgroup title | No. of studies | No. of participants | Statistical method | Effect size |
| 1 Women with hypotension requiring intervention Show forest plot | 1 | 75 | Risk Ratio (M‐H, Random, 95% CI) | 0.65 [0.38, 1.12] |
| 2 Women with nausea and/or vomiting Show forest plot | 1 | Risk Ratio (M‐H, Random, 95% CI) | Subtotals only | |
| 2.1 Nausea | 1 | 75 | Risk Ratio (M‐H, Random, 95% CI) | 0.42 [0.22, 0.81] |
| 2.2 Vomiting | 1 | 75 | Risk Ratio (M‐H, Random, 95% CI) | 0.17 [0.04, 0.77] |
| Outcome or subgroup title | No. of studies | No. of participants | Statistical method | Effect size |
| 1 Women with hypotension requiring intervention Show forest plot | 1 | 75 | Risk Ratio (M‐H, Random, 95% CI) | 0.39 [0.21, 0.74] |
| 2 Women with nausea and/or vomiting Show forest plot | 1 | Risk Ratio (M‐H, Random, 95% CI) | Subtotals only | |
| 2.1 Nausea | 1 | 75 | Risk Ratio (M‐H, Random, 95% CI) | 0.27 [0.11, 0.65] |
| 2.2 Vomiting | 1 | 75 | Risk Ratio (M‐H, Random, 95% CI) | 0.38 [0.09, 1.55] |
| Outcome or subgroup title | No. of studies | No. of participants | Statistical method | Effect size |
| 1 Women with hypotension requiring intervention Show forest plot | 8 | 401 | Risk Ratio (M‐H, Random, 95% CI) | 0.92 [0.71, 1.18] |
| 2 Women with hypertension requiring intervention Show forest plot | 2 | 118 | Risk Ratio (M‐H, Random, 95% CI) | 1.72 [0.71, 4.16] |
| 3 Cardiac dysrhythmia Show forest plot | 5 | Risk Ratio (M‐H, Random, 95% CI) | Subtotals only | |
| 3.1 Bradycardia | 5 | 304 | Risk Ratio (M‐H, Random, 95% CI) | 0.37 [0.21, 0.64] |
| 3.2 Tachycardia | 1 | 57 | Risk Ratio (M‐H, Random, 95% CI) | 2.22 [0.44, 11.18] |
| 4 Women with nausea and/or vomiting Show forest plot | 4 | 204 | Risk Ratio (M‐H, Random, 95% CI) | 0.76 [0.39, 1.49] |
| 5 Neonates with acidosis (pH < 7.2) Show forest plot | 3 | 175 | Risk Ratio (M‐H, Random, 95% CI) | 0.89 [0.07, 12.00] |
| 6 Neonates with Apgar score < 8 at 5 min Show forest plot | 6 | 321 | Risk Ratio (M‐H, Random, 95% CI) | 0.0 [0.0, 0.0] |
| Outcome or subgroup title | No. of studies | No. of participants | Statistical method | Effect size |
| 1 Women with hypotension requiring intervention Show forest plot | 1 | 20 | Risk Ratio (M‐H, Random, 95% CI) | 0.0 [0.0, 0.0] |
| 2 Women with nausea and/or vomiting Show forest plot | 1 | 20 | Risk Ratio (M‐H, Random, 95% CI) | 3.0 [0.14, 65.90] |
| 3 Neonates with acidosis (pH < 7.2) Show forest plot | 1 | 20 | Risk Ratio (M‐H, Random, 95% CI) | 9.00 [0.55, 147.95] |
| Outcome or subgroup title | No. of studies | No. of participants | Statistical method | Effect size |
| 1 Women with hypotension requiring intervention Show forest plot | 2 | 160 | Risk Ratio (M‐H, Random, 95% CI) | 0.53 [0.36, 0.79] |
| 2 Women with hypertension requiring intervention Show forest plot | 1 | 100 | Risk Ratio (M‐H, Fixed, 95% CI) | 3.0 [0.32, 27.87] |
| 3 Women with bradycardia Show forest plot | 1 | 100 | Risk Ratio (M‐H, Fixed, 95% CI) | 0.0 [0.0, 0.0] |
| 4 Women with nausea and vomiting Show forest plot | 2 | Risk Ratio (M‐H, Random, 95% CI) | Subtotals only | |
| 4.1 Women with nausea and/or vomiting | 1 | 100 | Risk Ratio (M‐H, Random, 95% CI) | 5.00 [0.25, 101.58] |
| 4.2 Women with nausea | 1 | 60 | Risk Ratio (M‐H, Random, 95% CI) | 0.22 [0.05, 0.94] |
| 4.3 Women with vomiting | 1 | 60 | Risk Ratio (M‐H, Random, 95% CI) | 0.14 [0.01, 2.65] |
| 5 5 Neonates with acidosis (pH < 7.2) Show forest plot | 1 | 100 | Risk Ratio (M‐H, Fixed, 95% CI) | 0.0 [0.0, 0.0] |
| 6 Apgar score < 8 at 5 min Show forest plot | 2 | 160 | Risk Ratio (M‐H, Random, 95% CI) | 3.0 [0.13, 71.92] |
| Outcome or subgroup title | No. of studies | No. of participants | Statistical method | Effect size |
| 1 Women with hypotension requiring intervention Show forest plot | 1 | 53 | Risk Ratio (M‐H, Random, 95% CI) | 1.56 [0.50, 4.89] |
| 2 Women with hypertension requiring intervention Show forest plot | 1 | 53 | Risk Ratio (M‐H, Random, 95% CI) | 0.62 [0.26, 1.47] |
| 3 Women with bradycardia Show forest plot | 1 | 53 | Risk Ratio (M‐H, Random, 95% CI) | 0.0 [0.0, 0.0] |
| 4 Women with nausea and/or vomiting Show forest plot | 1 | 53 | Risk Ratio (M‐H, Random, 95% CI) | 7.26 [0.39, 134.01] |
| 5 5 Neonates with acidosis (pH < 7.2) Show forest plot | 1 | 53 | Risk Ratio (M‐H, Random, 95% CI) | 0.0 [0.0, 0.0] |
| 6 Neonatal Apgar score < 8 at 5 min Show forest plot | 1 | 53 | Risk Ratio (M‐H, Random, 95% CI) | 0.0 [0.0, 0.0] |
| Outcome or subgroup title | No. of studies | No. of participants | Statistical method | Effect size |
| 1 Women with hypotension requiring intervention Show forest plot | 6 | Risk Ratio (M‐H, Random, 95% CI) | Subtotals only | |
| 1.1 5 mg vs 10 mg | 2 | 100 | Risk Ratio (M‐H, Random, 95% CI) | 1.05 [0.65, 1.69] |
| 1.2 6 mg vs 12 mg | 1 | 46 | Risk Ratio (M‐H, Random, 95% CI) | 1.83 [0.83, 4.04] |
| 1.3 5 mg vs 15 mg | 1 | 40 | Risk Ratio (M‐H, Random, 95% CI) | 2.0 [0.94, 4.27] |
| 1.4 10 mg vs 15 mg | 1 | 40 | Risk Ratio (M‐H, Random, 95% CI) | 1.83 [0.84, 3.99] |
| 1.5 10 mg vs 20 mg | 2 | 60 | Risk Ratio (M‐H, Random, 95% CI) | 1.06 [0.80, 1.39] |
| 1.6 10 mg vs 30 mg | 1 | 40 | Risk Ratio (M‐H, Random, 95% CI) | 2.43 [1.30, 4.54] |
| 1.7 15 mg vs 30 mg | 1 | 100 | Risk Ratio (M‐H, Random, 95% CI) | 2.11 [1.06, 4.21] |
| 1.8 20 mg vs 30 mg | 1 | 40 | Risk Ratio (M‐H, Random, 95% CI) | 2.29 [1.21, 4.32] |
| 2 Women with hypertension requiring intervention Show forest plot | 2 | Risk Ratio (M‐H, Random, 95% CI) | Subtotals only | |
| 2.1 5 mg vs 10 mg | 1 | 40 | Risk Ratio (M‐H, Random, 95% CI) | 1.2 [0.44, 3.30] |
| 2.2 5 mg vs 15 mg | 1 | 40 | Risk Ratio (M‐H, Random, 95% CI) | 0.5 [0.23, 1.07] |
| 2.3 10 mg vs 15 mg | 1 | 40 | Risk Ratio (M‐H, Random, 95% CI) | 0.42 [0.18, 0.96] |
| 2.4 10 mg vs 20 mg | 1 | 40 | Risk Ratio (M‐H, Random, 95% CI) | 0.2 [0.03, 1.56] |
| 2.5 10 mg vs 30 mg | 1 | 40 | Risk Ratio (M‐H, Random, 95% CI) | 0.11 [0.02, 0.80] |
| 2.6 20 mg vs 30 mg | 1 | 40 | Risk Ratio (M‐H, Random, 95% CI) | 0.56 [0.23, 1.37] |
| 3 Women with nausea and/or vomiting Show forest plot | 4 | Risk Ratio (M‐H, Random, 95% CI) | Subtotals only | |
| 3.1 6 mg vs 12 mg (nausea and/or vomiting) | 1 | 46 | Risk Ratio (M‐H, Random, 95% CI) | 0.81 [0.38, 1.74] |
| 3.2 5 mg vs 10 mg (vomiting) | 1 | 40 | Risk Ratio (M‐H, Random, 95% CI) | 3.0 [0.34, 26.45] |
| 3.3 5 mg vs 15 mg (vomiting) | 1 | 40 | Risk Ratio (M‐H, Random, 95% CI) | 1.5 [0.28, 8.04] |
| 3.4 10 mg vs 15 mg (vomiting) | 1 | 40 | Risk Ratio (M‐H, Random, 95% CI) | 0.5 [0.05, 5.08] |
| 3.5 5 mg vs 10 mg (nausea) | 1 | 40 | Risk Ratio (M‐H, Random, 95% CI) | 2.0 [0.83, 4.81] |
| 3.6 5 mg vs 15 mg (nausea) | 1 | 40 | Risk Ratio (M‐H, Random, 95% CI) | 2.5 [0.94, 6.66] |
| 3.7 10 mg vs 15 mg (nausea) | 1 | 40 | Risk Ratio (M‐H, Random, 95% CI) | 1.25 [0.39, 3.99] |
| 3.8 10 mg vs 20 mg (nausea) | 1 | 40 | Risk Ratio (M‐H, Random, 95% CI) | 0.69 [0.39, 1.24] |
| 3.9 10 mg vs 30 mg (nausea) | 1 | 40 | Risk Ratio (M‐H, Random, 95% CI) | 1.8 [0.73, 4.43] |
| 3.10 15 mg vs 30 mg (nausea) | 1 | 100 | Risk Ratio (M‐H, Random, 95% CI) | 1.43 [0.59, 3.45] |
| 3.11 20 mg vs 30 mg (nausea) | 1 | 40 | Risk Ratio (M‐H, Random, 95% CI) | 2.6 [1.14, 5.93] |
| 3.12 15 mg vs 30 mg (vomiting) | 1 | 100 | Risk Ratio (M‐H, Random, 95% CI) | 0.67 [0.12, 3.82] |
| 4 Neonates with acidosis (pH < 7.2) Show forest plot | 3 | Risk Ratio (M‐H, Random, 95% CI) | Subtotals only | |
| 4.1 5 mg vs 10 mg | 1 | 40 | Risk Ratio (M‐H, Random, 95% CI) | 0.2 [0.01, 3.92] |
| 4.2 5 mg vs 15 mg | 1 | 40 | Risk Ratio (M‐H, Random, 95% CI) | 0.33 [0.01, 7.72] |
| 4.3 6 mg vs 12 mg | 1 | 46 | Risk Ratio (M‐H, Random, 95% CI) | 0.31 [0.01, 7.16] |
| 4.4 10 mg vs 15 mg | 1 | 40 | Risk Ratio (M‐H, Random, 95% CI) | 2.0 [0.20, 20.33] |
| 4.5 10 mg vs 20 mg | 1 | 39 | Risk Ratio (M‐H, Random, 95% CI) | 0.59 [0.24, 1.50] |
| 4.6 10 mg vs 30 mg | 1 | 38 | Risk Ratio (M‐H, Random, 95% CI) | 1.13 [0.36, 3.55] |
| 4.7 20 mg vs 30 mg | 1 | 37 | Risk Ratio (M‐H, Random, 95% CI) | 1.89 [0.69, 5.21] |
| 5 Neonatal Apgar score at 5 min Show forest plot | 4 | Risk Ratio (M‐H, Random, 95% CI) | Subtotals only | |
| 5.1 6 mg vs 12 mg (Apgar < 7) | 1 | 46 | Risk Ratio (M‐H, Random, 95% CI) | 0.31 [0.01, 7.16] |
| 5.2 5 mg vs 10 mg (Apgar < 8) | 1 | 40 | Risk Ratio (M‐H, Random, 95% CI) | 0.0 [0.0, 0.0] |
| 5.3 5 mg vs 15 mg (Apgar < 8) | 1 | 40 | Risk Ratio (M‐H, Random, 95% CI) | 0.0 [0.0, 0.0] |
| 5.4 10 mg vs 15 mg (Apgar < 8) | 1 | 40 | Risk Ratio (M‐H, Random, 95% CI) | 0.0 [0.0, 0.0] |
| 5.5 10 mg vs 20 mg (Apgar < 7) | 1 | 40 | Risk Ratio (M‐H, Random, 95% CI) | 0.0 [0.0, 0.0] |
| 5.6 10 mg vs 30 mg (Apgar < 7) | 1 | 40 | Risk Ratio (M‐H, Random, 95% CI) | 0.0 [0.0, 0.0] |
| 5.7 20 mg vs 30 mg (Apgar < 7) | 1 | 40 | Risk Ratio (M‐H, Random, 95% CI) | 0.0 [0.0, 0.0] |
| 5.8 10 mg vs 20 mg (Apgar < 8) | 1 | 20 | Risk Ratio (M‐H, Random, 95% CI) | 0.0 [0.0, 0.0] |
| Outcome or subgroup title | No. of studies | No. of participants | Statistical method | Effect size |
| 1 Women with hypotension requiring intervention Show forest plot | 4 | Risk Ratio (M‐H, Random, 95% CI) | Subtotals only | |
| 1.1 Bolus + infusion vs infusion | 1 | 80 | Risk Ratio (M‐H, Random, 95% CI) | 3.5 [1.26, 9.72] |
| 1.2 0.5 mg/min vs 1 mg/min | 1 | 40 | Risk Ratio (M‐H, Random, 95% CI) | 1.22 [0.65, 2.29] |
| 1.3 0.5 mg/min vs 2 mg/min | 1 | 40 | Risk Ratio (M‐H, Random, 95% CI) | 1.57 [0.77, 3.22] |
| 1.4 0.5 mg/min vs 4 mg/min | 1 | 40 | Risk Ratio (M‐H, Random, 95% CI) | 1.22 [0.65, 2.29] |
| 1.5 1 mg/min vs 2 mg/min | 3 | 107 | Risk Ratio (M‐H, Random, 95% CI) | 1.24 [0.83, 1.84] |
| 1.6 1 mg/min vs 3 to 4 mg/min | 2 | 99 | Risk Ratio (M‐H, Random, 95% CI) | 1.29 [0.81, 2.05] |
| 1.7 2 mg/min vs 3 to 4 mg/min | 2 | 239 | Risk Ratio (M‐H, Random, 95% CI) | 1.21 [0.60, 2.43] |
| 2 Women with hypertension requiring intervention Show forest plot | 2 | Risk Ratio (M‐H, Random, 95% CI) | Subtotals only | |
| 2.1 Bolus + infusion vs infusion | 1 | 80 | Risk Ratio (M‐H, Random, 95% CI) | 1.0 [0.39, 2.59] |
| 2.2 0.5 mg/min vs 1 mg/min | 1 | 40 | Risk Ratio (M‐H, Random, 95% CI) | 5.0 [0.26, 98.00] |
| 2.3 0.5 mg/min vs 2 mg/min | 1 | 40 | Risk Ratio (M‐H, Random, 95% CI) | 0.67 [0.12, 3.57] |
| 2.4 0.5 mg/min vs 4 mg/min | 1 | 40 | Risk Ratio (M‐H, Random, 95% CI) | 0.2 [0.05, 0.80] |
| 2.5 1 mg/min vs 2 mg/min | 1 | 40 | Risk Ratio (M‐H, Random, 95% CI) | 0.14 [0.01, 2.60] |
| 2.6 1 mg/min vs 4 mg/min | 1 | 40 | Risk Ratio (M‐H, Random, 95% CI) | 0.05 [0.00, 0.76] |
| 2.7 2 mg/min vs 4 mg/min | 1 | 40 | Risk Ratio (M‐H, Random, 95% CI) | 0.30 [0.10, 0.93] |
| 3 Women with bradycardia Show forest plot | 1 | 19 | Risk Ratio (M‐H, Random, 95% CI) | 0.0 [0.0, 0.0] |
| 3.1 1 mg/min vs 2 mg/min | 1 | 19 | Risk Ratio (M‐H, Random, 95% CI) | 0.0 [0.0, 0.0] |
| 4 Women with nausea and/or vomiting Show forest plot | 3 | Risk Ratio (M‐H, Random, 95% CI) | Subtotals only | |
| 4.1 Bolus + infusion vs infusion (nausea) | 1 | 80 | Risk Ratio (M‐H, Random, 95% CI) | 1.83 [0.75, 4.48] |
| 4.2 0.5 mg/min vs 1 mg/min (nausea) | 1 | 40 | Risk Ratio (M‐H, Random, 95% CI) | 1.29 [0.60, 2.77] |
| 4.3 0.5 mg/min vs 2 mg/min (nausea) | 1 | 40 | Risk Ratio (M‐H, Random, 95% CI) | 1.5 [0.66, 3.43] |
| 4.4 0.5 mg/min vs 4 mg/min (nausea) | 1 | 40 | Risk Ratio (M‐H, Random, 95% CI) | 1.29 [0.60, 2.77] |
| 4.5 1 mg/min vs 2 mg/min (nausea) | 2 | 60 | Risk Ratio (M‐H, Random, 95% CI) | 2.19 [0.30, 15.85] |
| 4.6 1 mg/min vs 4 mg/min (nausea) | 1 | 40 | Risk Ratio (M‐H, Random, 95% CI) | 1.0 [0.43, 2.33] |
| 4.7 2 mg/min vs 4 mg/min (nausea) | 1 | 40 | Risk Ratio (M‐H, Random, 95% CI) | 0.86 [0.35, 2.10] |
| 4.8 Bolus + infusion vs infusion (vomiting) | 1 | 80 | Risk Ratio (M‐H, Random, 95% CI) | 1.67 [0.43, 6.51] |
| 4.9 0.5 mg/min vs 1 mg/min (vomiting) | 1 | 40 | Risk Ratio (M‐H, Random, 95% CI) | 0.67 [0.12, 3.57] |
| 4.10 0.5 mg/min vs 2 mg/min (vomiting) | 1 | 40 | Risk Ratio (M‐H, Random, 95% CI) | 2.0 [0.20, 20.33] |
| 4.11 0.5 mg/min vs 4 mg/min (vomiting) | 1 | 40 | Risk Ratio (M‐H, Random, 95% CI) | 2.0 [0.20, 20.33] |
| 4.12 1 mg/min vs 2 mg/min (vomiting) | 1 | 40 | Risk Ratio (M‐H, Random, 95% CI) | 3.0 [0.34, 26.45] |
| 4.13 1 mg/min vs 4 mg/min (vomiting) | 1 | 40 | Risk Ratio (M‐H, Random, 95% CI) | 3.0 [0.34, 26.45] |
| 4.14 2 mg/min vs 4 mg/min (vomiting) | 1 | 40 | Risk Ratio (M‐H, Random, 95% CI) | 1.0 [0.07, 14.90] |
| 4.15 1 mg/min vs 2 mg/min (nausea or vomiting) | 1 | 19 | Risk Ratio (M‐H, Random, 95% CI) | 8.18 [0.50, 133.66] |
| 5 Neonates with acidosis (pH < 7.2) Show forest plot | 2 | Risk Ratio (M‐H, Random, 95% CI) | Subtotals only | |
| 5.1 Bolus + infusion vs infusion | 1 | 78 | Risk Ratio (M‐H, Random, 95% CI) | 1.66 [0.53, 5.23] |
| 5.2 0.5 mg/min vs 1 mg/min | 1 | 40 | Risk Ratio (M‐H, Random, 95% CI) | 0.33 [0.04, 2.94] |
| 5.3 0.5 mg/min vs 2 mg/min | 1 | 40 | Risk Ratio (M‐H, Random, 95% CI) | 3.0 [0.13, 69.52] |
| 5.4 0.5 mg/min vs 4 mg/min | 1 | 40 | Risk Ratio (M‐H, Random, 95% CI) | 0.25 [0.03, 2.05] |
| 5.5 1 mg/min vs 2 mg/min | 1 | 40 | Risk Ratio (M‐H, Random, 95% CI) | 7.0 [0.38, 127.32] |
| 5.6 1 mg/min vs 4 mg/min | 1 | 40 | Risk Ratio (M‐H, Random, 95% CI) | 0.75 [0.19, 2.93] |
| 5.7 2 mg/min vs 4 mg/min | 1 | 40 | Risk Ratio (M‐H, Random, 95% CI) | 0.11 [0.01, 1.94] |
| 6 Neonatal Apgar score at 5 min Show forest plot | 3 | Risk Ratio (M‐H, Random, 95% CI) | Subtotals only | |
| 6.1 Bolus + infusion vs infusion (Apgar < 7) | 1 | 80 | Risk Ratio (M‐H, Random, 95% CI) | 0.0 [0.0, 0.0] |
| 6.2 0.5 mg/min vs 1 mg/min (Apgar < 8) | 1 | 40 | Risk Ratio (M‐H, Random, 95% CI) | 0.0 [0.0, 0.0] |
| 6.3 0.5 mg/min vs 2 mg/min (Apgar < 8) | 1 | 40 | Risk Ratio (M‐H, Random, 95% CI) | 0.0 [0.0, 0.0] |
| 6.4 0.5 mg/min vs 4 mg/min (Apgar < 8) | 1 | 40 | Risk Ratio (M‐H, Random, 95% CI) | 0.0 [0.0, 0.0] |
| 6.5 1 mg/min vs 2 mg/min (Apgar < 8) | 2 | 59 | Risk Ratio (M‐H, Random, 95% CI) | 0.0 [0.0, 0.0] |
| 6.6 1 mg/min vs 4 mg/min (Apgar < 8) | 1 | 40 | Risk Ratio (M‐H, Random, 95% CI) | 0.0 [0.0, 0.0] |
| 6.7 2 mg/min vs 4 mg/min (Apgar < 8) | 1 | 40 | Risk Ratio (M‐H, Random, 95% CI) | 0.0 [0.0, 0.0] |
| Outcome or subgroup title | No. of studies | No. of participants | Statistical method | Effect size |
| 1 Women with hypotension requiring intervention Show forest plot | 1 | Risk Ratio (M‐H, Random, 95% CI) | Subtotals only | |
| 1.1 Oral vs IM | 1 | 40 | Risk Ratio (M‐H, Random, 95% CI) | 3.0 [0.95, 9.48] |
| 1.2 Oral vs IV | 1 | 40 | Risk Ratio (M‐H, Random, 95% CI) | 19.00 [1.18, 305.88] |
| 2 Women with hypertension requiring intervention Show forest plot | 1 | Risk Ratio (M‐H, Random, 95% CI) | Subtotals only | |
| 2.1 Oral vs IM | 1 | 40 | Risk Ratio (M‐H, Random, 95% CI) | 0.0 [0.0, 0.0] |
| 2.2 Oral vs IV | 1 | 40 | Risk Ratio (M‐H, Random, 95% CI) | 0.0 [0.0, 0.0] |
| 3 Women with nausea and vomiting Show forest plot | 1 | Risk Ratio (M‐H, Random, 95% CI) | Subtotals only | |
| 3.1 Oral vs IM | 1 | 40 | Risk Ratio (M‐H, Random, 95% CI) | 1.33 [0.34, 5.21] |
| 3.2 Oral vs IV | 1 | 40 | Risk Ratio (M‐H, Random, 95% CI) | 9.00 [0.52, 156.91] |
| Outcome or subgroup title | No. of studies | No. of participants | Statistical method | Effect size |
| 1 Women with hypotension requiring intervention Show forest plot | 1 | 60 | Risk Ratio (M‐H, Random, 95% CI) | 0.75 [0.43, 1.30] |
| 2 Women with hypertension requiring intervention Show forest plot | 1 | 60 | Risk Ratio (M‐H, Random, 95% CI) | 0.0 [0.0, 0.0] |
| 3 Apgar < 8 at 5 min Show forest plot | 1 | 60 | Risk Ratio (M‐H, Random, 95% CI) | 0.0 [0.0, 0.0] |
| Outcome or subgroup title | No. of studies | No. of participants | Statistical method | Effect size |
| 1 Women with hypotension requiring intervention Show forest plot | 5 | 280 | Risk Ratio (M‐H, Random, 95% CI) | 0.45 [0.26, 0.80] |
| 2 Women with cardiac dysrhythmia Show forest plot | 3 | Risk Ratio (M‐H, Random, 95% CI) | Subtotals only | |
| 2.1 Tachycardia | 1 | 56 | Risk Ratio (M‐H, Random, 95% CI) | 0.87 [0.13, 5.73] |
| 2.2 Bradycardia | 3 | 180 | Risk Ratio (M‐H, Random, 95% CI) | 3.23 [0.17, 61.85] |
| 3 Women with nausea and/or vomiting Show forest plot | 3 | 180 | Risk Ratio (M‐H, Random, 95% CI) | 0.70 [0.16, 2.98] |
| 4 Neonates with acidosis (pH < 7.2) Show forest plot | 1 | 49 | Risk Ratio (M‐H, Random, 95% CI) | 0.96 [0.06, 14.50] |
| 5 Neonates with Apgar < 7 at 5 min Show forest plot | 1 | 50 | Risk Ratio (M‐H, Random, 95% CI) | 0.0 [0.0, 0.0] |
| 6 Neonates with Apgar < 8 at 5 min Show forest plot | 2 | 96 | Risk Ratio (M‐H, Random, 95% CI) | 0.0 [0.0, 0.0] |
| Outcome or subgroup title | No. of studies | No. of participants | Statistical method | Effect size |
| 1 Women with hypotension requiring intervention Show forest plot | 1 | 60 | Risk Ratio (M‐H, Random, 95% CI) | 2.0 [0.19, 20.90] |
| 2 Women with hypertension requiring intervention Show forest plot | 1 | 60 | Risk Ratio (M‐H, Random, 95% CI) | 17.0 [1.03, 281.91] |
| 3 Cardiac dysrhythmia Show forest plot | 1 | Risk Ratio (M‐H, Random, 95% CI) | Subtotals only | |
| 3.1 Bradycardia | 1 | 60 | Risk Ratio (M‐H, Random, 95% CI) | 15.0 [0.89, 251.42] |
| 4 Nausea and/or vomiting Show forest plot | 1 | Risk Ratio (M‐H, Random, 95% CI) | Subtotals only | |
| 4.1 Nausea | 1 | 60 | Risk Ratio (M‐H, Random, 95% CI) | 0.2 [0.01, 4.00] |
| 4.2 Vomiting | 1 | 60 | Risk Ratio (M‐H, Random, 95% CI) | 1.0 [0.07, 15.26] |
| Outcome or subgroup title | No. of studies | No. of participants | Statistical method | Effect size |
| 1 Women with hypotension requiring intervention Show forest plot | 1 | 59 | Risk Ratio (M‐H, Random, 95% CI) | 0.84 [0.23, 3.06] |
| 2 Women with hypertension requiring intervention Show forest plot | 1 | 59 | Risk Ratio (M‐H, Random, 95% CI) | 0.25 [0.08, 0.83] |
| 3 Women with bradycardia Show forest plot | 1 | 59 | Risk Ratio (M‐H, Random, 95% CI) | 0.0 [0.0, 0.0] |
| 4 Women with nausea and/or vomiting Show forest plot | 1 | 59 | Risk Ratio (M‐H, Random, 95% CI) | 0.0 [0.0, 0.0] |
| 5 Neonatal pH < 7.2 Show forest plot | 1 | 59 | Risk Ratio (M‐H, Random, 95% CI) | 0.0 [0.0, 0.0] |
| 6 Neonatal Apgar score < 8 at 5 min Show forest plot | 1 | 59 | Risk Ratio (M‐H, Random, 95% CI) | 0.0 [0.0, 0.0] |
| Outcome or subgroup title | No. of studies | No. of participants | Statistical method | Effect size |
| 1 Women with hypotension requiring intervention Show forest plot | 1 | 76 | Risk Ratio (M‐H, Random, 95% CI) | 0.73 [0.46, 1.15] |
| 2 Women with bradycardia Show forest plot | 1 | 76 | Risk Ratio (M‐H, Random, 95% CI) | 0.5 [0.05, 5.28] |
| 3 Women with nausea and/or vomiting Show forest plot | 1 | 76 | Risk Ratio (M‐H, Random, 95% CI) | 1.0 [0.32, 3.17] |
| Outcome or subgroup title | No. of studies | No. of participants | Statistical method | Effect size |
| 1 Women with hypotension requiring intervention Show forest plot | 1 | 60 | Risk Ratio (M‐H, Random, 95% CI) | 1.4 [0.50, 3.92] |
| 2 Women with cardiac dysrhythmia Show forest plot | 1 | 60 | Risk Ratio (M‐H, Random, 95% CI) | 1.22 [0.59, 2.51] |
| 2.1 Bradycardia | 1 | 60 | Risk Ratio (M‐H, Random, 95% CI) | 1.22 [0.59, 2.51] |
| 3 Women with nausea/vomiting Show forest plot | 1 | 60 | Risk Ratio (M‐H, Random, 95% CI) | 0.45 [0.18, 1.15] |
| 4 Neonatal Apgar score < 8 at 5 min Show forest plot | 1 | 60 | Risk Ratio (M‐H, Random, 95% CI) | 0.0 [0.0, 0.0] |
| Outcome or subgroup title | No. of studies | No. of participants | Statistical method | Effect size |
| 1 Women with hypotension requiring intervention Show forest plot | 1 | 117 | Risk Ratio (M‐H, Random, 95% CI) | 8.17 [1.04, 64.30] |
| 1.1 50 μg/mL vs 100 μg/mL | 1 | 117 | Risk Ratio (M‐H, Random, 95% CI) | 8.17 [1.04, 64.30] |
| 2 Women with hypertension requiring intervention Show forest plot | 1 | 117 | Risk Ratio (M‐H, Random, 95% CI) | 0.23 [0.05, 1.02] |
| 2.1 50 μg/mL vs 100 μg/mL | 1 | 117 | Risk Ratio (M‐H, Random, 95% CI) | 0.23 [0.05, 1.02] |
| 3 Women with cardiac dysrhythmia Show forest plot | 1 | 117 | Risk Ratio (M‐H, Random, 95% CI) | 0.11 [0.01, 0.80] |
| 3.1 Bradycardia: 50 μg/mL vs 100 μg/mL | 1 | 117 | Risk Ratio (M‐H, Random, 95% CI) | 0.11 [0.01, 0.80] |
| 4 Women with nausea and/or vomiting Show forest plot | 1 | 117 | Risk Ratio (M‐H, Random, 95% CI) | 3.5 [0.37, 32.67] |
| 4.1 Nausea and vomiting: 50 μg/mL vs 100 μg/mL | 1 | 117 | Risk Ratio (M‐H, Random, 95% CI) | 3.5 [0.37, 32.67] |
| 5 Neonatal cord blood pH < 7.2 Show forest plot | 1 | 117 | Risk Ratio (M‐H, Random, 95% CI) | 0.0 [0.0, 0.0] |
| 5.1 50 μg/mL vs 100 μg/mL | 1 | 117 | Risk Ratio (M‐H, Random, 95% CI) | 0.0 [0.0, 0.0] |
| 6 Neonatal Apgar score < 8 at 5 min Show forest plot | 1 | 117 | Risk Ratio (M‐H, Random, 95% CI) | 0.0 [0.0, 0.0] |
| 6.1 50 μg/mL vs 100 μg/mL | 1 | 117 | Risk Ratio (M‐H, Random, 95% CI) | 0.0 [0.0, 0.0] |
| Outcome or subgroup title | No. of studies | No. of participants | Statistical method | Effect size |
| 1 Women with hypotension requiring intervention Show forest plot | 2 | 142 | Risk Ratio (M‐H, Random, 95% CI) | 0.63 [0.21, 1.91] |
| 2 Women with hypertension requiring intervention Show forest plot | 1 | 93 | Risk Ratio (M‐H, Random, 95% CI) | 2.67 [1.31, 5.43] |
| 3 Women with bradycardia Show forest plot | 1 | 93 | Risk Ratio (M‐H, Random, 95% CI) | 0.21 [0.01, 4.32] |
| 4 Women with nausea and/or vomiting Show forest plot | 2 | Risk Ratio (M‐H, Random, 95% CI) | Subtotals only | |
| 4.1 Nausea or vomiting | 1 | 93 | Risk Ratio (M‐H, Random, 95% CI) | 2.49 [0.69, 9.04] |
| 4.2 Nausea | 1 | 49 | Risk Ratio (M‐H, Random, 95% CI) | 0.61 [0.36, 1.06] |
| 4.3 Vomiting | 1 | 49 | Risk Ratio (M‐H, Random, 95% CI) | 0.52 [0.10, 2.59] |
| 5 Neonates with Apgar score < 8 at 5 min Show forest plot | 2 | 142 | Risk Ratio (M‐H, Random, 95% CI) | 0.0 [0.0, 0.0] |
| Outcome or subgroup title | No. of studies | No. of participants | Statistical method | Effect size |
| 1 Women with hypotension requiring intervention Show forest plot | 8 | 740 | Risk Ratio (M‐H, Random, 95% CI) | 0.67 [0.54, 0.83] |
| 1.1 2 mg vs control | 2 | 79 | Risk Ratio (M‐H, Random, 95% CI) | 0.90 [0.51, 1.58] |
| 1.2 4 mg vs control | 5 | 277 | Risk Ratio (M‐H, Random, 95% CI) | 0.46 [0.34, 0.63] |
| 1.3 6 mg vs control | 1 | 38 | Risk Ratio (M‐H, Random, 95% CI) | 0.48 [0.22, 1.03] |
| 1.4 8 mg vs control | 5 | 346 | Risk Ratio (M‐H, Random, 95% CI) | 0.85 [0.70, 1.03] |
| 2 Women with bradycardia Show forest plot | 8 | 740 | Risk Ratio (M‐H, Random, 95% CI) | 0.49 [0.28, 0.87] |
| 2.1 2 mg vs control | 2 | 79 | Risk Ratio (M‐H, Random, 95% CI) | 0.23 [0.02, 3.29] |
| 2.2 4 mg vs control | 5 | 277 | Risk Ratio (M‐H, Random, 95% CI) | 0.33 [0.16, 0.71] |
| 2.3 6 mg vs control | 1 | 38 | Risk Ratio (M‐H, Random, 95% CI) | 0.0 [0.0, 0.0] |
| 2.4 8 mg vs control | 5 | 346 | Risk Ratio (M‐H, Random, 95% CI) | 0.94 [0.38, 2.37] |
| 3 Women with nausea or vomiting Show forest plot | 7 | 653 | Risk Ratio (M‐H, Random, 95% CI) | 0.35 [0.24, 0.51] |
| 3.1 2 mg vs control | 2 | 79 | Risk Ratio (M‐H, Random, 95% CI) | 0.54 [0.18, 1.59] |
| 3.2 4 mg vs control | 5 | 277 | Risk Ratio (M‐H, Random, 95% CI) | 0.32 [0.17, 0.60] |
| 3.3 6 mg vs control | 1 | 38 | Risk Ratio (M‐H, Random, 95% CI) | 0.09 [0.01, 0.74] |
| 3.4 8 mg vs control | 4 | 259 | Risk Ratio (M‐H, Random, 95% CI) | 0.38 [0.19, 0.76] |
| 4 Women with anaphylaxis Show forest plot | 1 | 150 | Risk Ratio (M‐H, Random, 95% CI) | 0.0 [0.0, 0.0] |
| 4.1 2 mg vs control | 1 | 37 | Risk Ratio (M‐H, Random, 95% CI) | 0.0 [0.0, 0.0] |
| 4.2 4 mg vs control | 1 | 37 | Risk Ratio (M‐H, Random, 95% CI) | 0.0 [0.0, 0.0] |
| 4.3 6 mg vs control | 1 | 38 | Risk Ratio (M‐H, Random, 95% CI) | 0.0 [0.0, 0.0] |
| 4.4 8 mg vs control | 1 | 38 | Risk Ratio (M‐H, Random, 95% CI) | 0.0 [0.0, 0.0] |
| 5 Neonatal Apgar score < 8 at 5 min Show forest plot | 3 | 284 | Risk Ratio (M‐H, Random, 95% CI) | 0.0 [0.0, 0.0] |
| 5.1 2 mg vs control | 1 | 37 | Risk Ratio (M‐H, Random, 95% CI) | 0.0 [0.0, 0.0] |
| 5.2 4 mg vs control | 2 | 102 | Risk Ratio (M‐H, Random, 95% CI) | 0.0 [0.0, 0.0] |
| 5.3 6 mg vs control | 1 | 38 | Risk Ratio (M‐H, Random, 95% CI) | 0.0 [0.0, 0.0] |
| 5.4 8 mg vs control | 2 | 107 | Risk Ratio (M‐H, Random, 95% CI) | 0.0 [0.0, 0.0] |
| 6 Neonatal pH < 7.2 Show forest plot | 2 | 134 | Risk Ratio (M‐H, Random, 95% CI) | 0.48 [0.05, 5.09] |
| 6.1 4 mg vs control | 1 | 65 | Risk Ratio (M‐H, Random, 95% CI) | 0.48 [0.05, 5.09] |
| 6.2 8 mg vs control | 1 | 69 | Risk Ratio (M‐H, Random, 95% CI) | 0.0 [0.0, 0.0] |
| Outcome or subgroup title | No. of studies | No. of participants | Statistical method | Effect size |
| 1 Women with hypotension requiring intervention Show forest plot | 1 | 112 | Risk Ratio (M‐H, Random, 95% CI) | 1.07 [0.76, 1.49] |
| 2 Women with bradycardia Show forest plot | 1 | 112 | Risk Ratio (M‐H, Random, 95% CI) | 3.0 [0.12, 72.10] |
| 3 Women with nausea and/or vomiting Show forest plot | 1 | 112 | Risk Ratio (M‐H, Random, 95% CI) | 0.38 [0.10, 1.34] |
| Outcome or subgroup title | No. of studies | No. of participants | Statistical method | Effect size |
| 1 Women with hypotension requiring intervention Show forest plot | 1 | 200 | Risk Ratio (M‐H, Random, 95% CI) | 0.05 [0.02, 0.14] |
| Outcome or subgroup title | No. of studies | No. of participants | Statistical method | Effect size |
| 1 Women with hypotension requiring intervention Show forest plot | 1 | 105 | Risk Ratio (M‐H, Random, 95% CI) | 0.79 [0.62, 1.01] |
| 1.1 0.25 mg/kg IV ketamine | 1 | 52 | Risk Ratio (M‐H, Random, 95% CI) | 0.83 [0.61, 1.14] |
| 1.2 0.5 mg/kg IV ketamine | 1 | 53 | Risk Ratio (M‐H, Random, 95% CI) | 0.73 [0.50, 1.07] |
| 2 Women with nausea and/or vomiting Show forest plot | 1 | 105 | Risk Ratio (M‐H, Random, 95% CI) | 0.79 [0.50, 1.25] |
| 2.1 0.25 mg/kg IV ketamine | 1 | 52 | Risk Ratio (M‐H, Random, 95% CI) | 0.91 [0.48, 1.71] |
| 2.2 0.5 mg/kg IV ketamine | 1 | 53 | Risk Ratio (M‐H, Random, 95% CI) | 0.69 [0.36, 1.31] |
| 3 Apgar score < 8 at 5 min Show forest plot | 1 | 105 | Risk Ratio (M‐H, Random, 95% CI) | 0.0 [0.0, 0.0] |
| 3.1 0.25 mg/kg IV ketamine | 1 | 52 | Risk Ratio (M‐H, Random, 95% CI) | 0.0 [0.0, 0.0] |
| 3.2 0.5 mg/kg IV ketamine | 1 | 53 | Risk Ratio (M‐H, Random, 95% CI) | 0.0 [0.0, 0.0] |
| Outcome or subgroup title | No. of studies | No. of participants | Statistical method | Effect size |
| 1 Women with hypotension requiring intervention Show forest plot | 1 | 20 | Risk Ratio (M‐H, Random, 95% CI) | 0.09 [0.01, 1.45] |
| 2 Women with nausea and/or vomiting Show forest plot | 1 | 20 | Risk Ratio (M‐H, Random, 95% CI) | 0.2 [0.01, 3.70] |
| 3 Neonates with acidosis (pH < 7.2) Show forest plot | 1 | 20 | Risk Ratio (M‐H, Random, 95% CI) | 0.0 [0.0, 0.0] |
| Outcome or subgroup title | No. of studies | No. of participants | Statistical method | Effect size |
| 1 Women with hypotension requiring intervention Show forest plot | 1 | 30 | Risk Ratio (M‐H, Random, 95% CI) | 0.05 [0.00, 0.75] |
| 2 Neonatal Apgar score < 8 at 5 min Show forest plot | 1 | 30 | Risk Ratio (M‐H, Random, 95% CI) | 0.0 [0.0, 0.0] |
| Outcome or subgroup title | No. of studies | No. of participants | Statistical method | Effect size |
| 1 Women with hypotension requiring intervention Show forest plot | 11 | 705 | Risk Ratio (M‐H, Random, 95% CI) | 0.61 [0.47, 0.78] |
| 2 Women with bradycardia Show forest plot | 1 | 74 | Risk Ratio (M‐H, Random, 95% CI) | 0.63 [0.11, 3.56] |
| 3 Women with nausea and/or vomiting Show forest plot | 4 | Risk Ratio (M‐H, Random, 95% CI) | Subtotals only | |
| 3.1 Women with nausea and/or vomiting | 4 | 276 | Risk Ratio (M‐H, Random, 95% CI) | 0.42 [0.14, 1.27] |
| 3.2 Women with nausea | 1 | 92 | Risk Ratio (M‐H, Random, 95% CI) | 1.44 [0.25, 8.20] |
| 3.3 Women with vomiting | 1 | 92 | Risk Ratio (M‐H, Random, 95% CI) | 0.0 [0.0, 0.0] |
| 4 Neonates with Apgar score < 8 at 5 min Show forest plot | 3 | 130 | Risk Ratio (M‐H, Random, 95% CI) | 0.0 [0.0, 0.0] |
| Outcome or subgroup title | No. of studies | No. of participants | Statistical method | Effect size |
| 1 Women with hypotension requiring intervention Show forest plot | 1 | 80 | Risk Ratio (M‐H, Random, 95% CI) | 0.85 [0.53, 1.37] |
| 2 Women with nausea and/or vomiting Show forest plot | 1 | Risk Ratio (M‐H, Random, 95% CI) | Subtotals only | |
| 2.1 Women with nausea | 1 | 80 | Risk Ratio (M‐H, Random, 95% CI) | 0.27 [0.12, 0.60] |
| 2.2 Women with vomiting | 1 | 80 | Risk Ratio (M‐H, Random, 95% CI) | 0.11 [0.01, 2.00] |
| Outcome or subgroup title | No. of studies | No. of participants | Statistical method | Effect size |
| 1 Women with hypotension requiring intervention Show forest plot | 1 | 40 | Risk Ratio (M‐H, Random, 95% CI) | 0.71 [0.47, 1.06] |
| 2 Neonates with Apgar score < 8 at 5 min Show forest plot | 1 | 40 | Risk Ratio (M‐H, Random, 95% CI) | 0.0 [0.0, 0.0] |
| Outcome or subgroup title | No. of studies | No. of participants | Statistical method | Effect size |
| 1 Women with hypotension requiring intervention Show forest plot | 1 | 34 | Risk Ratio (M‐H, Random, 95% CI) | 1.07 [0.81, 1.42] |
| Outcome or subgroup title | No. of studies | No. of participants | Statistical method | Effect size |
| 1 Women with hypotension requiring intervention Show forest plot | 1 | 40 | Risk Ratio (M‐H, Random, 95% CI) | 0.92 [0.57, 1.49] |
| 2 Neonates with Apgar score < 8 at 5 min Show forest plot | 1 | 40 | Risk Ratio (M‐H, Random, 95% CI) | 0.0 [0.0, 0.0] |
| Outcome or subgroup title | No. of studies | No. of participants | Statistical method | Effect size |
| 1 Women with hypotension requiring intervention Show forest plot | 1 | 98 | Risk Ratio (M‐H, Random, 95% CI) | 0.81 [0.58, 1.12] |
| 2 Women with nausea and/or vomiting Show forest plot | 1 | Risk Ratio (M‐H, Random, 95% CI) | Subtotals only | |
| 2.1 Nausea | 1 | 98 | Risk Ratio (M‐H, Random, 95% CI) | 0.65 [0.40, 1.07] |
| 2.2 Vomiting | 1 | 98 | Risk Ratio (M‐H, Random, 95% CI) | 0.38 [0.02, 9.01] |
| 3 Neonates with acidosis (pH < 7.2) Show forest plot | 1 | 98 | Risk Ratio (M‐H, Random, 95% CI) | 0.0 [0.0, 0.0] |
| 4 Neonates with Apgar < 7 at 5 min Show forest plot | 1 | 98 | Risk Ratio (M‐H, Random, 95% CI) | 0.0 [0.0, 0.0] |
| Outcome or subgroup title | No. of studies | No. of participants | Statistical method | Effect size |
| 1 Women requiring intervention for hypotension Show forest plot | 1 | 37 | Risk Ratio (M‐H, Random, 95% CI) | 0.71 [0.41, 1.21] |
| Outcome or subgroup title | No. of studies | No. of participants | Statistical method | Effect size |
| 1 Women with hypotension requiring intervention Show forest plot | 2 | 126 | Risk Ratio (M‐H, Random, 95% CI) | 0.91 [0.75, 1.09] |
| 2 Women with cardiac dysrhythmia requiring intervention Show forest plot | 1 | 40 | Risk Ratio (M‐H, Random, 95% CI) | 0.5 [0.05, 5.08] |
| 3 Neonates admitted to neonatal intensive care unit Show forest plot | 1 | 40 | Risk Ratio (M‐H, Random, 95% CI) | 0.0 [0.0, 0.0] |
| 4 Women with nausea Show forest plot | 1 | 86 | Risk Ratio (M‐H, Random, 95% CI) | 0.81 [0.45, 1.48] |
| Outcome or subgroup title | No. of studies | No. of participants | Statistical method | Effect size |
| 1 Women with hypotension requiring intervention Show forest plot | 1 | 58 | Risk Ratio (M‐H, Random, 95% CI) | 1.20 [0.80, 1.79] |
| 2 Women with cardiac dysrhythmia requiring intervention Show forest plot | 1 | Risk Ratio (M‐H, Random, 95% CI) | Subtotals only | |
| 2.1 Bradycardia | 1 | 58 | Risk Ratio (M‐H, Random, 95% CI) | 0.10 [0.01, 1.68] |
| 3 Women with nausea and/or vomiting Show forest plot | 1 | Risk Ratio (M‐H, Random, 95% CI) | Subtotals only | |
| 3.1 Nausea: 15 degree tilt | 1 | 58 | Risk Ratio (M‐H, Random, 95% CI) | 0.45 [0.18, 1.11] |
| 3.2 Vomiting: 15 degree tilt | 1 | 58 | Risk Ratio (M‐H, Random, 95% CI) | 0.15 [0.01, 2.83] |
| Outcome or subgroup title | No. of studies | No. of participants | Statistical method | Effect size |
| 1 Women with hypotension requiring intervention Show forest plot | 1 | 90 | Risk Ratio (M‐H, Random, 95% CI) | 0.63 [0.49, 0.80] |
| Outcome or subgroup title | No. of studies | No. of participants | Statistical method | Effect size |
| 1 Women with hypotension requiring intervention Show forest plot | 1 | 63 | Risk Ratio (M‐H, Random, 95% CI) | 0.73 [0.42, 1.26] |
| Outcome or subgroup title | No. of studies | No. of participants | Statistical method | Effect size |
| 1 Women with hypotension requiring intervention Show forest plot | 1 | 50 | Risk Ratio (M‐H, Random, 95% CI) | 0.84 [0.58, 1.22] |
| 2 Women with nausea and/or vomiting Show forest plot | 1 | Risk Ratio (M‐H, Random, 95% CI) | Subtotals only | |
| 2.1 Nausea | 1 | 50 | Risk Ratio (M‐H, Random, 95% CI) | 0.32 [0.15, 0.66] |
| 2.2 Vomiting | 1 | 50 | Risk Ratio (M‐H, Random, 95% CI) | 0.5 [0.14, 1.78] |
| 3 Neonates with Apgar < 7 at 5 min Show forest plot | 1 | 50 | Risk Ratio (M‐H, Random, 95% CI) | 0.0 [0.0, 0.0] |
| Outcome or subgroup title | No. of studies | No. of participants | Statistical method | Effect size |
| 1 Women with hypotension requiring intervention Show forest plot | 1 | 50 | Risk Ratio (M‐H, Random, 95% CI) | 0.94 [0.63, 1.40] |
| 2 Women with nausea and/or vomiting Show forest plot | 1 | Risk Ratio (M‐H, Random, 95% CI) | Subtotals only | |
| 2.1 Nausea | 1 | 50 | Risk Ratio (M‐H, Random, 95% CI) | 1.5 [0.48, 4.68] |
| 2.2 Vomiting | 1 | 50 | Risk Ratio (M‐H, Random, 95% CI) | 3.0 [0.33, 26.92] |
| 3 Neonates with Apgar < 7 at 5 min Show forest plot | 1 | 50 | Risk Ratio (M‐H, Random, 95% CI) | 0.0 [0.0, 0.0] |