Interferon in relapsing‐remitting multiple sclerosis
Abstract
Background
Recombinant interferons have been shown to suppress both the clinical and magnetic resonance imaging (MRI) measures of disease activity in patients with relapsing remitting multiple sclerosis (RRMS).
Objectives
The objective of this review was to assess the effects of recombinant interferons in adults with RRMS.
Search methods
We searched the Cochrane Multiple Sclerosis Group trials register (April 2007), MEDLINE (January 1966 April 2007), EMBASE (January 1985 to April 2007) and reference lists of articles. We also contacted manufacturers and researchers in the field
Selection criteria
The trials selected were double‐blind, placebo‐controlled, randomised trials of RRMS patients who were treated with recombinant interferon, given by the subcutaneous or the intramuscular route.
Data collection and analysis
All reviewers independently assessed trial quality and extracted data. Study authors were contacted for additional information. Adverse effects information was collected from the trials.
Main results
Although eight trials involving 1301 participants were included in this review, only 919 (71%) contributed to the results concerning exacerbations and progression of the disease at two years. Specifically interferon significantly reduced the occurrence of exacerbations (Relative risk [RR] 0.80, 95% confidence interval [CI] 0.73 to 0.88, p < 0.001) and progression of the disease (RR 0.69, 95% CI 0.55 to 0.87, p = 0.002) two years after randomisation. However, the correct assignment of dropouts was essential to the demonstration of efficacy, most conspicuously concerning the effect of the drug on disease progression. If interferon‐treated participants who dropped out were deemed to have progressed (worst case scenario) the significance of these effects was lost (RR 1.31, 95% CI 0.60 to 2.89, p = 0.5). The evolution in magnetic resonance imaging (MRI) technology in the decade in which these trials were performed and different reporting of data among trials made it impossible to perform a quantitative analysis of the MRI results. Both clinical and laboratory side effects reported in the trials were more frequent in treated participants than in controls; there was no information after two years of follow‐up. The impact of interferon treatment (and its side effects) on the quality of life of patients was not reported in any trial included in this review.
Authors' conclusions
The efficacy of interferon on exacerbations and disease progression in patients with relapsing remitting MS was modest after one and two years of treatment. Interferon administered by the oral route was not effective for prevention of relapses. Longer follow‐up and more uniform reporting of clinical and MRI outcomes among these trials might have allowed for a more convincing conclusion.
Plain language summary
The use of interferons for treating people with the relapsing‐remitting form of multiple sclerosis
Multiple sclerosis (MS) is a chronic disease of the nervous system which affects young and middle‐aged adults. Repeated damage to the myelin sheaths and other parts of the nerves can lead to serious disability. MS may be related to the immune system. Interferons have several effects on the immune system, and act against viruses. Interferons can help to reduce disability and attacks for people with multiple sclerosis, but there is not enough evidence about their usefulness in the long term. The review of trials found that interferons administered intramuscularly or subcutaneously can lead to a moderate reduction in recurrences and disability in people who have MS with remissions. Interferon‐1a administered by the oral route was not effective for prevention of relapses. Side effects were usually influenza‐like symptoms, injection site‐reactions, pains in the joints and muscles, fatigue and headache.
Authors' conclusions
Background
Description of the condition
Multiple sclerosis (MS) is the commonest seriously disabling disease of young adults. Although the etiology is largely unknown, it is believed that MS develops in genetically predisposed individuals and that autoimmune mechanisms play a central role in its pathogenesis (Noseworthy 1999). Environmental factors are suspected to play a role, but the magnitude of their effect has not been clearly elucidated.
Description of the intervention
Interferons have been studied extensively in MS for more than 20 years, reflecting both the desperate need for an effective treatment for MS and the desire to expand the role for interferons, which had been found helpful only in some malignancies and viral hepatitis. It could be conceded that the development of interferon in recent years was largely fuelled by the success of the drug in a few early pilot trials (Jacobs 1981; Knobler 1984a).
How the intervention might work
Interferons have many actions of potential relevance to MS. Antiviral effects, pleiotropic effects on the immune system and blood brain barrier could all contribute to a benefit in patients with MS (Hohlfeld 1997). It is not known which of these mechanisms underlies the reported efficacy of interferons in the disease. Although tantalizing immunological effects of interferons in MS have been reported (induction of interleukin‐6, 10), readers should be reminded that these observations are established only for certain populations of treated patients, compared to controls. No single biochemical marker has been linked to a clinical or magnetic resonance imaging (MRI) response in individual patients, although research in this area is promising (vanBoxel‐Dezaire2000).
Why it is important to do this review
Recombinant interferons have been approved by the regulatory authorities of many countries for the treatment of relapsing remitting MS (RRMS) but many questions remain concerning their efficacy in preventing progression of the disease and increased disability in the long term, the optimum dose and duration of treatment and the consequences of discontinuation of the drug. No systematic reviews of this subject are known to exist.
Objectives
The efficacy and safety of recombinant interferons in the treatment of patients with relapsing remitting MS (RRMS) were evaluated. The primary questions were whether recombinant interferon was more effective than placebo in decreasing the number of patients who experience clinical relapses and disease progression.
The secondary objectives were:
(1) To examine the efficacy of recombinant interferon in reducing the need for corticosteroid treatment and hospitalisation of RRMS patients;
(2) To evaluate the incidence and seriousness of side effects and adverse events;
(3) To assess the effect of interferon on magnetic resonance imaging (MRI) which is a surrogate outcome.
Methods
Criteria for considering studies for this review
Types of studies
We included only randomised, double blind, placebo‐controlled trials of recombinant interferons. Uncontrolled and non‐randomised trials were excluded. We excluded trials which were confounded by other treatments such as immunosuppressive drugs. Trials which addressed the efficacy of interferons in progressive forms of MS will be reviewed at a later date.
Types of participants
The diagnosis of multiple sclerosis was accepted on the basis of established clinical and paraclinical evidence. The definition of Poser was most commonly applied (Poser 1983). Patients in a relapsing‐remitting phase were included. This is defined as the phase of the disease characterised by one or more exacerbations followed by complete or partial recovery. Patients are clinically stable between exacerbations.
Types of interventions
We considered all trials in which alfa‐ or beta‐ recombinant interferons had been compared to placebo. Trials were not excluded on the basis of dose, duration of treatment, route of administration or length of follow up. For trials in which treatment effects were reported for more than one dose, we restricted the analysis to the higher dose (which is the dose most frequently used in clinical practice).
Types of outcome measures
Primary outcomes
The primary outcome measures included:
(1) the number of patients who continued to experience exacerbations during the scheduled treatment period and the follow‐up period. Exacerbation was defined as newly developed or recently worsened symptoms of neurologic dysfunction that lasted more than 24 hours, with or without objective confirmation, and that stabilised or resolved either partially or completely;
(2) the number of patients who progressed during the first two years of treatment. The definition of progression was taken from the original articles. Most studies used the Expanded Disability Status Scale (EDSS) (Kurtzke 1983) and the definition of progression was a sustained (three or six months) increase in EDSS of at least one point recorded out of exacerbation. EDSS is the most widely used disability measure in clinical trials of MS. It is based on the results of a neurologic examination and the patient's ability to walk. Scores range from 0 (no neurologic abnormality) to 10 (death from MS) (Table 1);
(3) mean change in disability score (EDSS) in treatment groups at the end of the follow‐up period;
(4) the number of patients who were unable to walk without aid (EDSS greater than 5.5) at the end of the follow‐up period.
| Score |
| 0‐Normal neurologic examination |
| 1.0‐No disability, minimal signs on one Functional System (FS)* |
| 1.5‐No disability, minimal signs on >1 FS |
| 2.0‐Minimal disability in 1 FS |
| 2.5‐Minimal disability in 2 FS |
| 3.0‐Moderate disability in 1 FS; or mild disability in 3‐4 FS, though fully ambulatory |
| 3.5‐Fully ambulatory but with moderate disability in 3‐4 FS |
| 4.0‐Fully ambulatory without aid, up and about 12hrs./day despite relatively severe disability. Able to walk without aid 500meters |
| 4.5‐Fully ambulatory without aid, up and about much of day, able to work a full day, may otherwise have some limitations of full activity or require minimal assistance. Relatively severe disability. Able to walk without aid 300meters |
| 5.0‐Ambulatory without aid for about 200m. Disability impairs full daily activities |
| 5.5‐Ambulatory for 100m, disability precludes full daily activities |
| 6.0‐Intermittent or unilateral constant assistance required to walk 100m with or without resting |
| 6.5‐Constant bilateral support required to walk 20m. without resting |
| 7.0‐Unable to walk beyond 5m even with aid, essentially restricted to wheelchair, wheels self, transfers alone |
| 7.5‐Unable to take more than a few steps, restricted to wheelchair, any need aid in transfer, wheels self but may require motorized chair for full day's activities |
| 8.0‐Essentially restricted to bed or chair or perambulated in wheelchair, but may be out of bed much of day, retains self care functions, generally effective use of arms |
| 8.5‐Essentially restricted to bed much of day,some effective use of arms, some self care functions |
| 9.0‐Helpless bed patient, can communicate and eat |
| 9.5‐Unable to communicate effectively or eat/swallow |
| 10.0‐Death |
| * Functional Systems are eight scales representing different functions of the Central Nervous System (Kurtzke 1961). Each system is rated on a five‐point (three systems) or six‐point (four systems) response scale except 'Other Functions' which is rated dichotomously (0 = none, 1 = any other neurological findings attributed to multiple sclerosis) |
Secondary outcomes
The secondary outcome measures included:
(1) time to first exacerbation;
(2) time to progression in disability;
(3) the number of patients who underwent steroid administration during interferon treatment and follow‐up;
(4) the number of patients who were hospitalised during treatment and follow‐up;
(5) the number of patients experiencing side effects or adverse events;
(6) the effect of treatment on the magnetic resonance imaging which is considered a surrogate outcome. It included:
(a) the mean change of total lesion load on T2‐weighted images during treatment and follow‐up;
(b) the number of patients who continued to show gadolinium‐enhancing lesions during treatment and follow‐up. Gadolinium is a paramagnetic contrast agent for magnetic resonance that identifies deficiencies in the blood brain barrier.
Search methods for identification of studies
A systematic search without language resctrictions was conducted to identify all relevant publisched and unpublished randomised controlled trials. We identified 125 articles in MEDLINE, a further 23 in EMBASE, 46 by handsearching and 14 in the Cochrane Controlled Trials Register. We did not identify any unpublished trials.
Electronic searches
We searched the following databases:
1. Cochrane Multiple Sclerosis Group trials register (April 2007)
2. MEDLINE January 1966 to April 2007 (Appendix 1)
3. EMBASE January 1988 to April 2007 (Appendix 2)
Searching other resources
4.Handsearching of the references quoted in the identified trials, symposia reports (1990 to 2007) from the most important neurological associations and MS Societies in Europe and America;
5. contact with researchers who were participating in trials on interferons; and
6. contact with the following companies in order to identify unpublished trials or data missing from articles: Biogen (Avonex: interferon beta‐1a), Ares Serono International SA (Rebif: interferon beta‐1a), Schering AG (Betaseron or Betaferon: interferon beta‐1b), Berlex Laboratories (Betaseron or Betaferon: interferon beta‐1b), Roche (Roferon: interferon alfa‐ 2a).
Data collection and analysis
STUDY SELECTION
The reviewers independently scrutinised the trials and decided which trials met the inclusion criteria. We resolved all disagreement about including or excluding a trial by discussion among the reviewers.
QUALITY ASSESSMENT
The trials were judged on the reported method of allocation concealment as: adequate (A), unclear (B) or inadequate (C) as outlined in the "Cochrane Reviewers' Handbook " (Clarke 2000). The assessment also included the adequacy of blinding, the definition and clinical relevance of outcomes, the number of participants who withdrew or were withdrawn from the trial after randomisation and the number with incomplete follow‐up. We also addressed whether an intention‐to treat analysis was done or could be done. When this information was not reported, we submitted a formal request to the trial sponsors. When investigators did not respond, the item was considered unclear.
We extracted data concerning side effects or adverse events for each effect or event whenever possible. For trials in which they were reported for more than one dose, we reported the data pertaining to the higher dose.
DATA EXTRACTION
The reviewers extracted the data independently: characteristics of participants, interventions (type of interferon, type of placebo, dose, duration of treatment, length of follow‐up), outcome measures, use of corticosteroids and need for hospitalisation during the scheduled treatment and follow up, side effects and adverse events. We also extracted the date and location of trial, sponsor of trial (specified, known or unknown) and publication status. Disagreement about quality assessment and data were resolved by discussion among the reviewers. All data were registered on a collection form.
DATA ANALYSIS
We sought data on the number of participants in the treatment groups and with each outcome, irrespective of compliance or completeness of follow‐up, in the articles or requested from the authors in order to do an "intention‐to‐treat" analysis.
We analysed binary outcomes by calculating relative risks for each trial with the uncertainty in each trial being expressed using 95% confidence intervals (CI). We analysed continuous outcomes according to the difference between their means. For each outcome we calculated a weighted treatment effect across trials. We expressed results as a weighted estimate of relative risk with the relative 95% CI for binary outcomes, and difference between means across trials for continuous outcomes. We performed statistical analyses with the Review Manager software developed by the Cochrane Collaboration (4.1).
We considered the number of participants who need to be treated (NNT) to prevent one event for the following outcomes:
-
participants who continued to experience exacerbations during the first year;
-
participants who continued to experience exacerbations during the first two years;
-
participants who progressed during the first two years.
The NNT has been calculated as the reciprocal of the absolute risk reduction (1/ARR). ARR is the risk difference between participants treated with interferon and controls. It is known that ARR is sensitive to factors that change the baseline risk such as the outcome considered, participants' characteristics and the clinical setting (Smeeth 1999). Since the baseline risk often varies appreciably between the trials, we calculated ARR according to different levels of baseline risk (BR), ranging from 0.1 to 0.9, as follows: ARR = BR‐ (RR x BR), where RR is the relative risk resulting from meta analysis.
Homogeneity among trial results was evaluated using a standard chi squared test and we rejected the hypothesis of homogeneity if the p value was less than 0.10. Trial outcomes were combined using a fixed effect approach (Yusuf 1985) unless there was a significant heterogeneity, in which case we summarised results using a random effects model (DerSimonian 1986c).
We did subgroup analyses because we hypothesised a priori that responses might differ according to: (1) type of interferon; (2) dose; (3) duration of treatment; and (4) length of follow‐up.
We evaluated heterogeneity in the effect of treatment between studies by meta‐regression in order to analyse associations between treatment effect and study characteristics. Meta‐regression was done in STATA.
We conducted a sensitivity analysis to address the effect of withdrawn and lost to follow‐up on the major outcomes. The best case scenario (with regards to treatment) assumed that none of the patients who were excluded from the analysis in the interferon‐treated group had the outcome of interest, while all those excluded from the control group did and vice versa for the worst case scenario.
Results
Description of studies
For the first version of this review 208 articles identified by the search strategy, eighteen articles were selected provisionally, on the basis of the inclusion criteria mentioned above.
We excluded eleven studies after reading the full published papers: two studies were open‐label (Rudick 1998; Herndon 1999); in three studies participants were treated with natural interferon‐alfa (IFN‐alfa) (Knobler 1984; AUSTIMS 1989; Milanese 1990); in one study only immunological, not clinical, outcomes were reported (Hirsch 1986); one study was a dose‐comparison trial of interferon beta‐1a without a placebo group (Pozzilli 1997); one study was performed on progressive MS participants and included only two participants with relapsing‐remitting MS (Rudge 1995); one study reported data only relating to the placebo group of a RCT on interferon beta‐1a (IFNB‐1a) (Simon 1999) and in one study (Jacobs 2000) participants were treated after a first exacerbation, prior to a definite diagnosis of MS. Finally, one study was excluded because neither blinding criteria nor clinical outcomes were clearly described (Schwartz 1997). (See table of excluded studies).
During the update of the review we first identified two studies that met the inclusion criteria. One of them (Granger 2003) was excluded because it is a secondary analysis of a study already included in this review (The MSCRG 1996) using FIM instrument instead of EDSS to assess disease progression.
Thus eight trials contributed to this review: the earliest was published in 1993 and the most recent in 2003 (Knobler 1993; IFNB MS Group 1993; Durelli 1994; The MSCRG 1996; The PRISMS 1998; Myhr 1999; The OWIMS 1999; Polman 2003). A total of 1301 experimental participants (in the higher dose arms which were compared with placebo treated participants), including 658 treated with interferon and 643 randomised to placebo, were included in this review. One multicenter study of subcutaneous IFNB‐1a (The PRISMS 1998) accounted for 371 (30.5%) participants while a study of intramuscular IFNA‐2a (Durelli 1994) accounted for only 20 (1.6%) participants. All studies included only relapsing‐remitting MS participants. (See table of included studies).
THE AGENTS COMPARED WITH PLACEBO WERE:
-
IFNA‐2a: 9.0 MIU self‐administered intramuscularly every other day for six months (Durelli 1994), 4.5 or 9.0 MIU administered by study physician subcutaneously three times weekly for six months (Myhr 1999). The dose of 9.0 MIU was used for comparison.
-
IFNB‐1a: 6.0 MIU administered once weekly by the intramuscular route for 104 weeks, by study nurses or local health professionals under the supervision of study personnel (The MSCRG 1996), 6.0 or 12.0 MIU self‐administered subcutaneously once a week for 48 weeks (The OWIMS 1999), 6.0 or 12.0 MIU self‐administered subcutaneously three times weekly for two years (The PRISMS 1998). In the last two studies the dose of 12.0 MIU was used for comparison with placebo. In one study (Polman 2003), 0.06, 0.6, or 6 MIU were administered every day by the oral route.
-
IFNB‐1b: 1.6 or 8.0 MIU self‐administered subcutaneously every other day for two years (IFNB MS Group 1993); 0.8 or 4.0 or 8.0 or 16.0 MIU self‐administered subcutaneously three times weekly for three years (Knobler 1993). The doses of 8.0 MIU and 16.0 MIU were used in the first and second study respectively.
EXCLUSION CRITERIA
Exclusion criteria were specified in seven trials (IFNB MS Group 1993; Durelli 1994; The MSCRG 1996; The PRISMS 1998; Myhr 1999; The OWIMS 1999; Polman 2003). The first trial (IFNB MS Group 1993) excluded participants who had been treated with ACTH or prednisone during the 30 days prior to entry or who had received any previous treatment with azathioprine or cyclophosphamide. The second trial (Durelli 1994) excluded participants who had other severe illnesses, participants who had been treated previously with interferon or cytostatic drugs or with ACTH or corticosteroids during three months before entry, and women who were pregnant. The MSCRG (The MSCRG 1996) excluded patients with prior therapy with immunosuppressants, interferon or ACTH/steroids within two months before study entry; patients with infection or other active disease; patients with progressive MS; those who were pregnant or breastfeeding and those unwilling to practice contraception during the study. The fourth study (The PRISMS 1998) excluded patients who had previously received interferon, lymphoid irradiation, cyclophosphamide or immunomodulatory or immunosuppressive drugs in the 12 months prior to the study. The fifth study (Myhr 1999) excluded patients who were pregnant or breastfeeding; those who were unwilling to practice contraception; those previously treated with interferon or immunosuppressants during the previous year or steroids in the month before randomisation; patients experiencing significant concomitant disease and those who were in the progressive phase of the disease. The OWIMS study (The OWIMS 1999) excluded patients who were pregnant or lactating, patients who were concomitantly ill with other conditions and those who had previously been treated with interferon, cyclophosphamide, lymphoid irradiation or any immunosuppressive or experimental therapy in the preceding twelve months. In the trial testing oral interferon (Polman 2003) patients were excluded if any previous parenteral IFN treatment had been terminated due to inefficacy. In only one study (Knobler 1993) exclusion criteria were not reported.
All trials applied diagnostic criteria for MS (Poser 1983).
Data on the time period of patient recruitment were missing in the Myhr study (Myhr 1999) and in the Polman study (Polman 2003). The scheduled follow‐up periods were six months (Durelli 1994), 48 weeks (The OWIMS 1999), 12 months (Myhr 1999), two years (IFNB MS Group 1993; The MSCRG 1996; The PRISMS 1998) and three years (Knobler 1993).
OUTCOMES
A clinical outcome was the primary outcome measure in five studies: clinical relapse (IFNB MS Group 1993; Knobler 1993; Durelli 1994;The PRISMS 1998) or disability progression (The MSCRG 1996).
Magnetic resonance imaging was used as the primary outcome measure in two studies (The OWIMS 1999; Myhr 1999) in which clinical outcomes were reported as the secondary outcomes. In the Polman study (Polman 2003) primary outcome was the cumulative number of newly active lesions seen on brain MRI scans; secondary outcomes included volume of enhancing lesions on TI‐weighted images each month, lesion volume on T2‐weighted images at month 3 and 6 and safety measures.
CLINICAL OUTCOME
In five trials (Knobler 1993; Durelli 1994; The PRISMS 1998; Myhr 1999; The OWIMS 1999) data were available on the number of participants who continued to experience exacerbations during the first treatment year; and in three trials (IFNB MS Group 1993; The MSCRG 1996; The PRISMS 1998) exacerbations were reported over the two years following randomisation. Comparable definitions of relapse were used in the trials and included:
-
acute or subacute objective deterioration of neurological status attributable to the disease, lasting at least 24 hours in the absence of fever and followed by complete or partial resolution (described by Poser 1983)(Durelli 1994);
-
a new symptom or worsening of an old symptom accompanied by a new neurologic abnormality, lasting at least 24 hours in the absence of fever and preceded by stability or improvement for at least 30 days (described by Schumacher 1968) (IFNB MS Group 1993; Knobler 1993; The PRISMS 1998; Myhr 1999; The OWIMS 1999);
-
a new symptom or worsening of an old symptom of at least 48 hours, which followed clinical stability or improvement of at least 30 days duration (described by Jacobs 1995) (The MSCRG 1996).
Definitions of disease progression were also similar:
-
deterioration from baseline = 1.0 point or more on the Expanded Disability Status Scale (EDSS) persisting for at least six months (The MSCRG 1996);
-
increase in EDSS of at least 1.0 point sustained over at least three months (IFNB MS Group 1993; The PRISMS 1998).
In two trials (IFNB MS Group 1993; The PRISMS 1998) the mean disability score (EDSS) was reported as a change of disability with respect to the baseline.
The number of patients who were unable to walk without aid (EDSS score greater than 5.5 ) at the end of the follow‐up period was not reported in any trial.
Time from randomisation to first exacerbation was reported as the median time.
Two studies (Durelli 1994; Myhr 1999) reported the number of participants who underwent steroid treatment in the first year after randomisation and one study (The PRISMS 1998) reported participants with steroid treatment within two years of randomisation.
Hospitalisation within two years was included as an outcome in two studies (Durelli 1994; The PRISMS 1998).
SIDE EFFECTS AND ADVERSE EVENTS
Data concerning the numbers of participants with side effects or adverse events (attributed to interferon during the study according to the authors) were reported in six trials (IFNB MS Group 1993; Durelli 1994; The MSCRG 1996; The PRISMS 1998; Myhr 1999; The OWIMS 1999). One study (Knobler 1993) did not report data for each treatment group, but only gave cumulative numbers for groups that had received different doses of interferon. Finally, it was not possible in any of the trials to assess the length of time for the development of side effects or adverse events, either due to short follow‐up periods or because of incomplete reporting.
MAGNETIC RESONANCE IMAGING (MRI)
Seven trials reported MRI data using a number of different assessments, measures and time of follow‐up. One study (IFNB MS Group 1993) reported MRI data for only 60% of the randomised participants. In another study (The OWIMS 1999) the authors reported the results of MRI, but without the numbers of participants who underwent complete MRI evaluations.
Risk of bias in included studies
RANDOMISATION
Concealment of treatment allocation had been adequate in three trials (Durelli 1994; The PRISMS 1998; The OWIMS 1999) and unclear in the other five (Knobler 1993; IFNB MS Group 1993; The MSCRG 1996; Myhr 1999; Polman 2003).
BASELINE PARTICIPANTS' CHARACTERISTICS
All participants were clinically stable at study entry except in one study which did not report whether or not participants were in a stable phase (The PRISMS 1998). Equivalence between treated and control participants for age, disability score at entry and frequency of exacerbations in the pre‐study period was confirmed in all studies except in one which did not report clinical characteristics for each arm (The MSCRG 1996). Disease duration was longer in treated than in control participants in three studies (IFNB MS Group 1993; The PRISMS 1998; Myhr 1999).
BLINDING
All trials were intended to be double‐blind. However the well documented side effects of interferon injection, mainly injection‐site reactions and influenza‐like symptoms, make it likely that patients could become unblinded during trials. Analysis of blinding in two studies (IFNB MS Group 1993; The MSCRG 1996) identified a strong tendency for treated patients to become unblinded. Specifically, 80% of participants in the 8.0 MIU IFNB‐1b arm, 51% in the 1.6 MIU IFNB‐1b arm and 30% in the placebo arm had correctly guessed their treatment at the end of follow‐up (IFNB MS Group 1993). Thus many, if not most, treated patients had become aware of the treatment they were receiving during the course of the trial, and these trials should be regarded as single‐blind.
PARTICIPANTS LOST TO FOLLOW‐UP
Overall, 246 (19%) participants were excluded after randomisation or were lost to follow‐up (Table 2). In one study (The MSCRG 1996), 73 (46%) of the 158 randomised participants in the treatment group and 56 (39%) of the 143 in the control group did not complete the scheduled two years of follow‐up because the study ended prematurely. In this study, the occurrence of acute exacerbations or disease progression were not reported at one year; at two years these primary outcomes were available for only 57% of the randomised participants. In one trial (IFNB MS Group 1993), withdrawals and losses to follow‐up were agglomerated into a single figure: 48 participants (19%).
Participant‐ or investigator‐ perceived worsening and side effects or adverse events were the most frequent causes of withdrawn or loss to follow‐up in all trials.
| Study | Withdrawals | Losses to follow‐up | Total | % of patients |
| MSCRG (1996) | 23 (included in analysis) | 129 (premature study termination) | 129 | 43 |
| Myhr (1999) | 3 | 3 | 6 | 9 |
| Durelli (1994) | 0 | 0 | 0 | 0 |
| Knobler (1993) | 1 | 4 | 5 | 38 |
| OWIMS (1999) | 8 | 8 | 16 | 8 |
| PRISMS (1998) | 20 | 16 | 36 | 10 |
| IFNB MS Group (1993) | unreported | unreported | 48 | 19 |
| Polman (2003) | 2 | 4 | 6 | 7 |
INTENTION‐TO‐TREAT ANALYSIS
Although an intention‐to‐treat analysis was mentioned in seven trials (IFNB MS Group 1993; Durelli 1994; The MSCRG 1996; The PRISMS 1998; Myhr 1999; The OWIMS 1999; Polman 2003) in most cases patients who were withdrawn and lost to follow‐up had been excluded from the analyses.
Effects of interventions
PRIMARY OUTCOMES
(1) THE NUMBER OF PARTICIPANTS WHO CONTINUED TO EXPERIENCE EXACERBATIONS DURING THE FIRST YEAR OF TREATMENT
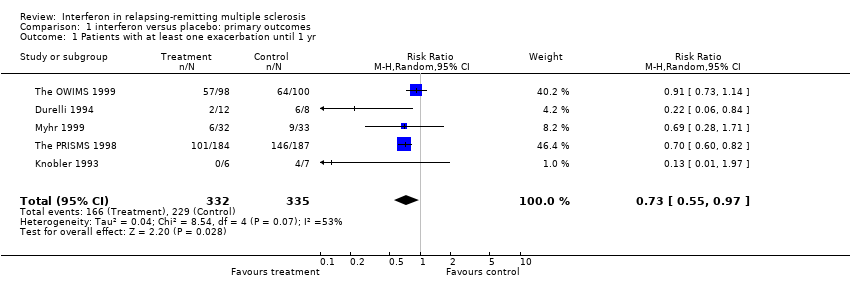
This information was available from five trials (Knobler 1993; Durelli 1994; The PRISMS 1998; Myhr 1999; The OWIMS 1999) and 667 participants representing 51% of those included in this review. Eighty five per cent of these participants were from two trials (The PRISMS 1998; The OWIMS 1999). Overall, the risk of new exacerbations in participants receiving interferon was 50% and the risk of new exacerbations in participants not receiving interferon was 68%. There was significant heterogeneity among the trials (chi 2 = 8.54, df = 4, p = 0.07). Using a random effects model the pooled relative risk with interferon administration was 0.73, 95% CI 0.55 to 0.97, p = 0.03, and the pooled risk difference was ‐23%, 95% CI ‐8% to ‐39% which means that if 100 MS patients were treated with interferon, 23 (95% CI 8 to 39) would be free from exacerbations during the first year.
Univariate meta‐regression analysis, performed by STATA, identified that the length of interferon administration (number of weeks up to one year) and dose (interferon MIU/week) explained the heterogeneity between the studies. We found no evidence that the type of interferon administered had any effect on the outcome. A subgroup analysis based on the five trials identified little benefit with interferon administered for six months (relative risk 0.82, 95% CI 0.66 to 1.02, p = 0.08) (Durelli 1994; Myhr 1999; The OWIMS 1999) than treatment for one year (relative risk 0.69, 95% CI 0.59 to 0.80, p < 0.001) (Knobler 1993; The PRISMS 1998). In four of the trials, the exception was (Durelli 1994), the participants were followed at least for one year. In four of the five studies, participants had MS for five to seven years at randomisation; in the other study (Durelli 1994) mean disease duration was nine years. All participants had a disability score (EDSS) at randomisation between 0 and 5.5.
The results of the Polman study (Polman 2003) did not indicate a benefit for oral interferon‐1a: approximately two‐thirds of patients in each group remained relapse free at 6 months follow‐up.
(2) THE NUMBER OF PARTICIPANTS WHO CONTINUED TO EXPERIENCE EXACERBATIONS DURING THE FIRST TWO YEARS OF TREATMENT
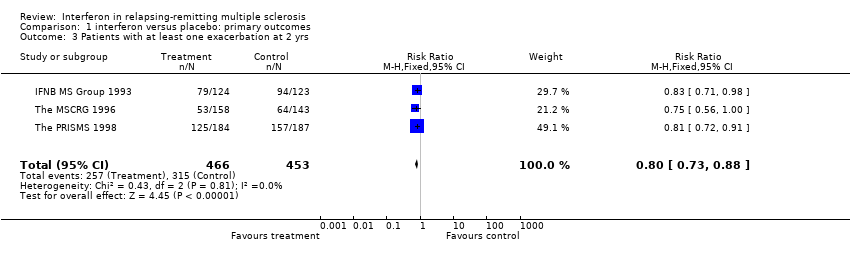
Data from three trials (IFNB MS Group 1993; The MSCRG 1996; The PRISMS 1998) involving 919 participants (71% of participants included in this review) were available for this outcome measure. The pooled relative risk of exacerbations despite interferon administration was 0.80 (95% CI 0.73 to 0.88, p < 0.001), a decrement of 20% in the treatment group compared to the control group. There was no heterogeneity between the three trials (chi2 = 0.43, df = 2, p = 0.81). Overall, the risk of exacerbations during the first two years in participants receiving interferon was 55% and the risk in placebo‐treated participants was 69%. The pooled risk difference was ‐14% (95% CI ‐8% to ‐19%) using a fixed effect model.
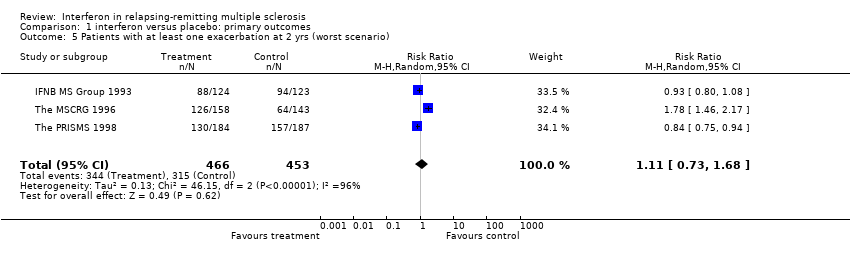
The reduction in exacerbations disappeared if interferon‐treated participants who dropped out were assumed to have had exacerbations (worst case scenario). In this case, there was a significant heterogeneity between the trials (chi2 = 46.15, df = 2, p < 0.001). This was explained by the fact that in one study (The MSCRG 1996) 43% of the randomised participants did not contribute to the two year data. Using a random effects model the pooled relative risk of exacerbation for participants treated with interferon was 1.11, 95% CI 0.73 to 1.68, p = 0.6.
(3) THE NUMBER OF PARTICIPANTS WHOSE CONDITION PROGRESSED DURING THE FIRST TWO YEARS OF TREATMENT
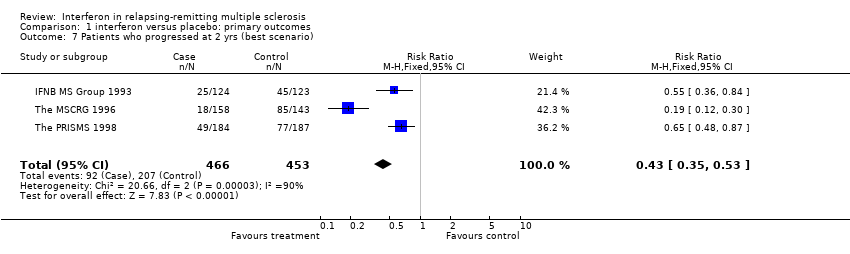
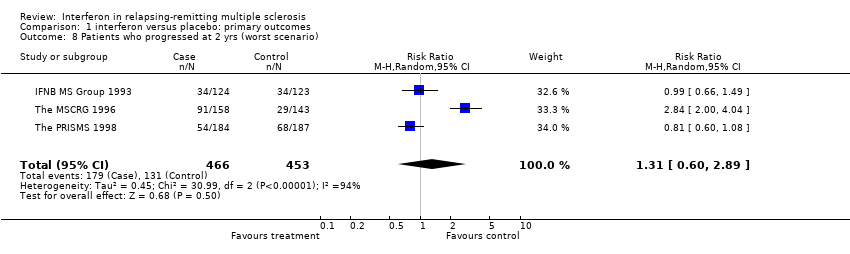
Data from three trials (IFNB MS Group 1993; The MSCRG 1996; The PRISMS 1998) involving 919 (71%) participants were available for this outcome. Overall, MS progressed in 20% of the participants in the interferon arm and 29% in the placebo arm over two years. There was no heterogeneity between the three trials. This result underlined a benefit of interferon in reducing progression of the disease (relative risk 0.69, 95% CI 0.55 to 0.87, p = 0.002). It implies that for every 100 people treated, 9 (95% CI 3 to 14) would be expected to remain stable over two years. However, the assignment of dropouts (to progression or not) was essential to the demonstration of efficacy. If interferon‐treated participants who dropped out were assumed to have progressed (worst case scenario) there was a significant heterogeneity between the trials (chi2 = 30.99, df = 2, p < 0.001) explained by the MSCRG study (The MSCRG 1996) and the treatment no longer produced a significant benefit (relative risk 1.31, 95% CI 0.60 to 2.89, p = 0.5).
(4) MEAN CHANGE IN DISABILITY SCORE (Expanded Disability Status Scale) AT TWO YEARS
This outcome was available from only two trials (IFNB MS Group 1993; The PRISMS 1998) involving 618 (51%) participants included in this review. The effect of the treatment on patient disability (as assessed by Expanded Disability Status Scale) was statistically significant (weighted mean difference = ‐0.25, 95% CI ‐0.05 to ‐0.46, p = 0.01). There was no significant heterogeneity between the two studies for this outcome. It should be emphasised that this result is of questionable clinical importance because it would be impossible to measure this very low degree of change on the Expanded Disability Status Scale in the clinical practice.
(5) THE NUMBER OF PARTICIPANTS WHO WERE UNABLE TO WALK WITHOUT AID (Expanded Disability Status Scale greater than 5.5) AT TWO YEARS
No data were available for this outcome.
SECONDARY OUTCOMES
(a) TIME FROM RANDOMISATION TO THE FIRST EXACERBATION
No data were available.
(b) TIME FROM RANDOMISATION TO PROGRESSION IN DISABILITY
No data were available.
(c) THE NUMBER OF PARTICIPANTS WHO UNDERWENT STEROID TREATMENT
This information was available during the first year from only two small trials (Durelli 1994; Myhr 1999) involving 85 (7%) participants included in this review. These two trials differed in duration of follow‐up (six months in Durelli and 12 months in Myhr). It is not surprising to find that the results of these two trials were different from one another: the first study showing a reduction (not significant) in the use of steroids in participants receiving interferon and the second study not confirming this beneficial effect.
The frequency of steroid administration over the first two years from randomisation was available from only one study (The PRISMS 1998) and 371 (29%) participants included in this review. The result was significant (relative risk 0.70, 95% CI 0.56 to 0.87, p = 0.001).
(4) THE NUMBER OF PARTICIPANTS WHO WERE HOSPITALISED OVER TWO YEARS
This information was available from only two trials (Durelli 1994; The PRISMS 1998) involving 391 (30%) participants included in this review. Again there was heterogeneity between these two trials (chi2 = 3.48, df = 1, p 0.06). There was no significant reduction in the frequency of hospitalisation between participants treated with interferon and those treated with placebo (relative risk 0.44, 95% CI 0.08 to 2.36, p = 0.3). Data from another study (IFNB MS Group 1993) were available only after three years. Participation in the third year was optional in that study.
(5) THE NUMBER OF PARTICIPANTS WITH SIDE EFFECTS OR ADVERSE EVENTS ATTRIBUTED TO TREATMENT
The definitions of side effects or adverse events, as reported by the study authors, are listed in Table 3 .
| Study | Data in the articles |
| IFNB MS Study Group (1993) | Abnormal laboratory values: 1) Increased aspartate aminotransferase (AST) = above upper limit of normal; 2) Increased alanine aminotransferase (ALT) = above upper limit of normal; 3) Leukopenia = white blood cells < 2,999 per mm3; 4) Lymphopenia = lymphocytes < 1,499 per mm3; 5) Decreased haemoglobin values = no definition; 6) Thrombocytopenia = no definition. Clinical side effects = no definition. Neutralizing antibodies against interferon (NAB) = neutralizing titres were expressed relative to the National Institute of Health (NIH) standard, with the limit of detection at 20 neutralizing units per milliliter |
| Knobler (1993) | Abnormal laboratory values: 1) Increased AST = no definition; 2) Increased ALT = no definition; 3) Leukopenia = no definition; 4) Lymphopenia = lymphocytes < 1,000 per mm3; 5) Decreased haemoglobin values = no definition; 6) Thrombocytopenia = no definition. Clinical side effects = no definition. NAB = neutralizing titres were expressed relative to the NIH standard, with the limit of detection at 20 neutralizing units per milliliter |
| Durelli (1994) | Abnormal laboratory values: 1) Increased AST = mild elevation: 2 x normal value and moderate elevation: 3 x normal value; 2) Increased AST and ALT = mild elevation: 2 x normal value and moderate elevation: 3 x normal value; 3) Neutropenia = cell number between 1,000 and 2,000 per mm3; 4) Lymphopenia = no definition; 5) Decreased haemoglobin values = no definition; 6) Thrombocytopenia = no definition. Depression = tested with the Hamilton Depression Scale; Flu‐like syndrome = contemporary presence of fever, headache, arthralgias and myalgias; Other clinical outcomes = no definition. NAB = neutralizing titres were not defined |
| The MSCRG (1995) | Abnormal laboratory values: 1) Increased AST; 2) Increased ALT; 3) Leukopenia; 4) Lymphopenia; 5) Decreased haemoglobin values; 6) Thrombocytopenia. The Authors reported "Adverse events and current laboratory data were monitored and recorded according to the Food and Drug Administration (FDA) phase III requirements". Moreover, they reported "FDA, HHS 21 CFR, Chapt. 1, 312.32, part c, 4/1/90". Depression = tested with the Beck Depression Inventory and Functional Assessment: using several scales = The MS Functional Disability Assessment, The Functional Indipendence Measure, The Barthel Index, The Incapacity Status Scale, and The Brief Symptom Inventory. NAB = neutralizing titres were expressed relative to the NIH standard, with the limit of detection at 20 neutralizing units per milliliter |
| The PRISMS (1998) | Abnormal laboratory values: 1) Increased AST = no definition; 2) Increased ALT = no definition; 3) Leukopenia = no definition; 4) Lymphopenia = lymphocytes < 1,000 per mm3; 5) Decreased haemoglobin values = no definition; 6) Thrombocytopenia = no definition. Depression = tested with the Beck Depression Inventory, The Centre for Epidemiologic Studies' Depression Mood Scale, and the General Health Questionnaire. Other clinical outcomes = no definition. NAB = neutralizing titres were expressed relative to the NIH standard, with the limit of detection at 20 neutralizing units per milliliter. The Authors used the four grades of the World Health Organization about toxic effects |
| Myhr (1999) | Abnormal laboratory values: 1) Increased AST = no definition; 2) Increased ALT = no definition; 3) Leukopenia = no definition; 4) Lymphopenia = no definition; 5) Decreased haemoglobin values = no definition; 6) Thrombocytopenia = no definition. Clinical side effects = no definition. NAB = the Authors reported that "they were analyzed by F. Hoffmann‐La Roche according to standardized protocols" |
| The OWIMS (1999) | Abnormal laboratory values: 1) Increased AST = no definition; 2) Increased ALT = no definition; 3) Leukopenia = no definition; 4) Lymphopenia = no definition; 5) Decreased haemoglobin values = no definition; 6) Thrombocytopenia = no definition. Clinical side effects = no definition. NAB: no definition |
(a) PARTICIPANTS WHO HAD CLINICAL SIDE EFFECTS OR ADVERSE EVENTS DURING TREATMENT
Not all results concerning side effects and adverse events were described, monitored and reported in a uniform manner. There were some deviations among studies in the timelines against which side effects were measured and in the definition of composite syndromes, such as "flu‐like syndrome" or "flu‐like symptoms". This likely accounts for the heterogeneity (chi2 = 12.37, df = 3, p = 0.006) in the observation of this syndrome, which was interpreted rather vaguely. Heterogeneity was not encountered when its component symptoms (fever, myalgia, fatigue and nausea) were considered individually.
A constellation of "flu‐like symptoms" was reported by four studies (IFNB MS Group 1993; The MSCRG 1996; The PRISMS 1998; The OWIMS 1999) involving 1117 (86%) participants included in this review. These symptoms were experienced by 48% of participants receiving interferon and 28% of those receiving placebo: the relative risk was 1.70, 95% CI 1.23 to 2.37, p = 0.001) using a random effects model. All authors reported that flu‐like symptoms diminished after three months of treatment. One author (Durelli 1994) reported that these symptoms were experienced by "several participants" receiving interferon, but usually disappeared the following morning after injection. Another author (Myhr 1999) did not give the frequency of this side effect but reported that one participant in the higher dose interferon group discontinued treatment because of "flu‐like" symptoms and an exacerbation.
Fever and myalgias or arthralgias were described as isolated symptoms in six of the studies (IFNB MS Group 1993; Durelli 1994; The MSCRG 1996; The PRISMS 1998; Myhr 1999; The OWIMS 1999) that included 1199 (92%) participants considered in this review. Fever occurred in 28% of participants receiving interferon and in 14% receiving placebo; myalgias or arthralgias in 26% of treated and 13% of placebo participants. The risks for fever (relative risk 2.01, 95% CI 1.60 to 2.52, p < 0.001) and myalgias or arthralgias (relative risk 1.92, 95% CI 1.52 to 2.43, p < 0.00001) were increased in the treated group.
Fatigue was reported in five of the studies (Durelli 1994; The MSCRG 1996; The PRISMS 1998; Myhr 1999; The OWIMS 1999), involving 952 (73%) participants included in this review. Fatigue occurred in 17% of participants treated with interferon and 12% treated with placebo. The risk for fatigue was 1.37 (95% CI 1.01 to 1.88, p = 0.05). In one study (IFNB MS Group 1993) fatigue was the cause for the withdrawal of three participants receiving interferon.
Information on the frequency of nausea and vomiting was available in two studies (The MSCRG 1996; Myhr 1999) involving 363 (28%) participants included in this review. Participants receiving interferon were at increased risk for this side effect compared to controls (relative risk 1.59, 95% CI 1.11 to 2.28, p = 0.01) using a fixed effect model.
Headache was reported as an isolated symptom in five studies (Durelli 1994; The MSCRG 1996; The PRISMS 1998; Myhr 1999; The OWIMS 1999) involving 952 (73%) participants. Headache was experienced by 50% of participants taking interferon and 42% taking placebo, and was the reason for one participant withdrawing from one study (IFNB MS Group 1993). The relative risk was 1.16, 95% CI 1.02 to 1.33, p = 0.02, using a fixed effect model.
Injection site reactions: in five studies, interferon was given by the subcutaneous route and in four of these (IFNB MS Group 1993; The PRISMS 1998; Myhr 1999; The OWIMS 1999) the proportion of participants with injection site reactions was reported: 62% in the participants receiving interferon and 14% in those receiving placebo. There was significant heterogeneity between these studies (chi2 = 17.75, df = 2, p < 0.0001). This is probably due to the different definitions of injection site reaction and the clinical ascertainment of cutaneous reactions to interferon injection. The relative risk of such reactions, estimated by random effects model, was greater in treated participants (5.57, 95% CI 2.33 to 13.29, p < 0.0001). The severity of skin reactions was not specified in any of the included trials. Only in two studies which reported them, were there comments on the presence or absence of skin necrosis at the site of injection. This occurred in "1 to 3% of participants" (IFNB MS Group 1993) or not at all (The OWIMS 1999). In two studies, interferon was given intramuscularly (The MSCRG 1996; Durelli 1994). In the first of these, skin reactions were reported in 10 to 15% of participants in both treated and control groups and in the second study in none of the participants. The possibility of inadvertent subcutaneous injection was not mentioned.
Hair loss was only described in two studies (Durelli 1994; Myhr 1999) and occurred in 36% of participants in the interferon group and 2% in the placebo group: an increased risk of 9.78, 95% CI 1.98 to 48.27, p = 0.005). In the Myhr study, this symptom affected 40% of interferon participants over the first six months of treatment.
Dysesthesias, paresthesias and weakness: in one study (Myhr 1999) one participant (1/32) in the control group experienced dysesthesias or paresthesias and six participants (4/30 in the interferon group and 2/32 in the placebo group) had weakness.
Depression was assessed and reported in six trials (IFNB MS Group 1993; Durelli 1994; The MSCRG 1996; The PRISMS 1998; Myhr 1999; The OWIMS 1999) and 1199 participants representing 92% of those included in this review. Depression was reported in 16% of participants and did not differ between the interferon and control groups. Suicide or attempted suicide was reported by three studies (IFNB MS Group 1993; The MSCRG 1996; The PRISMS 1998) and occurred in seven participants. These events did not differ between the interferon and placebo participants. Only two studies reported data on anorexia (Durelli 1994; Myhr 1999) which was present in three participants.
Muscle hypertonia was reported in one small study (Knobler 1993) and was present at the same frequency in treated and control groups.
Hypertension requiring drug treatment was not reported in any trials included in this review.
(b) PARTICIPANTS WHO HAD ABNORMAL VALUES DURING TREATMENT
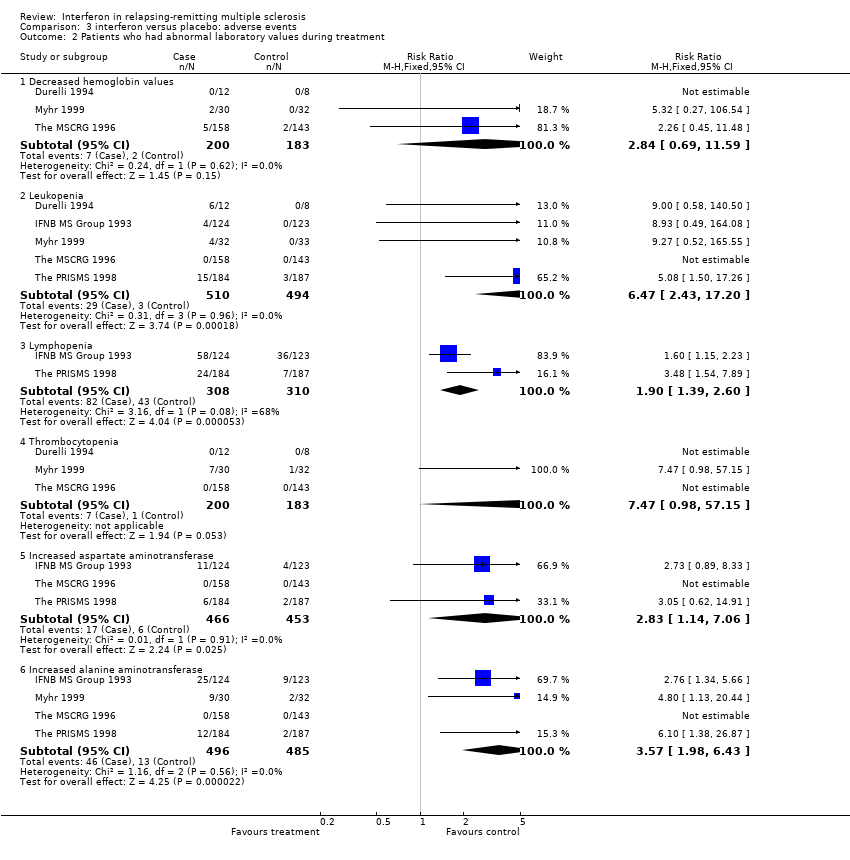
Lowered hemoglobin levels values were reported in three studies (Durelli 1994; The MSCRG 1996; Myhr 1999) and 383 (29%) participants included in this review. This event occurred more frequently in participants receiving interferon than controls (3.5% versus 1%) but the increased risk was not statistically significant.
Leukopenia was reported in five studies (IFNB MS Group 1993; Durelli 1994; The MSCRG 1996; The PRISMS 1998; Myhr 1999) and 1004 (77%) participants. It was found in 6% of participants in the interferon group and 0.6% in the control group, with a significantly increased risk for treated participants (relative risk 6.47, 95% CI 2.43 to 17.20, p < 0.001).
Lymphopenia was reported in two studies (IFNB MS Group 1993; The PRISMS 1998) and 618 (48%) participants included in this review. It occurred in 27% of participants receiving interferon and 14% receiving placebo, a significantly increased risk for treated participants (relative risk 2.16, 95% CI 1.01 to 4.64, p = 0.05, using a random effects model.
Thrombocytopenia was described in three studies (Durelli 1994; The MSCRG 1996; Myhr 1999) and 383 (29%) participants. The risk for this side effect was greater in treated participants in only one of these studies (Myhr 1999). Myhr reported that the proportion of participants experiencing thrombocytopenia was 23% in the interferon group and 3% in the placebo group.
The values of two hepatic enzymes in blood were reported. Aspartate aminotransferase (AST) was reported in three studies (IFNB MS Group 1993; The MSCRG 1996; The PRISMS 1998) and 919 (71%) participants, and alanine aminotransferase (ALT) in four studies (IFNB MS Group 1993; The MSCRG 1996; The PRISMS 1998; Myhr 1999) and 981 (75%) participants. Increased AST and ALT occurred more frequently in participants who received interferon (4% and 9%) than controls (1% and 3%). Participants treated with interferon had a higher risk both for increased AST (relative risk 2.83, 95% CI 1.14 to 7.06, p = 0.03) and ALT (relative risk 3.57, 95% CI 1.98 to 6.43, p < 0.0001, using a fixed effect model).
Neutralizing antibodies (NAB) against interferon developed in approximately 20% (83/421) of the treated participants in whom this parameter was assessed (IFNB MS Group 1993; Knobler 1993; The MSCRG 1996; The PRISMS 1998; The OWIMS 1999; Myhr 1999). The nature of the biological assays was different and the definitions of positive titres were variable between the studies. When assays were performed the timing and sample sizes were often not reported. Antibodies developed most commonly in the first treatment year. Neutralizing antibodies were only rarely reported in placebo‐treated participants.
(6) MAGNETIC RESONANCE IMAGING (MRI)
There was a significant evolution in the application of MRI technology in the decade in which these trials were conducted and it was not possible to make comparisons across the trials from published data. Different measures of MRI were used and reported in the included trials, often on small samples of randomised participants and at different times of follow‐up. For these reasons, we therefore present a qualitative summary of MRI findings (Table 4). In each trial, lesion activity was measured somewhat differently, commonly without reported measures of variance. An analysis of changes in T2 burden was possible only for the trials of interferon beta 1b (IFNB MS Group 1993) and the PRISMS (The PRISMS 1998).
| Study | MRI | Year(s) of follow‐up | Control group | Treated group |
| IFNB (1993) | Mean [standard error (SE)] and median annual % change of total lesion area. | 1 and 2 years from randomisation | At 1st year: mean 110.6; median 6.7 (SE 96.3). At 2nd year: mean 43.8; median 11.9 (SE 14.0). N. of patients 72 | At 1st year: mean 5.4; median ‐4.9 (5.1). Number of patients 77. At 2nd year: mean 9.4; median ‐ 5.6 (SE 8.5). Number of patients 73 |
| Knobler (1993) | No MRI outcome | |||
| Durelli (1994) | Number of patients who had active lesions. Total number of enlarging lesions and new lesions in the two groups. Mean (SE)number of active lesions per patient | 6 months from randomisation. | Number of patients with active scans: 6 of 8 patients (enlarging lesions: 12 of 6; new lesions: 15 of 6). Mean number of active lesions per patient 3.37 (1.03) | Number with active scans: 1 of 12 patients (enlarging lesions: 1; new lesions: 0). Mean number of active lesions per patient 0.08 (0.08) |
| MSCRG (1995) | Number of patients who had active lesions. Mean (SE) number and volume of active lesions per patient. Median % change of total lesion volume (mm3). | 1 and 2 years from randomisation | At 1st year: number of patients with active scans: 52 of 123 patients. Mean number of active lesions per patient 1.59 (0.31). Mean volume per patient 96.5 (21.2) mm3. Median change ‐3.3%. At 2nd year: number of patients with active scans: 35 of 82 patients. Mean number of active lesions per patient 1.65 (0.48). Mean volume per patient 122.4 (48.5) mm3. Median change ‐6.5%. | At 1st year: number of patients with active scans: 40 of 134 patients. Mean number of active lesions per patient 1.04 (0.28). Mean volume per patient 70.0 (24.9) mm3. Median change ‐13.1%. At 2nd year: number of patients with active scans: 24 of 83 patients. Mean number of active lesions per patient 0.80 (0.22). Mean volume per patient 74.1 (38.3) mm3. Median change ‐13.2%. |
| PRISMS (1998) | Median % change of total lesion burden (area or volume?). Difference (%) of the number of active lesions between treated and control groups. | 2 years from randomisation | Median 10.9 (N. 187 patients). | Median ‐3.8 (N. 184). Difference of active lesions ‐ 78% than placebo group |
| Myhr (1999) | Mean (no SE) and median of new active lesions per patient. Number of patients with new active lesions. Mean (no SE) and median of total number of lesions per patient (number of T1‐weighted active lesions plus unactive T2‐weighted lesions) | 6 months and 1 year from randomisation | At 6th month: mean 7.3 and median 2.5 new active lesions per patient ; 24 of 32 patients with new active lesions; mean 1.6 and median 1.0 total number of lesions per patient. At 1st year: mean 1.6 and median 0.0 total number of lesions per patient. (N. 32 patients) | At 6th month: mean 1.4 and median 0.0 new active lesions per patient; 9 of 28 patients with new active lesions; mean 0.3 and median 0.0 total number of lesions per patient. At 1st year: mean 0.7 and median 0.0 total number of lesions per patient (N. 28 patients) |
| OWIMS (1999) | Mean [standard deviation (SD)] and median number of active lesions (measured by different MRI techniques). The proportion of scans showing active lesions. Mean (no SE) and median % change of total lesion area. | 24 and 48 weeks from randomisation | At 24th week: mean and median number of combined unique active lesions 1.7 (2.7) and 0.7 per patient; median number of proton density/T2 unique active lesions 0.3 per patient; median number of T1‐Gadolinium unique active lesions 0.7 per patient; 50% of scans with combined active lesions. At 48th week: mean 15.5 % and median 5.9% change of total lesion area (N. of patients at 24th and 48th week = unknown). | At 24th week: mean and median number of combined unique active lesions 0.8 (1.1) and 0.3 per patient; median number of proton density/T2 unique active lesions 0.2 per patient; median number of T1‐Gadolinium unique active lesions 0.3 per patient; 33% of scans with combined active lesions. At 48th week: mean 0.8% and median ‐1.4% change of total lesion area (N. of patients at 24th and 48th week = unknown). |
| Polman (2003) | Cumulative number of newly active lesions over 6 months. | 6 months from randomisation. | Median and quartiles (Q1; Q3): 4.0 (2.7; 10.0) | Median and quartiles (Q1; Q3): 9.0 (1.0; 16.0) |
Unpublished data (mean change in T2 burden, standard deviation) were provided by the sponsor of these two trials who reported a significant reduction in T2 burden aggregating both studies (weighted mean difference ‐24.67, 95% CI ‐33.84 to ‐15.50, p < 0.001). Numerical data on this aspect were not available for the MSCRG study, in which a significant effect on the change in T2 burden was not found at the end of the second year of the study (The MSCRG 1996).
Data on gadolinium enhancing lesions were available from two studies (The MSCRG 1996; Myhr 1999) after one year of treatment and from one study after two years of treatment on a small sample of randomised participants (The MSCRG 1996). A reduction in gadolinium enhancement was evident at one year but not at two years. In individual studies, treatment with recombinant interferon was associated with reductions in other MRI measures, such as the number of new T2 or enlarging lesions.
No significant differences in new active lesions were observed between the oral interferon‐1a and control groups (Polman 2003).
NUMBERS NEEDED TO TREAT
The estimates of numbers needed to treat to prevent one patient having at least one exacerbation at 1 year in relation to the baseline risks are shown in Table 5. This figure shows, for example, that nine patients needed to be treated to prevent one patient having at least one exacerbation at 1 year when the risk of recurrence was 40% in the multiple sclerosis population.
| Outcomes | 0.1 | 0.2 | 0.3 | 0.4 | 0.5 | 0.6 | 0.7 | 0.8 | 0.9 |
| Patients who continued to experience exacerbations during the first year | 37 (22:333) | 19 (11:177) | 12 (7:111) | 9 (6:83) | 7 (4:67) | 6 (4:56) | 5 (3:48) | 5 (3:42) | 4 (2:37) |
| Patients who continued to experience exacerbations during the first 2 years | 50 (37:83) | 25 (19:42) | 17 (12:28) | 13 (9:21) | 10 (7:17) | 8 (6:14) | 7 (5:12) | 6 (5:10) | 6 (4:9) |
| Patients who progressed during the first 2 years | 32 (22:77) | 16 (11:38) | 11 (7:26) | 8 (6:19) | 6 (4:15) | 5 (4:13) | 5 (3:11) | 4 (3:10) | 4 (2:9) |
Discussion
The results support a modest protective effect of interferon against recurrence of exacerbations during the first two years of treatment Treatment of patients with interferon was associated with a 20% reduction in the relative risk of having attacks. Sensitivity analysis indicates that this value is likely true, considering the intermediate between the "best" and the "worst" case scenario. Interferon administered by the oral route is not effective for prevention of relapses.
We chose the proportion of participants who continued to experience exacerbations as the principal outcome rather than the more commonly reported "annualised exacerbation rate". The principal reason for this was that these annualised rates were not reported with a measure of the variance of the observation. Also, the reporting of annualised exacerbation rates could overestimate the extent of a treatment effect. Unusually high rates of exacerbations in individuals who were treated with placebo could embellish the "annualised rate" for the group (The MSCRG 1996). Reporting the absolute numbers of participants who continued to experience exacerbations, despite treatment, is a more meaningful estimation of the shouldering of the treatment effect in a treated population.
The need for steroid treatment did not decrease for participants treated with interferon during the first or the second year after randomisation. In the interferon beta 1b trial, a claim was made that steroid treatments were reduced but the authors did not report the data. Disconcertingly, these data were missing in the other trials, given the strength of the claims that interferon suppressed clinical attacks.
Hospitalisation was not significantly reduced in two trials that reported on this aspect; however this could have been to some extent related to the major shift to outpatient management of exacerbations that occurred in the decade of these trials.
Interferon treatment was associated with a reduction in the number of participants whose MS condition progressed. This effect was identified in three trials (IFNB MS Group 1993; The MSCRG 1996; The PRISMS 1998). To calculate the effect, we tallied the number of participants who fulfilled the definition for progression at the end of two years. The effect was significant (relative risk 0.69, 95% CI 0.55 to 0.87, p = 0.002). However, this effect of interferon on the prevention of disease progression could clearly be influenced by inappropriate consideration of dropouts. If all dropouts in the treated group were assumed to have progressed, the significance of the effect disappeared (relative risk 1.31, 95% CI 0.60 to 2.89, p = 0.5). Only in the interferon beta 1b study was the disability status of dropouts mentioned in any detail: the participants who dropped out of that trial experienced higher exacerbation rates, a greater accumulation of disability, and more disease activity on the magnetic resonance imaging. There was a very modest support for an effect on disability by examination of the mean change in disability scores between randomisation and the end of the second year.
In this review, it was not possible to ascertain if the decreased number of participants whose condition progressed was independent from the effect of interferon on exacerbations. Two issues regarding this should be considered. First, is possible that interferon reducing the MS exacerbation could contribute to a perception that treatment prevented unremitting disability (Rice 1998). The probability of not progressing in disability over time was evaluated by survival analysis (Kaplan‐Meier curves) in the trials which included this outcome (IFNB MS Group 1993; The MSCRG 1996; The PRISMS 1998). Once participants worsen and have a subsequent confirmation of disease worsening (generally after three to six months, depending on the study) they do not contribute any further information to a survival analysis. Later improvement would suggest that patients were experiencing severe exacerbations with slow recovery, rather than unremitting disease progression. The extent to which this might have occurred in these trials is unknown. In the MSCRG study, 50% of interferon‐treated patients who worsened in the first year of the study, actually improved in the second year (Rice 1998). The MSCRG study investigators made a substantial claim that interferon treatment prevented disability, when the reported effect might have been actually the effect on exacerbations. The error rates in application of "confirmed disability" definitions is substantial (Liu 2000). Another weakness of the disability claims should be identified. Most participants in these randomised trials had low disability scores at entry. The lower range of the disability scale (Expanded Disability Status Scale) is derived from a composite of the neurological examination and scoring in the lower echelons is fraught with high inter‐ and intra‐rater variability (Goodkin 1992). Missing from all the trials was a sense of how often worsening was based on a subscale that is convincingly associated with disability, such as sustained worsening on a pyramidal or cerebellar subscale.
It was anticipated that the effect of interferon on exacerbations and disability in patients with relapsing remitting MS would produce a similar effect on these outcomes in the clinical trials of progressive MS patients. However, this does not appear to be the case. Large clinical trials of interferons in progressive MS have reported modest (European Group 1998; Cohen 2001) or no effect (Goodkin 2000; Hughes 2000) on disability outcomes. The failure of interferons to convincingly prevent disease progression in progressive MS, despite slight effects on exacerbations, has focused attention on the relevance of exacerbations to disease progression. It has been suggested that a high frequency of exacerbations in the early years of the illness is associated with a more severe disease course in the long term (Weinshenker 1989) whereas others have suggested that the disease progression is not influenced by superimposed attacks during the course of the disease (Confavreux 2000).
An influenza‐like reaction was very common in treated patients, and injection site reactions were common in those who received interferon subcutaneously. Patients treated with interferon had leukopenia, lymphopenia, thrombocytopenia and increased plasma hepatic enzymes. Both clinical and laboratory side effects were more frequent in patients treated with interferon than in controls.
Depression and depressive symptoms did not appear to be a major problem in the first two years of treatment with interferon across the trials in which this information was available. This potential side effect may have been minimised by greater sensitivity concerning it subsequent to the reporting of the trial of interferon beta 1b (IFNB MS Group 1993).
The impact of these side effects and adverse events on the quality of life of the participants was not reported in any of the trials included in this review.
In order to assess the impact of interferon in clinical practice, the number of participants who need to be treated to prevent one unfavourable outcome (NNT) has also been determined. This measure is generally calculated as the reciprocal of absolute risk differences. However, weighted absolute risk differences estimated from meta‐analysis are applicable only to patients who are at the risk level corresponding to the average risk of the trial participants, and this may not be relevant to individual clinical situations (Smeeth 1999). Therefore we chose to show a full range of possible NNT according to different values of patient baseline risk for the principal outcomes.
Neutralizing antibodies against interferon developed in 83 of the 421 participants treated with interferon in whom this parameter was assessed. As there were differences between the studies with regard to the type of antibody assay, and definitions of antibody positive titers, it was impossible to perform a quantitative analysis on this aspect. Similarly, because of inconsistent reporting of an effect of these antibodies on clinical outcomes, it was not possible to evaluate a deleterious effect on the major outcomes. Since neutralizing antibodies tend to appear in the first year of treatment, an effect would not be expected until the second or third year of study. Most trials have not been adequately powered in the second and third year of study to show this effect.
Comparison 1 interferon versus placebo: primary outcomes, Outcome 1 Patients with at least one exacerbation until 1 yr.

Comparison 1 interferon versus placebo: primary outcomes, Outcome 2 Patients with at least one exacerbation until 1 year: subgroup analysis.
Comparison 1 interferon versus placebo: primary outcomes, Outcome 3 Patients with at least one exacerbation at 2 yrs.

Comparison 1 interferon versus placebo: primary outcomes, Outcome 4 Patients with at least one exacerbation at 2 yrs (best scenario).
Comparison 1 interferon versus placebo: primary outcomes, Outcome 5 Patients with at least one exacerbation at 2 yrs (worst scenario).

Comparison 1 interferon versus placebo: primary outcomes, Outcome 6 Patients who progressed at 2 yrs.
Comparison 1 interferon versus placebo: primary outcomes, Outcome 7 Patients who progressed at 2 yrs (best scenario).
Comparison 1 interferon versus placebo: primary outcomes, Outcome 8 Patients who progressed at 2 yrs (worst scenario).

Comparison 1 interferon versus placebo: primary outcomes, Outcome 9 Mean change in disability (EDSS) at 2 yrs.
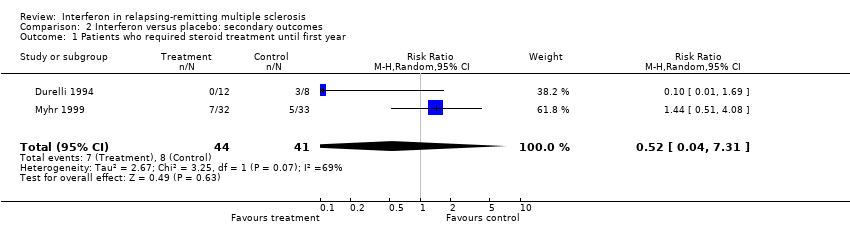
Comparison 2 Interferon versus placebo: secondary outcomes, Outcome 1 Patients who required steroid treatment until first year.

Comparison 2 Interferon versus placebo: secondary outcomes, Outcome 2 Patients who required steroid treatment until 2 years.
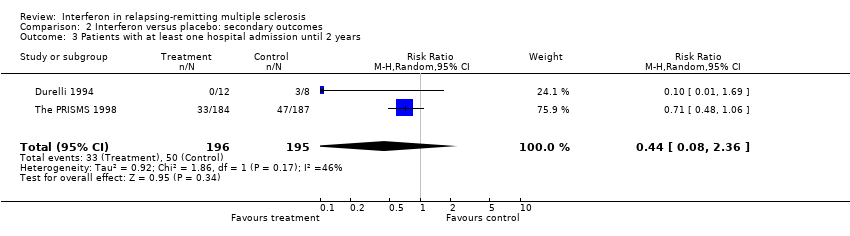
Comparison 2 Interferon versus placebo: secondary outcomes, Outcome 3 Patients with at least one hospital admission until 2 years.
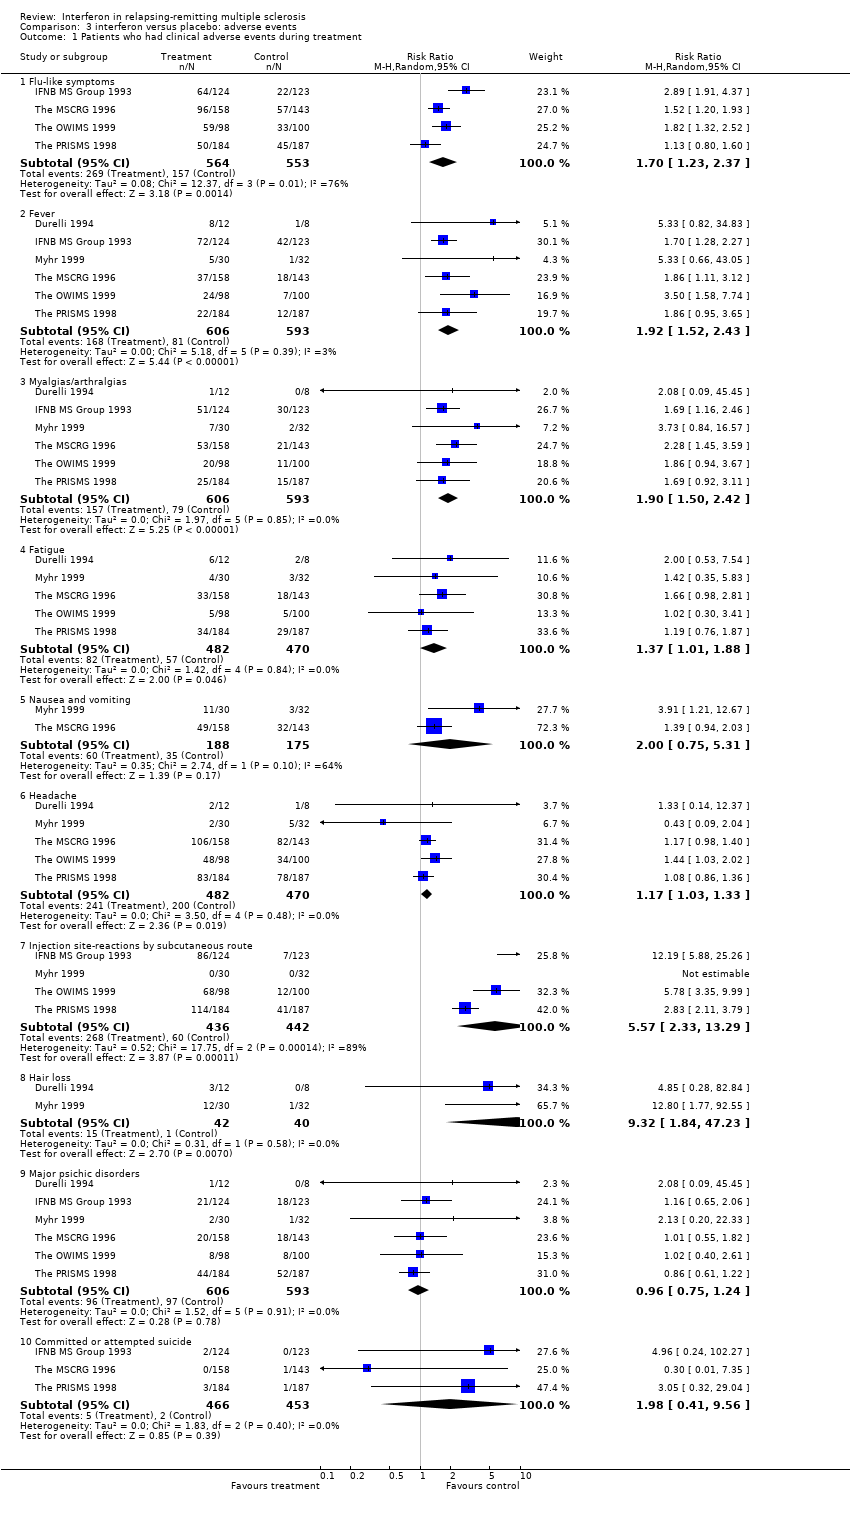
Comparison 3 interferon versus placebo: adverse events, Outcome 1 Patients who had clinical adverse events during treatment.
Comparison 3 interferon versus placebo: adverse events, Outcome 2 Patients who had abnormal laboratory values during treatment.
| Score |
| 0‐Normal neurologic examination |
| 1.0‐No disability, minimal signs on one Functional System (FS)* |
| 1.5‐No disability, minimal signs on >1 FS |
| 2.0‐Minimal disability in 1 FS |
| 2.5‐Minimal disability in 2 FS |
| 3.0‐Moderate disability in 1 FS; or mild disability in 3‐4 FS, though fully ambulatory |
| 3.5‐Fully ambulatory but with moderate disability in 3‐4 FS |
| 4.0‐Fully ambulatory without aid, up and about 12hrs./day despite relatively severe disability. Able to walk without aid 500meters |
| 4.5‐Fully ambulatory without aid, up and about much of day, able to work a full day, may otherwise have some limitations of full activity or require minimal assistance. Relatively severe disability. Able to walk without aid 300meters |
| 5.0‐Ambulatory without aid for about 200m. Disability impairs full daily activities |
| 5.5‐Ambulatory for 100m, disability precludes full daily activities |
| 6.0‐Intermittent or unilateral constant assistance required to walk 100m with or without resting |
| 6.5‐Constant bilateral support required to walk 20m. without resting |
| 7.0‐Unable to walk beyond 5m even with aid, essentially restricted to wheelchair, wheels self, transfers alone |
| 7.5‐Unable to take more than a few steps, restricted to wheelchair, any need aid in transfer, wheels self but may require motorized chair for full day's activities |
| 8.0‐Essentially restricted to bed or chair or perambulated in wheelchair, but may be out of bed much of day, retains self care functions, generally effective use of arms |
| 8.5‐Essentially restricted to bed much of day,some effective use of arms, some self care functions |
| 9.0‐Helpless bed patient, can communicate and eat |
| 9.5‐Unable to communicate effectively or eat/swallow |
| 10.0‐Death |
| * Functional Systems are eight scales representing different functions of the Central Nervous System (Kurtzke 1961). Each system is rated on a five‐point (three systems) or six‐point (four systems) response scale except 'Other Functions' which is rated dichotomously (0 = none, 1 = any other neurological findings attributed to multiple sclerosis) |
| Study | Withdrawals | Losses to follow‐up | Total | % of patients |
| MSCRG (1996) | 23 (included in analysis) | 129 (premature study termination) | 129 | 43 |
| Myhr (1999) | 3 | 3 | 6 | 9 |
| Durelli (1994) | 0 | 0 | 0 | 0 |
| Knobler (1993) | 1 | 4 | 5 | 38 |
| OWIMS (1999) | 8 | 8 | 16 | 8 |
| PRISMS (1998) | 20 | 16 | 36 | 10 |
| IFNB MS Group (1993) | unreported | unreported | 48 | 19 |
| Polman (2003) | 2 | 4 | 6 | 7 |
| Study | Data in the articles |
| IFNB MS Study Group (1993) | Abnormal laboratory values: 1) Increased aspartate aminotransferase (AST) = above upper limit of normal; 2) Increased alanine aminotransferase (ALT) = above upper limit of normal; 3) Leukopenia = white blood cells < 2,999 per mm3; 4) Lymphopenia = lymphocytes < 1,499 per mm3; 5) Decreased haemoglobin values = no definition; 6) Thrombocytopenia = no definition. Clinical side effects = no definition. Neutralizing antibodies against interferon (NAB) = neutralizing titres were expressed relative to the National Institute of Health (NIH) standard, with the limit of detection at 20 neutralizing units per milliliter |
| Knobler (1993) | Abnormal laboratory values: 1) Increased AST = no definition; 2) Increased ALT = no definition; 3) Leukopenia = no definition; 4) Lymphopenia = lymphocytes < 1,000 per mm3; 5) Decreased haemoglobin values = no definition; 6) Thrombocytopenia = no definition. Clinical side effects = no definition. NAB = neutralizing titres were expressed relative to the NIH standard, with the limit of detection at 20 neutralizing units per milliliter |
| Durelli (1994) | Abnormal laboratory values: 1) Increased AST = mild elevation: 2 x normal value and moderate elevation: 3 x normal value; 2) Increased AST and ALT = mild elevation: 2 x normal value and moderate elevation: 3 x normal value; 3) Neutropenia = cell number between 1,000 and 2,000 per mm3; 4) Lymphopenia = no definition; 5) Decreased haemoglobin values = no definition; 6) Thrombocytopenia = no definition. Depression = tested with the Hamilton Depression Scale; Flu‐like syndrome = contemporary presence of fever, headache, arthralgias and myalgias; Other clinical outcomes = no definition. NAB = neutralizing titres were not defined |
| The MSCRG (1995) | Abnormal laboratory values: 1) Increased AST; 2) Increased ALT; 3) Leukopenia; 4) Lymphopenia; 5) Decreased haemoglobin values; 6) Thrombocytopenia. The Authors reported "Adverse events and current laboratory data were monitored and recorded according to the Food and Drug Administration (FDA) phase III requirements". Moreover, they reported "FDA, HHS 21 CFR, Chapt. 1, 312.32, part c, 4/1/90". Depression = tested with the Beck Depression Inventory and Functional Assessment: using several scales = The MS Functional Disability Assessment, The Functional Indipendence Measure, The Barthel Index, The Incapacity Status Scale, and The Brief Symptom Inventory. NAB = neutralizing titres were expressed relative to the NIH standard, with the limit of detection at 20 neutralizing units per milliliter |
| The PRISMS (1998) | Abnormal laboratory values: 1) Increased AST = no definition; 2) Increased ALT = no definition; 3) Leukopenia = no definition; 4) Lymphopenia = lymphocytes < 1,000 per mm3; 5) Decreased haemoglobin values = no definition; 6) Thrombocytopenia = no definition. Depression = tested with the Beck Depression Inventory, The Centre for Epidemiologic Studies' Depression Mood Scale, and the General Health Questionnaire. Other clinical outcomes = no definition. NAB = neutralizing titres were expressed relative to the NIH standard, with the limit of detection at 20 neutralizing units per milliliter. The Authors used the four grades of the World Health Organization about toxic effects |
| Myhr (1999) | Abnormal laboratory values: 1) Increased AST = no definition; 2) Increased ALT = no definition; 3) Leukopenia = no definition; 4) Lymphopenia = no definition; 5) Decreased haemoglobin values = no definition; 6) Thrombocytopenia = no definition. Clinical side effects = no definition. NAB = the Authors reported that "they were analyzed by F. Hoffmann‐La Roche according to standardized protocols" |
| The OWIMS (1999) | Abnormal laboratory values: 1) Increased AST = no definition; 2) Increased ALT = no definition; 3) Leukopenia = no definition; 4) Lymphopenia = no definition; 5) Decreased haemoglobin values = no definition; 6) Thrombocytopenia = no definition. Clinical side effects = no definition. NAB: no definition |
| Study | MRI | Year(s) of follow‐up | Control group | Treated group |
| IFNB (1993) | Mean [standard error (SE)] and median annual % change of total lesion area. | 1 and 2 years from randomisation | At 1st year: mean 110.6; median 6.7 (SE 96.3). At 2nd year: mean 43.8; median 11.9 (SE 14.0). N. of patients 72 | At 1st year: mean 5.4; median ‐4.9 (5.1). Number of patients 77. At 2nd year: mean 9.4; median ‐ 5.6 (SE 8.5). Number of patients 73 |
| Knobler (1993) | No MRI outcome | |||
| Durelli (1994) | Number of patients who had active lesions. Total number of enlarging lesions and new lesions in the two groups. Mean (SE)number of active lesions per patient | 6 months from randomisation. | Number of patients with active scans: 6 of 8 patients (enlarging lesions: 12 of 6; new lesions: 15 of 6). Mean number of active lesions per patient 3.37 (1.03) | Number with active scans: 1 of 12 patients (enlarging lesions: 1; new lesions: 0). Mean number of active lesions per patient 0.08 (0.08) |
| MSCRG (1995) | Number of patients who had active lesions. Mean (SE) number and volume of active lesions per patient. Median % change of total lesion volume (mm3). | 1 and 2 years from randomisation | At 1st year: number of patients with active scans: 52 of 123 patients. Mean number of active lesions per patient 1.59 (0.31). Mean volume per patient 96.5 (21.2) mm3. Median change ‐3.3%. At 2nd year: number of patients with active scans: 35 of 82 patients. Mean number of active lesions per patient 1.65 (0.48). Mean volume per patient 122.4 (48.5) mm3. Median change ‐6.5%. | At 1st year: number of patients with active scans: 40 of 134 patients. Mean number of active lesions per patient 1.04 (0.28). Mean volume per patient 70.0 (24.9) mm3. Median change ‐13.1%. At 2nd year: number of patients with active scans: 24 of 83 patients. Mean number of active lesions per patient 0.80 (0.22). Mean volume per patient 74.1 (38.3) mm3. Median change ‐13.2%. |
| PRISMS (1998) | Median % change of total lesion burden (area or volume?). Difference (%) of the number of active lesions between treated and control groups. | 2 years from randomisation | Median 10.9 (N. 187 patients). | Median ‐3.8 (N. 184). Difference of active lesions ‐ 78% than placebo group |
| Myhr (1999) | Mean (no SE) and median of new active lesions per patient. Number of patients with new active lesions. Mean (no SE) and median of total number of lesions per patient (number of T1‐weighted active lesions plus unactive T2‐weighted lesions) | 6 months and 1 year from randomisation | At 6th month: mean 7.3 and median 2.5 new active lesions per patient ; 24 of 32 patients with new active lesions; mean 1.6 and median 1.0 total number of lesions per patient. At 1st year: mean 1.6 and median 0.0 total number of lesions per patient. (N. 32 patients) | At 6th month: mean 1.4 and median 0.0 new active lesions per patient; 9 of 28 patients with new active lesions; mean 0.3 and median 0.0 total number of lesions per patient. At 1st year: mean 0.7 and median 0.0 total number of lesions per patient (N. 28 patients) |
| OWIMS (1999) | Mean [standard deviation (SD)] and median number of active lesions (measured by different MRI techniques). The proportion of scans showing active lesions. Mean (no SE) and median % change of total lesion area. | 24 and 48 weeks from randomisation | At 24th week: mean and median number of combined unique active lesions 1.7 (2.7) and 0.7 per patient; median number of proton density/T2 unique active lesions 0.3 per patient; median number of T1‐Gadolinium unique active lesions 0.7 per patient; 50% of scans with combined active lesions. At 48th week: mean 15.5 % and median 5.9% change of total lesion area (N. of patients at 24th and 48th week = unknown). | At 24th week: mean and median number of combined unique active lesions 0.8 (1.1) and 0.3 per patient; median number of proton density/T2 unique active lesions 0.2 per patient; median number of T1‐Gadolinium unique active lesions 0.3 per patient; 33% of scans with combined active lesions. At 48th week: mean 0.8% and median ‐1.4% change of total lesion area (N. of patients at 24th and 48th week = unknown). |
| Polman (2003) | Cumulative number of newly active lesions over 6 months. | 6 months from randomisation. | Median and quartiles (Q1; Q3): 4.0 (2.7; 10.0) | Median and quartiles (Q1; Q3): 9.0 (1.0; 16.0) |
| Outcomes | 0.1 | 0.2 | 0.3 | 0.4 | 0.5 | 0.6 | 0.7 | 0.8 | 0.9 |
| Patients who continued to experience exacerbations during the first year | 37 (22:333) | 19 (11:177) | 12 (7:111) | 9 (6:83) | 7 (4:67) | 6 (4:56) | 5 (3:48) | 5 (3:42) | 4 (2:37) |
| Patients who continued to experience exacerbations during the first 2 years | 50 (37:83) | 25 (19:42) | 17 (12:28) | 13 (9:21) | 10 (7:17) | 8 (6:14) | 7 (5:12) | 6 (5:10) | 6 (4:9) |
| Patients who progressed during the first 2 years | 32 (22:77) | 16 (11:38) | 11 (7:26) | 8 (6:19) | 6 (4:15) | 5 (4:13) | 5 (3:11) | 4 (3:10) | 4 (2:9) |
| Outcome or subgroup title | No. of studies | No. of participants | Statistical method | Effect size |
| 1 Patients with at least one exacerbation until 1 yr Show forest plot | 5 | 667 | Risk Ratio (M‐H, Random, 95% CI) | 0.73 [0.55, 0.97] |
| 2 Patients with at least one exacerbation until 1 year: subgroup analysis Show forest plot | 5 | Risk Ratio (M‐H, Random, 95% CI) | Subtotals only | |
| 2.1 duration of treatment: 6 months | 3 | 283 | Risk Ratio (M‐H, Random, 95% CI) | 0.65 [0.33, 1.29] |
| 2.2 duration of treatment: 12 months | 2 | 384 | Risk Ratio (M‐H, Random, 95% CI) | 0.52 [0.14, 1.92] |
| 3 Patients with at least one exacerbation at 2 yrs Show forest plot | 3 | 919 | Risk Ratio (M‐H, Fixed, 95% CI) | 0.80 [0.73, 0.88] |
| 4 Patients with at least one exacerbation at 2 yrs (best scenario) Show forest plot | 3 | 919 | Risk Ratio (M‐H, Random, 95% CI) | 0.62 [0.44, 0.87] |
| 5 Patients with at least one exacerbation at 2 yrs (worst scenario) Show forest plot | 3 | 919 | Risk Ratio (M‐H, Random, 95% CI) | 1.11 [0.73, 1.68] |
| 6 Patients who progressed at 2 yrs Show forest plot | 3 | 919 | Risk Ratio (M‐H, Fixed, 95% CI) | 0.69 [0.55, 0.87] |
| 7 Patients who progressed at 2 yrs (best scenario) Show forest plot | 3 | 919 | Risk Ratio (M‐H, Fixed, 95% CI) | 0.43 [0.35, 0.53] |
| 8 Patients who progressed at 2 yrs (worst scenario) Show forest plot | 3 | 919 | Risk Ratio (M‐H, Random, 95% CI) | 1.31 [0.60, 2.89] |
| 9 Mean change in disability (EDSS) at 2 yrs Show forest plot | 2 | 618 | Mean Difference (IV, Fixed, 95% CI) | ‐0.25 [‐0.46, ‐0.05] |
| Outcome or subgroup title | No. of studies | No. of participants | Statistical method | Effect size |
| 1 Patients who required steroid treatment until first year Show forest plot | 2 | 85 | Risk Ratio (M‐H, Random, 95% CI) | 0.52 [0.04, 7.31] |
| 2 Patients who required steroid treatment until 2 years Show forest plot | 1 | 371 | Risk Ratio (M‐H, Fixed, 95% CI) | 0.70 [0.56, 0.87] |
| 3 Patients with at least one hospital admission until 2 years Show forest plot | 2 | 391 | Risk Ratio (M‐H, Random, 95% CI) | 0.44 [0.08, 2.36] |
| Outcome or subgroup title | No. of studies | No. of participants | Statistical method | Effect size |
| 1 Patients who had clinical adverse events during treatment Show forest plot | 6 | Risk Ratio (M‐H, Random, 95% CI) | Subtotals only | |
| 1.1 Flu‐like symptoms | 4 | 1117 | Risk Ratio (M‐H, Random, 95% CI) | 1.70 [1.23, 2.37] |
| 1.2 Fever | 6 | 1199 | Risk Ratio (M‐H, Random, 95% CI) | 1.92 [1.52, 2.43] |
| 1.3 Myalgias/arthralgias | 6 | 1199 | Risk Ratio (M‐H, Random, 95% CI) | 1.90 [1.50, 2.42] |
| 1.4 Fatigue | 5 | 952 | Risk Ratio (M‐H, Random, 95% CI) | 1.37 [1.01, 1.88] |
| 1.5 Nausea and vomiting | 2 | 363 | Risk Ratio (M‐H, Random, 95% CI) | 2.00 [0.75, 5.31] |
| 1.6 Headache | 5 | 952 | Risk Ratio (M‐H, Random, 95% CI) | 1.17 [1.03, 1.33] |
| 1.7 Injection site‐reactions by subcutaneous route | 4 | 878 | Risk Ratio (M‐H, Random, 95% CI) | 5.57 [2.33, 13.29] |
| 1.8 Hair loss | 2 | 82 | Risk Ratio (M‐H, Random, 95% CI) | 9.32 [1.84, 47.23] |
| 1.9 Major psichic disorders | 6 | 1199 | Risk Ratio (M‐H, Random, 95% CI) | 0.96 [0.75, 1.24] |
| 1.10 Committed or attempted suicide | 3 | 919 | Risk Ratio (M‐H, Random, 95% CI) | 1.98 [0.41, 9.56] |
| 2 Patients who had abnormal laboratory values during treatment Show forest plot | 5 | Risk Ratio (M‐H, Fixed, 95% CI) | Subtotals only | |
| 2.1 Decreased hemoglobin values | 3 | 383 | Risk Ratio (M‐H, Fixed, 95% CI) | 2.84 [0.69, 11.59] |
| 2.2 Leukopenia | 5 | 1004 | Risk Ratio (M‐H, Fixed, 95% CI) | 6.47 [2.43, 17.20] |
| 2.3 Lymphopenia | 2 | 618 | Risk Ratio (M‐H, Fixed, 95% CI) | 1.90 [1.39, 2.60] |
| 2.4 Thrombocytopenia | 3 | 383 | Risk Ratio (M‐H, Fixed, 95% CI) | 7.47 [0.98, 57.15] |
| 2.5 Increased aspartate aminotransferase | 3 | 919 | Risk Ratio (M‐H, Fixed, 95% CI) | 2.83 [1.14, 7.06] |
| 2.6 Increased alanine aminotransferase | 4 | 981 | Risk Ratio (M‐H, Fixed, 95% CI) | 3.57 [1.98, 6.43] |