Tratamiento para la miositis por cuerpos de inclusión
Resumen
Antecedentes
La miositis por cuerpos de inclusión (MCI) es una enfermedad muscular inflamatoria (miopatía) de aparición tardía asociada con atrofia muscular y debilidad progresivas de los miembros proximales y distales. Las opciones de tratamiento se han intentado dirigir a las características inflamatorias y atróficas de esta afección (por ejemplo, con fármacos inmunosupresores e inmunomoduladores, esteroides anabólicos y tratamientos antioxidantes), aunque hasta ahora no hay un tratamiento eficaz conocido para la reversión o la reducción de la progresión de la miositis por cuerpos de inclusión. En esta revisión se han considerado los efectos beneficiosos, los efectos adversos y los costos del tratamiento dirigido a los efectos fundamentales de la afección, a saber, la atrofia muscular, la debilidad y el deterioro funcional.
Objetivos
Evaluar los efectos del tratamiento para la MCI.
Métodos de búsqueda
El 7 octubre 2014, se hicieron búsquedas en el registro especializado del Grupo Cochrane de Enfermedades Neuromusculares (Cochrane Neuromuscular Disease Group), en el Registro Cochrane Central de Ensayos Controlados (Cochrane Central Register of Controlled Trials) (CENTRAL), MEDLINE y en EMBASE. Además, en noviembre 2014 se realizaron búsquedas de ensayos en curso o terminadas pero no publicados en los registros de ensayos clínicos.
Criterios de selección
Se consideraron para inclusión en la revisión los ensayos aleatorios o cuasialeatorios, incluidos los ensayos cruzados (crossover), del tratamiento para la MCI en adultos en comparación con placebo u otro tratamiento. Se excluyeron específicamente los pacientes con MCI familiar y miopatía por cuerpos de inclusión hereditaria, pero se incluyeron los pacientes con enfermedades del tejido conjuntivo y autoinmunitarias asociadas con MCI, que pueden o no identificarse en los ensayos. No se incluyeron los estudios de terapia con ejercicios o tratamiento de la disfagia, que son los temas de otras revisiones sistemáticas Cochrane.
Obtención y análisis de los datos
Se utilizaron procedimientos metodológicos Cochrane estándar.
Resultados principales
La revisión incluyó diez ensayos (249 participantes) que utilizaron diferentes regímenes de tratamiento. Siete de los diez ensayos evaluaron agentes únicos y tres evaluaron agentes combinados. Muchos de los estudios no presentaron datos suficientes para el informe del resultado primario de la revisión, que fue el cambio porcentual en la puntuación de fuerza muscular a los seis meses. Los datos agrupados de dos ensayos de interferón beta‐1a (n = 58) no identificaron diferencias importantes en las puntuaciones normalizadas de la suma de la fuerza muscular manual desde el inicio hasta los seis meses (diferencia de medias [DM] ‐0,06; IC del 95%: ‐0,15 a 0,03) entre IFN beta‐1a y placebo (pruebas de calidad moderada). Un único ensayo de metotrexato (MTX) (n = 44) proporcionó pruebas de calidad moderada de que el MTX no detuvo ni enlenteció la progresión de la enfermedad, sobre la base del cambio porcentual informado en las puntuaciones de la suma de la fuerza muscular manual a los 12 meses. Ninguno de los ensayos publicados completamente tuvo poder estadístico suficiente para detectar un efecto del tratamiento.
Se consideró que seis de los nueve ensayos publicados completamente aportaron pruebas de calidad muy baja con respecto a la medida de resultado primaria. Tres ensayos (n = 78) compararon la inmunoglobulina intravenosa (combinada en un ensayo con prednisona) con placebo, pero no fue posible realizar el metanálisis debido a las variaciones en el análisis de los estudios y a la presentación de los datos del ensayo, sin acceso a los datos primarios para el reanálisis. Otras comparaciones también se informaron en ensayos individuales. Un ensayo abierto de inmunoglobulina anti‐linfocitos T (IgAT) combinada con MTX versus MTX proporcionó pruebas de calidad muy baja a favor del tratamiento combinado, sobre la base del cambio porcentual en las puntuaciones cuantitativas de la suma de la fuerza muscular a los 12 meses (DM 12,50%; IC del 95%: 2,43 a 22,57). Los datos de los ensayos de oxandrolona versus placebo, azatioprina (AZA) combinada con MTX versus MTX y arimoclomol versus placebo no permitieron informar sobre el cambio porcentual o normalizado en las puntuaciones de la suma de la fuerza muscular. Un análisis completo de los efectos del arimoclomol está pendiente de la publicación de los datos. Están en curso estudios de simvastatina y bimagrumab (BYM338).
Todos los ensayos analizados informaron eventos adversos. Solamente uno de los diez ensayos interpretó la significación estadística de los eventos adversos. Ninguno de los ensayos incluyó criterios preespecificados para los eventos adversos significativos.
Conclusiones de los autores
Los ensayos de interferón beta‐1a y MTX proporcionaron pruebas de calidad moderada de que no tienen efectos sobre la progresión de la MCI. Las limitaciones generales del diseño de los ensayos, que incluyen el riesgo de sesgo, los escasos números de participantes y la corta duración, hacen difícil determinar si alguno de los tratamientos farmacológicos incluidos en esta revisión fue eficaz. Un ensayo abierto de ATG combinada con MTX versus MTX aportó pruebas de calidad muy baja a favor del tratamiento combinado sobre la base de los datos de cambio porcentual facilitados. No fue posible establecer conclusiones de los ensayos de IgIV, oxandrolona y AZA más MTX versus MTX. Se necesitan más ensayos controlados aleatorios de mayor tamaño, con una duración más prolongada y que utilicen medidas de resultado completamente validadas, estandarizadas y de interés.
PICO
Resumen en términos sencillos
Tratamiento para la miositis por cuerpos de inclusión
Pregunta de la revisión
Se examinaron las pruebas de los ensayos clínicos acerca de los efectos de los tratamientos farmacológicos para la miositis por cuerpos de inclusión (MCI). No se incluyeron ensayos de ejercicios o tratamiento de las dificultades para tragar, ya que estos son los temas de otras revisiones Cochrane.
Antecedentes
La MCI es una enfermedad que afecta principalmente a personas de edad avanzada. Los síntomas principales son un aumento de la emaciación muscular y la debilidad de los brazos y las piernas. Algunos pacientes experimentan dificultades para tragar. Hasta ahora ningún tratamiento ha mostrado modificar el curso de la enfermedad. Los tratamientos que se han evaluado incluyen agentes que suprimen o modifican la respuesta inmunitaria, fármacos que promueven el crecimiento muscular y antioxidantes.
Características de los estudios
Esta revisión incluyó 10 ensayos (249 participantes). Uno de estos ensayos (24 participantes) se ha completado, pero aún no se ha publicado. Siete ensayos compararon tratamientos con placebo (tratamiento inactivo): tres de inmunoglobulina intravenosa (IgIV), dos de interferón beta‐1a (IFN beta‐1a) y uno de oxandrolona, otro de metotrexato (MTX) y otro de arimoclomol (todavía no publicado). Dos ensayos adicionales compararon MTX con tratamiento inmunosupresor combinado (MTX con inmunoglobulina anti‐linfocitos T [IgAT] [un agente que destruye los leucocitos] y MTX con azatioprina). En estos dos ensayos, los participantes y los investigadores conocían el tratamiento que recibía el participante, lo que podría haber sesgado los resultados.
Resultados y calidad de las pruebas
Para el resultado primario de esta revisión, que fue la fuerza muscular, solamente fue posible combinar los resultados de los dos ensayos de tratamiento con IFN 1a‐beta versus placebo. Este tratamiento no pareció ofrecer efectos beneficiosos en cuanto a la fuerza muscular. El MTX tampoco detuvo ni retrasó la pérdida de la fuerza muscular en comparación con placebo. Se considera que las pruebas de estos ensayos fueron de calidad moderada porque los ensayos fueron demasiado pequeños para descartar un posible efecto beneficioso de estos fármacos. Las pruebas de los otros ensayos fueron de calidad muy baja. Tres ensayos compararon IgIV (combinada en un ensayo con prednisona) con placebo, pero no fue posible realizar el metanálisis porque los datos disponibles no fueron apropiados. Un ensayo de IgAT combinada con MTX versus MTX solo proporcionó pruebas de calidad muy baja de un efecto sobre la fuerza muscular a favor del MTX más IgAT a los 12 meses. Las otras comparaciones, MTX versus placebo, oxandrolona versus placebo, azatioprina combinada con MTX versus MTX y arimoclomol versus placebo se informaron en ensayos únicos que no proporcionaron suficientes datos para el análisis del efecto sobre la fuerza muscular.
Debido al tamaño pequeño y la corta duración, los ensayos examinados en general no fueron capaces de proporcionar respuestas definitivas sobre si los tratamientos estudiados fueron eficaces o ineficaces. Todas las intervenciones que se estudiaron provocaron algunos efectos adversos y se conoce que causan eventos adversos potencialmente graves. Se necesitan ensayos más grandes con una duración más larga y que utilicen maneras consistentes de medir los efectos de los tratamientos que son significativos para los pacientes con MCI. Acordar mediciones comunes para los ensayos también hará más fácil comparar los resultados de los ensayos y evaluar los posibles tratamientos.
Las pruebas están actualizadas hasta octubre 2014.
Authors' conclusions
Summary of findings
| Intravenous immunoglobulin versus placebo for inclusion body myositis | ||||||
| Patient or population: people with inclusion body myositis | ||||||
| Outcomes | Illustrative comparative risks* (95% CI) | Relative effect | No of participants | Quality of the evidence | Comments | |
| Assumed risk | Corresponding risk | |||||
| Placebo | Intravenous immunoglobulin | |||||
| Change in muscle strength at 6 months (%) | Not estimable | Not estimable | Not estimable | 78 | See comment | 2 of the 3 studies assessed change in muscle strength at 3 months and the other at 6 months. Data were not suitable for meta‐analysis. |
| Change in muscle strength at 12 months (%) ‐ not measured | ‐ | ‐ | ‐ | ‐ | ‐ | ‐ |
| Change in muscle mass at 6 months (%) ‐ not measured | ‐ | ‐ | ‐ | ‐ | ‐ | ‐ |
| Change in handgrip strength at 6 months (%) ‐ not measured | ‐ | ‐ | ‐ | ‐ | ‐ | ‐ |
| Change in timed walk at 6 months (%) e.g. 10‐metre or 6‐minute walk test at 6 months ‐ not measured | ‐ | ‐ | ‐ | ‐ | ‐ | ‐ |
| Significant adverse events | Not estimable | Not estimable | Not estimable | 78 (3 studies) | See comment | Dalakas 1997: unclear whether dropouts from treatment or placebo group. Dalakas 2001: treatment group withdrawals = 0; placebo group withdrawals = 1. Walter 2000: 2 withdrawals but unspecified whether from treatment or placebo group |
| *The basis for the assumed risk (e.g. the median control group risk across studies) is provided in footnotes. The corresponding risk (and its 95% confidence interval) is based on the assumed risk in the comparison group and the relative effect of the intervention (and its 95% CI). | ||||||
| GRADE Working Group grades of evidence | ||||||
| Interferon beta‐1a (IFN beta‐1a) compared to placebo for inclusion body myositis | ||||||
| Patient or population: people with inclusion body myositis | ||||||
| Outcomes | Illustrative comparative risks* (95% CI) | Relative effect | No of participants | Quality of the evidence | Comments | |
| Assumed risk | Corresponding risk | |||||
| Placebo | IFN beta‐1a | |||||
| Change in muscle strength at 6 months (normalised MMT score ‐ see Characteristics of Studies table) | The mean changes in normalised muscle strength in the control groups was | The mean change in normalised muscle strength in the intervention groups was | ‐ | 58 | ⊕⊕⊕⊝ | |
| Change in muscle strength at 12 months (%) ‐ not measured | ‐ | ‐ | ‐ | ‐ | ‐ | ‐ |
| Change in muscle mass at 6 months (%) | The mean change in muscle mass (%) in the control groups was ‐0.85 and ‐1.77. | The mean change in muscle mass (%) in the intervention groups was | ‐ | 58 | ⊕⊕⊕⊝ | |
| Change in handgrip strength at 6 months (%) | Not estimable | Not estimable | Not estimable | 58 (2 studies) | See comment | Baseline measurements were not reported, so % change was not calculable. There was a non‐significant difference in handgrip strength (kg) between IFN beta‐1a and placebo in 1 trial (MD ‐0.16, 95% CI ‐1.55 to 1.22). In the other the MD was 1.84 kg with a 95% CI of 0.46 to 3.21 in favour of IFN beta‐1a |
| Change in timed walk at 6 months (%) e.g. 10‐metre or 6‐minute walk test at 6 months ‐ not measured | ‐ | ‐ | ‐ | ‐ | ‐ | ‐ |
| Significant adverse events | Not estimable | Not estimable | Not estimable | 58 (2 studies) | See comment | Muscle Study Group 2001: treatment group withdrawals = 1; placebo group withdrawals = 0. Muscle Study Group 2004: treatment group withdrawals = 2; placebo group withdrawals = 1 |
| *The basis for the assumed risk (e.g. the median control group risk across studies) is provided in footnotes. The corresponding risk (and its 95% confidence interval) is based on the assumed risk in the comparison group and the relative effect of the intervention (and its 95% CI). | ||||||
| GRADE Working Group grades of evidence | ||||||
| 1 The CI includes the possibility of an effect favouring either IFN beta‐1a or placebo when data from the two trials are combined. | ||||||
| Methotrexate compared to placebo for inclusion body myositis | ||||||
| Patient or population: people with inclusion body myositis | ||||||
| Outcomes | Illustrative comparative risks* (95% CI) | Relative effect | No of Participants | Quality of the evidence | Comments | |
| Assumed risk | Corresponding risk | |||||
| Placebo | Methotrexate | |||||
| Change in muscle strength at 6 months (%) | Not estimable | Not estimable | Not estimable | 44 (1 study) | See comment | Data collected at 12 months only |
| Change in muscle strength at 12 months (%) ‐ MMT | The mean change in muscle strength (%) in the control group was ‐2.0% | The mean change in muscle strength (%) in the intervention group was 1.5% higher (1.0 lower to 3.9 higher) | ‐ | 44 (1 study) | ⊕⊕⊝⊝ | MD in mean change based on intention‐to‐treat data. Per protocol: MD 1.6%, 95% CI ‐2.3 to 5.4. This study was assessed as having a low overall risk of bias. |
| Change in muscle mass at 6 months (%) ‐ not measured | ‐ | ‐ | ‐ | ‐ | ‐ | ‐ |
| Change in handgrip strength at 6 months (%) ‐ not measured | ‐ | ‐ | ‐ | ‐ | ‐ | ‐ |
| Change in timed walk at 6 months (%) e.g. 10‐metre or 6‐minute walk test at 6 months ‐ not measured | ‐ | ‐ | ‐ | ‐ | ‐ | ‐ |
| Significant adverse events | 43 per 1000 | 381 per 1000 (52 to 1000) | RR 8.76 (1.19 to 64.28) | 44 (1 study) | ⊕⊕⊝⊝ moderate2 | Badrising 2002: treatment group withdrawals = 8/21; placebo group withdrawals = 1/23 |
| *The basis for the assumed risk (e.g. the median control group risk across studies) is provided in footnotes. The corresponding risk (and its 95% confidence interval) is based on the assumed risk in the comparison group and the relative effect of the intervention (and its 95% CI). | ||||||
| GRADE Working Group grades of evidence | ||||||
| 1 Downgraded for imprecision. The single randomised controlled trial of methotrexate was insufficiently powered to exclude a possible benefit from methotrexate. 2 Downgraded for imprecision. | ||||||
| Methotrexate (MTX) and anti‐T lymphocyte immunoglobulin (ATG) compared to MTX for inclusion body myositis | ||||||
| Patient or population: people with inclusion body myositis | ||||||
| Outcomes | Illustrative comparative risks* (95% CI) | Relative effect | No of participants | Quality of the evidence | Comments | |
| Assumed risk | Corresponding risk | |||||
| MTX | MTX and ATG | |||||
| Change in muscle strength at 6 months (%) | Not estimable | Not estimable | Not estimable | 11 | See comment | Data collected at 12 months only |
| Change in muscle strength at 12 months (%) ‐ QMT | The mean change in muscle strength (%) in the control group was ‐11.1% | The mean change in muscle strength (%) in the intervention groups was 12.50 higher (2.43 to 22.57 higher) | Not estimable | 11 | ⊕⊝⊝⊝ | |
| Change in muscle mass at 12 months (%) ‐ not measured | ‐ | ‐ | ‐ | ‐ | ‐ | ‐ |
| Change in handgrip strength at 6 months (%) | Not estimable | Not estimable | Not estimable | 11 | See comment | Data collected at 12 months only; rescaling of data not performed due to uncertainty in the assumption of linear change |
| Change in timed walk at 6 months (%) e.g. 10‐metre or 6‐minute walk test at 6 months ‐ not measured | ‐ | ‐ | ‐ | ‐ | ‐ | ‐ |
| Significant adverse events | Not estimable | Not estimable | Not estimable | 11 | See comment | Lindberg 2003: combined ATG and MTX group withdrawals = 0; MTX group withdrawals = 1 |
| *The basis for the assumed risk (e.g. the median control group risk across studies) is provided in footnotes. The corresponding risk (and its 95% confidence interval) is based on the assumed risk in the comparison group and the relative effect of the intervention (and its 95% CI). | ||||||
| GRADE Working Group grades of evidence | ||||||
| 1 Downgraded for study design: as an open‐label study, there is a high risk of bias. | ||||||
| Methotrexate (MTX) and azathioprine (AZA) compared to MTX (plus leucovorin) for inclusion body myositis | ||||||
| Patient or population: people with inclusion body myositis | ||||||
| Outcomes | Illustrative comparative risks* (95% CI) | Relative effect | No of Participants | Quality of the evidence | Comments | |
| Assumed risk | Corresponding risk | |||||
| Methotrexate | Methotrexate and azathioprine | |||||
| Change in muscle strength at 6 months (%) | Not estimable | Not estimable | Not estimable | 11 | See comment | Categorical change in MMT only reported. This study was graded as having a high risk of bias. |
| Change in muscle strength at 12 months (%) (using MMT or QMT) at 12 months ‐ not measured | ‐ | ‐ | ‐ | ‐ | ‐ | ‐ |
| Change in muscle mass at 6 months (%) ‐ not measured | ‐ | ‐ | ‐ | ‐ | ‐ | ‐ |
| Change in handgrip strength at 6 months (%) ‐ not measured | ‐ | ‐ | ‐ | ‐ | ‐ | ‐ |
| Change in timed walk at 6 months (%) e.g. 10‐metre or 6‐minute walk test at 6 months ‐ not measured | ‐ | ‐ | ‐ | ‐ | ‐ | ‐ |
| Significant adverse events | Not estimable | Not estimable | Not estimable | 11 | See comment | Leff 1993: Combined AZA and MTX = 3 withdrawals; MTX (plus leucovorin) = 0 withdrawals |
| *The basis for the assumed risk (e.g. the median control group risk across studies) is provided in footnotes. The corresponding risk (and its 95% confidence interval) is based on the assumed risk in the comparison group and the relative effect of the intervention (and its 95% CI). | ||||||
| GRADE Working Group grades of evidence | ||||||
| Oxandrolone compared to placebo for inclusion body myositis | ||||||
| Patient or population: people with inclusion body myositis | ||||||
| Outcomes | Illustrative comparative risks* (95% CI) | Relative effect | No of participants | Quality of the evidence | Comments | |
| Assumed risk | Corresponding risk | |||||
| Placebo | Oxandrolone | |||||
| Change in muscle strength at 6 months (%) | Not estimable | Not estimable | Not estimable | 16 (1 study) | See comment | Data collected at 12 months only; re‐scaling of data not performed due to uncertainty in the assumption of linear change. There were also insufficient data to calculate percentage change in muscle strength. This study was graded as having an unclear risk of bias |
| Change in muscle strength at 12 months (%) ‐ not measured | ‐ | ‐ | ‐ | ‐ | ‐ | ‐ |
| Change in muscle mass at 6 months (%) | Not estimable | Not estimable | Not estimable | 16 (1 study) | See comment | Data collected at 12 months only; rescaling of data not performed due to uncertainty in the assumption of linear change. |
| Change in handgrip strength at 6 months (%) ‐ not measured | ‐ | ‐ | ‐ | ‐ | ‐ | ‐ |
| Change in timed walk at 6 months (%) e.g. 10‐metre or 6‐minute walk test at 6 months ‐ not measured | ‐ | ‐ | ‐ | ‐ | ‐ | ‐ |
| Significant adverse events | Not estimable | Not estimable | Not estimable | Not estimable | See comment | Rutkove 2002: treatment group withdrawals = 1; placebo group withdrawals = 2 |
| *The basis for the assumed risk (e.g. the median control group risk across studies) is provided in footnotes. The corresponding risk (and its 95% confidence interval) is based on the assumed risk in the comparison group and the relative effect of the intervention (and its 95% CI). | ||||||
| GRADE Working Group grades of evidence | ||||||
Background
Description of the condition
Inclusion body myositis (IBM) is a late‐onset inflammatory muscle disease (myopathy) with a distinctive pattern of proximal and distal limb atrophy and weakness. IBM is considered to be the most common acquired myopathy in those over age 50. In early published series, IBM has accounted for up to 28% of all idiopathic inflammatory myopathies, although the true proportion could be much higher (Lotz 1989). In the Netherlands, prevalence has been estimated at 4.9 per million inhabitants (Badrising 2000). Between 2000 and 2008, prevalence in Western Australia rose from 9.3 to 14.9 per million inhabitants, a change attributed to improved case identification (Needham 2008; Phillips 2000). Prevalence adjusted for age over 50 years is higher, up to 51.3 per million population (Needham 2008).
IBM is usually a sporadic and isolated disorder that can be associated with secondary mitochondrial DNA abnormalities in excess of those seen with normal ageing (Oldfors 1995). In rare instances, typical IBM occurs in families (Amato 1998; Tateyama 2003); this familial IBM should not be confused with hereditary inclusion body myopathy, which is not usually associated with inflammation and in which there may be mutations in the GNE gene (Huizing 2009). IBM is sometimes associated with a variety of connective tissue and autoimmune diseases, including rheumatoid arthritis (Soden 1994), vitamin B12 deficiency (Khraishi 1992), Sjögren's syndrome (Gutmann 1985; Khraishi 1992), chronic immune thrombocytopenia (Riggs 1984), sarcoidosis (Danon 1986), collagen vascular disease (Lane 1985), and common variable immune deficiency (Dalakas 1995; Lindberg 1990).
To date, clinicopathologically defined criteria for sporadic IBM, as proposed by Griggs 1995 and revised by Benveniste 2010 and Hilton‐Jones 2010, have formed the basis for diagnostic criteria. Improved case ascertainment through clinical assessment has supported the application of clinically defined diagnostic criteria. However, for the purpose of reviewing the existing clinical trials, we included those trials using clinicopathologically defined sporadic IBM, as defined by Griggs 1995, Benveniste 2010, or Hilton‐Jones 2010.
Potential outcome measures
The muscle atrophy and weakness of IBM usually follow a slowly progressive course. In the absence of established effective drug treatment, the mainstay of treatment is supportive. Natural history studies suggest that people with IBM can experience a 3.5% to 5.2% annual decline in compound muscle strength graded manually (Cortese 2013; Cox 2011). Because of its characteristic pattern of muscle involvement, IBM may cause predictable functional difficulties. For example, weakness of the long (extrinsic) finger flexors can impair handgrip, while quadriceps weakness can cause knee instability, making rising from chairs, managing stairs, and walking increasingly difficult. For the purpose of this review, it seemed reasonable to choose those outcome measures assessing the cardinal effects of IBM, namely muscle atrophy, weakness, and functional impairment.
In terms of atrophy, muscle mass can be measured in a number of ways, including:
-
urinary creatinine excretion under controlled conditions;
-
potassium isotope counting;
-
magnetic resonance imaging (MRI);
-
computerised tomography (CT) muscle imaging; and
-
dual energy X‐ray absorptiometry (DEXA).
Muscle strength can be measured manually (referred to as manual muscle testing, or MMT) and is commonly scored using the six‐point Medical Research Council (MRC) strength scale or modified MRC scale. Alternatively, the maximal voluntary isometric contraction or isokinetic muscle strength can be measured using a hand‐held or fixed myometer (referred to as quantitative muscle testing (QMT)) and the results expressed in units of force (newtons, kilograms, or pounds). However, as with MMT, the selected muscles tested by QMT can vary; QMT sum scores are often expressed as the z‐score, which is the sum of the standard deviations from the mean for each muscle tested.
In terms of measuring functional impairment, single‐item tests include timed walking tests, stair climb, and rise from chair; we have chosen timed walking tests as appropriate measures for the patient population in this review. There are also questionnaire based, multi‐item rating scales, such as the IBM Functional Rating Scale, that provide an overall score across different functional tasks (Jackson 2008). In choosing appropriate outcome measures for this review, we also wanted to consider other patient reported outcome measures, including symptom severity and quality of life, as well as adverse events associated with treatment. However, these outcome measures are not consistently applied across different muscle disease centres and trials at present.
We can specify a minimum time period for the primary outcome measure in relation to its sensitivity to change in a slowly progressive condition. Power calculations based upon available natural history data for muscle strength in IBM support a minimum trial length of six months (Rose 2001).
Description of the intervention
Interventions included pharmacological agents, dietary supplements, and musculoskeletal surgery. We excluded the management of dysphagia and the role of exercise therapy for muscle disease, which other Cochrane systematic reviews of interventions discuss (Hill 2004; Voet 2013).
Why it is important to do this review
As the first systematic review of treatment for IBM, this Cochrane review aimed to determine the evidence base for current treatment and to identify dose‐responses where possible. Our findings may also be relevant to other neuromuscular and age‐related conditions in which muscle weakness, atrophy, and inflammation are prominent symptoms.
Objectives
To systematically assess the effects of treatment for IBM.
Methods
Criteria for considering studies for this review
Types of studies
We considered for inclusion randomised or quasi‐randomised trials, including cross‐over trials, of treatment for IBM (except for exercise therapy and dysphagia management). We included comparisons of treatment versus placebo or any other treatment. We included studies reported as full text, those published as abstract only, and unpublished data, with no language restrictions.
Types of participants
All participants were over 18 years of age and had a clinicopathologically defined diagnosis of IBM (Benveniste 2010; Griggs 1995; Hilton‐Jones 2010). We specifically excluded people with familial IBM and hereditary inclusion body myopathy, but we included people who had connective tissue and autoimmune diseases associated with IBM, which may or may not be identified in trials.
Types of interventions
We included the following interventions.
-
Immunosuppressive agents, e.g. prednisolone (and other corticosteroids), cyclophosphamide, chlorambucil, azathioprine, methotrexate (MTX), and ciclosporin.
-
Immunomodulatory interventions, e.g. intravenous immunoglobulin, leukopheresis, plasma exchange, and immune‐targeted monoclonal antibodies.
-
Antioxidants, e.g. vitamin E.
-
Mitochondrial substrates, e.g. carnitine and ubiquinone.
-
Anabolic steroids and muscle supplements.
-
Other interventions except for exercise therapy and dysphagia management.
Therapies were administered using various protocols including as single agents, combined therapy, or sequential therapy. We analysed different interventions separately.
Types of outcome measures
Primary outcomes
The primary outcome measure for this review was percentage change in muscle strength (using MMT or QMT) from baseline at six months.
Secondary outcomes
Secondary outcome measures for this review were as follows.
-
Percentage change from baseline in muscle strength (using MMT or QMT) at 12 months.
-
Percentage change from baseline in handgrip strength at 6 months.
-
Percentage change from baseline in muscle mass (by whatever method, e.g. MRI) at 6 months.
-
Percentage change from baseline in timed walk (e.g. 10‐metre or 6‐minute walk) at 6 months.
-
Significant adverse events from the intervention.*
We evaluated QMT only when the trial did not use MMT for muscle testing.
Where relevant data were available we considered the costs of interventions in the Discussion.
*An `adverse event' is defined as an adverse outcome that occurs during or after the use of a drug or other intervention but is not necessarily caused by it (Cochrane 2015).
Search methods for identification of studies
Electronic searches
On 7 October 2014, the Trials Search Co‐ordinator searched the Cochrane Neuromuscular Disease Group Specialized Register, the Cochrane Central Register for Controlled Trials (CENTRAL, 2014, Issue 9 in the Cochrane Library), MEDLINE (January 1966 to September 2014), and EMBASE (January 1947 to September 2014). Detailed search strategies are in the appendices: Cochrane Neuromuscular Disease Group Specialized Register (Appendix 1), CENTRAL (Appendix 2), MEDLINE (Appendix 3), and EMBASE (Appendix 4).
We searched all databases from their inception to the present, and we imposed no restriction on language of publication.
In November 2014, we searched ClinicalTrials.gov (clinicaltrials.gov) and the World Health Organization International Clinical Trials Registry Platform (ICTRP) (who.int/trialsearch/) for ongoing trials and completed unpublished studies using the search term `inclusion body myositis'.
Searching other resources
We checked references in the identified trials and contacted trial authors to identify any additional published or unpublished data. In 1999, the review authors scanned conference abstracts including those of the American Academy of Neurology, the International Conference on Neuromuscular Diseases, the World Muscle Society, and the European Neurological Society for relevant studies but did not update this search.
Data collection and analysis
At least two review authors (from among JM, KJ, KL, MW, MR and RB) extracted data and resolved any discrepancies by discussion. We contacted the authors of the trials to provide missing data where possible.
Selection of studies
At least two review authors (from among MR, KJ, MW, and JM) examined the papers identified by the search strategy for studies eligible for inclusion. The review authors independently confirmed that studies were randomised or quasi‐randomised trials and that diagnostic criteria for IBM had been met.
Data extraction and management
At least five review authors (from among MR, KJ, KL, MW, JM, and RB) independently performed data extraction using a specially designed data extraction form. The review authors contacted authors of included trials to provide missing data where possible. One or two review authors checked and entered data into the Cochrane authoring and statistical software, Review Manager (RevMan) 5 (MR and KL) (RevMan 2014); another review author checked the data entry (KJ). A non‐conflicted review author performed data extraction independently if any review author had potential conflicts of interest, for example through involvement in an included study.
Assessment of risk of bias in included studies
Two review authors (MR and KJ) independently assessed the risk of bias in included studies using the following criteria: sequence generation, allocation concealment, blinding of participants and personnel, blinding of outcome assessors, incomplete outcome data, selective outcome reporting, and other risk of bias. The review authors identified high, low, or unclear risk of bias for each trial according to criteria described in the Cochrane Handbook for Systematic Reviews of Interventions (Higgins 2011). We used the `unclear' rating when there was insufficient information to reach a judgement or when, despite knowing what occurred in the study, the risk of bias remained unclear. We also examined whether studies included explicit diagnostic criteria, validation of outcome measurements, and power calculations to detect statistical benefit. Where we were uncertain, we contacted trial authors for clarification. The review authors resolved any disagreements over `Risk of bias' assessment by consensus. We conducted the review according to the published protocol (Rose 2014), reporting any deviations from it in Differences between protocol and review.
Measures of treatment effect
We analysed dichotomous data as a risk ratio with a 95% confidence interval (CI). We analysed continuous data as the mean difference, or standardised mean difference with 95% CI when outcomes were conceptually the same but measured in different ways. We calculated a treatment effect through random‐effects meta‐analysis, using RevMan 5 (RevMan 2014).
Unit of analysis issues
Included studies determined compound muscle strength using different muscle groups, which represented a potential unit of analysis error. The carry‐over effect of sequential intervention in cross‐over trials was another potential source of unit of analysis error. There was also a possible learning effect in the primary outcome of interest, muscle strength, that we would have considered in particular for cross‐over trials if they had provided data suitable for analysis.
Dealing with missing data
We contacted investigators in order to verify key study characteristics and to obtain missing numerical outcome data where possible (such as when a study was only available as an abstract). Where this was not possible, and we thought that missing data introduced serious bias, we explored the impact of including such studies.
Assessment of heterogeneity
We used the I² statistic to measure heterogeneity among the trials in each analysis. If we identified any substantial unexplained heterogeneity, we planned to report this and to explore the possible causes by prespecified subgroup analysis.
Assessment of reporting biases
We were not able to pool enough trials (that is more than 10) to create and examine a funnel plot to explore possible small‐study biases.
Data synthesis
We used a random‐effects model on the assumption that the included studies estimated different but related intervention effects. We applied a fixed‐effect model to further consider the presence of any heterogeneity among included studies. As the review included several comparisons that could not be combined in the same analysis, we reported the results for each comparison separately.
`Summary of findings' table
We created a `Summary of findings' table using the following outcomes.
-
Percentage change in muscle strength (using MMT or QMT) from baseline at 6 months.
-
Percentage change from baseline in muscle strength (using MMT or QMT) at 12 months.
-
Percentage change from baseline in muscle mass (by whatever method, e.g. MRI) at 6 months.
-
Percentage change from baseline in handgrip strength at 6 months.
-
Percentage change from baseline in timed walk (e.g. 10‐metre or 6‐minute walk) at 6 months.
-
Significant adverse events from the intervention.
We used the five GRADE considerations (study limitations, consistency of effect, imprecision, indirectness, and publication bias) to assess the quality of a body of evidence (studies that contribute data for the prespecified outcomes). We employed methods and recommendations described in Chapter 12 of the Cochrane Handbook for Systematic Reviews of Interventions (Higgins 2011), using GRADEpro software (GRADEpro 2014). We justified all decisions to down‐ or upgrade the quality of studies using footnotes and made comments to aid readers' understanding of the review where necessary. Three review authors (MR, KJ, and RB) completed this evidence grading, which all review authors checked and agreed on.
Subgroup analysis and investigation of heterogeneity
We were unable to perform subgroup analysis to investigate treatment effects in particular groups of participants because the included studies provided insufficient detail about the different participant groups. We were unable to use meta‐regression techniques to investigate heterogeneity.
Sensitivity analysis
We would have completed a sensitivity analysis on the basis of risk of bias and to further explore heterogeneity in the results if sufficient data (trials) had been available.
Results
Description of studies
The search strategies in the Appendices produced the following results: Cochrane Neuromuscular Disease Group Specialized Register 23 records, CENTRAL 26 records, MEDLINE 273 records, and EMBASE 95 records. In total, the review authors identified 24 studies, with 10 fulfilling the inclusion criteria; see Characteristics of included studies. We excluded 14 studies (4 ongoing) because they were not randomised controlled trials (RCTs); see Characteristics of excluded studies.
The interventions used among the 10 trials identified for inclusion were: intravenous immunoglobulin (IVIg) (Dalakas 1997; Dalakas 2001; Walter 2000); interferon beta‐1a (IFN beta‐1a) (Muscle Study Group 2001; Muscle Study Group 2004); methotrexate (MTX) (Badrising 2002); an anabolic steroid (oxandrolone) (Rutkove 2002); and arimoclomol (Machado 2013). All of these trials compared the intervention, used on its own, to placebo. The remaining two trials compared combination immunosuppressive therapy (MTX and anti‐T lymphocyte immunoglobulin (ATG) (Lindberg 2003); and MTX and azathioprine (AZA) (Leff 1993)) to an MTX treatment regimen.
As a protocol deviation, we included three studies that used clinicopathological diagnostic criteria not specified in Types of participants (Badrising 2002; Leff 1993; Walter 2000).
We identified three ongoing studies (one of which had three associated trial registrations) from ClinicalTrials.gov and the World Health Organization International Clinical Trials Registry Platform (EUCTR2007‐004359‐12‐IT; NCT00001265; NCT01423110). See Characteristics of ongoing studies.
Intravenous immunoglobulin versus placebo
Three trials compared IVIg with placebo (Dalakas 1997; Dalakas 2001; Walter 2000).
Dalakas 1997 block‐randomised 22 participants fulfilling the diagnostic criteria according to Griggs 1995 either to placebo (consisting of dextrose in half‐normal saline) or to 2 g/kg body weight IVIg monthly for 3 months. After a washout period of at least one month, the participants had the option of crossing over to the alternative treatment for a further three months. Nineteen of the participants were also being treated with prednisone or another immunosuppressant (MTX, AZA) prior to the study; only three participants continued with a low‐to‐moderate dose of prednisone during the trial. Assessments were made at baseline and at the end of each three‐month period, with both investigators and participants blinded to the treatment intervention. The study authors reported baseline mean total Medical Research Council (MRC) scores to be comparable.
Walter 2000 block‐randomised 22 participants (11 in each group) fulfilling diagnostic criteria similar to Griggs 1995. Participants were randomised to either placebo (1% human albumin in 2.5% glucose) or to IVIg at 2 g/kg body weight given over two to five days per month for six months, before crossing over to the other regimen for another six months. Nineteen of the participants had received various drugs prior to the study, including corticosteroids, AZA, and combined MTX and AZA. Six participants in each group remained on a constant, pretreatment medication, with nine receiving 2.5 mg to 15 mg daily corticosteroids and three receiving 4 mg to 10 mg daily corticosteroids and 100 mg to 150 mg daily AZA. All participants in both groups received physiotherapy once or twice weekly. The trial was double blinded with monthly outcome measurement from baseline to 12 months. Although the groups differed in baseline mean age (67 ± 12 years in the IVIg‐placebo group and 51 ± 11 years in the placebo‐IVIg group, the MRC sum scores and Neuromuscular Symptom and Disability Functional Scores showed no statistically significant between‐group differences at baseline.
Dalakas 2001 block‐randomised 37 participants (according to the flow chart in the study report) who fulfilled the diagnostic criteria for IBM according to Griggs 1995 either to placebo (consisting of dextrose in half‐normal saline) or two daily doses of 1g/kg body weight IVIg (2 g/kg bodyweight IVIg) monthly for three months. In addition, all participants in both groups received prednisone (tapered from 60 mg daily to 60 mg every other day). Assessments were made at baseline and at the end of each month of treatment for three months, with investigators and participants both blinded to intervention. At baseline, age and muscle strength (QMT and MRC sum scores) were comparable between treatment and placebo groups.
Interferon beta‐1a versus placebo
Two trials compared the use of IFN beta‐1a with placebo.
Muscle Study Group 2001 randomised 30 participants who had definite or probable IBM according to the criteria of Griggs 1995 into a double‐blinded, parallel‐group study. Sample size was chosen "to provide 85% power to detect a difference in tolerability of 95% in the placebo group versus 50% in the IFN beta‐1a group". The participants received either IFN beta‐1a or a matching placebo (lyophilised powder reconstituted with sterile saline). The dose of IFN beta‐1a was 15 μg/week initially and 30 μg/week from 4 weeks, administered by intramuscular injection once weekly for 24 weeks. Participants also received a 650 mg dose of paracetamol at the time of injection and repeated six‐hourly with a total of four doses. Trialists made assessments at baseline and at 4, 12, and 24 weeks. Baseline characteristics suggested between‐group similarity for age and average motor function; however, trial authors acknowledge a predominance of men in the treatment group.
The second trial performed by the same group recruited 30 participants (Muscle Study Group 2004). The study design and outcome measures were consistent with Muscle Study Group 2001, but the dosage of IFN beta‐1a was increased to 60 μg/week. Assessments were reported at baseline and at 4, 12, and 24 weeks; no primary outcome measure was specified. All reported baseline characteristics suggested that the two treatment groups were clinically similar. There was a predominance of men in the placebo group.
Methotrexate versus placebo
One double‐blinded trial randomised 44 participants to receive either MTX or an identical‐looking placebo (Badrising 2002). Sample size was chosen "to detect a difference of 100 Newtons (N) in mean [strength] changes or a clinically important stabilisation". Over a treatment period of 48 weeks, participants started on an initial dose of 5 mg a week that increased by 5 mg every 6 weeks up to 20 mg/week. To enhance blinding, the investigators reduced the dose by 2.5 mg without explanation for three months, and restored doses to 20 mg/week thereafter. The average dose was 14.6 mg/week in those who completed the trial and 14.0 mg/week in all treated participants. Forty‐two participants had a diagnosis of definite IBM and two a diagnosis of probable IBM, according to the European Neuromuscular Centre (ENMC) diagnostic criteria for IBM (Verschuuren 1997), elements of which are similar to those of Griggs 1995. Assessments were made at baseline, 22, and 48 weeks or immediately after withdrawal. The baseline characteristics suggested between‐group similarity. The study authors performed both an intention‐to‐treat analysis, carrying forward the last assessment, and a per protocol analysis of those who completed the study.
Combined immunosuppressive therapy: methotrexate and anti‐T lymphocyte immunoglobulin versus methotrexate
Lindberg 2003 was an open, randomised trial of 11 participants who fulfilled the morphological diagnostic criteria for IBM according to Griggs 1995. This trial compared 12 months' treatment with oral MTX 7.5 mg/week (MTX group, n = 5) with 12 months' MTX treatment preceded by 7 days of intravenous anti‐T lymphocyte immunoglobulin treatment (MTX + ATG group, n = 6). ATG doses were fixed for the first two days (5 mg/kg and 4 mg/kg body weight, respectively) and varied thereafter to keep the T lymphocyte counts between 50 x 106/L and 150 x 106/L. The total amount of ATG given over seven days varied between 24.8 mg/kg and 30.2 mg/kg body weight. Five participants in the MTX + ATG group and four participants in the MTX group also took prednisone (10 mg to 30 mg every second day) during the trial. Participants received methylprednisolone (125 mg injection) before the first ATG infusion. Assessments were made 2 months before commencement of treatment and at 0, 2, 4, 6, 9, and 12 months of treatment. Mean between‐group muscle strength was reported to be nearly equal at baseline.
Combined immunosuppressive therapy: methotrexate and azathioprine versus methotrexate (plus leucovorin)
Leff 1993 was an open, randomised trial of 11 participants who were diagnosed as having definite myositis by the Bohan and Peters' criteria (Bohan 1975), together with light microscopic changes consistent with biopsy‐proven IBM.
The trial authors compared six months of intravenous MTX with a combination treatment of oral azathioprine and MTX (AZA + MTX). For the MTX regimen, the investigators infused 0.5 g/m2 intravenously over one hour every two weeks; participants on intravenous MTX also received oral doses of 50 mg/m2 leucovorin rescue. Oral doses of AZA and MTX began at 50 mg/day and 7.5 mg/week, respectively, and gradually increased to a maximum of 150 mg/day and 25 mg/week, respectively, over the course of the first 12 weeks unless adverse events occurred. In addition, both treatment groups received prednisone, which was tapered to a small, alternate‐day dose of 0.25 mg/kg after one month. Participants only crossed over regimens if worsening or stabilisation occurred after six months of drug therapy. If improvement occurred after the first six months, the participants continued prednisolone and discontinued the trial therapy; such participants were kept under observation, and only when worsening occurred did they begin the other therapeutic regimen. The trial authors defined change in clinical status by categorical changes in MMT and activities of daily living (ADL) between the start and end of treatment. The trial authors did not report whether participants' baseline characteristics were similar.
Oxandrolone versus placebo
One trial compared oxandrolone, an anabolic steroid (a synthetic androgen), with placebo (Rutkove 2002). This double‐blinded study randomised participants to 20 mg/day oxandrolone orally (10 mg twice daily) (n = 10) or placebo (n = 9) for 12 weeks. After a washout period of two to four months, the groups crossed over to the alternate intervention for another 12 weeks. All participants fulfilled the Griggs 1995 criteria for definite IBM. Assessments were performed at baseline, at the end of the first intervention period, at the end of the washout period, and at the end of the second 12‐week intervention period (with additional serologic evaluation at 6 weeks of each treatment). Only 13 of the 19 participants completed both periods of the study, although the changes reported on oxandrolone were based on the 15 participants who completed active treatment, and the changes reported on placebo were based on the 14 participants who completed a placebo period. Baseline median muscle strength (whole‐body maximal voluntary isometric contraction testing and MMT scores) were significantly higher in the group receiving placebo for the first study period (P = 0.03 and P = 0.008, respectively).
Arimoclomol versus placebo
Machado 2013 compared the safety and tolerability of arimoclomol with placebo in participants who fulfilled the diagnostic criteria for IBM according to Griggs 1995. This double‐blinded trial randomised one group to 100 mg three times daily and the other to placebo for four months, with an eight‐month blinded follow‐up phase. Available data were insufficient to determine the between‐group similarity in baseline characteristics.
Risk of bias in included studies
We have reported `Risk of bias' assessments for each included study in Characteristics of included studies. Figure 1 summarises review authors' assessments for each `Risk of bias' domain for all trials. The overall risk of bias in the included studies was unclear in 6 of the 10 trials. The review authors evaluated one trial of MTX as at low risk of bias (Badrising 2002). We judged three other trials to be at high risk of bias: two open studies of multi‐agent treatment, Leff 1993 and Lindberg 2003, and Dalakas 1997, due to incomplete outcome data, selective reporting, and breaking of randomisation by elective cross‐over.
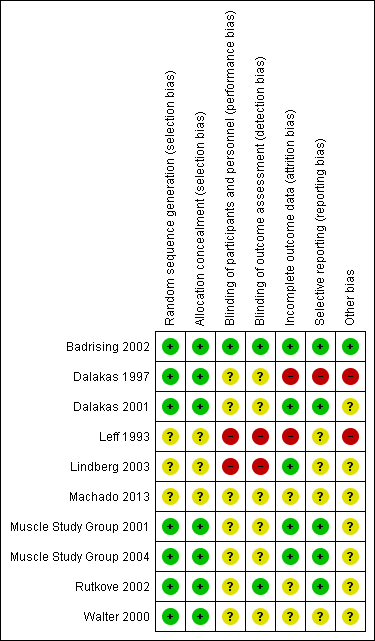
Risk of bias summary: review authors' judgements about each risk of bias item for each included study. Red (‐) = high risk of bias, yellow (?) = unclear risk of bias and green (+) = low risk of bias.
Insufficient information on blinding procedures was a common source of unclear risk of bias; this finding was particularly important because the primary outcome was a measure of muscle strength performance, likely to be influenced by a lack of blinding. Most studies also did not clearly demonstrate minimisation of the potentially confounding effects of previous or concurrent treatments.
Effects of interventions
See: Summary of findings for the main comparison Intravenous immunoglobulin versus placebo for inclusion body myositis; Summary of findings 2 Interferon beta‐1a compared to placebo for inclusion body myositis; Summary of findings 3 Methotrexate compared to placebo for inclusion body myositis; Summary of findings 4 Methotrexate and anti‐T lymphocyte immunoglobulin compared to methotrexate for inclusion body myositis; Summary of findings 5 Methotrexate and azathioprine compared to methotrexate (plus leucovorin) for inclusion body myositis; Summary of findings 6 Oxandrolone compared to placebo for inclusion body myositis
Intravenous immunoglobulin versus placebo
Three studies contributed data for this comparison (Dalakas 1997; Dalakas 2001; Walter 2000).
Percentage change from baseline in muscle strength at 6 months
In Dalakas 1997 (19 analysed participants), the investigators assessed muscle strength change after three months of the intervention (cross‐over study). The paper provided no statistical comparison between muscle strength in the IVIg and placebo groups at baseline. Since participants had the option to cross over, only the first period of the trial was randomised. We considered rescaling trial data (0 to 10 scale; maximum sum score = 200) to estimate the percentage change in muscle strength at six months despite an assumption of linear change. However, we were not able to perform secondary analysis because no standard deviation (SD) values were given. Primary data were not available for re‐analysis, and we could not accurately regenerate primary data from the graphs and tables. At three months, trial authors found a non‐significant gain in mean MRC points with IVIg and a non‐significant loss with placebo. The mean change in the IVIg group was 4.2 MRC points (range ‐16 to 39.8), whereas the mean change in the placebo group was ‐2.7 MRC points (range ‐10 to 8). Trial authors reported "the effect of IVIg did not differ significantly compared with placebo in overall muscle strength" using a per protocol analysis.
In Dalakas 2001 (36 analysed participants; 19 in treatment group), trialists assessed muscle strength change following three months of the intervention (parallel‐group study). We considered whether to rescale trial data (0 to 10 scale) to estimate the percentage change in muscle strength at six months. However, the maximum sum score was unclear, as the study authors described 12 muscle group actions but reported 13 muscle groups as assessed. Also, they reported muscle strength change from baseline separately for upper and lower extremities, despite the primary outcome measure being total‐body MRC sum scores. At three months, trial authors found no significant difference in mean muscle strength scores with IVIg compared with placebo. Trial authors concluded "the lack of improvement in strength, the primary endpoint of our study, was disappointing" based on a per protocol analysis. We intended to pool the data for upper and lower extremities, but primary data were unavailable for secondary analysis.
In Walter 2000 (20 analysed participants), the investigators assessed muscle strength change following six months of the intervention (cross‐over study). They reported comparable baseline muscle strength between IVIg and placebo groups based on MRC sum scores (P = 0.49). In the first period of the trial, there was a mean increase of 2.5 MRC points (0 to 6 scale; maximum sum score = 180) with IVIg from a baseline of 137.4 (± 28.3) to 139.9 (± 30.6); in the placebo group there was a mean increase of 4 MRC points from a baseline of 141.5 (± 33.8) to 145.5 (± 26.6) points. In the second period of intervention following cross‐over, there was a mean increase of 4.5 MRC points, from 145.5 (± 26.6) to 150 (± 25.3) with IVIg and 6.8 MRC points with placebo, from 139.9 (±30.6) to 146.7 (± 28.1). The trial publication did not clearly state whether the figures in parentheses are SD. Trial authors also provided the overall comparative data for IVIg‐placebo versus placebo‐IVIg groups, although this does not measure IVIg efficacy. Trial authors reported "there were no significant changes in MRC scales during IVIg treatment" based on a per protocol analysis of efficacy data. We intended to pool the data for percentage change in muscle strength with IVIg versus placebo, but primary data were unavailable for secondary analysis.
Percentage change from baseline in muscle strength at 12 months
No available data.
Percentage change from baseline in handgrip at 6 months
No available data.
Percentage change from baseline in muscle mass at 6 months
No available data.
Percentage change from baseline in timed walk at 6 months
No available data.
Significant adverse events from the intervention
In Dalakas 1997, two participants dropped out of the study before completing the first period, and a third completed the first period but refused to continue for reasons not stated. It is not clear if these dropouts were from the treatment or placebo group. In Dalakas 2001, there was one dropout from the placebo group due to death following a heart attack after the first infusion. In Walter 2000, the trial authors recorded two dropouts, but did not provide reasons for their discontinuation.
Dalakas 1997 and Dalakas 2001 did not report adverse events experienced by participants in sufficient detail for the review authors to analyse the data. In Dalakas 1997, trial authors reported that there were no serious side effects; some participants experienced a mild headache, but without specification of the intervention group. In Dalakas 2001, trial authors again noted no serious side effects in the IVIg‐randomised participants. Walter 2000 reported no serious adverse events during the trial, although two participants had headaches with raised body temperature (38°C), and two participants developed allergic exanthema of the skin.
Interferon beta‐1a versus placebo
Two studies contributed data for this comparison (Muscle Study Group 2001; Muscle Study Group 2004).
Percentage change from baseline in muscle strength at 6 months
In Muscle Study Group 2001 (29 analysed participants but 30 reported with an intention‐to‐treat (ITT) principle; 14 in treatment group), investigators assessed the muscle strength change following 24 weeks of the intervention (parallel‐group study). They tested a total of 34 muscle groups, and the text suggested a maximum MRC sum score of 170 (based on an MRC scale of 0 to 5). Trial authors generated a `composite' score, which is defined in relation to QMT strength scores as "the average number of SD units from predicted normal strength, given age, gender and height of the subject". The mean MMT changes of 0.03 (SD 0.16) increment with placebo and 0.06 (SD 0.15) decline with IFN beta‐1a appear to be consistent with a non‐significant change in mean number of SD units plus SD, rather than mean muscle strength scores plus SD. The results were in favour of placebo (MD ‐0.09, 95% CI ‐0.20 to 0.02) based on an ITT principle with no computation of missing data. However, the formulation of the composite MMT score was not clear. We intended to ascertain the percentage change in muscle strength for IFN beta‐1a versus placebo, but primary data were unavailable for secondary analysis.
In Muscle Study Group 2004 (28 analysed participants including carry‐forward of 1 participant's data and no computation of missing data from 2 participants; 15 in treatment group), the trialists assessed muscle strength change similarly following 24 weeks of the intervention (parallel‐group study). The dosage of IFN beta‐1a was double that used in the earlier trial, but study methodology was otherwise consistent. The mean MMT decreases of 0.08 (SD 0.21) with placebo and 0.08 (SD 0.22) with IFN beta‐1a again appeared to be consistent with a non‐significant change in mean number of SD units plus SD, although this was not clearly stated. The results were neither in favour of placebo nor IFN beta‐1a (MD 0.00, 95% CI ‐0.16 to 0.16).
As we were unable to ascertain percentage change in muscle strength, we decided to complete a pooled analysis of data from the two trials for change in normalised muscle strength sum scores. Overall, there was no significant benefit of IFN beta‐1a over placebo; the combined data (58 participants) produced an MD of ‐0.06 (95% CI ‐0.15 to 0.03) in favour of placebo, but non‐significant (Analysis 1.1; Figure 2). The result was not sensitive to the use of a fixed‐effect versus a random‐effects analysis.
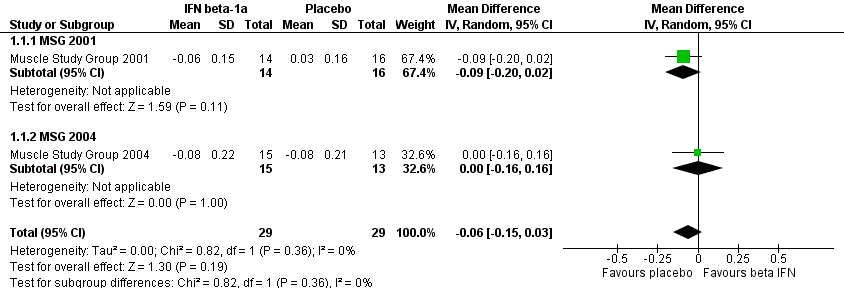
Forest plot of comparison: 1 Interferon beta‐1a versus placebo, outcome: 1.1 Normalised change in muscle strength over baseline at 6 months.
Percentage change from baseline in muscle strength at 12 months
No available data.
Percentage change from baseline in handgrip at 6 months
Data were unavailable for secondary analysis of handgrip strength; no baseline data were provided to estimate percentage change in handgrip strength based on the mean change in each participant. However, the mean change in grip strength scores was reported: ‐0.72 kg (SD 1.99) with IFN beta‐1a and ‐0.72 kg (SD 1.46) with placebo (MD ‐0.16 kg, 95% CI ‐1.55 to 1.22) for Muscle Study Group 2001. Muscle Study Group 2004 reported a change in grip strength of +0.23 kg (SD 1.66) with IFN beta‐1a and ‐1.45 kg (SD 1.44) with placebo (MD 1.84 kg, 95% CI 0.46 to 3.21) in favour of IFN beta‐1a. In the absence of normalised or percentage change data, we did not perform pooled analysis of the data from these two trials.
Percentage change from baseline in muscle mass at 6 months
Muscle Study Group 2001 and Muscle Study Group 2004 measured lean mass as a surrogate for muscle mass.
In Muscle Study Group 2001, there was an increase in lean mass of 0.1% with IFN beta‐1a and a decrease of 0.85% with placebo. The mean reported change was +0.04 kg (SD 1.10) from a baseline of 40.1 kg (SD 7.5) with IFN beta‐1a, and ‐0.34 kg (SD 1.96) from a baseline of 39.8 kg (SD 9.4) with placebo (MD 0.64 kg, 95% CI ‐0.71 to 1.99, with MD adjusted for investigator effects in an analysis‐of‐variance model). When calculated by percentage change, the MD was 0.95%, 95% CI ‐1.86 to 3.76.
In Muscle Study Group 2004, there was a decrease in lean mass with IFN beta‐1a (‐2.18%) and placebo (‐1.77%). There was a decrease of 0.94 kg (SD 1.32) from a baseline of 43.2 kg (SD 10.2) in the IFN beta‐1a group, and a decrease of 0.82 kg (SD 1.79) from a baseline of 46.3 kg (SD 9.9) in the placebo group (MD ‐0.10, 95% CI ‐1.40 to ‐1.19, with MD adjusted as previously). When calculated by percentage change, the MD was ‐0.41%, 95% CI ‐3.02 to 2.20.
Overall, the positive gain in lean mass was negligible in the first study relative to the large SD values and an undefined dual energy X‐ray absorptiometry precision error; there was no positive gain of lean mass in the second study. Subsequently, IFN beta‐1a did not appear to influence lean mass after six months of treatment, irrespective of the therapeutic dose. The combined percentage change data from these 2 trials (58 participants) produced an MD of 0.22% (95% CI ‐1.69 to 2.13) in favour of IFN beta‐1a; the CI includes the possibility of an effect favouring either IFN beta‐1a or placebo (Analysis 1.2; Figure 3). The result was not sensitive to the use of a fixed‐effect versus a random‐effects analysis.
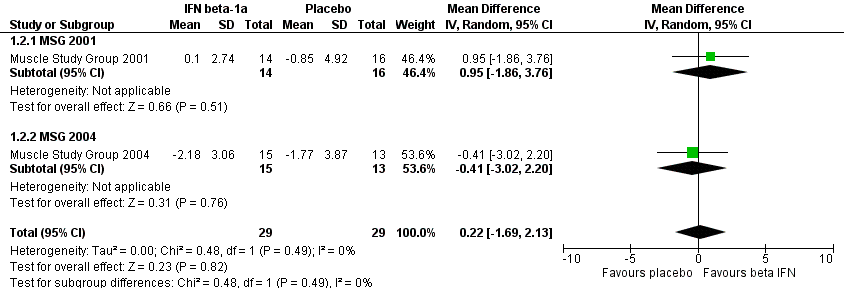
Forest plot of comparison: 1 Interferon beta‐1a versus placebo, outcome: 1.2 Percentage change over baseline in muscle mass at 6 months.
Percentage change from baseline in timed walk at 6 months
No available data.
Significant adverse events from the intervention
In Muscle Study Group 2001, 1 participant from the IFN beta‐1a group withdrew from the study owing to death post‐surgery for colon cancer; although 29 people completed the trial, the study authors based subsequent analysis on all 30 participants (16 placebo, 14 IFN beta‐1a), carrying forward the results of the deceased. In Muscle Study Group 2004, three participants dropped out of the trial, two from the IFN beta‐1a group and one from the placebo group. The analyses carried forward data from one of the dropouts in the IFN beta‐1a group to the endpoint of the study. The reason given for one participant dropping out of the IFN beta‐1a group was post‐injection flu‐like reaction; the reason for the other IFN beta‐1a group dropout is not clear from the report.
Adverse events reported with IFN beta‐1a included one death post‐intervention with cause unlikely to be related to medication, flu‐like symptoms, arthralgia/myalgias, skin rash, injection site reaction, diarrhoea, headache, depression, chills/fever, and abdominal pain or classified as other/unspecified. Trial authors reported numbers of participants experiencing each type of adverse event and mean numbers of adverse events per participant. Muscle Study Group 2001 recorded a mean of 2.65 (no SD provided) participant‐reported adverse events with IFN beta‐1a compared with 2.25 (no SD) in the placebo group. In Muscle Study Group 2004, the trial authors recorded a mean of 4.00 (SD 2.83) participant‐reported adverse events with IFN beta‐1a, compared with 2.36 (SD 1.98) with placebo. Only Muscle Study Group 2004 reported the proportion of participants experiencing any type of adverse event following intervention: 79% of participants reported adverse events with placebo, and 81% with IFN beta‐1a.
Methotrexate versus placebo
Percentage change from baseline in muscle strength at 6 months
One study contributed data for this comparison (Badrising 2002). No six‐month data were available, although ITT and per protocol analyses shown in graphs indicated declines in compound QMT at 22 weeks in both MTX and placebo groups.
Percentage change from baseline in muscle strength at 12 months
Badrising 2002 (44 analysed participants; 21 in the treatment group using ITT analysis) reported mean changes in muscle strength sum scores using percentages, thus we presented the results as reported by trial authors. For the primary outcome measure of the trial, mean QMT sum scores declined in both groups by 48 weeks (‐0.2% in MTX and ‐3.4% in placebo) (MD 3.2%, 95% CI ‐2.5% to 9.1%). By limiting analysis to only those participants who fully completed the study (per protocol analysis), the trial authors found 0.9% improvement with MTX compared to a decline of 2.7% with placebo (MD 3.6%, 95% CI ‐3.3% to 10.7% in favour of placebo).
Mean MMT sum scores also declined in MTX and placebo groups: ‐0.5% for MTX and ‐2.0% for placebo (MD 1.5%, 95% CI ‐1.0% to 3.9%). Using the per protocol analysis, MMT sum score changes were ‐2.2% for MTX and ‐3.8% for placebo (MD 1.6%, 95% CI ‐2.3% to 5.4%).
Percentage change from baseline in handgrip at 6 months
No available data.
Percentage change from baseline in muscle mass at 6 months
No available data.
Percentage change from baseline in timed walk at 6 months
No available data.
Significant adverse events from the intervention
Eight of the 21 participants in the MTX group dropped out, compared with 1 of 23 in the placebo group (risk ratio (RR) 8.76, 95% CI 1.19 to 64.28, Analysis 2.1). The significantly higher dropout rate reported with MTX was due to nausea (n = 3), hair loss (n = 2), arthralgia (n = 2), and progressive muscle weakness (n = 1). One participant on placebo treatment discontinued trial medication because of progressive muscle weakness. Both cases of dropout for progressive muscle weakness could have been the result of disease progression, but trial authors classified them as adverse events. Trial authors also reported that four participants in the MTX group and one participant in the placebo group required dose reductions, although it is not clear whether these were the same people who discontinued with the trial.
Combined immunosuppressive therapy: methotrexate and anti‐T lymphocyte immunoglobulin versus methotrexate
One study contributed data for this comparison (Lindberg 2003).
Percentage change from baseline in muscle strength at 6 months
No available data.
Percentage change from baseline in muscle strength at 12 months
At 12 months, the MTX + ATG group showed a change of 1.4% (SD 9.8%) in compound QMT compared with ‐11.1% (SD 7.2%) in the MTX group (P = 0.021). In the MTX + ATG group, mean strength increased from 90.3 N (SD 15.3) to 91.6 N (SD 18.2), as compared to the MTX group, in which there was a decrease from 78.4 N (SD 33.3) to 71.4 N (SD 34.5). The MD was 12.50% (95% CI 2.43 to 22.57) in favour of MTX (Analysis 3.1).
Percentage change from baseline in handgrip at 6 months
No available data. The review authors opted not to rescale trial data from 12 to 6 months due to the uncertainty of assuming a linear change between these time points.
Percentage change from baseline in muscle mass at 6 months
No available data.
Percentage change from baseline in timed walk at 6 months
No available data.
Significant adverse events from the intervention
Ten participants completed the trial, but the trial authors based the analysis on 11 participants by carrying forward the data taken from the last assessment of the 1 person who dropped out. The use of ATG in this trial was not complicated by any serum sickness or anaphylaxis. However, one participant in the MTX group developed severe pneumonia after 118 days of treatment and was withdrawn from the study.
Combined immunosuppressive therapy: methotrexate and azathioprine versus methotrexate (plus leucovorin)
One study contributed data for this comparison (Leff 1993). The trial authors measured change in muscle strength based on MMT but presented results categorically (improved, stabilised, or worse), which prevented any data extraction.
Percentage change from baseline in muscle strength at 6 months
No available data.
Percentage change from baseline in muscle strength at 12 months
No available data.
Percentage change from baseline in handgrip at 6 months
No available data.
Percentage change from baseline in muscle mass at 6 months
No available data.
Percentage change from baseline in timed walk at 6 months
No available data.
Significant adverse events from the intervention
Two of 11 participants discontinued combined AZA and MTX treatment due to side effects that were described as transient, reversible, and mainly gastrointestinal; these participants both underwent cholecystectomies for acute cholecystitis and were unable to resume drug treatment. A third participant did not cross over to MTX (plus leucovorin) due to pneumonitis. Another complication reported during the trial was a flareup of pre‐existing gout in one participant during MTX (plus leucovorin) treatment. Trial authors reported that most participants received the full six months of each regimen. Insufficient data were available to give actual numbers of participants from each group who experienced significant adverse events.
Oxandrolone versus placebo
One study contributed data for this comparison (Rutkove 2002). This was a cross‐over trial that reported the effects of 12 weeks' treatment with oxandrolone versus placebo. Overall changes were reported at the end of the trial for 15 participants who completed the oxandrolone phase and 14 participants who completed the placebo phase. The trial authors reported median values and interquartile ranges "because of concerns about the normality of the data". The trial authors expressed results as GEE (generalised estimating equation) estimates and standard errors, with the result that the available data were insufficient to calculate percentage change in outcome measures.
Percentage change from baseline in muscle strength at 6 months
Insufficient data.
Percentage change from baseline in muscle strength at 12 months
Insufficient data.
Percentage change from baseline in handgrip at 6 months
No available data.
Percentage change from baseline in muscle mass at 6 months
Insufficient data.
The analyses only excluded those participants who dropped out prior to completion of the first treatment period.
Arimoclomol versus placebo
One trial investigated the use of arimoclomol for treating IBM (Machado 2013). However, only the abstract was available at the time of this review. In the pilot study, 16 participants used arimoclomol (100 mg 3 times daily) and 8 participants received a placebo for 4 months. The abstract did not report numerical data suitable for inclusion in this review.
Discussion
Intravenous immunoglobulin versus placebo
We planned to perform a meta‐analysis of the IVIg trials using data reported for our primary outcome, muscle strength, albeit at different time points. However, none of the IVIg studies reported data in a form that could be combined at 3, 6, or 12 months. Dalakas 1997 presented change in MRC sum scores for participants at three months in graphical form; we did not feel confident to accurately convert the graphical data to numerical values for meta‐analysis. Additionally, we expected the need to extrapolate three‐month data to six months to amplify any existing inaccuracies. In order to perform our analysis, we would have needed to rescale the original three‐month trial data to six months, assuming a linear rate of change in strength over time. Dalakas 2001 provided summary data for upper and lower limbs, but calculation of a percentage change from these summary scores and extrapolation to six months would again be subject to large assumptions in terms of the effect size. The Walter 2000 cross‐over trial similarly did not provide data in a form suitable for meta‐analysis.
Walter 2000 included 2 groups of 11 participants of different mean ages (67 years and 51 years); in theory, the cross‐over design of the trial should negate any baseline differences seen between the two groups. However, we were unable to perform subgroup analysis with respect to age because of insufficient data. Subsequently, we cannot rule out the influence of faster disease progression in the older subgroup in relation to sarcopenia and enhanced mitochondrial dysfunction, as proposed previously (Dalakas 2001; Santorelli 1996). Exploring the relationship between inflammation, mitochondrial dysfunction, and muscle atrophy and determining the rate of IBM progression could be essential for understanding any clinically relevant change with treatment (Rygiel 2014); additionally, we may need to consider the sexual dimorphic effect of ageing in relation to muscle protein synthesis in IBM, as postulated in the study of older adults (Smith 2012). While an ageing effect on our reviewed outcomes cannot be confirmed, the small, non‐significant improvements in muscle strength with both IVIg and placebo may indicate a general learning effect in strength measurement as a proxy measure for disease progression; Neuromuscular Symptom and Disability Functional Score changes showed statistically significant improvement with IVIg only. We planned to perform subgroup meta‐analyses for factors such as age and carry‐over effect, but insufficient data were available.
In terms of the intervention, Dalakas 2001, unlike the other two trials, provided the IVIg and non‐IVIg groups with equal doses of prednisone. The supplementation with prednisone was provided on the basis that the combination of steroid with IVIg might have a synergistic effect in improving muscle strength, based on studies in dermatomyositis and Guillain‐Barré syndrome (Dalakas 1993; Dutch GBS 1994). However, unlike for IBM, for dermatomyositis and Guillain‐Barré syndrome, IVIg alone is known to be effective. For the purposes of meta‐analysis, we would have to assume that prednisone did not contribute any effect for either the IVIg or non‐IVIg treatment group.
In terms of study design, the three trials used two different MRC scales, and they did not assess the same muscle groups or muscle group actions. Dalakas 1997 involved elective cross‐over in the second phase of the trial, such that we could consider only the first phase of intervention for meta‐analysis (Elbourne 2002). The inconsistency in methodology between trials is particularly important because IBM affects different muscles to a variable extent. As a result of the variable muscle involvement in IBM, IVIg might be beneficial for some muscles more than others at any given time point in the disease.
When summarising our findings, we assessed the quality of evidence for the effects of IVIg on muscle strength at six months as very low due to selective reporting and other issues of trial design (high risk of bias in one of the trials and an unclear overall risk of bias in the other two trials).
In conclusion, while marginal increments in muscle strength were identified in two of three trials of IVIg (Dalakas 1997; Walter 2000), we could not determine an overall effect of IVIg versus placebo due to inconsistencies in trial methodology and reporting (see summary of findings Table for the main comparison).
None of the IVIg trials included a statistical analysis of the incidence of significant adverse events with intervention to facilitate full evaluation of treatment effect. According to Meyler's Side Effects of Drugs (Chalker 2000; Dukes 2000), current Ig preparations cause about 3% to 4% of people to experience adverse reactions. Other adverse events associated with IVIg include mild influenza‐like illness, sweating, hypotension, chills, fever, nausea, and vasomotor reactions. More serious adverse effects include anaphylactic reactions; however, these are very rare and may occur in as few as 1 in 6000 people (Aronson 2006). Stroke and myocardial infarction have been reported after high‐dose IVIg, as a result of increased plasma viscosity. At high doses, neutropenia and disseminated intravascular coagulation have also been reported, and very rarely, acute renal failure (Aronson 2006). Walter 2000 reported some participants developing headache or raised body temperature, and two participants developed an allergic reaction.
Interferon beta‐1a versus placebo
Neither of the IFN beta‐1a studies showed a significantly greater benefit with IFN beta‐1a over placebo. We were able to perform a meta‐analysis of parallel‐group trials comparing different doses of IFN beta‐1a with placebo. The standardised trial procedures and reporting across both trials made pooling of data from Muscle Study Group 2001 and Muscle Study Group 2004 possible. The pooled analysis for normalised muscle strength change from baseline produced a MD in compound MMT in favour of placebo (moderate‐quality evidence), but with CIs including the possibility of an effect in either direction (Analysis 1.1; Figure 2; summary of findings Table 2). The forest plot for lean mass, as surrogate for muscle mass (Figure 3), also did not show an effect in favour of IFN beta‐1a (moderate‐quality evidence).
Despite some reported improvement in grip strength with IFN beta‐1a treatment, we could not assess the quality of this evidence because the available data were incomplete.
Neither of the IFN beta‐1a trials included a statistical analysis of the incidence of significant adverse events to facilitate full evaluation of the treatment effect. Among the participants who took 30 µg doses of IFN beta‐1a, 84% reported adverse events (Muscle Study Group 2001); this figure was approximately 81% in participants who took 60 µg doses of IFN beta‐1a (Muscle Study Group 2004). Flu‐like reactions following injection were the most commonly specified complaint with high‐dose treatment, while diarrhoea was the most commonly specified adverse event with low‐dose treatment (Muscle Study Group 2001; Muscle Study Group 2004). Rarer adverse events associated with IFN beta‐1a can include mood and personality changes, suicide attempts, hepatitis, and thyroid dysfunction (Aronson 2006). Such an adverse event profile and the large percentage of users experiencing more minor adverse events may give rise to problems with compliance over a longer period. However, despite the high frequency of adverse events seen in these two trials, none was assessed as significant enough to require dose reduction (Muscle Study Group 2001; Muscle Study Group 2004).
Methotrexate versus placebo
A single RCT provided moderate‐quality evidence of no significant effect of MTX on muscle strength at 12 months; the trial was insufficiently powered to exclude a possible benefit from MTX (see summary of findings Table 3). Approximately 38% of participants who were on MTX reported adverse events (Analysis 2.1), and there was a statistically significant dropout rate in the MTX treatment group (moderate‐quality evidence). A larger or longer trial of MTX could be problematic in terms of compliance (Badrising 2002). The most common adverse events caused by MTX are nausea, vomiting, alopecia, oral mucositis, or effects of myelosuppression (Aronson 2006). While there are pharmacological agents to reduce or alleviate common adverse events, polypharmacy may also affect compliance.
Combination therapy in the treatment of IBM
The benefit of combination therapy with MTX and ATG, Lindberg 2003, or MTX and AZA, Leff 1993, remains unclear in the treatment of IBM. Combined MTX and ATG appeared to show some benefit, but the evidence, based on a small, open‐label trial, is very low quality and should be interpreted with caution (see summary of findings Table 4) (Lindberg 2003). Aside from risk of bias issues, any positive effect of ATG combined with MTX versus MTX alone could either be due to the effects of ATG alone or to its effects when combined with MTX. Adverse effects known to be associated with ATG include "leukopenia and thrombocytopenia, fever, arthralgia, rash, urticaria, hepatotoxicity, hyperglycaemia, hypertension, and diarrhoea" (Aronson 2006). Serum sickness can also occur later. However, none of these potential adverse effects was reported in the trial; only a single case of pneumonia was reported.
In the only trial that looked at AZA and MTX in combination (Leff 1993), we could obtain no quantitative data (see summary of findings Table 5). Similar to Lindberg 2003, this trial was open label and had a small number of participants (very low‐quality evidence). As a combination therapy, there was a risk of exposure to the effects of both drugs in the combination. Adverse events on the regimen that included AZA were gastrointestinal symptoms, acute cholecystitis, and a case of pneumonitis. In the MTX alone group, the authors reported only a flareup of pre‐existing gout; other adverse events known to occur with AZA alone include fever, nausea, leukopenia, thrombocytopenia, and anaemia (Aronson 2006). Neither Lindberg 2003 nor Leff 1993 provided a statistical analysis of the incidence of significant adverse events with the intervention to facilitate a full evaluation of the treatment effect.
Oxandrolone versus placebo
In comparing oxandrolone with placebo, the trial authors highlighted that small numbers of participants and a relatively short trial duration restricted the interpretation of results (Rutkove 2002). The trial authors also considered that between‐group differences in baseline characteristics may have had some confounding effects. The trial authors reported a close‐to‐significant treatment effect for improving whole body strength with oxandrolone at 12 weeks. However, we noted that the methods of analysis (generalised estimating equation) were unusual for this trial design, and the power of the test for carry‐over effects was low. Taking into account these and the other study limitations, results should be interpreted with caution (very low‐quality evidence).
In terms of adverse events, anabolic steroids have some androgenic activity that can give rise to acne and other signs of virilisation and may affect lipoprotein profiles. As the associated androgenic activity is weak, these adverse events are not common. However, gynaecomastia has occurred with the long‐term use of anabolic steroids as a growth promoter in boys (Aronson 2006). Withdrawal of high doses of anabolic steroids can give rise to menopause‐like symptoms (Chalker 2000; Dukes 2000). Rutkove 2002 reported no significant adverse events, which was perhaps related to the low doses used over a relative short period of time but, as with all other analysed trials, the investigators included no definition of what constituted an adverse event in order to evaluate treatment effect. If anabolic steroids are associated with few or no significant adverse events in practice, possible therapeutic potential might justify further trials to explore their use in treating IBM. Conversely, more adverse events and issues with compliance may be anticipated in a longer trial of anabolic steroids.
Arimoclomol versus placebo
At the time of review, we did not attempt to evaluate the effects of arimoclomol for treating IBM because the relevant data were not available for systematic review. The trial was only available in abstract (Machado 2013), and it was powered to assess safety and tolerability, not treatment effect.
The lessons from these trials
This systematic review of treatment for IBM identified nine analysable RCTs and one RCT published in an abstract only. In terms of determining a treatment effect, only 2 of the included trials reported power calculations, and we evaluated all 10 trials as underpowered to detect a statistically significant effect. One trial that included power calculations was primarily a safety and tolerability study, rather than an efficacy study (Muscle Study Group 2001). The other trial indicated multiple reasons for the lower‐than‐expected power for their study, including rate of decline in the placebo group; variability in QMT strength measures; and a higher‐than‐expected participant dropout rate (Badrising 2002). The largest included RCT had only 22 participants in the treatment group (Walter 2000). The largest analysed treatment group included only 21 participants, using an intention‐to‐treat analysis (Badrising 2002), and 20 participants with a per protocol analysis of the primary outcome measure (Walter 2000). Rose 2001 calculated that each group of a placebo‐controlled trial needed 94 participantsto have 90% power to detect a 4% difference in mean change in muscle strength between two groups over a 6‐month period. This 4% larger difference over placebo was determined to be equivalent to arresting disease progression with the drug on trial. Based on trial experience, Muscle Study Group 2004 calculated that a 2‐arm, 6‐month intervention would require 208 participants per group to detect the arrest of disease progression using QMT with 90% power, a 2‐tailed t‐test, and significance level of 5%.
Multicentre recruitment, pooling of trial results, or both, might allow for the accumulation of sufficient data for a more robust answer as to the efficacy of treatment for IBM. However, we still expect differences in both methodologies and the type of intervention to affect treatment effect estimates and the validity of results. Across the studies included in this review, meta‐analysis was compromised by the fact that outcome measurement was not standardised to measure the cardinal effects of interest, namely muscle weakness, atrophy, and functional impairment. Additionally, some studies used normalised MDs for assessing change in muscle strength.
For muscle strength testing, it would be helpful to standardise appropriate test methodology (for example, manual or quantitative measurements (or both), specification and number of muscles or muscle actions tested, and the detection of a minimal clinically important difference) for use in research trials. The potential for harm resulting from treatment also needs to be carefully considered; none of the included studies defined what constituted an adverse effect, although drug treatments were associated with adverse effects of variable severity. Most of the studies also did not specify the methods used to monitor adverse effects. Analysis of treatment effect can risk bias towards a focus on favourable outcome measures in the absence of sufficient information on conduct and reporting of adverse events (Loke 2007).
None of the completed trials made reference to responsiveness or a minimal clinically important difference for any outcome measure in relation to disease progression. The validation of trial outcome measures, where reported, was also not performed specifically in an IBM population.
In terms of comparing future clinical trials in IBM, it will be important to minimise the differences in inclusion and exclusion criteria applied; this review found that trials used a range of criteria regarding comorbidity and concomitant treatment that could have a fundamental impact on study outcomes. Some have argued that insistence on pathological criteria for the inclusion of IBM in clinical trials may result in such trials attempting to treat participants who have more advanced, and therefore inherently less treatable, disease. Currently proposed diagnostic criteria reduce the emphasis on pathological criteria with the aim of allowing recruitment of participants earlier in the course of their disease. However, this strategy is subject to verification, and currently there are no trials that apply these newer criteria for IBM.
Costs
UK costs for treatment with the interventions used in the included studies would be:
-
Interferon beta‐1a (Avonex): injection, 60 μg (12 million units)/mL, net price 0.5 mL (30 μg, 6 million‐unit) prefilled syringe = GBP 163.50 (BNF 2014).
-
Methotrexate: tablets, 2.5 mg, net price 24‐tablet pack = GBP 2.22; 10 mg, net price 100‐tablet pack = GBP 37.06 (BNF 2014).
-
Azathioprine: tablets, 50 mg, 56‐tablet pack = GBP 3.42 (BNF 2014).
-
Intravenous immunoglobulin: based on 2 g/kg in 70 kg man = GBP 3906 to 4900 (DH 2011).
-
Oxandrolone: a price from 2000 of USD 4 per 2.5 mg tablet (Beaston‐Blaakman 2007). In the UK, injection, nandrolone decanoate 50 mg/L, net price 1 mL ampoule = GBP 3.17 by deep intramuscular injection, 50 mg every 3 weeks (BNF 2014).
Intervention treatment costs per person over a six‐month period were estimated to be greatest for IVIg (approximately GBP 15,000) followed by IFN beta‐1a therapy, and with markedly lower costs for oxandrolone by intramuscular injection, AZA, and MTX treatment.
Potential biases in the review process
We chose to express the primary outcome as the percentage change in compound MMT over time because it is a widely used approach to muscle strength assessment in clinical research. However, percentage change calculation was rarely feasible using the available data, and two trials reported normalised data instead. Our percentage figures related to group‐level changes, but these are likely to be different from those calculated using absolute data from individuals. We expected the data to be subject to uncertainty in relation to clinical and statistical heterogeneity and significance. Using absolute changes would be preferable, but these were not retrievable across all trials in the review. Also, to calculate mean change in absolute MMT scores might have required that only those muscles tested by all studies and scaled to the same MRC grading were included in analysis.
Another potential bias in the review process was in the type of selected outcome measures. Our selected functional impairment outcome measures were restricted to specific single‐item tasks, while inflammatory and pathological biomarkers were not analysed at all. Nevertheless, our data extraction did suggest that included trials inconsistently assessed or reported those additional functional, inflammatory, and pathological outcomes.
Some of the review authors were investigators in included trials. A non‐conflicted review author performed independent data extraction if any review author had potential conflicts of interest, for example through involvement in an included study.
A further limitation of the review was that the review methods were unlikely to adequately detect serious, rare adverse events. We therefore discussed adverse events described in other sources in the Discussion.
Agreements and disagreements with other studies or reviews
The results of this systematic review confirmed previous observational study and review findings that there are no established, evidence‐based treatments for IBM as yet (Benveniste 2011; Breithaupt 2013; Machado 2013b). The small sample sizes and short duration of clinical trials are recognised as major limitations in the evaluation of treatment efficacy in this muscle condition (Breithaupt 2013; Fergusson 2005). In terms of assessment, MMT scores of muscle strength are widely used in research and clinical practice, but further development of sensitive outcome measures is advocated (Breithaupt 2013; Machado 2013). Studies included in this review used different methodological and analytical approaches to assess muscle strength and applied a range of secondary outcome measures. Such variations in methods and outcome measures hindered the pooling of trial data to contribute to the evidence base. As part of a systematic review in neurological conditions, Fergusson 2005 analysed the same three IVIg trials for IBM as in our review; like us, they were unable to come to a conclusion about the efficacy of IVIg from the available data. Fergusson 2005 similarly elected not to perform pooled analysis due to between‐trial differences in methodology. Interestingly, the benefit of IVIg in chronic inflammatory demyelinating polyneuropathy (CIDP) was identified using a disability scale, as was the benefit Walter 2000 showed for IVIg in IBM, using the Neuromuscular Symptom and Disability Functional Score. Such evidence perhaps argues for the use of disability scales in future IBM trials. However, Fergusson 2005 also emphasised that evidence of benefit still does not necessarily support IVIg as a first‐line treatment owing to other factors, including adverse events and cost.
Evidence of mitochondrial abnormalities in IBM that are in excess of those seen with normal ageing may suggest another range of therapeutic options, but there are currently no known effective treatments for primary mitochondrial disease (Pfeffer 2012). Similarly, currently there are no drugs with the therapeutic potential to arrest or slow down the degenerative pathology seen in IBM (Breithaupt 2013). A common issue highlighted across Cochrane intervention reviews in muscle disease is the quality of study design and paucity of RCTs, emphasising ongoing problems with sample size and risk of bias (Hill 2004; Pfeffer 2012; Voet 2013). The validity of the evidence base also appears to be limited by a lack of standardisation in the collection, evaluation, and reporting of data. This systematic review identified specific quality issues in clinical trials of people with IBM, which should encourage investigators to validate outcome measures and ensure standardisation of trial procedures.
Only one of the studies included in this review measured swallowing function, which we did not include as a predefined outcome measure. In the future a Cochrane review of treatment for swallowing difficulties in chronic muscle disease will include IBM (Hill 2004). In terms of ongoing drug trials for IBM, we identified an RCT of bimagrumab (BYM338), which has been developed to target molecular pathways involved in muscle growth, and which we may include in a future review. An RCT of simvastatin is also pending completion.

Risk of bias summary: review authors' judgements about each risk of bias item for each included study. Red (‐) = high risk of bias, yellow (?) = unclear risk of bias and green (+) = low risk of bias.

Forest plot of comparison: 1 Interferon beta‐1a versus placebo, outcome: 1.1 Normalised change in muscle strength over baseline at 6 months.

Forest plot of comparison: 1 Interferon beta‐1a versus placebo, outcome: 1.2 Percentage change over baseline in muscle mass at 6 months.

Comparison 1 Interferon beta‐1a versus placebo, Outcome 1 Normalised change in muscle strength over baseline at 6 months.

Comparison 1 Interferon beta‐1a versus placebo, Outcome 2 Percentage change over baseline in muscle mass at 6 months.
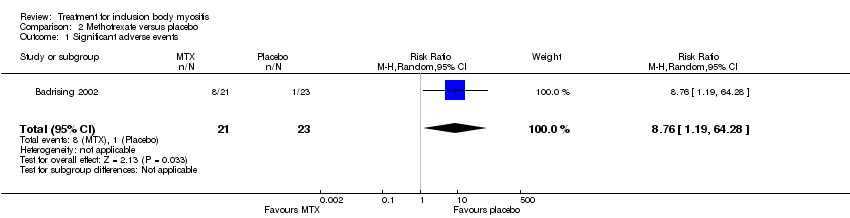
Comparison 2 Methotrexate versus placebo, Outcome 1 Significant adverse events.

Comparison 3 Anti‐T lymphocyte + methotrexate versus methotrexate, Outcome 1 Percentage change from baseline (QMT) at 12 months.
| Intravenous immunoglobulin versus placebo for inclusion body myositis | ||||||
| Patient or population: people with inclusion body myositis | ||||||
| Outcomes | Illustrative comparative risks* (95% CI) | Relative effect | No of participants | Quality of the evidence | Comments | |
| Assumed risk | Corresponding risk | |||||
| Placebo | Intravenous immunoglobulin | |||||
| Change in muscle strength at 6 months (%) | Not estimable | Not estimable | Not estimable | 78 | See comment | 2 of the 3 studies assessed change in muscle strength at 3 months and the other at 6 months. Data were not suitable for meta‐analysis. |
| Change in muscle strength at 12 months (%) ‐ not measured | ‐ | ‐ | ‐ | ‐ | ‐ | ‐ |
| Change in muscle mass at 6 months (%) ‐ not measured | ‐ | ‐ | ‐ | ‐ | ‐ | ‐ |
| Change in handgrip strength at 6 months (%) ‐ not measured | ‐ | ‐ | ‐ | ‐ | ‐ | ‐ |
| Change in timed walk at 6 months (%) e.g. 10‐metre or 6‐minute walk test at 6 months ‐ not measured | ‐ | ‐ | ‐ | ‐ | ‐ | ‐ |
| Significant adverse events | Not estimable | Not estimable | Not estimable | 78 (3 studies) | See comment | Dalakas 1997: unclear whether dropouts from treatment or placebo group. Dalakas 2001: treatment group withdrawals = 0; placebo group withdrawals = 1. Walter 2000: 2 withdrawals but unspecified whether from treatment or placebo group |
| *The basis for the assumed risk (e.g. the median control group risk across studies) is provided in footnotes. The corresponding risk (and its 95% confidence interval) is based on the assumed risk in the comparison group and the relative effect of the intervention (and its 95% CI). | ||||||
| GRADE Working Group grades of evidence | ||||||
| Interferon beta‐1a (IFN beta‐1a) compared to placebo for inclusion body myositis | ||||||
| Patient or population: people with inclusion body myositis | ||||||
| Outcomes | Illustrative comparative risks* (95% CI) | Relative effect | No of participants | Quality of the evidence | Comments | |
| Assumed risk | Corresponding risk | |||||
| Placebo | IFN beta‐1a | |||||
| Change in muscle strength at 6 months (normalised MMT score ‐ see Characteristics of Studies table) | The mean changes in normalised muscle strength in the control groups was | The mean change in normalised muscle strength in the intervention groups was | ‐ | 58 | ⊕⊕⊕⊝ | |
| Change in muscle strength at 12 months (%) ‐ not measured | ‐ | ‐ | ‐ | ‐ | ‐ | ‐ |
| Change in muscle mass at 6 months (%) | The mean change in muscle mass (%) in the control groups was ‐0.85 and ‐1.77. | The mean change in muscle mass (%) in the intervention groups was | ‐ | 58 | ⊕⊕⊕⊝ | |
| Change in handgrip strength at 6 months (%) | Not estimable | Not estimable | Not estimable | 58 (2 studies) | See comment | Baseline measurements were not reported, so % change was not calculable. There was a non‐significant difference in handgrip strength (kg) between IFN beta‐1a and placebo in 1 trial (MD ‐0.16, 95% CI ‐1.55 to 1.22). In the other the MD was 1.84 kg with a 95% CI of 0.46 to 3.21 in favour of IFN beta‐1a |
| Change in timed walk at 6 months (%) e.g. 10‐metre or 6‐minute walk test at 6 months ‐ not measured | ‐ | ‐ | ‐ | ‐ | ‐ | ‐ |
| Significant adverse events | Not estimable | Not estimable | Not estimable | 58 (2 studies) | See comment | Muscle Study Group 2001: treatment group withdrawals = 1; placebo group withdrawals = 0. Muscle Study Group 2004: treatment group withdrawals = 2; placebo group withdrawals = 1 |
| *The basis for the assumed risk (e.g. the median control group risk across studies) is provided in footnotes. The corresponding risk (and its 95% confidence interval) is based on the assumed risk in the comparison group and the relative effect of the intervention (and its 95% CI). | ||||||
| GRADE Working Group grades of evidence | ||||||
| 1 The CI includes the possibility of an effect favouring either IFN beta‐1a or placebo when data from the two trials are combined. | ||||||
| Methotrexate compared to placebo for inclusion body myositis | ||||||
| Patient or population: people with inclusion body myositis | ||||||
| Outcomes | Illustrative comparative risks* (95% CI) | Relative effect | No of Participants | Quality of the evidence | Comments | |
| Assumed risk | Corresponding risk | |||||
| Placebo | Methotrexate | |||||
| Change in muscle strength at 6 months (%) | Not estimable | Not estimable | Not estimable | 44 (1 study) | See comment | Data collected at 12 months only |
| Change in muscle strength at 12 months (%) ‐ MMT | The mean change in muscle strength (%) in the control group was ‐2.0% | The mean change in muscle strength (%) in the intervention group was 1.5% higher (1.0 lower to 3.9 higher) | ‐ | 44 (1 study) | ⊕⊕⊝⊝ | MD in mean change based on intention‐to‐treat data. Per protocol: MD 1.6%, 95% CI ‐2.3 to 5.4. This study was assessed as having a low overall risk of bias. |
| Change in muscle mass at 6 months (%) ‐ not measured | ‐ | ‐ | ‐ | ‐ | ‐ | ‐ |
| Change in handgrip strength at 6 months (%) ‐ not measured | ‐ | ‐ | ‐ | ‐ | ‐ | ‐ |
| Change in timed walk at 6 months (%) e.g. 10‐metre or 6‐minute walk test at 6 months ‐ not measured | ‐ | ‐ | ‐ | ‐ | ‐ | ‐ |
| Significant adverse events | 43 per 1000 | 381 per 1000 (52 to 1000) | RR 8.76 (1.19 to 64.28) | 44 (1 study) | ⊕⊕⊝⊝ moderate2 | Badrising 2002: treatment group withdrawals = 8/21; placebo group withdrawals = 1/23 |
| *The basis for the assumed risk (e.g. the median control group risk across studies) is provided in footnotes. The corresponding risk (and its 95% confidence interval) is based on the assumed risk in the comparison group and the relative effect of the intervention (and its 95% CI). | ||||||
| GRADE Working Group grades of evidence | ||||||
| 1 Downgraded for imprecision. The single randomised controlled trial of methotrexate was insufficiently powered to exclude a possible benefit from methotrexate. 2 Downgraded for imprecision. | ||||||
| Methotrexate (MTX) and anti‐T lymphocyte immunoglobulin (ATG) compared to MTX for inclusion body myositis | ||||||
| Patient or population: people with inclusion body myositis | ||||||
| Outcomes | Illustrative comparative risks* (95% CI) | Relative effect | No of participants | Quality of the evidence | Comments | |
| Assumed risk | Corresponding risk | |||||
| MTX | MTX and ATG | |||||
| Change in muscle strength at 6 months (%) | Not estimable | Not estimable | Not estimable | 11 | See comment | Data collected at 12 months only |
| Change in muscle strength at 12 months (%) ‐ QMT | The mean change in muscle strength (%) in the control group was ‐11.1% | The mean change in muscle strength (%) in the intervention groups was 12.50 higher (2.43 to 22.57 higher) | Not estimable | 11 | ⊕⊝⊝⊝ | |
| Change in muscle mass at 12 months (%) ‐ not measured | ‐ | ‐ | ‐ | ‐ | ‐ | ‐ |
| Change in handgrip strength at 6 months (%) | Not estimable | Not estimable | Not estimable | 11 | See comment | Data collected at 12 months only; rescaling of data not performed due to uncertainty in the assumption of linear change |
| Change in timed walk at 6 months (%) e.g. 10‐metre or 6‐minute walk test at 6 months ‐ not measured | ‐ | ‐ | ‐ | ‐ | ‐ | ‐ |
| Significant adverse events | Not estimable | Not estimable | Not estimable | 11 | See comment | Lindberg 2003: combined ATG and MTX group withdrawals = 0; MTX group withdrawals = 1 |
| *The basis for the assumed risk (e.g. the median control group risk across studies) is provided in footnotes. The corresponding risk (and its 95% confidence interval) is based on the assumed risk in the comparison group and the relative effect of the intervention (and its 95% CI). | ||||||
| GRADE Working Group grades of evidence | ||||||
| 1 Downgraded for study design: as an open‐label study, there is a high risk of bias. | ||||||
| Methotrexate (MTX) and azathioprine (AZA) compared to MTX (plus leucovorin) for inclusion body myositis | ||||||
| Patient or population: people with inclusion body myositis | ||||||
| Outcomes | Illustrative comparative risks* (95% CI) | Relative effect | No of Participants | Quality of the evidence | Comments | |
| Assumed risk | Corresponding risk | |||||
| Methotrexate | Methotrexate and azathioprine | |||||
| Change in muscle strength at 6 months (%) | Not estimable | Not estimable | Not estimable | 11 | See comment | Categorical change in MMT only reported. This study was graded as having a high risk of bias. |
| Change in muscle strength at 12 months (%) (using MMT or QMT) at 12 months ‐ not measured | ‐ | ‐ | ‐ | ‐ | ‐ | ‐ |
| Change in muscle mass at 6 months (%) ‐ not measured | ‐ | ‐ | ‐ | ‐ | ‐ | ‐ |
| Change in handgrip strength at 6 months (%) ‐ not measured | ‐ | ‐ | ‐ | ‐ | ‐ | ‐ |
| Change in timed walk at 6 months (%) e.g. 10‐metre or 6‐minute walk test at 6 months ‐ not measured | ‐ | ‐ | ‐ | ‐ | ‐ | ‐ |
| Significant adverse events | Not estimable | Not estimable | Not estimable | 11 | See comment | Leff 1993: Combined AZA and MTX = 3 withdrawals; MTX (plus leucovorin) = 0 withdrawals |
| *The basis for the assumed risk (e.g. the median control group risk across studies) is provided in footnotes. The corresponding risk (and its 95% confidence interval) is based on the assumed risk in the comparison group and the relative effect of the intervention (and its 95% CI). | ||||||
| GRADE Working Group grades of evidence | ||||||
| Oxandrolone compared to placebo for inclusion body myositis | ||||||
| Patient or population: people with inclusion body myositis | ||||||
| Outcomes | Illustrative comparative risks* (95% CI) | Relative effect | No of participants | Quality of the evidence | Comments | |
| Assumed risk | Corresponding risk | |||||
| Placebo | Oxandrolone | |||||
| Change in muscle strength at 6 months (%) | Not estimable | Not estimable | Not estimable | 16 (1 study) | See comment | Data collected at 12 months only; re‐scaling of data not performed due to uncertainty in the assumption of linear change. There were also insufficient data to calculate percentage change in muscle strength. This study was graded as having an unclear risk of bias |
| Change in muscle strength at 12 months (%) ‐ not measured | ‐ | ‐ | ‐ | ‐ | ‐ | ‐ |
| Change in muscle mass at 6 months (%) | Not estimable | Not estimable | Not estimable | 16 (1 study) | See comment | Data collected at 12 months only; rescaling of data not performed due to uncertainty in the assumption of linear change. |
| Change in handgrip strength at 6 months (%) ‐ not measured | ‐ | ‐ | ‐ | ‐ | ‐ | ‐ |
| Change in timed walk at 6 months (%) e.g. 10‐metre or 6‐minute walk test at 6 months ‐ not measured | ‐ | ‐ | ‐ | ‐ | ‐ | ‐ |
| Significant adverse events | Not estimable | Not estimable | Not estimable | Not estimable | See comment | Rutkove 2002: treatment group withdrawals = 1; placebo group withdrawals = 2 |
| *The basis for the assumed risk (e.g. the median control group risk across studies) is provided in footnotes. The corresponding risk (and its 95% confidence interval) is based on the assumed risk in the comparison group and the relative effect of the intervention (and its 95% CI). | ||||||
| GRADE Working Group grades of evidence | ||||||
| Outcome or subgroup title | No. of studies | No. of participants | Statistical method | Effect size |
| 1 Normalised change in muscle strength over baseline at 6 months Show forest plot | 2 | 58 | Mean Difference (IV, Random, 95% CI) | ‐0.06 [‐0.15, 0.03] |
| 1.1 MSG 2001 | 1 | 30 | Mean Difference (IV, Random, 95% CI) | ‐0.09 [‐0.20, 0.02] |
| 1.2 MSG 2004 | 1 | 28 | Mean Difference (IV, Random, 95% CI) | 0.0 [‐0.16, 0.16] |
| 2 Percentage change over baseline in muscle mass at 6 months Show forest plot | 2 | 58 | Mean Difference (IV, Random, 95% CI) | 0.22 [‐1.69, 2.13] |
| 2.1 MSG 2001 | 1 | 30 | Mean Difference (IV, Random, 95% CI) | 0.95 [‐1.86, 3.76] |
| 2.2 MSG 2004 | 1 | 28 | Mean Difference (IV, Random, 95% CI) | ‐0.41 [‐3.02, 2.20] |
| Outcome or subgroup title | No. of studies | No. of participants | Statistical method | Effect size |
| 1 Significant adverse events Show forest plot | 1 | 44 | Risk Ratio (M‐H, Random, 95% CI) | 8.76 [1.19, 64.28] |
| Outcome or subgroup title | No. of studies | No. of participants | Statistical method | Effect size |
| 1 Percentage change from baseline (QMT) at 12 months Show forest plot | 1 | 11 | Mean Difference (IV, Fixed, 95% CI) | 12.5 [2.43, 22.57] |