Intrauterine insemination versus fallopian tube sperm perfusion for non‐tubal infertility
Abstract
Background
Intrauterine insemination (IUI) is a common treatment for couples with subfertility that does not involve the fallopian tubes. It is used to bring the sperm close to the released oocyte. Another method of introducing sperm is fallopian tube sperm perfusion (FSP). Fallopian tube sperm perfusion ensures the presence of higher sperm densities in the fallopian tubes at the time of ovulation than does standard IUI. These treatments are often used in combination with ovarian hyperstimulation.
Objectives
To compare intrauterine insemination versus fallopian tube sperm perfusion in the treatment of non‐tubal subfertility, for live birth and pregnancy outcomes.
Search methods
We searched the Menstrual Disorders and Subfertility Group Trials Register, MEDLINE, CINAHL and EMBASE from inception to September 2013. We also searched study reference lists and trial registers.
Selection criteria
Randomised controlled trials (RCTs) comparing IUI with FSP in couples with non‐tubal subfertility were included.
Data collection and analysis
Two review authors independently selected studies for inclusion, assessed study quality and extracted the data. If studies were sufficiently similar, data were combined using a fixed‐effect model to calculate pooled odds ratios (ORs) and 95% confidence intervals (CIs). A random‐effects model was used if substantial statistical heterogeneity was detected. Studies that included participants with unexplained or mixed (non‐tubal) subfertility were analysed separately from studies restricted to participants with mild or moderate male factor subfertility. The overall quality of evidence for the main outcomes was summarised using Grading of Recommendations Assessment, Development and Evaluation (GRADE) criteria.
Main results
The review included 16 RCTs. Fourteen RCTs (1745 women) were included in the meta‐analysis. Only three studies reported live birth per couple. No evidence of a statistically significant difference was noted between IUI and FSP in live birth (OR 0.94, 95% CI 0.59 to 1.49, three RCTs, 633 women, I2 = 0%, low‐quality evidence) or clinical pregnancy (OR 0.75, 95% CI 0.49 to 1.12, 14 RCTs, 1745 women, I2 = 52%, low‐quality evidence). These findings suggest that for a couple with a 13% chance of live birth using FSP, the chance when using IUI will be between 8% and 19%; and that for a couple with a 19% chance of pregnancy using FSP, the chance of pregnancy when using IUI will be between 10% and 20%. Nor was evidence found of a statistically significant difference between IUI and FSP in per‐pregnancy of multiple pregnancy (OR 0.96, 95% CI 0.44 to 2.07, eight RCTs, 197 women, I2 = 0%, low‐quality evidence), miscarriage (OR 1.23, 95% CI 0.60 to 2.53, seven RCTs, 199 women, I2 = 0%, low‐quality evidence) or ectopic pregnancy (OR 1.71, 95% CI 0.42 to 6.88, four RCTs, 111 women, I2 = 0%, very low quality evidence). Substantial heterogeneity was noted for the outcome of clinical pregnancy (I2 = 54%), for which no clear explanation was provided.
Authors' conclusions
Currently no clear evidence suggests any difference between IUI and FSP with respect to their effectiveness and safety for treating couples with non‐tubal subfertility. However, a high level of uncertainty is evident in the findings, and additional research may be useful.
PICO
Plain language summary
Intrauterine insemination versus fallopian tube sperm perfusion for non‐tubal infertility
Review question: This review compared intrauterine insemination versus fallopian tube sperm perfusion in the treatment of non‐tubal subfertility, for live birth and pregnancy outcomes.
Background: Intrauterine insemination (IUI) is an assisted reproduction procedure that places sperm directly into the uterus. Fallopian tube sperm perfusion (FSP) is a similar procedure that places sperm into the woman's fallopian tube, closer to the eggs than IUI. Both techniques aim to improve the chance of conception.
Study characteristics: The review included 16 randomised controlled trials (more than 1800 women) that compared these procedures for treating couples with non‐tubal subfertility. Only three trials reported live birth. The evidence is current to September 2013. No trial reported its funding source, but one reported no conflict of interest, and one stated that it had received no commercial funding.
Key results: No clear evidence suggests any difference between IUI and FSP with respect to their effectiveness and safety in the treatment of couples with non‐tubal subfertility. However, a high level of uncertainty due to lack of data is evident in the findings.
Quality of the evidence: The overall quality of the evidence was rated as low for most outcomes, largely because of the small quantity of available data.
Authors' conclusions
Summary of findings
| IUI compared with FSP for non‐tubal infertility | ||||||
| Patient or population: women with non‐tubal infertility | ||||||
| Outcomes | Illustrative comparative risks* (95% CI) | Relative effect | No of participants | Quality of the evidence | Comments | |
| Assumed risk | Corresponding risk | |||||
| FSP | IUI | |||||
| Live birth per couple | 133 per 1000 | 126 per 1000 | OR 0.94 | 633 | ⊕⊕⊝⊝ | |
| Clinical pregnancy per couple | 185 per 1000 | 145 per 1000 | OR 0.75 | 1745 | ⊕⊕⊝⊝ | |
| Multiple pregnancy per couple | 70 per 1000 | 55 per 1000 | OR 0.62 | 908 | ⊕⊕⊝⊝ | |
| Miscarriage per couple | 43 per 1000 | 46 per 1000 | OR 1.07 | 884 | ⊕⊕⊝⊝ | |
| Ectopic pregnancy per couple | 10 per 1000 | 8 per 1000 | OR 0.88 | 643 | ⊕⊝⊝⊝ | |
| *The basis for the assumed risk (the median control group risk across studies) is provided in footnotes. The corresponding risk (and its 95% confidence interval) is based on the assumed risk in the comparison group and the relative effect of the intervention (and its 95% CI). | ||||||
| GRADE Working Group grades of evidence. | ||||||
| 1One of the three studies did not describe method of allocation concealment and 19% of women in this study had mild tubal damage. | ||||||
Background
Description of the condition
Intrauterine insemination (IUI) is commonly offered to couples with types of subfertility not involving the fallopian tubes. Intrauterine insemination gained its popularity because it is a simple, non‐invasive, cost‐effective technique (Hughes 1997). It is usually combined with controlled ovarian hyperstimulation (COH).
Studies on the dynamics of sperm transport have found a progressive decline in the number of spermatozoa along the length of the female reproductive tract. In normal fallopian tubes, a maximum of only 200 spermatozoa are present in the ampulla (Mamas 1996). Ripps 1994 showed that the number of spermatozoa in the pouch of Douglas was very low after IUI. However, the number of spermatozoa could be significantly increased with utero‐tubal flushes. On the other hand, some authors state that no correlation exists between the number of spermatozoa inseminated and subsequent pregnancy if at least one to five million spermatozoa are inseminated (Dodson 1991; van Weert 2004). With consideration of these observations, another simple non‐invasive method was introduced, called fallopian tube sperm perfusion.
Traditional parameters for assessing the quality of human semen are the concentration, motility and morphology of sperm in the ejaculate. Reference values are based on observations in populations of healthy men, and absolute minimal values for each semen parameter are unknown (Lewis 2007). Since 1990, the World Health Organization (WHO) has published reference values with cut‐off points indicative of male subfertility. The 1997 WHO criteria for male subfertility required at least one of the following: sperm concentration (sperm count) less than 20 million per milliliter, total motility less than 50% or normal morphology less than 50% (WHO 1987). Criteria have changed over time, with several revisions to these criteria, including changes in 1992, which reduced the cut‐off for sperm morphology from 50% to 30% (WHO 1992). The 2010 WHO criteria include thresholds for sperm concentration of less than 15 million per milliliter, total motility less than 50% and normal morphology less than 4% (WHO 2010).
Description of the intervention
Semen (from the partner or the donor) is prepared to remove debris and to maximise the concentration of normal motile spermatozoa. Common methods of sperm preparation are the 'swim‐up technique', whereby motile spermatozoa swim up into a culture medium, and the use of density gradients, which through centrifugation separate spermatozoa according to their density (Boomsma 2007).
Interuterine insemination involves placement of about 0.5 mL of inseminate into the uterine cavity, using a sterile, flexible catheter.
Fallopian tube sperm perfusion (FSP) is based on a pressure injection of 4 mL of sperm suspension while efforts are made to seal the cervix to prevent semen reflux. This ensures sperm flushing of the fallopian tubes and overflow of the inseminate into the pouch of Douglas (Fanchin 1995).
How the intervention might work
FSP was developed to promote higher sperm densities in the fallopian tubes at the time of ovulation than are provided with standard IUI.
However, a possible disadvantage of FSP is the large volume of inseminate, which may flush the ova out of the tubes or induce abnormal myosalpingeal contractions, resulting in expulsion of the ova from the tube and subsequent failure of fertilisation (Nuojua‐Huttunen 1997).
Why it is important to do this review
Numerous published randomised controlled trials (RCTs) have compared the efficacy of FSP with that of standard IUI, and variable findings have been reported. Some of these studies did not have enough power to detect statistically significant differences; therefore it seemed appropriate to consider pooling the results. The aim of this review was to determine whether outcomes in improving the probability of conception differ between FSP and IUI. As one of the basic requirements for IUI, and subsequently FSP, is the presence of patent tubes, we investigated the efficacy of FSP and IUI in the treatment of non‐tubal subfertility.
Objectives
To compare intrauterine insemination versus fallopian tube sperm perfusion in the treatment of non‐tubal subfertility, for live birth and pregnancy outcomes.
Methods
Criteria for considering studies for this review
Types of studies
Published and unpublished RCTs were eligible for inclusion. We excluded non‐randomised studies (e.g. studies with evidence of inadequate sequence generation such as alternate days, participant numbers), as they are associated with a high risk of bias.
Cross‐over trials were included, but we planned that only data from the first phase would be included in meta‐analyses, as the cross‐over design is not valid in this context.
Types of participants
Couples with non‐tubal subfertility, including:
-
couples with unexplained subfertility, defined as failure to conceive after trying for at least one year, with no abnormality found at a routine fertility checkup, or with other non‐tubal causes of subfertility, such as mild endometriosis;
-
couples with mild to moderate male subfertility, defined as semen quality not meeting the criteria for normality as defined by the WHO in 1987. For the first full review and the first update of the review, we used the 1987 definition of sperm normality (sperm concentration < 20 × 106/mL, or total motility < 50%, or normal morphology < 50%) to enable inclusion of studies performed before 1992, as well as more recent studies. In 2010 the WHO changed the criteria for concentration to < 15 × 106/mL; and
-
couples with other non‐tubal causes of subfertility (e.g. mild endometriosis).
Types of interventions
Trials comparing intrauterine insemination versus fallopian tube sperm perfusion were eligible for inclusion.
Types of outcome measures
Trials reporting at least one of the following outcomes were eligible for inclusion.
Primary outcome
-
Live birth per couple.
Secondary outcomes
-
Clinical pregnancy per couple (defined as evidence of a gestational sac, confirmed by ultrasound examination).
-
Multiple pregnancy per couple.
-
Miscarriage per couple.
-
Ectopic pregnancy per couple.
Search methods for identification of studies
See Appendix 1; Appendix 2; Appendix 3; and Appendix 4 for search strategies.
We searched for all published and unpublished RCTs of FSP versus IUI, with no language restriction and in consultation with the Menstrual Disorders and Subfertility Group (MDSG) Trials Search Co‐ordinator.
Electronic searches
We searched the following databases from inception to September 2013.
-
Menstrual Disorders and Subfertility Group Trials Register. This register includes handsearching of all abstracts of meetings of the American Society for Reproductive Medicine and the European Society for Human Reproduction and Embryology since 1987.
-
MEDLINE.
-
Cochrane Central Registry of Controlled Trials (CENTRAL).
-
CINAHL.
-
EMBASE.
-
Trial registers for ongoing and registered trials (http://clinicaltrials.gov/ct2/home, http://www.who.int/trialsearch/Default.aspx).
-
Conference abstracts and citations in the ISI Web of Knowledge (http://wokinfo.com/)
-
OpenGrey for unpublished literature from Europe (http://www.opengrey.eu/)
Searching other resources
-
We handsearched the reference lists of articles retrieved by the search.
-
We contacted experts in the field.
Data collection and analysis
Selection of studies
An initial screen of titles and abstracts retrieved by the search was conducted by one review author (AEPC), and the full texts of all potentially eligible studies were retrieved. Four review authors (AEPC and MJH or CF or JM) independently selected the trials to be included according to the above‐mentioned criteria. Disagreements were resolved through arbitration by a third review author (BJC). We corresponded with study investigators as required to clarify study eligibility.
Data extraction and management
Two review authors independently extracted data from eligible studies (AEPC and MJH; for the update CF and JM). Disagreements were resolved by discussion or by a third review author. Data extracted included study characteristics and outcome data (see Appendix 5). When studies had multiple publications, the main trial report was used as the reference, and additional details were derived from secondary papers. When important information was missing from the original publications, attempts were made to contact the primary investigators. Any additional information received was incorporated into this review.
Assessment of risk of bias in included studies
Two review authors independently assessed the included studies for risk of bias using the Cochrane 'Risk of bias' assessment tool (www.cochrane‐handbook.org) to assess allocation (random sequence generation and allocation concealment); blinding of participants, personnel and/or outcome assessors; completeness of outcome data; selective reporting; and other potential sources of bias. Disagreements were resolved by discussion or by a third review author. We described all judgements fully and presented the conclusions in 'Risk of bias' tables.
Measures of treatment effect
All outcomes were dichotomous. We used the numbers of events in the control and intervention groups of each study to calculate Mantel‐Haenszel odds ratios (ORs) with 95% confidence intervals (CIs). When data to calculate ORs were not available, we planned to utilise the most detailed numerical data available that might facilitate similar analyses of included studies (e.g. test statistics, P values).
Unit of analysis issues
The primary analysis was performed per woman randomly assigned for all outcomes.
We planned that data that did not allow valid analysis (e.g. "per cycle" data) would be briefly summarised in an additional table and would not be meta‐analysed.
Multiple live births (e.g. twins, triplets) were counted as one live birth.
We planned to include only first‐phase data from any cross‐over trials.
Dealing with missing data
Data were analysed on an intention‐to‐treat basis as far as possible, and attempts were made to obtain missing data from the original trialists. When these data were unobtainable, imputation of individual values was undertaken for the primary outcome only: Live births were assumed not to have occurred in participants without a reported outcome. For other outcomes, only the available data were analysed.
Assessment of heterogeneity
We considered whether clinical and methodological characteristics of the included studies were sufficiently similar for meta‐analysis to provide a clinically meaningful summary. We assessed statistical heterogeneity by the measure of the I2 statistic. An I2 measurement greater than 50% was taken to indicate substantial heterogeneity (Higgins 2011). A random‐effects model was used if heterogeneity was substantial.
Assessment of reporting biases
In view of the difficulty of detecting and correcting for publication bias and other reporting biases, the review authors aimed to minimise the potential impact of such biases by ensuring a comprehensive search for eligible studies and by being alert for duplication of data. If ten or more studies were included in an analysis, we planned to use a funnel plot to explore the possibility of small‐study effects (i.e. the tendency for estimates of the intervention effect to be more beneficial in smaller studies).
Data synthesis
If the studies were sufficiently similar, we combined them using a fixed‐effect model to compare IUI versus FSP. An increase in the odds of a particular outcome, which might be beneficial (e.g. live birth) or detrimental (e.g. adverse effects), is displayed graphically in the meta‐analyses to the right of the centre‐line, and a decrease in the odds of a particular outcome is displayed to the left of the centre‐line.
Subgroup analysis and investigation of heterogeneity
We examined the effects of IUI versus FSP in the following subgroups, for the outcomes of live birth and clinical pregnancy.
-
Participants with unexplained subfertility.
-
Participants with mild or moderate male factor subfertility.
If we detected substantial statistical heterogeneity (I2 measurement greater than 50%), we planned to explore possible explanations in sensitivity analyses based on other clinical or methodological differences between the studies.
Sensitivity analysis
We conducted sensitivity analyses for the outcome of clinical pregnancy to determine whether the conclusions were robust to arbitrary decisions made regarding study eligibility and analysis. These analyses included consideration of whether the review conclusions would have differed if:
-
eligibility were restricted to studies with lower risk of bias (defined as studies with a low risk of bias related to randomisation and allocation concealment); or
-
a random effects model had been adopted.
We also conducted sensitivity analyses for the outcomes of multiple pregnancy, miscarriage and ectopic pregnancy to determine whether our conclusions would have differed if the unit of analysis had been pregnancy rather than couple.
Overall quality of the body of evidence: 'Summary of findings' table
A 'Summary of findings' table was generated using GRADEPRO software. This table evaluated the overall quality of the body of evidence for the main review outcomes, using GRADE criteria (study limitations (i.e. risk of bias), consistency of effect, imprecision, indirectness and publication bias). Judgements about evidence quality (high, moderate or low) were incorporated into our interpretation of findings.
Results
Description of studies
Results of the search
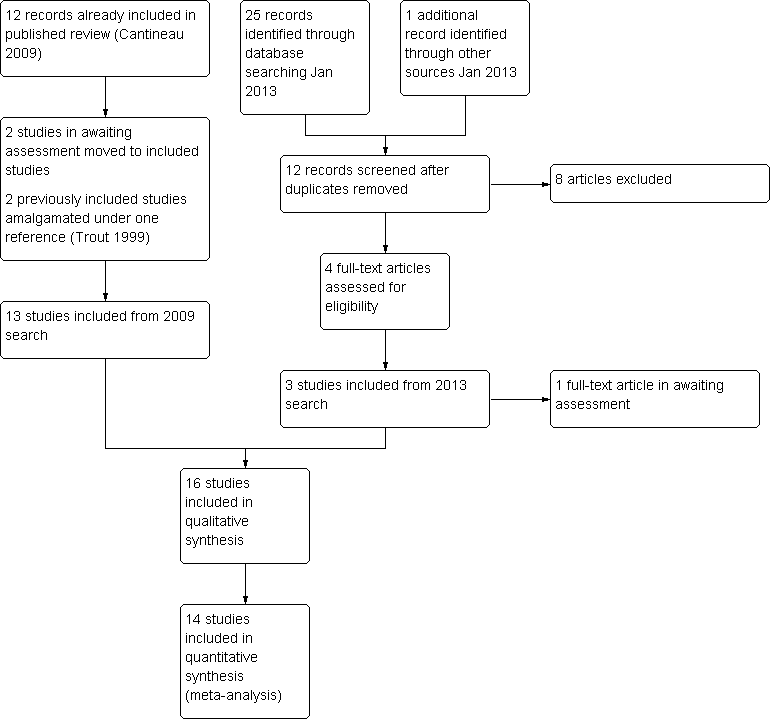
Eleven studies were included in the original review (published in 2004), and twelve in the 2009 update. Additional information was received from the authors of the following included studies: Biacchiardi 2004; Filer 1996a; Gregoriou 1995; Papier 1998, and the following excluded studies: Maheshwari 1998; Prietl 1999.
For the 2013 update, three new studies were added (El‐Khayat 2012; Farquhar 2013; Furuya 2010), two studies previously classified as "awaiting assessment" were included (Kamel 1999; Noci 2007) and two previously included studies (Trout 1999 and Trout 1999 extension study) were amalgamated under a single reference.
Therefore the review now includes 16 studies (Biacchiardi 2004; El‐Khayat 2012; El Sadek 1998; Fanchin 1995; Farquhar 2013; Filer 1996; Furuya 2010; Gregoriou 1995; Kahn 1993; Kamel 1999; Ng 2003; Noci 2007; Nuojua‐Huttunen 1997; Papier 1998; Ricci 2001; Trout 1999). In addition, one study is awaiting assessment (Ricci 2008).
Study flow is shown in Figure 1.

Study flow diagram.
Included studies
Design
The sample sizes of the 16 included studies ranged from 56 to 417 couples, where stated. One study of 106 cycles (Filer 1996) did not clearly state how many women were included. The other 15 studies included a total of 1855 women. Thirteen studies used a parallel‐group design. The other three (Biacchiardi 2004; Filer 1996; Kamel 1999) used a cross‐over design. Pre‐cross‐over data were available for Filer 1996 and Kamel 1999. Most were single‐centre studies. Studies were conducted in tertiary institutions in Argentina, Denmark, Egypt, Finland, France, Greece, Hongkong, Italy ,Japan, New Zealand, Norway and the USA. None reported their funding source, but one reported no conflict of interest (El‐Khayat 2012), and one stated that it had received no commercial funding (Ng 2003).
Participants
The mean or median duration of subfertility among participants in the included studies was about 3.5 years (range 2.0 to 4.4 years) in most studies. Two studies included women with a longer mean duration of subfertility (El Sadek 1998; Gregoriou 1995), and one (Trout 1999) did not state the mean duration of subfertility. Mean age of participants ranged from 29 to 36 years, where stated. In one study (Ng 2003), 24% of women had secondary subfertility.
The most common causes of subfertility in the included studies were unexplained infertility and male factor infertility. Other diagnoses included mild endometriosis, ovarian dysfunction and cervical factor. Two studies reported that although they excluded women with obstructed tubes (El Sadek 1998) and/or severely damaged tubes (Fanchin 1995), they included some with mild tubal damage. In El Sadek 1998, 19% of women had light peritubal adhesions or slightly reduced tubal fimbriae and/or moderate loss of gracility of the tubes. In Fanchin 1995, 37% of women had partial tube damage.
Two studies were restricted to couples with mild or moderate male factor infertility (El‐Khayat 2012; Kamel 1999). In several other studies, a proportion of couples had mild male factor subfertility (when severity was reported): Ng 2003 (37%); Noci 2007 (19%); Nuojua‐Huttunen 1997 (9%); Trout 1999 (16%); and Papier 1998 (proportion not stated).
Most studies included hysterosalpingography or laparoscopy to check tubal patency as part of the fertility investigative workup.
Interventions
1. Stimulation methods
Stimulation methods included the following:
-
Clomiphene citrate (CC) alone or combined with human menopausal gonadotrophin (hMG), followed by one dose of human chorionic gonadotrophin (hCG): El Sadek 1998; El‐Khayat 2012; Kahn 1993; Nuojua‐Huttunen 1997; Kamel 1999;
-
Follicle‐stimulating hormone (FSH) plus one dose of hCG: Ricci 2001 (urinary FSH); Biacchiardi 2004 (recombinant FSH);
-
hMG alone followed by one dose of hCG when the leading follicle was > 18 mm in diameter: Gregoriou 1995; Ng 2003; Papier 1998; and
-
hMG or urinary FSH, plus one dose of hCG when leading follicle was > 18 mm and 2 others were > 16 mm (Noci 2007).
Two studies used a variety of stimulation protocols. Farquhar 2013 used no stimulation for 10% of women and used CC, FSH or letrozole for the remainder. Fanchin 1995 used hMG, FSH and/or gonadotrophin‐releasing hormone agonist (GnRHa).
Two studies (Filer 1996; Furuya 2010) did not mention the type of stimulation used.
2. Semen preparation
When reported, studies used semen from the partner, except that 10% of cycles used donor sperm in Farquhar 2013. The volume of semen perfused for the FSP procedure was 4.0 mL in most studies. For the IUI technique, the volume of semen used varied between 0.2 mL and 1.0 mL.
Semen preparation methods included the following.
-
Density gradient centrifugation techniques: Fanchin 1995; Farquhar 2013; Filer 1996; Gregoriou 1995; Ng 2003; Noci 2007; Nuojua‐Huttunen 1997; Papier 1998; Trout 1999.
-
Swim‐up techniques: Biacchiardi 2004; El Sadek 1998; El‐Khayat 2012; Kahn 1993; Kamel 1999; Ricci 2001.
One study (Furuya 2010) did not report the methods used for semen preparation.
3. Timing of intervention
Insemination or perfusion was between 34 and 42 hours after hCG in all trials. All studies performed a single insemination for both groups.
4. Catheters
Catheters used for IUI were as follows.
-
Frydman: El Sadek 1998; Fanchin 1995; Kahn 1993; Kamel 1999; Noci 2007; Papier 1998; Ricci 2001.
-
Tomcat: Ng 2003.
-
Tomcat or Wallace: Farquhar 2013.
-
Kremer de la Fontaine: Biacchiardi 2004; Nuojua‐Huttunen 1997.
-
Makler: Filer 1996; Gregoriou 1995.
-
Conventional IUI canula: Trout 1999.
-
Insulin syringe attached to an artificial insemination catheter: El‐Khayat 2012.
Catheters used for FSP were as follows.
-
Frydman with Allis clamp: El Sadek 1998; Gregoriou 1995; Kahn 1993; Kamel 1999.
-
FAST system: Fanchin 1995; Ricci 2001.
-
Foley catheter: Biacchiardi 2004; Nuojua‐Huttunen 1997; El‐Khayat 2012.
-
Intrauterine injector with balloon: Ng 2003.
-
Makler cannula: Filer 1996; Papier 1998.
-
ZUII catheter with balloon: Trout 1999.
-
Hysterosalpingography (Cervix Adaptor) catheter: Noci 2007.
One study (Furuya 2010) did not describe the catheters used.
5. Number of cycles
The maximum number of cycles included in the studies varied as follows.
-
One cycle: Farquhar 2013; Nuojua‐Huttunen 1997; Papier 1998.
-
Three cycles: Furuya 2010; Gregoriou 1995; Kamel 1999; Kahn 1993; Ng 2003; Noci 2007; Ricci 2001.
-
Four cycles: Biacchiardi 2004.
-
Six cycles: Filer 1996.
Other studies (El‐Khayat 2012; El Sadek 1998; Fanchin 1995; Trout 1999) did not report a maximum number of cycles per couple.
Outcomes
Primary outcome: live birth
Only three studies reported live birth (El Sadek 1998; El‐Khayat 2012; Farquhar 2013).
Secondary outcomes
-
Clinical pregnancy was reported by all studies. 'Per couple' data were reported by all but two studies (Fanchin 1995; Filer 1996), which reported only per‐cycle data.
-
Multiple pregnancy was reported by eight studies: El Sadek 1998; El‐Khayat 2012; Fanchin 1995; Farquhar 2013; Kahn 1993; Ng 2003; Nuojua‐Huttunen 1997; Ricci 2001.
-
Miscarriage was reported by seven studies: El Sadek 1998; El‐Khayat 2012; Farquhar 2013; Kahn 1993; Ng 2003; Nuojua‐Huttunen 1997; Ricci 2001.
-
Ectopic pregnancy was reported by four studies: El‐Khayat 2012; Farquhar 2013; Kahn 1993; Ricci 2001.
For full details of the included studies, see Characteristics of included studies.
Excluded studies
Twenty‐two studies were excluded because they did not perform the comparison of interest or were not randomised controlled trials: Allahbadia 1998; Arroyo Vieyra 1995; Ciftci 1998; Desai 1998; Dodson 1998; Elhelw 2000; Fanchin 1996; Fanchin 1997; Kahn 1992; Kahn 1992a; Kahn 1993a; Karande 1995; Levitas 1999; Li 1993; Maheshwari 1998; Mamas 1996; Mamas 2006; Posada 2005; Prietl 1999; Soliman 2005; Soliman 1999; Shekhawat 2012.
See Characteristics of excluded studies for details.
Risk of bias in included studies

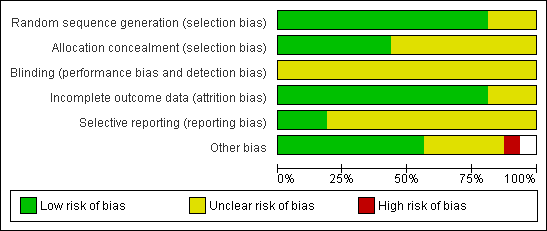
Methodological quality graph: review authors' judgements about all methodological quality items presented as percentages across all included studies.

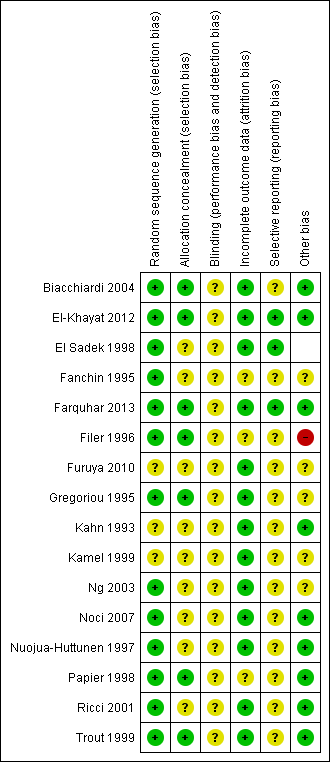
Methodological quality summary: review authors' judgements about all methodological quality items for each included study.
Allocation
Sequence generation
Thirteen studies reported adequate methods of sequence generation and were rated as at low risk of bias in this domain. The other three studies did not clearly describe their methods and were rated as at unclear risk of bias.
Allocation concealment
Seven studies reported adequate methods of allocation concealment and were rated as at low risk of bias in this domain. The other nine studies did not clearly describe their methods and were rated as at unclear risk of bias.
Blinding
Blinding was not reported in any of the studies. However, all studies were rated as at unclear risk of performance or detection bias, as it was uncertain whether blinding would influence the outcomes reported in this review.
Incomplete outcome data
Fourteen studies reported outcomes for all or nearly all randomly assigned participants and were rated as at low risk of attrition bias. In one study (Papier 1998),16% of women failed to receive the intervention, and another study (Fanchin 1995) did not report per‐couple data: These two studies were rated as at unclear risk of attrition bias.
Selective reporting
Only three studies reported live birth (El Sadek 1998; El‐Khayat 2012; Farquhar 2013). These studies were rated as at low risk of selection bias. The other studies failed to report live birth and in some cases also failed to report adverse events. These studies were rated as at unclear risk of selective reporting.
Other potential sources of bias
No other potential source of bias was identified in nine studies; these were rated as at low risk of bias. Limited information was available for two studies, as they were unpublished or were published only as abstracts (Furuya 2010; Kamel 1999). Two studies noted that the number of motile sperm inseminated differed between the groups (Gregoriou 1995; Ng 2003), and one study randomly assigned women but reported results per cycle (Fanchin 1995). Two studies included some women with mild tubal damage (El Sadek 1998; Fanchin 1995). These six studies were rated as at unclear risk of other bias. One study was rated as at high risk of bias because it used a cross‐over design, which is not valid for studies reporting pregnancy outcomes, and no pre‐cross‐over data were available.
Effects of interventions
See: Summary of findings for the main comparison IUI compared with FSP for non‐tubal infertility
Primary outcome: live birth per couple
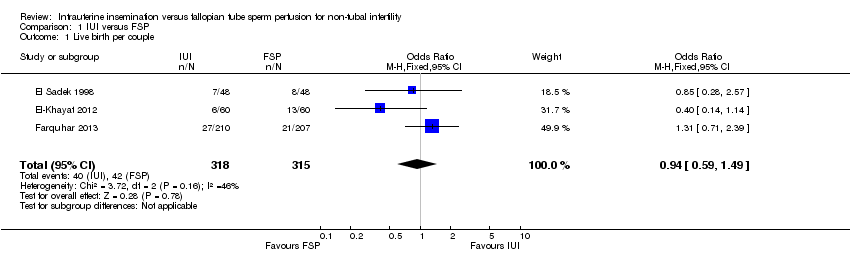
Three studies reported this outcome. There was no evidence of a statistically significant difference between IUI and FSP (OR 0.94, 95% CI 0.59 to 1.49, three RCTs, 633 women, I2 = 46%; Analysis 1.1; Figure 4).
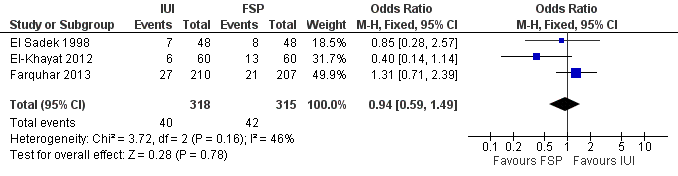
Forest plot of comparison: 1 NEW Intrauterine insemination versus fallopian tube sperm perfusion, outcome: 1.1 Live birth per couple.
Secondary outcomes
1. Clinical pregnancy
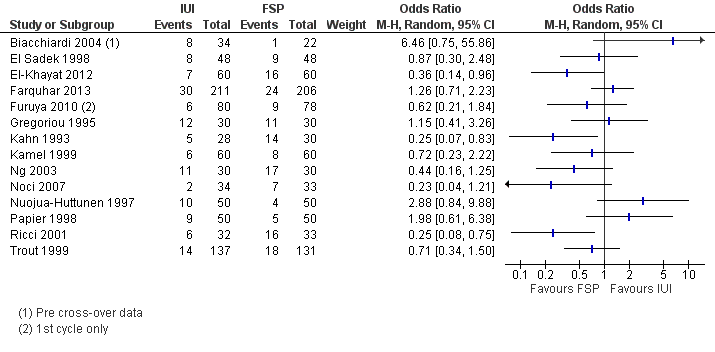
Fourteen studies reported this outcome. There was substantial heterogeneity (I2 = 52%), and so a random‐effects model was used with no evidence of a statistically significant difference between IUI and FSP (OR 0.75, 95% CI 0.49 to 1.12, 14 RCTs, 1745 women, I2 = 52%; Analysis 1.2; Figure 5)
We conducted sensitivity analyses, restricting the analyses to studies using similar methods of stimulation, similar catheter types and or similar methods of semen preparation (data not shown), but this did not explain the heterogeneity.

Forest plot of comparison: 1 IUI vs FSP: unexplained or mixed (non‐tubal) causes, outcome: 1.2 Clinical pregnancy per couple (unexplained and mixed causes).
One study of 74 couples (Fanchin 1995) reported only "per‐cycle" data and so was not included in the meta‐analysis (Table 1). The clinical pregnancy rate was significantly higher in the FSP group in this study (20% vs 40%; P < 0.04).
| Study | Clinical pregnancy per cycle | ||
| IUI | FSP | P value | |
| 10/50 (20%) | 20/50 (40%) | P < 0.04 | |
| 12/59 (20%) | 5/47 (11%) | P > 0.05 | |
2. Multiple pregnancy
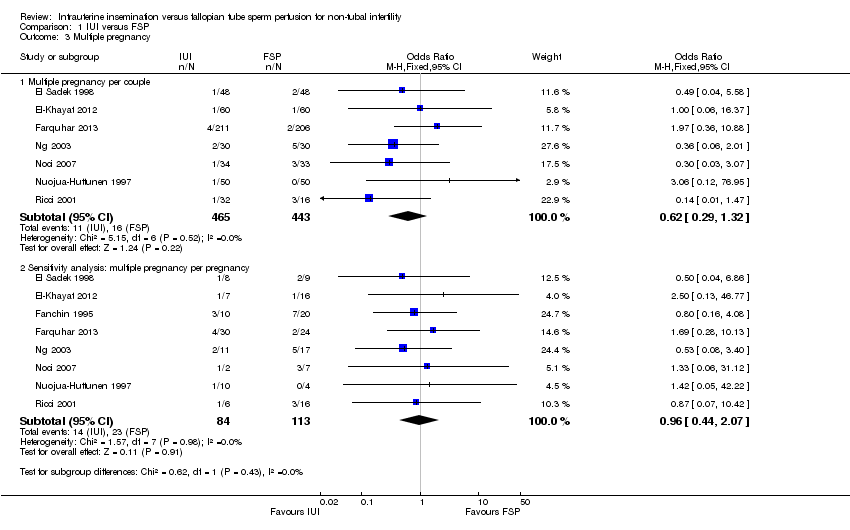
Seven studies reported this outcome. No evidence was found of a statistically significant difference between IUI and FSP (OR 0.62, 95% CI 0.29 to 1.32, seven RCTs, 908 women, I2 = 0%; Analysis 1.3).
Sensitivity analysis using pregnancy as the unit of analysis also found no significant differences between groups (Analysis 1.3).
3. Miscarriage
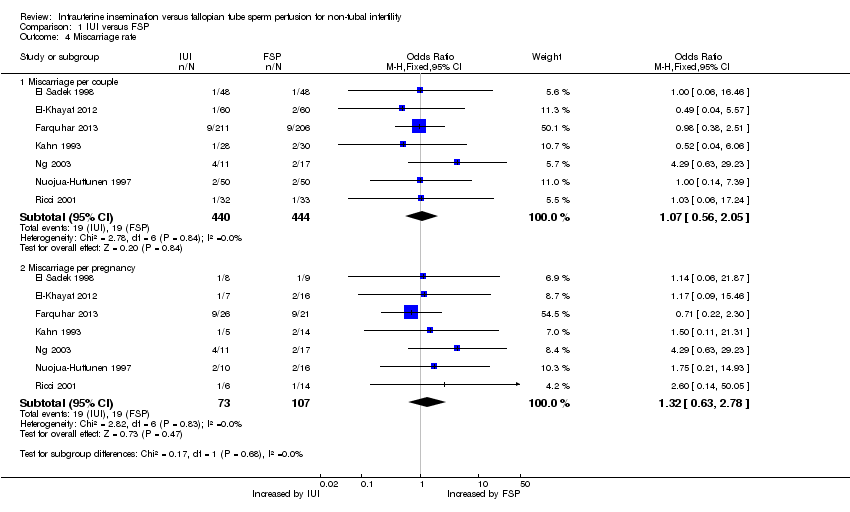
Seven studies reported this outcome. No evidence was found of a statistically significant difference between IUI and FSP (OR 1.07, 95% CI 0.56 to 2.05, seven RCTs, 884 women, I2 = 0%; Analysis 1.4).
Sensitivity analysis using pregnancy as the unit of analysis also found no significant differences between groups (Analysis 1.4).
4. Ectopic pregnancy
Four studies reported this outcome. No evidence was found of a statistically significant difference between IUI and FSP (OR 0.88, 95% CI 0.24 to 3.19, four RCTs, 643 women, I2 = 0%; Analysis 1.5).
Sensitivity analysis using pregnancy as the unit of analysis also found no significant differences between groups (Analysis 1.5).
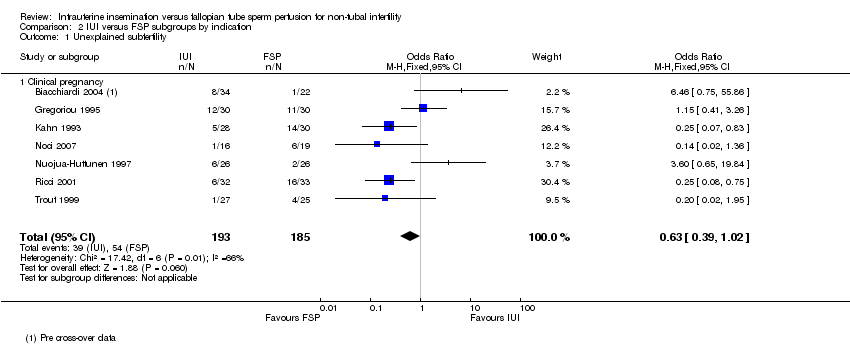
Subgroup analyses
1. Live birth and clinical pregnancy in couples with unexplained subfertility
No studies reported live birth in this subgroup.
Seven studies were restricted to couples with unexplained subfertility or reported separate statistical data on this group. When data were pooled, no evidence was found of a statistically significant difference in clinical pregnancy between the IUI group and the FSP group (OR 0.63, 95% CI 0.39 to 1.02, seven studies, 378 couples, I2 = 66%). Heterogeneity for this analysis was high, for which there was no obvious explanation.
2. Live birth and clinical pregnancy in couples with mild or moderate male factor subfertility
One study reported live birth in this subgroup. No evidence was found of a statistically significant difference between groups in live birth (OR 0.40, 95% CI 0.14 to 1.14, one study, n = 120).
Five studies were restricted to couples with male factor subfertility or reported separate statistical data for this group. When data were pooled, no evidence was found of a statistically significant difference in clinical pregnancy between the IUI group and the FSP group (OR 0.53, 95% CI 0.28 to 1.01, five studies, 303 couples, I2 = 0%).
Assessment of reporting bias
A funnel plot for the outcome of clinical pregnancy was not suggestive of reporting bias (Figure 6).

Funnel plot of comparison: 1 IUI versus FSP, outcome: 1.2 Clinical pregnancy per couple.
Sensitivity analyses
Restriction to higher‐quality studies or use of risk ratio rather than odds ratio did not substantially influence the overall findings for clinical pregnancy. In a post hoc sensitivity analysis, exclusion of the two studies in which some of the women had mild tubal damage did not influence the main findings.
Discussion
Summary of main results
The aim of this review was to compare intrauterine insemination and fallopian tube sperm perfusion in the treatment of non‐tubal subfertility, with respect to live birth, clinical pregnancy and adverse effects. No good evidence suggested any difference between IUI and FSP with respect to their effectiveness or safety in treating non‐tubal subfertility. Findings suggest that for a couple with a 13% chance of live birth using FSP, the chance when using IUI will be between 8% and 19%; and that for a couple with a 19% chance of pregnancy using FSP, the chance of pregnancy when using IUI will be between 10% and 20%.
The evidence was of low quality. Moreover, the analyses of pregnancy rates appeared underpowered, with some suggestion of benefit for FSP.
We concluded that currently no good evidence suggests any difference between IUI and FSP with respect to their safety and effectiveness in treating non‐tubal subfertility.
Overall completeness and applicability of evidence
A number of methodological considerations have to be considered when interpreting the results as clinical heterogeneity was noted in the included trials, as well as substantial statistical heterogeneity for the outcome of clinical pregnancy.
Types of subfertility differed between and within the trials and included unexplained subfertility, ovarian dysfunction, cervical factor, light peritubal adhesions, mild endometriosis and mild to moderate male factor subfertility.
Studies were similar with regard to mean participant age. Most studies excluded women over 39 years of age. Most fertility research centres have a maximum age of inclusion because of lower success rates with older women, related to lower ovarian reserve and oocyte quality in women over 40 years of age (Bukman 2000). The duration of subfertility was at least one year in all of the studies (where reported) and was commonly longer than three years. It is known that fertility treatment is less successful with longer duration of subfertility.
The method of controlled ovarian hyperstimulation used varied among the included studies. Previous meta‐analyses (Cantineau 2007; Crosignani 1996; Hughes 1997) have concluded that gonadotrophins are more effective than clomiphene citrate in the treatment of subfertile couples in IUI programmes. However, the largest included study (Dankert 2007) in Cantineau 2007 reported no statistically significant difference in effectiveness between CC and gonadotrophins. More aggressive ovarian stimulation is likely to increase pregnancy as well as multiple pregnancy and ovarian hyperstimulation syndrome (OHSS); this should be taken into account when study results are compared. In the current review, randomisation was done on the day of insemination after ovarian stimulation, so the ovarian stimulation method was unlikely to influence FSP and IUI outcomes.
Differing methods of sperm preparation were used and included both swim‐up and gradient techniques. Use of a gradient might yield a higher recovery rate (Cohlen 1998), although a Cochrane review on recovery rates after different semen analysis techniques concluded that no semen preparation technique is superior to another (Boomsma 2007).
Differing catheters were also used. Different types of IUI catheters have been compared in a Cochrane review (van der Poel 2010), but no specific conclusion could be made regarding the superiority of one catheter class over another.
Quality of the evidence
The most common problems involving the quality of studies in this review were failure to report live birth as an outcome and failure to describe an acceptable method of allocation concealment. Most studies described acceptable methods of sequence generation and were at low risk of attrition bias or other sources of bias. One study reported only per‐cycle data. All studies were apparently unblinded, but this was considered unlikely to cause bias.
As noted above, some analyses appeared underpowered.
Publication bias appeared unlikely, as a funnel graph for the outcome of clinical pregnancy was symmetrical (see Figure 6).
Using GRADE methods, the overall quality of the evidence was rated as low for all outcomes apart from ectopic pregnancy, for which it was rated as very low. This was largely a result of the small quantity of data available, which resulted in wide confidence intervals that were compatible both with no effect and with appreciable benefit or harm. In addition, most studies did not describe their methods in adequate detail. For the outcome of clinical pregnancy, substantial heterogeneity was noted, which was not adequately explained by clinical differences between the studies. See summary of findings Table for the main comparison.
Potential biases in the review process
We are unaware of any potential biases in the review process.
Agreements and disagreements with other studies or reviews
No other reviews comparing fallopian tube sperm perfusion with intrauterine insemination are known to the review authors.
Study flow diagram.
Methodological quality graph: review authors' judgements about all methodological quality items presented as percentages across all included studies.
Methodological quality summary: review authors' judgements about all methodological quality items for each included study.

Forest plot of comparison: 1 NEW Intrauterine insemination versus fallopian tube sperm perfusion, outcome: 1.1 Live birth per couple.
Forest plot of comparison: 1 IUI vs FSP: unexplained or mixed (non‐tubal) causes, outcome: 1.2 Clinical pregnancy per couple (unexplained and mixed causes).

Funnel plot of comparison: 1 IUI versus FSP, outcome: 1.2 Clinical pregnancy per couple.
Comparison 1 IUI versus FSP, Outcome 1 Live birth per couple.

Comparison 1 IUI versus FSP, Outcome 2 Clinical pregnancy per couple.
Comparison 1 IUI versus FSP, Outcome 3 Multiple pregnancy.
Comparison 1 IUI versus FSP, Outcome 4 Miscarriage rate.

Comparison 1 IUI versus FSP, Outcome 5 Ectopic pregnancy.
Comparison 2 IUI versus FSP subgroups by indication, Outcome 1 Unexplained subfertility.

Comparison 2 IUI versus FSP subgroups by indication, Outcome 2 Mild to moderate male factor subfertility.
| IUI compared with FSP for non‐tubal infertility | ||||||
| Patient or population: women with non‐tubal infertility | ||||||
| Outcomes | Illustrative comparative risks* (95% CI) | Relative effect | No of participants | Quality of the evidence | Comments | |
| Assumed risk | Corresponding risk | |||||
| FSP | IUI | |||||
| Live birth per couple | 133 per 1000 | 126 per 1000 | OR 0.94 | 633 | ⊕⊕⊝⊝ | |
| Clinical pregnancy per couple | 185 per 1000 | 145 per 1000 | OR 0.75 | 1745 | ⊕⊕⊝⊝ | |
| Multiple pregnancy per couple | 70 per 1000 | 55 per 1000 | OR 0.62 | 908 | ⊕⊕⊝⊝ | |
| Miscarriage per couple | 43 per 1000 | 46 per 1000 | OR 1.07 | 884 | ⊕⊕⊝⊝ | |
| Ectopic pregnancy per couple | 10 per 1000 | 8 per 1000 | OR 0.88 | 643 | ⊕⊝⊝⊝ | |
| *The basis for the assumed risk (the median control group risk across studies) is provided in footnotes. The corresponding risk (and its 95% confidence interval) is based on the assumed risk in the comparison group and the relative effect of the intervention (and its 95% CI). | ||||||
| GRADE Working Group grades of evidence. | ||||||
| 1One of the three studies did not describe method of allocation concealment and 19% of women in this study had mild tubal damage. | ||||||
| Study | Clinical pregnancy per cycle | ||
| IUI | FSP | P value | |
| 10/50 (20%) | 20/50 (40%) | P < 0.04 | |
| 12/59 (20%) | 5/47 (11%) | P > 0.05 | |
| Outcome or subgroup title | No. of studies | No. of participants | Statistical method | Effect size |
| 1 Live birth per couple Show forest plot | 3 | 633 | Odds Ratio (M‐H, Fixed, 95% CI) | 0.94 [0.59, 1.49] |
| 2 Clinical pregnancy per couple Show forest plot | 14 | Odds Ratio (M‐H, Random, 95% CI) | Subtotals only | |
| 3 Multiple pregnancy Show forest plot | 8 | Odds Ratio (M‐H, Fixed, 95% CI) | Subtotals only | |
| 3.1 Multiple pregnancy per couple | 7 | 908 | Odds Ratio (M‐H, Fixed, 95% CI) | 0.62 [0.29, 1.32] |
| 3.2 Sensitivity analysis: multiple pregnancy per pregnancy | 8 | 197 | Odds Ratio (M‐H, Fixed, 95% CI) | 0.96 [0.44, 2.07] |
| 4 Miscarriage rate Show forest plot | 7 | Odds Ratio (M‐H, Fixed, 95% CI) | Subtotals only | |
| 4.1 Miscarriage per couple | 7 | 884 | Odds Ratio (M‐H, Fixed, 95% CI) | 1.07 [0.56, 2.05] |
| 4.2 Miscarriage per pregnancy | 7 | 180 | Odds Ratio (M‐H, Fixed, 95% CI) | 1.32 [0.63, 2.78] |
| 5 Ectopic pregnancy Show forest plot | 4 | Odds Ratio (M‐H, Fixed, 95% CI) | Subtotals only | |
| 5.1 Ectopic pregnancy per couple | 4 | 643 | Odds Ratio (M‐H, Fixed, 95% CI) | 0.88 [0.24, 3.19] |
| 5.2 Ectopic pregnancy per pregnancy | 4 | 111 | Odds Ratio (M‐H, Fixed, 95% CI) | 1.71 [0.42, 6.88] |
| Outcome or subgroup title | No. of studies | No. of participants | Statistical method | Effect size |
| 1 Unexplained subfertility Show forest plot | 7 | 378 | Odds Ratio (M‐H, Fixed, 95% CI) | 0.63 [0.39, 1.02] |
| 1.1 Clinical pregnancy | 7 | 378 | Odds Ratio (M‐H, Fixed, 95% CI) | 0.63 [0.39, 1.02] |
| 2 Mild to moderate male factor subfertility Show forest plot | 5 | Odds Ratio (M‐H, Fixed, 95% CI) | Subtotals only | |
| 2.1 Live birth | 1 | 120 | Odds Ratio (M‐H, Fixed, 95% CI) | 0.40 [0.14, 1.14] |
| 2.2 Clinical pregnancy | 5 | 303 | Odds Ratio (M‐H, Fixed, 95% CI) | 0.53 [0.28, 1.01] |