Acellular vaccines for preventing whooping cough in children
Abstract
Background
Routine use of whole‐cell pertussis (wP) vaccines was suspended in some countries in the 1970s and 1980s because of concerns about adverse effects. Following this action, there was a resurgence of whooping cough. Acellular pertussis (aP) vaccines, containing purified or recombinant Bordetella pertussis (B. pertussis) antigens, were developed in the hope that they would be as effective, but less reactogenic than the whole‐cell vaccines. This is an update of a Cochrane review first published in 1999, and previously updated in 2012. In this update, we included no new studies.
Objectives
To assess the efficacy and safety of acellular pertussis vaccines in children and to compare them with the whole‐cell vaccines.
Search methods
We searched CENTRAL (2013, Issue 12), MEDLINE (1950 to January week 2, 2014), EMBASE (1974 to January 2014), Biosis Previews (2009 to January 2014) and CINAHL (2009 to January 2014).
Selection criteria
We selected double‐blind randomised efficacy and safety trials of aP vaccines in children up to six years old, with active follow‐up of participants and laboratory verification of pertussis cases.
Data collection and analysis
Two review authors independently extracted data and assessed the risk of bias in the studies. Differences in trial design precluded a meta‐analysis of the efficacy data. We pooled the safety data from individual trials using a random‐effects meta‐analysis model.
Main results
We included six efficacy trials with a total of 46,283 participants and 52 safety trials with a total of 136,541 participants. Most of the safety trials did not report the methods for random sequence generation, allocation concealment and blinding, which made it difficult to assess the risk of bias in the studies. The efficacy of multi‐component (≥ three) vaccines varied from 84% to 85% in preventing typical whooping cough (characterised by 21 or more consecutive days of paroxysmal cough with confirmation of B. pertussis infection by culture, appropriate serology or contact with a household member who has culture‐confirmed pertussis), and from 71% to 78% in preventing mild pertussis disease (characterised by seven or more consecutive days of cough with confirmation of B. pertussis infection by culture or appropriate serology). In contrast, the efficacy of one‐ and two‐component vaccines varied from 59% to 78% against typical whooping cough and from 41% to 58% against mild pertussis disease. Multi‐component acellular vaccines are more effective than low‐efficacy whole‐cell vaccines, but may be less effective than the highest‐efficacy whole‐cell vaccines. Most systemic and local adverse events were significantly less common with aP vaccines than with wP vaccines for the primary series as well as for the booster dose.
Authors' conclusions
Multi‐component (≥ three) aP vaccines are effective in preventing whooping cough in children. Multi‐component aP vaccines have higher efficacy than low‐efficacy wP vaccines, but they may be less efficacious than the highest‐efficacy wP vaccines. Acellular vaccines have fewer adverse effects than whole‐cell vaccines for the primary series as well as for booster doses.
PICO
Plain language summary
Acellular vaccines for preventing whooping cough (pertussis) in children
Review question
We aimed to answer the question of whether acellular pertussis vaccines are as effective as the whole‐cell vaccines at protecting children against whooping cough (pertussis), but with fewer side effects.
Background
Whooping cough can be a serious respiratory infection in children and is caused by the bacterium Bordetella pertussis (B. pertussis). Vaccines made from killed whole B. pertussis, known as whole‐cell pertussis vaccines, can cause severe neurologic disorders and minor side effects, such as anorexia, drowsiness, fever, irritability, prolonged crying, vomiting and pain/redness/swelling/hardening at the injection site. This led to a fall in immunisation rates, which resulted in an increase in the number of cases of whooping cough. Acellular pertussis vaccines (containing more purified antigens of B. pertussis) were developed in the hope that they would be as effective but safer than the whole‐cell pertussis vaccines.
Search date
We searched for trials published up to January 2014.
Study characteristics
We included trials comparing the efficacy and safety of whole‐cell and acellular pertussis vaccines in children up to six years old.
Key results
This updated review included six trials with 46,283 participants evaluating the efficacy and 52 trials with 136,541 participants assessing the safety of pertussis vaccines. Duration varied from 12 months to 27 months and from 3 days to 12 months for efficacy trials and safety trials, respectively. The efficacy of acellular vaccines with three or more components varied from 84% to 85% in preventing typical whooping cough (characterised by 21 or more consecutive days of severe coughing attacks with laboratory evidence of B. pertussis infection or contact with a household member who has culture‐confirmed pertussis) and from 71% to 78% in preventing mild pertussis disease (characterised by seven or more consecutive days of cough with laboratory evidence of B. pertussis infection). In contrast, the efficacy vaccines with one and two components varied from 59% to 78% in protecting against typical whooping cough and from 41% to 58% against mild pertussis disease. Most systemic and local side effects were significantly less common with acellular vaccines than with whole‐cell vaccines for the first doses and booster dose. We found that acellular pertussis vaccines with three or more components are more effective than low‐efficacy whole‐cell vaccines, but may be less effective than the highest‐efficacy whole‐cell vaccines. Acellular vaccines have fewer side effects than whole‐cell vaccines.
Implications for practice
The implications of the findings of this review for clinical practice may be different in high‐income and low‐income countries. In high‐income countries, death from whooping cough is rare and parental acceptance is a major determinant of immunisation uptake. In these circumstances, the improved side effect profile of acellular vaccines argues in favour of their use, even though they might sacrifice some degree of effectiveness compared to the best whole‐cell vaccines. In low‐income countries, where the risk of pertussis is higher and cases are more likely to be fatal, greater weight needs to be given to vaccine efficacy. If an acellular vaccine has been shown to be less effective than a high‐efficacy whole‐cell vaccine it is intended to replace, the safety advantage of the acellular vaccine may be offset by increased mortality and morbidity due to a significantly higher rate of pertussis. However, most of the whole‐cell vaccines used in low‐income countries have not been adequately studied for efficacy and, therefore, it is not known where on the wide spectrum of whole‐cell vaccine efficacy an individual product lies.
Quality of evidence
All included trials were randomised and double‐blind, that is, the participants had an equal chance of receiving either acellular or whole‐cell vaccines and both researchers and participants were unaware of the treatment assignment. However, most of trials did not report details of these methodological techniques. This may cast some uncertainty on the quality of evidence in this review.
Authors' conclusions
Background
Description of the condition
Whooping cough, or pertussis, is a highly contagious disease caused predominantly by the fastidious Gram‐negative coccobacillus, Bordetella pertussis (B. pertussis). The disease can occur at any age but is more severe in infants, with most deaths occurring in this age group (Singh 2006). The disease in this age group is also more easily diagnosed because they present with whooping cough, which is characterised by paroxysmal coughing followed by an audible inspiratory whoop and occasionally vomiting. Infants often have a cough and apnoeic episodes, which can be severe and may require admission to hospital. Although habitually a persistent, relatively benign respiratory illness, pertussis can result in serious consequences, such as pneumonia, seizures, encephalopathy and death, especially among infants (Galanis 2006). Immunised children, adolescents and adults may not exhibit whooping cough. They may be asymptomatic or present with a cough lasting several weeks.
The reported incidence of pertussis should be interpreted cautiously, because the case definitions and surveillance system performance vary markedly between countries. In low‐income countries, case definition is mostly based on clinical confirmation due to limited access to laboratory facilities (Singh 2006). According to the World Health Organization (WHO) there are about 16 million pertussis cases annually worldwide among children, teenagers and adults, 95% of which are in low‐income countries, and about 195,000 children die of the disease (WHO 2010). Before the introduction of the pertussis vaccine in the 1940s, there were approximately 200,000 cases reported annually in the United States. Immunisations reduced disease rates and there were only 1010 reported cases in 1976 (Bamberger 2008). The incidence decreased from 157 per 100,000 population in the early 1940s to less than 1 per 100,000 in 1973 (Cherry 2012). It has been generally believed that pertussis particularly affected children under six years of age, but recent trends show that in countries that have achieved good control of pertussis, there is a change in the epidemiology of pertussis in the older age group. Several factors have been proposed as possible causes for the increasing incidence of pertussis disease, including waning immunity with subsequent atypical disease manifestations (Singh 2006). There is a frequent misconception that protection provided by childhood immunisation is lifelong. However, the protection provided by vaccination tends to reduce over time. Evidence shows that the proportion of susceptible children with infections in countries with good vaccination coverage (70%) can be estimated at 10% by one year, 60% by five years and 100% by 15 years (Singh 2006).
Since the 1980s, there has been a substantial increase in the number of cases reported, especially in high‐income countries. This has occurred in children and adolescents aged 6 to 10 years, after childhood immunisations were completed (Bamberger 2008; Singh 2006). In the USA, for example, there were 25,827 cases reported in 2004 and there has been a 19‐fold increase of pertussis cases in adolescents (Bamberger 2008; CDC 2011). Affected adolescents and adults act as reservoirs of the disease to the vulnerable population of infants, for whom the disease can be life‐threatening (Harnden 2009; WHO 2010).
Description of the intervention
After the isolation of B. pertussis in 1906, the possibility of vaccine development was considered. In 1933, Madsen reported some degree of protection in individuals who received a vaccine composed of suspended organisms in saline (Cherry 1996). Vaccines made from killed whole B. pertussis bacteria (whole‐cell pertussis vaccines ‐ wP) have been available since the 1940s. Today, wP vaccines are manufactured in many countries. Although their basic preparation procedures are similar, the vaccines frequently elicit markedly different immune responses to various B. pertussis antigens (Cherry 1996). The wP vaccines are based on regular cultures of selected B. pertussis strains that are killed, usually by being heating and treated with formalin. The methods used for the production vary between laboratories, therefore wP vaccines are relatively heterogeneous. Most wP vaccines are combined with diphtheria toxoid and tetanus toxoid. This combination has shown an efficacy of 80% and has been effective in reducing the incidence rates markedly in countries with good immunisation coverage (WHO 2010). The immune response to wP vaccines is directed against an array of antigens of whole bacterial cells. Significant differences in the immune responses to various antigens have been observed among the different wP vaccines. Unwanted components such as endotoxin cannot be eliminated during whole‐cell vaccine production, therefore an acceptable level of potency is inevitably associated with a greater incidence of adverse effects.
Concerns about possible relations of wP vaccines with neurological disorders led to the development of acellular pertussis (aP) vaccines in the 1970s and they were widely tested and used in Japan during the 1980s (Sato 1984). aP vaccines consist of recombinant or isolated, purified antigens of B. pertussis. They include antigens extracted by various methods, as well as those produced by genetic recombinant technology. Five antigens have been identified as appropriate vaccine components: pertussis toxin (PT), filamentous haemagglutinin (FHA), pertactin and fimbriae type 2 and 3 (FIM 2 and 3) (Jefferson 2003; Singh 2006). One or more of these components may be included in various combinations to produce the vaccine. Vaccines differ from each other, with regard to the bacterial clone used for primary antigen production, methods of cleansing and detoxification, included adjuvants and the use of preservatives (WHO 2010). The exact contribution of the different aP antigens to protection is not well established.
Vaccination strategies vary by health policies in each country. Over the last several years, many potential immunisation strategies have been proposed to improve pertussis control. Immunogenicity data indicate that a primary series should consist of three doses and that booster doses are necessary at ages two and four to six years (Cherry 1996). Most immunisation schedules consist of five to six intramuscular injections given from the age two months to 16 years (CDC 2009; Rodríguez‐Cobo 2008), but booster doses every 10 years throughout life have been suggested because protection provided by childhood immunisation is only partial and not lifelong (Forsyth 2004; Rodríguez‐Cobo 2008).
In the 1990s, safety concerns prompted a switch from wP to aP vaccines in most high‐income countries. However, wP vaccines remain the choice for the national childhood immunisation programmes in many low‐income countries, as they are considerably less expensive and highly effective against pertussis (Singh 2006; WHO 2010). In children older than six years of age, only aP vaccines should be used for vaccination (WHO 2010).
How the intervention might work
The mechanism of vaccine‐induced protection against B. pertussis is still not well understood. Induction of antibodies to the components of B. pertussis appears to be associated with protection by vaccines (Cherry 1998; Kerr 2000; Storsaeter 1998; Taranger 2000), and it is believed that anti‐B. pertussis IgG antibodies may play a key role in preventing bacterial adherence (Mills 1999). However, no consensus has been reached regarding the protective antigens. A household study nested in the Swedish vaccine efficacy trial (Storsaeter 1998) (SmithKline Beecham DTaP 2 vaccine, Connaught DTaP 5 vaccine, Connaught DTwP vaccine, SBT DT vaccine) found a correlation between clinical protection and levels of anti‐pertactin, anti‐FIM2/3 and anti‐PT antibodies in serum, listed in order of a decreasing degree of correlation. There was no correlation between anti‐FHA antibodies and clinical protection. Similar results were found in the German vaccine efficacy trial (Cherry 1998) (Lederle/Takeda DTaP vaccine, Lederle wP vaccine).
Cell‐mediated immunity has also been proposed as a possible protective mechanism of vaccines (Mills 1999; Plotkin 2008; Tran Minh 1998). Both human and animal studies demonstrate that aP and wP vaccines induce distinct T cell populations (Feunou 2010; Millis 1998; Mills 1999). Th1 responses are important for bacterial clearance following primary infection and in immunity induced with a wP vaccine, whereas Th2 cells play a more critical role in the protective mechanism of the aP vaccine (Mills 1999). It is believed that B. pertussis‐specific T cells (probably IL‐4 and IL‐5 secreting Th0/Th2 cells) are required for the induction of humoral response, whereas Th1 cells function in limiting the course of infection through enhanced bacterial uptake and killing by phagocytic cells (Mills 1999).
Why it is important to do this review
This systematic review was initially conducted by Tinnion 1999 to assess the efficacy and safety of aP vaccines in children and to compare them with wP vaccines. The review has been regularly updated (Zhang 2009; Zhang 2012). This review can provide high‐level evidence regarding the benefits and risks of vaccines against pertussis for health policy makers, as well as for paediatricians and parents.
Objectives
To assess the efficacy and safety of acellular pertussis vaccines in children and to compare them with the whole‐cell vaccines.
The following four questions were answered by the review.
-
Do acellular vaccines protect against pertussis?
-
If so, do different vaccines confer different levels of protection?
-
Do acellular vaccines protect against pertussis to the same degree as the whole‐cell vaccines, which they are intended to replace?
-
Do acellular vaccines cause fewer side effects than wP vaccines?
Methods
Criteria for considering studies for this review
Types of studies
-
Double‐blind randomised controlled trials (RCTs) of the efficacy of aP vaccines, with active follow‐up of participants and laboratory verification of pertussis cases.
-
Double‐blind RCTs of the safety of aP vaccines.
Active follow‐up was required to minimise the potential for bias in the recording of pertussis cases. Passive follow‐up (such as relying on parents to report cases spontaneously, or monitoring laboratory records of pertussis isolates) has been shown to lead to bias in case ascertainment. This occurs because disease in vaccinated individuals tends to be less severe than in unvaccinated ones and therefore less likely to come to the attention of a physician (Taranger 1997). Laboratory verification was required because case definitions of pertussis based on clinical criteria alone have been shown to lack specificity (Blackwelder 1991). There was no requirement for laboratory verification to be performed according to any particular method, because the most appropriate method will vary according to the composition of the vaccine under study.
We did not consider trials which only examined antibody response after immunisation in this review, as no particular antibody level has been found to correlate with the clinical efficacy of pertussis vaccines (Granoff 1997).
Types of participants
Children up to six years of age at time of study entry.
Types of interventions
We considered two types of interventions in the experimental (acellular vaccine) group.
-
aP vaccine: a vaccine containing purified, detoxified pertussis antigens. This includes antigens extracted from B. pertussis organisms by various purification methods, as well as those produced by genetic recombinant technology.
-
Diphtheria‐tetanus‐aP (DTaP) vaccine. An aP vaccine which also contains diphtheria and tetanus toxoids.
We included four types of control intervention.
-
wP vaccine: a vaccine containing killed, whole B. pertussis organisms. (An appropriate control where the acellular vaccine used in the experimental group contains only pertussis antigens).
-
Diphtheria‐tetanus‐wP vaccine (DTwP): a whole‐cell pertussis vaccine, which also contains diphtheria and tetanus toxoids. (An appropriate control if these antigens are present in the acellular vaccine used in the experimental group).
-
Placebo: a preparation containing no antigens or organisms. (An appropriate control where the acellular vaccine used in the experimental group contains only pertussis antigens).
-
DT: diphtheria‐tetanus (DT) toxoid vaccine. (An appropriate control if these antigens are present in the acellular vaccine used in the experimental group).
Types of outcome measures
Primary outcomes
The primary outcome measure was vaccine efficacy. Trials comparing acellular vaccines with a randomised placebo/DT group permitted the determination of absolute vaccine efficacy. This is the conventional parameter used to express effectiveness in vaccine trials and represents the percentage of potential disease cases prevented by the vaccine. Absolute vaccine efficacy is calculated as (1 ‐ RR) x 100%, where risk ratio (RR) equals the risk of disease in the vaccine group divided by the risk of disease in the placebo/DT group. Trials with no placebo/DT control do not permit the estimation of absolute efficacy but do allow an assessment of the comparative efficacy of the various vaccines within each trial (expressed as the RR of disease in the acellular compared to the whole‐cell group).
Estimates of pertussis vaccine efficacy may vary greatly according to the case definition used (Blackwelder 1991), and most studies report efficacy results for a range of case definitions. In this review, we examined two case definitions. The first, 'whooping cough', corresponds to the well‐recognised clinical syndrome of pertussis, characterised by protracted, paroxysmal cough. The second, 'pertussis disease', includes milder cases that do not fit the classical picture but may be important in the spread of infection. The criteria for these two case definitions were as follows.
-
Whooping cough: 21 or more consecutive days of paroxysmal cough with confirmation of B. pertussis infection by culture, appropriate serology or contact with a household member who has culture‐confirmed pertussis. This case definition is recommended by the WHO for use in pertussis vaccine trials (WHO 1991).
-
Pertussis disease: seven or more consecutive days of cough with confirmation of B. pertussis infection by culture or appropriate serology.
When studies did not report vaccine efficacy using these exact criteria, we reviewed efficacy for the case definitions that corresponded most closely to those above.
Where possible, we reviewed efficacy endpoints for the population who received all scheduled doses of the randomised vaccine ('per protocol' population) and for the population who received at least one dose of the randomised vaccine.
Secondary outcomes
The safety outcome measures were as follows.
-
Failure to complete all scheduled doses of the primary immunisation series because of adverse events.
-
Mortality due to any cause.
-
Mortality due to infection.
-
Encephalopathy.
-
Convulsions.
-
Hypotonic‐hyporesponsive episodes.
-
Selected minor adverse events generally considered to be associated with wP vaccines: anorexia, drowsiness, fever, irritability/fretfulness, prolonged crying, vomiting, injection site pain/tenderness, injection site redness and injection site swelling/induration.
Search methods for identification of studies
Electronic searches
The initial search was carried out in March 1997 and updated in March 1998 (see Appendix 1 for details of the search terms). The search was updated again in April 2009. See Appendix 2 for details of search terms.
For this update we searched the Cochrane Central Register of Controlled Trials (CENTRAL) (2013, Issue 12), which contains the Cochrane Acute Respiratory Infections Group's Specialised Register, MEDLINE (April 2009 to January week 2, 2014) and EMBASE (April 2009 to January 2014). We also searched Biosis Previews (2009 to January 2014) and CINAHL (2009 to January 2014) as we aimed to include a broader range of databases in order to identify potential studies.
We used the search strategy in Appendix 3 to search MEDLINE and CENTRAL. We combined the MEDLINE search with the Cochrane Highly Sensitive Search Strategy for identifying randomised trials in MEDLINE: sensitivity‐ and precision‐ maximising version (2008 revision); Ovid format (Lefebvre 2011). We modified the search strategy to search EMBASE (Appendix 4), Biosis Previews (Appendix 5), and CINAHL (Appendix 6).
Searching other resources
We did not manually search the reference lists of retrieved papers for either initial or updated searches, and we made no systematic attempt to obtain unpublished articles. We did not limit the searches to English language reports because such limitation has been shown to be a potential source of bias (Egger 1997).
Data collection and analysis
Selection of studies
One of the original review authors identified and assessed trials in the first publication of this review (Tinnion 1999), to determine whether they satisfied the predefined inclusion criteria. The review author was not blinded to the trial authors or sources of the trial reports during study selection and data extraction.
Two review authors (LZ, SP) independently assessed the titles and abstracts of all studies identified by the searches to select new trials when updating this review. We obtained the full articles when they appeared to meet the inclusion criteria or there were insufficient data in the title and abstract to make a clear decision for their inclusion. We resolved any disagreement between the review authors about study inclusion by discussion.
Data extraction and management
We gave each study a unique identifier for use in RevMan 2012. When a single study was reported in several publications, we used the lead author of the publication containing the main efficacy or adverse event data in the identifier (for example, Decker 1995).
We extracted data into a database (MS Access 7.0) using pre‐prepared electronic forms, which had been refined after testing on a sample of trials. We then sorted the data for entry into RevMan 2012. Two review authors (LZ, SP) independently extracted data from the new trials included for update using a standardised data extraction form. We resolved any disagreement by discussion.
A number of studies reported the percentage of vaccine recipients with each adverse event, but not the actual number. To permit entry into RevMan 2012, we calculated the number of participants experiencing each event from the reported percentage and the number vaccinated. This practice was required only for the common, minor adverse events. It may have introduced a small rounding error in some instances but would not have materially affected the odds ratio (OR) and overall conclusions for these common events.
We excluded the data from the review if adverse event data for a particular dose were available for less than 80% of those who had received the dose. This was done because excessive loss to follow‐up could lead to a spurious reduction in the reported frequency of adverse events.
Study reports often graded adverse events according to severity. For the purposes of this review, we defined two (overlapping) severity categories. The primary category was the number of patients with any occurrence of the event under consideration. A secondary category was the number of patients with 'moderate to severe' grades of the event.
We applied the following rules during data extraction.
-
We defined primary series immunisation as the first series of up to three doses administered to children who had not previously been immunised against pertussis. We defined booster immunisation as doses administered at or after the age of 12 months to children who had completed a primary series.
-
When results for both pain and tenderness were reported, we used the result for pain. When results for both swelling and induration were reported, we used that for swelling.
-
We defined fever as a temperature of 38 ºC or greater. When a study did not report a result using this cut‐point, we entered the result for the cut‐point closest to 38 ºC but below 39 ºC. We defined moderate to severe fever as a temperature at or above 39 ºC. If a study did not report a result using this cut‐point, we recorded the result for the next highest cut‐point.
-
We defined moderate to severe redness and swelling/induration as reactions with a diameter of 2 cm or greater. When a study did not report a result using this cut‐point, we recorded the result for the next highest cut‐point.
-
We recorded data for deaths if the study report explicitly stated the number of deaths (or that there were no deaths), or if the absence of deaths could be confirmed by one or more of the following: (1) the number of withdrawals was stated and all were accounted for by causes other than death; (2) the report stated that there were no withdrawals, or that all participants completed the study; and (3) the report stated that there were no serious reactions and also defined death as a serious reaction. While the last requirement may seem superfluous, this was not the case, as one study stated that "there were no serious reactions to the vaccines" and then went on to report that there had been two convulsions and one death (Trollfors 1995).
-
We recorded data for encephalopathy, convulsions or hypotonic‐hyporesponsive episodes if: (1) the report explicitly stated the number of these reactions (or that there were none); or (2) the report stated that there were no serious reactions and defined the event under consideration (encephalopathy, convulsions or hypotonic‐hyporesponsive episodes) as a serious reaction.
Assessment of risk of bias in included studies
Two review authors (LZ, SP) independently assessed the risk of bias of each eligible RCT by using The Cochrane Collaboration's tool for assessing risk of bias (Higgins 2011). The tool contains seven domains: random sequence generation, allocation concealment, blinding of participants and personnel, blinding of outcome assessment, incomplete outcome data, selective reporting and other sources of bias. We rated each domain as having 'low risk of bias', 'high risk of bias' or 'unclear risk of bias'.
Measures of treatment effect
We used risk ratio (RR) and 95% confidence interval (CI), rather than odds ratio (OR) and 95% CI, to estimate the risk of adverse events because the interpretation of the OR is more difficult, and it may produce inflated estimates of risk when the outcomes are frequent, as are minor adverse events.
Dealing with missing data
Selective reporting of outcomes in some included studies may result in missing data. We based the analysis on available data but the potential impact of missing data on the findings of the review is addressed in the Discussion section.
Assessment of heterogeneity
We assessed heterogeneity across studies using the Chi2 test. We took a conservative approach, as the test for heterogeneity has low statistical power (Petitti 1994), whereby heterogeneity was assumed if the P value for the test was less than 0.10. We addressed the possible causes of heterogeneity across studies in the Discussion section.
Assessment of reporting biases
Reporting biases, especially publication bias, may be expected to occur in the majority of systematic reviews. Unfortunately there is no reliable method to detect publication bias. We examined the possibility of selective reporting of outcomes and its potential impact on the findings of the review is addressed in the Discussion section.
Data synthesis
Due to the small number of efficacy studies and differences between them in dose schedule, vaccine characteristics, case definitions and background pertussis incidence, we considered a meta‐analysis of the efficacy data inappropriate. In any event, the adjusted absolute and relative vaccine efficacies in these studies were reported as percentages and RR, respectively. Data in this form cannot be entered into RevMan 2012.
We synthesised safety data using meta‐analysis routines available in RevMan 2012. In the original review, the fixed‐effect model was used for meta‐analysis when the endpoints were homogeneous and the random‐effects model was applied when there was significant heterogeneity across studies. However, this strategy is currently not recommended by The Cochrane Collaboration (Higgins 2011). In this updated review, we used only the Mantel‐Haenszel (random‐effects model) method for meta‐analysis because it is more appropriate than a fixed‐effect model and gives more conservative estimates with wider CIs when there is significant heterogeneity across studies. Otherwise, the two models generate similar results.
Subgroup analysis and investigation of heterogeneity
We analysed adverse events for the 'any' severity category. A few studies only contributed data in the 'moderate to severe' category for some reactions. We did not include these data in the analysis because we considered it inappropriate to combine them with the 'any' severity data.
We performed an analysis within the following Review Manager‐defined hierarchy of comparisons, outcomes and subcategories.
-
Comparisons: the two comparisons were (1) safety ‐ acellular versus whole‐cell vaccines; and (2) safety ‐ acellular vaccines versus placebo/DT.
-
Outcomes: each safety endpoint (as described in the Outcomes section of this review) constituted a separate outcome. We considered it inappropriate to combine data across event types (for example, 'children with any adverse event') because different studies examined different event subsets. Furthermore, data for different events were obtained from the same cohort of participants within the one study. Such data cannot be legitimately combined within Review Manager 5 (RevMan 2012), because the observations are not independent. Finally, the use of combined endpoints could lead to an increase in one type of adverse event (for example, convulsions) being offset and therefore hidden by a decrease in another type (for example, fever).
-
Subcategories: some events occurred only once in any individual, either by virtue of their nature (failure to complete the primary series and death), or because they consistently led to withdrawal from further vaccine doses (encephalopathy, convulsions and hypotonic‐hyporesponsive episodes). We analysed these events in terms of the number of participants experiencing the event out of the total receiving at least one dose of the vaccine. We analysed deaths and encephalopathy only for the primary series because follow‐up after single booster doses was generally too short to provide useful data for these potentially delayed events. We analysed convulsions and hypotonic‐hyporesponsive episodes separately for the primary series and boosters to determine if risk varied across these subcategories.
Minor adverse events often occurred more than once in any individual (after successive doses of vaccine). Data for these events were almost always reported as the number of children experiencing the event after each dose of the vaccine. Events occurring in the same individual are not independent, therefore they could not then be combined across doses. We analysed such data, therefore, using separate subcategories for each dose of the primary series and two subcategories of booster dose (acellular boosters in children who had previously been vaccinated with whole‐cell vaccines, and acellular boosters in children who had previously been vaccinated with acellular vaccines). We selected the booster subcategories on the basis of a preliminary reading of the literature, which suggested that when acellular vaccines are given after acellular priming, adverse events may be more common than when they are given after whole‐cell priming.
We could not incorporate data in the meta‐analysis for minor adverse events from studies that did not report results separately for each dose (for example, Greco 1996). We calculated a summary estimate of effect and 95% CI for each subcategory. We did not calculate an overall summary estimate for each type of adverse event for reasons given above.
Sensitivity analysis
We planned three sensitivity analyses, and conducted two. The first compared random‐ and fixed‐effect analyses to determine whether the conclusions were sensitive to model selection.
The second pre‐planned sensitivity analysis dropped any study which contributed more than 50% of the total weight to an endpoint. This was done in order to assess whether the summary estimate of effect was sensitive to the inclusion of individual, heavily weighted studies. The third pre‐planned sensitivity analysis would have dropped any study with inadequate allocation concealment, but we did not identify such studies from those included in the meta‐analyses.
Results
Description of studies
Results of the search
During the initial search, the MEDLINE database yielded 13,509 citations; of these, 156 were reports of possibly eligible trials. The CENTRAL database yielded 129 citations and we identified 61 as potentially eligible trials. The updated search (March 1998) yielded 172 citations; of these, 57 were reports of possibly eligible trials. From an examination of the retrieved publications, we identified 52 eligible studies, of which we included 45 in the primary review and excluded the remaining seven studies for various reasons (see Characteristics of included studies and Characteristics of excluded studies tables).
The new comprehensive search in May 2008 yielded a total of 1197 citations (451 for MEDLINE, 403 for EMBASE and 343 for CENTRAL), plus an additional 31 search results when the searches were updated in April 2009. We identified 10 additional studies, of which we included seven and excluded three studies in the updated review (see Characteristics of included studies and Characteristics of excluded studies tables).
For the 2012 update, we identified 75 search results when the search was run in May 2011 and a further 29 search results when the search was updated in January 2012; although we did not identify any new eligible studies. For this new 2014 update, we identified 54 citations when the search was run in January 2014; again we did not identify any new eligible trials.
Included studies
Studies included in the review of efficacy
We included six eligible RCTs of acellular vaccine efficacy in the review (AHGSPV 1988; Greco 1996; Gustafsson 1996; PVSG 1998; Simondon 1997; Trollfors 1995), all of which were identified by the initial search. The trial of Afari 1996 compared two formulations of an acellular vaccine with a whole‐cell vaccine but was ineligible because pertussis cases were not confirmed by any laboratory procedure. In any event, vaccine efficacy in this trial could not be calculated because no pertussis cases were reported in either the vaccine or control groups. Blennow 1988 reported the comparative efficacy of two acellular vaccines after randomised administration but did not employ active follow‐up. In addition, it inappropriately combined case data from three different vaccination schedules across two separate studies (Blennow 1988; Hedenskog 1987).
AHGSPV 1997 did not meet the active follow‐up criterion specified in this review but was a very large and well publicised study which merits some consideration. It was conducted in Sweden and involved the randomised immunisation of 82,892 infants using a British whole‐cell vaccine (Evans Medical, ex Wellcome), or one of three acellular vaccines: a two‐component (SKB), a three‐component (Chiron‐Biocine) or a four‐component (Connaught). Vaccines were given at three, five and 12 months to 72,698 infants and at two, four and six months to the remaining 10,194. Efficacy data were reported only for the three, five and 12‐month schedule. Follow‐up for the whole‐cell, three‐ and four‐component vaccines lasted for a mean of 22 months after the third dose. Part way through the trial, the two‐component acellular vaccine was shown (in Gustafsson 1996) to have an unacceptably low efficacy, so the blind was broken for infants who had received this vaccine; they were offered boosting with a three‐component vaccine, and efficacy data were only available for this group up to the time of the third dose.
Cases of whooping cough in AHGSPV 1997 were detected by surveillance of Swedish laboratories for reports of positive B. pertussis culture. Computer matching was performed on each report to determine if it originated from a study participant, and a nurse then contacted the family for clinical follow‐up. Based on the incidence of whooping cough with the two‐ and five‐component vaccines in Gustafsson 1996, this passive follow‐up method appeared to miss about 90% of cases amongst the study participants. Despite this, the RR for culture‐confirmed whooping cough (21 or more days of paroxysmal cough) in the five‐component versus the two‐component group was the same in both trials (0.25). This suggests that although the passive follow‐up in AHGSPV 1997 had a low sensitivity, it was not associated with differential case ascertainment, at least for this case definition.
Studies included in the review of safety
Fifty‐two included studies contributed safety data for one or more endpoints; of these we identified 45 in the initial search and seven in the updated search. The salient features of these trials, including details of the specific endpoints to which each trial contributed data, are summarised in the Characteristics of included studies table.
Excluded studies
We excluded 10 randomised trials from the review. The reasons for exclusion and study characteristics are summarised in the Characteristics of excluded studies table.
Risk of bias in included studies
The overall risk of bias is presented graphically in Figure 1 and summarised in Figure 2.

'Risk of bias' graph: review authors' judgements about each risk of bias item presented as percentages across all included studies.

'Risk of bias' summary: review authors' judgements about each risk of bias item for each included study.
Allocation
Most of the safety trials did not describe the methods for random sequence generation and allocation concealment, which made it difficult to assess the risk of selection bias. However, selection bias may nevertheless have affected the assessment of adverse events at other than the first vaccine dose. This is because children were more likely to be withdrawn due to adverse events after whole‐cell than after acellular vaccines. The incidence of adverse events in the whole‐cell group after subsequent vaccine doses would be lower than if these children had remained in the study and this bias would tend to reduce the apparent difference in reactogenicity between the whole‐cell and acellular vaccines. Selection bias may also have occurred in Pichichero 1996, a booster dose study performed as a follow‐on to Pichichero 1993 and Pichichero 1994, in which parents of only 83% of the participants who had enrolled in the primary series studies elected to have their child continue into the booster study.
Blinding
To be eligible for inclusion, a claim of double‐blinding had to be made in the study report. However, most of the safety trials did not provide details about the methods of blinding.
Bias in case ascertainment may have occurred in Gustafsson 1996 and possibly Greco 1996, due to partial unblinding of the whole‐cell vaccine. It is uncertain in which direction such a bias may have operated. On the one hand, whole‐cell vaccines are generally perceived to be effective, so one might expect any bias to favour of the whole‐cell preparations. On the other hand, Europe has a history of withdrawal of wP vaccines due to inadequate efficacy, so observers in these European studies might have been biased against the whole‐cell vaccines. In any event, the codified, active case ascertainment procedures used in the included studies would have minimised the potential for observer bias from any source. Moreover, observer bias alone would seem an unlikely explanation for the very low efficacy of the whole‐cell vaccines in these two studies. Finally, unblinding of the whole‐cell vaccine groups would not have affected the acellular versus placebo/DT comparisons.
Pertussis in immunised children tends to have a milder clinical course than in those who are not immunised. Such milder cases may be selectively excluded, leading to over‐estimation of absolute vaccine efficacy (Fine 1997). Laboratory confirmation of cases did not eliminate this bias, because participants had to exhibit clinical symptoms (generally at least seven days of cough) before laboratory samples were collected. This problem should not occur in direct comparisons of acellular and whole‐cell vaccines.
The partial unblinding in Gustafsson 1996, Halperin 2003 and possibly Greco 1996 might have biased the assessment of adverse events in favour of the acellular preparations. However, the only summary odds ratios (ORs) that were materially altered in the sensitivity analysis, which excluded these studies, were those for drowsiness and vomiting ‐ endpoints which should be interpreted with caution due to other problems.
In all studies, detection bias could have arisen in the assessment of minor adverse event incidence because reactions to whole‐cell vaccines tended to be more severe than those to acellular vaccines (more severe reactions would be more likely to be noticed by the parents). However, the requirement for parents to look for specific events and complete diaries or forms at regular intervals would have reduced the potential for such differential reporting.
Incomplete outcome data
Follow‐up in all but one study was balanced across the vaccine groups and covered over 90% of available participants at each vaccine dose; the exception was Simondon 1996. The rates of withdrawal and loss to follow‐up were high in this study, which was included for safety only. Eighty‐one per cent of the acellular group and 87% of the whole‐cell group contributed data after the first dose. Data for minor adverse events were available for less than 80% of vaccinated individuals after the second and third doses, and so we excluded these doses from the review, in accordance with the pre‐defined data extraction rules. In addition, we conducted a sensitivity analysis in which this study was excluded entirely.
Active case ascertainment was a requirement for inclusion in the efficacy review. All but one of the studies included in the review of safety actively questioned parents at regular intervals regarding prospectively defined adverse events, using standardised forms or diaries; the exception was AHGSPV 1997. This large study, which enrolled over 80,000 infants, did not examine minor adverse events. Data for serious adverse events were collected from participating physicians and child health nurses, by weekly surveillance of admissions to hospitals within the study area (which covered much of Sweden) and by questioning parents at the time of each vaccine dose, and when the child was aged 18 months. It is possible that this type of follow‐up may have led to under‐reporting of serious adverse events. However, while reducing the power of the study to detect a significant difference, there is no reason to suspect that any such under‐reporting would have been differential, or introduced a systematic bias. Nevertheless, we conducted sensitivity analyses, eliminating this study from the endpoints to which it contributed, to determine if the summary ORs were materially affected.
Selective reporting
Some studies reported results for only a subset of the adverse events for which data had been collected. Vomiting was the endpoint most affected, with up to 11 studies collecting data but failing to report it (Bernstein 1992; Bernstein 1994; Blennow 1988; Edwards 1986a; Edwards 1986b; Feldman 1992; Feldman 1993; Halperin 1996; Marcinak 1993; Pichichero 1993; Pichichero 1997). Six studies collected data on drowsiness and did not report it (Edwards 1986a; Edwards 1986b; Kanra 1993a; Kanra 1993b; Pichichero 1993; Pichichero 1997), while data for anorexia were collected but not reported in three studies (Blennow 1988; Pichichero 1993; Trollfors 1995). Qualitative statements within some reports indicated that data for these events had been omitted because they had occurred with similar frequency in each vaccine group. In contrast, those studies which did include extractable data generally reported a significant difference. Accordingly, there is a possibility that inclusion of the missing data could significantly alter the pooled ORs for these endpoints.
Other potential sources of bias
1. Bias introduced by the methods of the review
a) Study selection and data extraction
The review author was not blinded to study authorship or journal of publication, allowing the potential for bias during study selection and data extraction. The use of predefined criteria for study inclusion and rules for data extraction helped to minimise this potential. While desirable, the need for review author blinding during study selection and data extraction is unproven. Berlin and co‐workers have shown that rigorous blinding had neither a clinically nor statistically significant effect on the summary OR in a random sample of five meta‐analyses (Berlin 1997).
b) Publication bias
It is well recognised that studies reporting statistically significant results are more likely to be published than those that do not (Mahid 2008). The review is potentially subject to bias arising from this source because the databases we searched for eligible trials only included published studies. While it would be desirable to identify unpublished studies and include these in the review, this was precluded by resource limitations. Although we may have missed small unpublished studies of vaccine safety in this manner, it seems unlikely that an efficacy or safety trial large enough to materially affect the conclusions of the review would have been suppressed from publication.
Publication bias also occurred within studies and took two forms. The first involved the selective reporting of events as previously mentioned. The second type of within‐study publication bias was the tendency to collect adverse event data at several time points and then report the time point which showed the maximum difference between vaccines. This is not a problem as long as one remains aware that the summary results reflect the maximum observable difference between vaccines and not the difference at a specific time point.
2. Confounding in the included studies
a) Confounding due to the use of erythromycin for post‐exposure prophylaxis of pertussis contacts
Erythromycin prophylaxis would not confound the assessment of vaccine safety. By reducing the number of pertussis cases observed in a study it could widen the CI for vaccine efficacy but as long as its use was not associated with one or other vaccine type, then it should not act as a confounder. Equivalent use would be expected in double‐blind studies but there is some doubt that all the efficacy studies in this review were truly blinded in respect to the whole‐cell vaccines. Gustafsson 1996 and possibly Greco 1996 used identifiable whole‐cell vaccines and in all studies the rate of adverse reactions following whole‐cell vaccines was appreciably higher than after the acellular vaccines or placebo/DT. These factors may have led to partial unblinding of the whole‐cell vaccines during the efficacy follow‐up period, which in turn may have allowed differential use of erythromycin prophylaxis.
Greco 1996 made no statement regarding erythromycin prophylaxis during the study. In Gustafsson 1996, prophylaxis was assumed to occur in accordance with Swedish guidelines, which recommend it only in infants under six months of age. Actual prophylaxis use was not documented in the trial, but if the assumption is valid then it should not have affected the main efficacy follow‐up period (which started after the third vaccine dose, at the age of six months). In another Swedish study, AHGSPV 1988, the first vaccination was scheduled at a minimum age of five months in order to avoid potential problems due to use of prophylaxis during the efficacy follow‐up period (which began at a minimum age of seven months). In any case, this study did not use a whole‐cell vaccine, and blinding of the two acellular vaccines and placebo was confirmed by a questionnaire. In a third Swedish study, Trollfors 1995, prophylaxis use was low (six per cent) and equivalent in the two study groups. Simondon 1997 and PVSG 1998 included no information on this topic. The study vaccines were adequately blinded at administration, but partial unblinding may have occurred during the efficacy assessment due to a higher incidence of adverse events in the whole‐cell arms. In theory this might have provided the opportunity for differential use of prophylaxis but the probability of such bias seems low.
Overall, erythromycin prophylaxis appears unlikely to have significantly confounded the estimation of vaccine efficacy.
b) Confounding due to the use of antipyretic/analgesic medication
The use of antipyretic/analgesic medication would be a potential confounding factor in the assessment of reactogenicity. Truly prophylactic use (i.e. use before a fever or pain appeared) should be non‐differential in a blinded study, but by lowering the incidence of fever and pain in each treatment group, it would reduce the ability to detect a difference between vaccines. Antipyretic/analgesic medication might also be used in a 'reactive' fashion after a low fever or mild pain had occurred, in order to prevent a higher fever or more severe pain. One would expect this type of use to be differential (more common with the more reactogenic vaccines). The result would be to reduce the apparent difference between vaccines in the incidence of severe fever or pain. It would also reduce the apparent difference in the incidence of systemic events that may be associated with a high fever, such as convulsions, irritability, anorexia, vomiting, drowsiness and withdrawal from the study.
No study report specifically stated that prophylactic use of antipyretic/analgesic medications was permitted. A few stated that it was not permitted, or that it was discouraged, while most made no statement. Similarly, only a few studies documented 'reactive' use of antipyretic/analgesic medication. It is worth noting that where such use was recorded, parents were asked to give the drug only when the child's temperature had reached a point higher than that used for defining fever in the analysis of reactogenicity, or if the child was in obvious pain or distress. This would have served to minimise the effect on the assessment of fever and other minor adverse events.
Allowance for undocumented antipyretic/analgesic use would strengthen the conclusion that acellular vaccines are less reactogenic that the whole‐cell vaccines, but weaken the finding of no significant difference between the acellular vaccines and placebo.
Effects of interventions
Primary outcome
Absolute vaccine efficacy ‐ whooping cough
Four of the eligible efficacy trials included a randomised placebo/diphtheria‐tetanus (DT) group and were able to determine the absolute efficacy of acellular vaccines against a case definition identical to, or closely approximating 'whooping cough', as specified in this review. These results are summarised below. 'All': efficacy (with 95% confidence interval (CI), where reported) in participants receiving all scheduled vaccine doses; "≥ 1 immunisation (immunis) dose": efficacy (with 95% CI, where reported) in participants receiving at least one dose of the randomised vaccine. See Characteristics of included studies table for information on the composition of each vaccine.
Study: Trollfors 1995
Dose schedule: 3, 5 and 12 months.
Vaccine: Amvax [1] ‐ All: 71% (63 to 78); ≥ 1 immunisation dose: not reported.
Study: AHGSPV 1988
Dose schedule: 5 to 11, and 7 to 13 months.
Vaccine: JNIH7 [1] ‐ All: 78% (57 to 88); ≥ 1 immunisation dose: not reported.
Vaccine: JNIH6 [2] ‐ All: 78% (58 to 89), ≥ 1 immunisation dose: not reported.
Study: Greco 1996
Dose schedule: two, four and six months.
Vaccine: SKB [3] ‐ All: 84% (76 to 89); ≥ 1 immunisation dose: 82% (73 to 87).
Vaccine: Chiron‐Biocine [3] ‐ All: 84% (76 to 90); ≥ 1 immunisation dose: 84% (76 to 89).
Vaccine: Connaught [W] ‐ All: 36% (14 to 52); ≥ 1 immunisation dose: 34% (13 to 50).
Study: Gustafsson 1996
Dose schedule: two, four and six months.
Vaccine: SKB [2] ‐ All: 59% (51 to 66); ≥ immunisation dose: 59% (51 to 66).
Vaccine: Connaught [5] ‐ All: 85% (81 to 89); ≥ immunisation dose: 84% (80 to 88).
Vaccine: Connaught [W] ‐ All: 48% (37 to 58); ≥ immunisation dose: 48% (37 to 57).
In the trial of PVSG 1998, comparison with a non‐randomised controlled trial (RCT) DT control group gave an estimated absolute efficacy against whooping cough of 84% (95% CI 77% to 89%) for the whole‐cell vaccine and 79% (95% CI 72% to 85%) for the acellular vaccine. In Simondon 1997, a substudy examined the incidence of whooping cough in vaccine recipients who came into household contact with confirmed pertussis cases. In this substudy, comparison with an unvaccinated control group gave an estimated absolute efficacy of 96% for the whole‐cell vaccine and 85% for the acellular vaccine.
Relative vaccine efficacy ‐ whooping cough
Four eligible studies determined the relative risk of whooping cough after administration of acellular vaccines compared to that after whole‐cell vaccines. Results are summarised below. Risk ratios (RRs) are expressed in relation to the incidence in the whole‐cell vaccine group. A RR < 1.0 favours the acellular vaccine.
Study: Greco 1996
Dose schedule: two, four and six months.
Whole‐cell comparator: Connaught [W].
Vaccine: SKB [3] ‐ All: 0.25 (0.17 to 0.36); ≥ 1 immunisation dose: 0.28 (0.20 to 0.39).
Vaccine: Chiron‐Biocine [3P] ‐ All: 0.25 (0.17 to 0.36); ≥ 1 immunisation dose: 0.25 (0.17 to 0.36).
Study: Gustafsson 1996
Dose schedule: two, four and six months.
Whole‐cell comparator: Connaught [W].
Vaccine: SKB [2] ‐ All: 0.83 (0.65 to 1.05); ≥ 1 immunisation dose: 0.83 (0.66 to 1.05).
Vaccine: Connaught [5] ‐ All: 0.29 (0.21 to 0.40); ≥ 1 immunisation dose: 0.30 (0.22 to 0.42).
Study: PVSG 1998
Dose schedule: 2, 4 to 10, 6 to 12, and 15 to 18 months.
Whole‐cell comparator: Lederle [W].
Vaccine: Lederle/Takeda [4] ‐ All: 2.1 (upper 1‐sided 95% CI = 3.3); ≥ 1 immunisation dose: not reported.
Study: Simondon 1997
Whole‐cell comparator: Pasteur‐Merieux [W].
Dose schedule: two, four and six months.
Pasteur‐Merieux [2] ‐ All: 2.42 (1.35 to 4.34); ≥ 1 immunisation dose: 2.06 (1.25 to 3.39).
As previously noted, AHGSPV 1997 did not meet the active follow‐up criterion specified in this review, but the passive follow‐up method used in that trial (although low in sensitivity) did not appear to be associated with differential case ascertainment for the 'whooping cough' case definition. Results from this study are summarised below:
Study: AHGSPV 1997
Dose schedule: 3, 5 and 12 months.
Whole‐cell comparator: Evans Medical [W].
Vaccine: Chiron‐Biocine [3] ‐ All: 2.55 (1.50 to 4.33); ≥ 1 immunisation dose: 1.84 (1.36 to 2.51).
Vaccine: Connaught [5] ‐ All: 1.40 (0.78 to 2.52); ≥ 1 immunisation dose: 1.25 (0.90 to 1.75).
Thus, the efficacy of the five‐component vaccine against this case definition was not significantly different to that of the whole‐cell vaccine, whereas that of the three‐component vaccine was. While this suggests that the five‐component vaccine may have an advantage over the three‐component, it should be noted that the two acellular vaccines were not actually significantly different from each other (the 95% CIs overlapped). Furthermore, any conclusions from this study must be tempered by its reliance on passive follow‐up.
Absolute vaccine efficacy ‐ pertussis disease
Four trials determined absolute vaccine efficacy against pertussis disease, as defined in this review. These results are summarised below:
Study: Trollfors 1995
Dose schedule: 3, 5 and 12 months.
Vaccine: Amvax [1] ‐ All: 54% (43 to 63); ≥ 1 immunisation dose: not reported.
Study: AHGSPV 1988
Dose schedule: 5 to 11, and 7 to 13 months.
Vaccine: JNIH7 [1] ‐ All: 41% (12 to 60); ≥ 1 immunisation dose: not reported.
Vaccine: JNIH6 [2] ‐ All: 58% (35 to 73); ≥ 1 immunisation dose: not reported.
Study: Greco 1996
Dose schedule: two, four and six months.
Vaccine: SKB [3] ‐ All: 71% (61 to 78); ≥ 1 immunisation dose: not reported.
Vaccine: Chiron‐Biocine [3] ‐ All: 71% (61 to 79); ≥ 1 immunisation dose: not reported.
Vaccine: Connaught [W] ‐ All: 23% (1 to 40); ≥ 1 immunisation dose: not reported.
Study: Gustafsson 1996
Dose schedule: two, four and six months.
Vaccine: SKB [2] ‐ All: 44% (35 to 52); ≥ 1 immunisation dose: 44% (35 to 52).
Vaccine: Connaught [5] ‐ All: 78% (73 to 83); ≥ 1 immunisation dose: 78% (73 to 83).
Vaccine: Connaught [W] ‐ All: 42% (30 to 51); ≥ 1 immunisation dose: 41% (30 to 50).
In PVSG 1998, comparison with a non‐RCT DT control group gave an estimated absolute efficacy against pertussis disease of 83% (95% CI 76% to 88%) for the whole‐cell vaccine and 72% (95% CI 62% to 79%) for the acellular vaccine.
Relative vaccine efficacy ‐ pertussis disease
One trial determined relative vaccine efficacy against pertussis disease, as defined in this review. The results of this trial are summarised below.
Study: Simondon 1997
Whole‐cell comparator: Pasteur‐Merieux (W).
Dose schedule: two, four and six months.
Pasteur‐Merieux [2] ‐ All: 1.54 (1.23 to 1.94); ≥ 1 immunisation dose: 1.43 (1.16 to 1.74).
Secondary outcomes
Comparison of acellular and whole‐cell vaccines
Seven additional trials identified by the updated search (2009) provided available data only for minor adverse events. Updated meta‐analysis including the data from these seven trials did not significantly alter the results of any endpoint (Appendix 7).
1. Failure to complete all scheduled doses of the primary immunisation series because of adverse events
The risk of failure to complete the primary series because of adverse events was significantly lower in acellular vaccine recipients compared to those immunised with whole‐cell vaccines (11 trials with a total of 108,909 participants, RR 0.23, 95% CI 0.12 to 0.43, P value < 0.00001) (Analysis 1.1).
2. Mortality due to any cause
The risk of death due to any cause did not differ significantly between acellular and whole‐cell recipients (nine trials with a total of 122,451 participants, RR 0.87, 95% CI 0.62 to 1.22, P value = 0.41) (Analysis 1.2).
3. Mortality due to infection
The risk of death due to infection did not differ significantly between acellular and whole‐cell recipients (two trials with a total of 34,498 participants, RR 0.97, 95% CI 0.23 to 4.16, P value = 0.97) (Analysis 1.3).
4. Encephalopathy
No cases of encephalopathy after primary series immunisation were observed in 81,601 acellular and 32,161 whole‐cell vaccine recipients (Analysis 1.4).
5. Convulsions
The risk of convulsion after primary series immunisation was significantly lower in acellular vaccine recipients compared to those immunised with whole‐cell vaccines (nine trials with a total of 124,387 participants, RR 0.47, 95% CI 0.31 to 0.73, P value = 0.0007) (Analysis 1.5)
6. Hypotonic‐hyporesponsive episodes
The risk of hypotonic‐hyporesponsive episodes after primary series immunisation was significantly lower in acellular vaccine recipients compared to those immunised with whole‐cell vaccines (six trials with a total of 121,573 participants, RR 0.26, 95% CI 0.08 to 0.81, P value = 0.02) (Analysis 1.6). No hypotonic‐hyporesponsive episodes were recorded after any booster dose in the 2171 acellular and 316 whole‐cell vaccine recipients for whom data were available (Appendix 8).
7. Minor adverse events
Minor adverse events (anorexia, drowsiness, fever, irritability/fretfulness, prolonged crying, vomiting, injection site pain/tenderness/redness/swelling) after most vaccine doses were significantly less common in acellular vaccine recipients than in those immunised with whole‐cell vaccines (Analysis 1.7 to Analysis 1.15).
We conducted two pre‐planned sensitivity analyses. The first compared random‐effects and fixed‐effect analyses to determine whether the conclusions were sensitive to model selection. This led to changes from a non‐significant difference (a random‐effects model) to a significant difference in favour of acellular vaccines for two endpoints: vomiting (the third primary dose and booster after acellular priming), and drowsiness (the first primary dose). The second repeated the random‐effects analysis after removing, from each endpoint, any study allocated more than 50% of the total weight in the original analysis. This led to changes from a significant difference in favour of acellular vaccines to a non‐significant difference for vomiting after the first and second primary series doses.
We performed an unplanned sensitivity analysis excluding AHGSPV 1997. This was the largest study in the review and differed from the others in that follow‐up was not fully active. Removal of this study did not change the significance or otherwise of any endpoints.
We performed a second unplanned sensitivity analysis excluding three studies with possible inadequate blinding (Greco 1996; Gustafsson 1996; Halperin 2003). This resulted in the summary OR for drowsiness changing from non‐significant to significant (in favour of acellular vaccines), while that for vomiting after the first and second primary series doses changed from significant to non‐significant.
No analysis of any endpoint resulted in a RR that significantly favoured whole‐cell vaccines.
We also examined the incidence of minor adverse events in cohorts of children after successive doses of acellular and whole‐cell vaccines. The incidence of anorexia and vomiting fell with successive doses of the primary series for both acellular and whole‐cell vaccines. The incidence of irritability and injection site pain/tenderness remained relatively constant, whereas the incidence of fever, local redness and swelling/induration increased markedly over the primary series of acellular vaccines (Appendix 9).
The incidence of minor adverse reactions in children boosted with acellular vaccines after whole‐cell priming was lower than if whole‐cell vaccines were used for every dose. However, an unexpected rise in the incidence of fever, irritability, local pain, redness and swelling was seen among children primed and boosted with acellular vaccines compared with those boosted with acellular vaccines after whole‐cell priming (Appendix 10).
Comparison of acellular vaccines and placebo/DT
The number of studies and participants in this comparison was considerably less than in the comparison of acellular with whole‐cell vaccines, with a maximum of four studies contributing data to any endpoint. No booster data were available (Appendix 11; Appendix 12).
1. Failure to complete all scheduled doses of the primary immunisation series because of adverse events
There was no statistically significant difference between acellular and placebo/DT recipients in terms of the risk of failure to complete the primary series because of adverse events (four trials with a total of 25,901 participants, RR 0.70, 95% CI 0.38 to 1.29, P value = 0.25) (Analysis 2.1).
2. Mortality due to any cause
The risk of death due to any cause did not differ significantly between acellular and placebo/DT recipients (four trials with a total of 25,901 participants, RR 1.08, 95% CI 0.26 to 4.42, P value = 0.91) (Analysis 2.2).
3. Mortality due to infection
The risk of death due to infection did not differ significantly between acellular and placebo/DT recipients (four trials with a total of 25,901 participants, RR 1.21, 95% CI 0.19 to 7.80, P value = 0.84) (Analysis 2.3).
4. Encephalopathy
No cases of encephalopathy after primary series immunisation were observed in 14,521 acellular and 4129 placebo/DT recipients (Analysis 2.4).
5. Convulsions
There was no statistically significant difference between acellular and placebo/DT recipients in terms of the risk of convulsion after primary series immunisation (four trials with a total of 25,901 participants, RR 0.44, 95% CI 0.12 to 1.69, P value = 0.23) (Analysis 2.5)
6. Hypotonic‐hyporesponsive episodes
The risk of hypotonic‐hyporesponsive episodes after primary series immunisation did not differ significantly between acellular and placebo/DT recipients (four trials with a total of 25,901 participants, RR 0.29, 95% CI 0.02 to 5.13, P value = 0.40) (Analysis 2.6).
7. Minor adverse events
There was no statistically significant difference between acellular and placebo/DT in terms of the risk of minor adverse events (anorexia, drowsiness, fever, irritability/fretfulness, prolonged crying, vomiting, injection site pain/tenderness, injection site redness and injection site swelling/induration) after most vaccine doses (Analysis 2.7 to Analysis 2.15).
Most endpoints in this comparison were homogeneous. For these, the fixed‐effect analysis differed from the random‐effects analysis in only three cases: the RRs for convulsions in the primary series and swelling/induration after the first two primary doses were significantly in favour of placebo/DT in the fixed‐effect analysis but non‐significant in the random‐effects analysis.
We conducted a second planned sensitivity analysis in which the random‐effects analysis was repeated after removing from each endpoint any study which had been assigned more than 50% of the total weight. A number of endpoints contained data from only a single study and were thus not evaluable after that study had been excluded. In addition, the RR for swelling/induration after the second dose became significant and after the third dose became non‐significant.
No analysis of any endpoint resulted in a RR which significantly favoured acellular vaccines over placebo/DT.
Discussion
Summary of main results
Efficacy
Due to a small number of efficacy trials and significant heterogeneity across studies regarding immunisation schedules, case definitions, follow‐up duration and background pertussis rates, it was not applicable to conduct a meta‐analysis in this review to estimate the pooled efficacy of acellular pertussis vaccines against whooping cough. However, some considerations could be made on the basis of the data from six included trials.
Firstly, comparisons across studies suggest that multi‐component (≥ three) acellular vaccines have a higher efficacy than one‐ and two‐component vaccines against both typical whooping cough (characterised by 21 or more consecutive days of paroxysmal cough with confirmation of B. pertussis infection by culture, appropriate serology or contact with a household member who has culture‐confirmed pertussis) and mild pertussis disease (characterised by seven or more consecutive days of cough with confirmation of B. pertussis infection by culture or appropriate serology) (WHO 1991). The efficacy of multi‐component vaccines varied from 84% to 85% in preventing typical whooping cough and from 71% to 78% in preventing mild pertussis disease (Greco 1996; Gustafsson 1996). In contrast, the efficacy of one‐ and two‐component vaccines varied from 59% to 78% against typical whooping cough and from 41% to 58% against mild pertussis disease (AHGSPV 1988; Trollfors 1995). The superiority of five‐component vaccines over two‐component vaccines in preventing typical whooping cough has been confirmed by direct comparison of such vaccines in the trials of Gustafsson 1996 and AHGSPV 1997. However, the data are insufficient to determine whether there is a clinically significant difference between three‐ and five‐component vaccines. Comparisons across trials do not confirm such a difference. A small and statistically non‐significant difference was observed in the trial of AHGSPV 1997, but incomplete case ascertainment would have reduced the statistical power of the study.
Secondly, not all whole‐cell vaccines are efficacious, as has traditionally been thought, as evidenced by the low efficacy of the Connaught whole‐cell vaccine used in the trials of Greco 1996 (efficacy: 36%; 95% confidence interval (CI) 14% to 52%) and Gustafsson 1996 (efficacy: 48%; 95% CI 37% 58%). This makes it more difficult to interpret the results of direct efficacy comparisons between acellular vaccines and whole‐cell vaccines across studies. The multi‐component (≥ 3) acellular vaccines are more effective than low‐efficacy whole‐cell vaccines, but may be less effective than the highest‐efficacy whole‐cell vaccines in preventing whooping cough (AHGSPV 1997; Greco 1996; Gustafsson 1996; PVSG 1998; Simondon 1997).
Thirdly, randomised controlled trials (RCTs) generally measure vaccine efficacy but not the effectiveness of a large‐scale vaccination programme. Compliance with immunisation is likely to be higher in these studies than would be expected in actual practice and 'real world' effectiveness would probably be correspondingly lower. Having said this, it is encouraging that where data were available for the population who did not complete all scheduled doses, efficacy was only marginally lower than in those who had received all vaccine doses. Moreover, the effectiveness of national vaccination programmes with acellular pertussis (aP) vaccines in preventing whooping cough in children has been shown in Japan, the United States and Canada, where such vaccines have been routinely used among infants and young children (Bettinger 2007; Bisgard 2005; Kuno‐Sakai 2004; Watanabe 2005). In contrast, recent research from Queensland, Australia (Sheridan 2012) and Oregon, United States (Liko 2013) suggests that children primed with acellular rather than whole‐cell pertussis vaccine are at a higher risk of subsequent pertussis. The authors raised the hypothesis that the recent pertussis epidemic in many high‐income countries might be related to the shift from whole‐cell pertussis (wP) to aP vaccines. However, further nationwide studies are needed to test this hypothesis.
Safety
The comparison of acellular vaccines with whole‐cell vaccines displays that the former have a better safety profile. The superiority of acellular vaccines over whole‐cell vaccines is evident for all selected minor reactions during the primary and booster doses. The incidence of primary series non‐completion due to adverse events is significantly lower for acellular vaccines than for whole‐cell vaccines. Acellular vaccines are also less likely to cause febrile convulsions and hypotonic‐hyporesponsive episodes during the primary series. A benefit has not been seen in respect to febrile convulsions after booster doses, hypotonic‐hyporesponsive episodes after booster doses or encephalopathy during the primary series, but the former was very uncommon, while the latter two were non‐existent with either type of vaccine. The risk of death due to any cause, and death due to infection, were similar between acellular and whole‐cell vaccine recipients.
The comparison of acellular vaccines with placebo/DT also reveals a good safety profile of such vaccines. There is no significant difference between acellular vaccines and placebo/DT in the incidence of severe or minor adverse events, with the exception of injection site swelling, which was significantly more common among recipients of acellular vaccines than placebo/DT after the third dose during the primary series. However, given the uncommon occurrence of severe adverse reactions, the statistical power of this meta‐analysis may be not enough to detect small but clinically relevant differences between acellular vaccines and placebo/DT. In this sense, continuing surveillance for rare severe adverse reactions of aP vaccines may be warranted.
Two points about minor adverse events of acellular vaccines deserve special comment. Firstly, a significant increase in incidence (number of events per 1000 recipients) from the first dose to the third dose during the primary series has been observed for some minor adverse reactions, such as fever (from 60 to 162), local redness (from 96 to 162) and swelling (from 117 to 275). In spite of this increase, the incidence of these minor adverse events among recipients of acellular vaccines is still lower than that among recipients of whole‐cell vaccines. Secondly, the incidence of adverse reactions in children boosted with acellular vaccines after whole‐cell priming is lower than if whole‐cell vaccines are used for every dose. Comparison across studies displays a rise in the incidence of some minor adverse reactions (fever, irritability, local pain, redness and swelling) among children primed and boosted with acellular vaccines compared with those boosted with acellular vaccines after whole‐cell priming. The rate of reported injection site reactions continues to increase after the fifth consecutive dose of aP vaccine at four to six years of age. Although redness and swelling increase to rates similar to those associated with five consecutive doses of whole‐cell vaccine, injection site tenderness after five does of acellular vaccine is significantly lower than after five doses of whole‐cell vaccine, and the vaccine is preferred by parents of these preschool‐aged children. These increases in injection site reactions may have limited clinical implications as the current evidence suggests an acceptable safety profile of acellular vaccines for booster doses among preschool children and adolescents who had been primed with acellular vaccines (Jacquet 2006; Pichichero 2005; Pichichero 2006).
Overall completeness and applicability of evidence
This review provides evidence to answer the questions posed in the Objectives section.
1. Do acellular vaccines protect against pertussis?
All aP vaccines reported in the efficacy trials protect against pertussis. Acellular vaccines with three or more components (multi‐component vaccines) are effective against both classical whooping cough and mild pertussis disease.
2. Do different types of acellular vaccine confer different levels of protection?
Currently available evidence suggests that multi‐component vaccines confer better protection against both classical whooping cough and mild pertussis infection than vaccines containing only one or two components. However, the clinical implication of any possible superiority of multi‐component vaccines over mono‐ and bivalent vaccines in the efficacy demonstrated by RCTs should be considered with caution. The effectiveness of vaccination programmes on a national scale for controlling infectious disease depends not only on the efficacy of the vaccine, but also other factors such as the vaccination schedule and adherence, and transportation and storage of the vaccine. Moreover, indirect effects in producing herd immunity in the population may also contribute to the effectiveness of large‐scale vaccination in controlling infectious diseases (Carlsson 2009; Stephens 2008). Therefore, successful control of pertussis infections by two‐component vaccines in Japan and in other countries (Carlsson 2009; Hviid 2004; Kuno‐Sakai 2004) does not necessarily exclude the potential additional benefits of large‐scale vaccination with multi‐component vaccines.
3. Do acellular vaccines protect against pertussis to the same degree as the whole‐cell vaccines which they are intended to replace?
The answer here remains unclear because the effectiveness of whole‐cell vaccines varies and there are limited efficacy and effectiveness data with different whole‐cell vaccines. Studies to date indicate that multi‐component acellular vaccines are more effective than low‐efficacy whole‐cell vaccines but may be less effective than the highest‐efficacy whole‐cell vaccines.
4. Do acellular vaccines cause fewer side effects than whole‐cell vaccines?
Acellular vaccines cause fewer side effects than whole‐cell vaccines during the primary immunisation series, when used as a booster in toddlers and four‐to‐six‐year‐olds who have previously received whole‐cell vaccines, and when used in toddlers after acellular priming.
Quality of the evidence
As previously mentioned, meta‐analysis was not applicable in this review to estimate the pooled efficacy. However, three large, double‐blind RCTs from Italy, Sweden and Germany (Greco 1996; Gustafsson 1996; PVSG 1998) provide high‐level evidence about effectiveness of multi‐component aP vaccines against whooping cough.
Regarding the safety profile, meta‐analysis of 52 studies provides robust evidence about the superiority of aP vaccines over whole‐cell vaccines. However, the heterogeneity of results across studies deserves special consideration.
Heterogeneity in the meta‐analysis of safety endpoints
Many of the safety endpoints in the comparison of acellular with whole‐cell vaccines displayed significant heterogeneity. This heterogeneity did not invalidate the finding of significant differences for various endpoints because the point estimates for the individual studies were almost always in favour of the acellular vaccines. In other words, the individual study results were quantitatively but not qualitatively different.
Possible explanations for the heterogeneity, which was sometimes substantial, include the following.
-
Differences between studies in the definition or recording of adverse events. For example, the threshold for fever differed slightly amongst studies, albeit within the confines of the definition specified in the review. Prolonged crying was defined as longer then one hour in some studies and longer than three hours in others. In some studies the mildest recorded category of redness or swelling was 'any', whereas in others it was a diameter of one centimetre. Some studies reported the incidence of events within a certain time period of each dose, whereas others reported the incidence at a specific time point.
-
The use of different immunisation schedules. Most studies used a two‐, four‐ and six‐month schedule for the primary series but others used a three‐, five‐ and 12‐month schedule. AHGSPV 1988 used a 5 to 11‐month, and 7 to 14‐month schedule. The difference in reactogenicity between acellular and whole‐cell vaccines has been shown to be less with the earlier dose schedule, primarily because the reactogenicity of whole‐cell vaccines increases with the age of administration (for example, in Miller 1997).
-
Differences in the reactogenicity of separate acellular vaccines. This is a possibility, although a number of head‐to‐head studies of acellular vaccines have not shown any consistent differences (for example, AHGSPV 1988; AHGSPV 1997; Decker 1995; Englund 1994a; Greco 1996; Pichichero 1997).
-
Differences in the reactogenicity of the whole‐cell vaccines used as controls.
-
Differences in the duration over which adverse events were recorded.
-
Differences in the susceptibility of different patient populations (for example, different racial groups) to adverse events after pertussis immunisation.
-
Given the large number of endpoints examined in the review and the conservative critical value for determining heterogeneity, approximately 10% of the endpoints would be expected to fail the test of homogeneity by chance alone.
A special comment is warranted about drowsiness after the first and second doses of the primary series. The statistical test displays an extreme heterogeneity for this endpoint and it strongly suggests inconsistent findings across studies. By visual inspection of the forest plot, we identified that Gustafsson 1996 was responsible for this extreme heterogeneity. In contrast with other studies, Gustafsson 1996 demonstrated the results in favour of whole‐cell vaccines. This is only one safety endpoint where the superiority of whole‐cell vaccines over acellular vaccines was reported. Partial unblinding of the whole‐cell vaccine arm occurred in this trial but the expected effect of unblinding would be to bias the assessment of adverse events in favour of the acellular preparations. We have no plausible explanations for this finding.
Potential biases in the review process
The potential sources and impact of bias and confounding have been addressed in the Risk of bias in included studies section. In addition to the potential bias and confounding, the following limitations of the review should also be noted.
-
The review examines the safety of acellular vaccines as a group and does not attempt to determine whether different vaccines have different safety profiles.
-
The absence of statistically significant differences between acellular vaccines and placebo/DT in respect to severe adverse events may be due to a lack of statistical power in the meta‐analysis, rather than a true lack of difference.
-
The review is based entirely on public domain information and did not use any confidential vaccine manufacturer data that might contribute to the decisions of regulatory agencies.
Agreements and disagreements with other studies or reviews
We searched CENTRAL, MEDLINE and EMBASE for systematic reviews of pertussis vaccines and identified 11 papers. Two could be compared to our review (Casey 2005; Jefferson 2003). Like us, Jefferson 2003 searched the literature without any publication year restriction, whereas Casey 2005 limited their search to efficacy studies from 1990 onwards. Unlike us, both reviews included observational studies. Jefferson 2003 and our review both included 52 studies; most but not all studies were common to Jefferson 2003 and our review.
Efficacy
All efficacy studies of acceptable quality were published between 1988 and 1997.
Casey 2005 retrieved eight efficacy trials; six of them were also included in our efficacy review. Of the remaining two, one was a case‐controlled study (Liese 1997) and the other a cohort study (Schmitt 1996).
Jefferson 2003 included Afari 1996 and Decker 1995, which we excluded due to the absence of laboratory‐confirmed pertussis cases. (Decker 1995 also lacked efficacy data). However, we included these studies in the safety review.
In contrast to Jefferson 2003, we did not study the absolute efficacy of whole‐cell vaccines and we did not perform meta‐analyses of efficacy studies due to significant heterogeneity.
Several studies of acellular vaccines with three to five components showed that the efficacy of the acellular vaccines was superior or equal to the whole‐cell comparator. Jefferson 2003 claims that AHGSPV 1997 "is the source of the widely‐held view that acellular vaccines are less effective than high‐efficacy whole‐cell vaccines". However, both Jefferson 2003 and our review included several studies with acellular vaccines inferior to whole‐cell vaccines, including a study of a four‐component acellular vaccine (PVSG 1998).
Safety
Jefferson 2003 included a systematic review of studies assessing the safety of DTP vaccines. We excluded some of these studies because of lack of sufficient data. However, the results of the reviews were largely similar.
Booster doses
Casey 2005 found that booster doses of all DTaP vaccines in 1% to 2% of individuals caused large, local injection reactions, in most cases probably IgE‐mediated. These reactions cause no permanent harm, and the authors of Casey 2005 argue that everybody should have access to a booster dose every 10 years throughout life.
Despite different designs, there are no significant disagreements between our review and the above mentioned two systematic reviews regarding efficacy and safety of aP vaccines.
Observational studies have also demonstrated the effectiveness of aP vaccines. Gustafsson 2006 (Swedish birth cohorts) showed that immunisation with aP vaccines at three, five and 12 months of age resulted in a reduction in the incidence of laboratory‐confirmed pertussis from 113 to 150 per 100,000 during 1992/1995, to 11 to 16 per 100,000 during 2001/2004. Bisgard 2005 (case‐control study of 1072 children in the United States) found that any combination of ≥ three DTwP/DTaP vaccine doses was highly protective against pertussis. As compared with 0 doses, the unadjusted vaccine effectiveness was 83.6%, 95.6% and 97.7% for one or two, three and ≥ four vaccine doses, respectively. In contrast with the findings of our review, this study showed that four‐component DTaP vaccine was less effective than two‐component DTaP vaccine, however, the potential biases related to study design might cast serious doubt on the validity of comparison between different vaccines.

'Risk of bias' graph: review authors' judgements about each risk of bias item presented as percentages across all included studies.
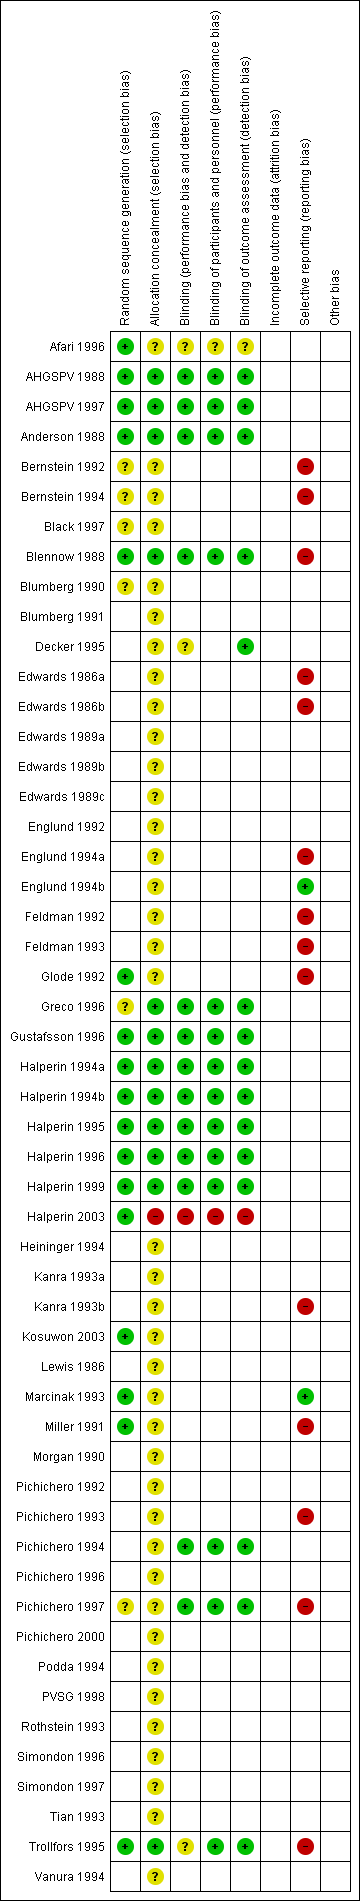
'Risk of bias' summary: review authors' judgements about each risk of bias item for each included study.

Comparison 1 Safety: acellular versus whole‐cell pertussis vaccines, Outcome 1 Primary series non‐completion due to adverse events.

Comparison 1 Safety: acellular versus whole‐cell pertussis vaccines, Outcome 2 Death (all causes).
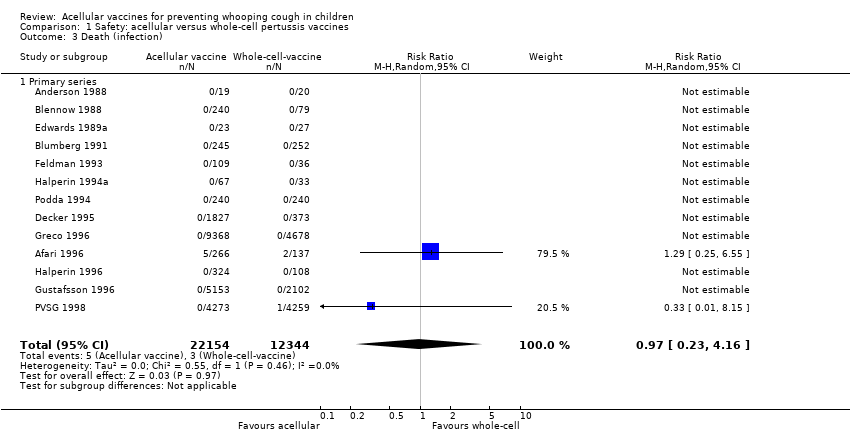
Comparison 1 Safety: acellular versus whole‐cell pertussis vaccines, Outcome 3 Death (infection).
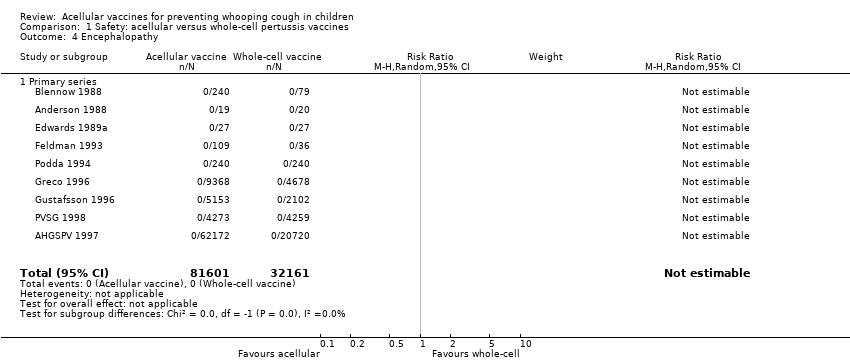
Comparison 1 Safety: acellular versus whole‐cell pertussis vaccines, Outcome 4 Encephalopathy.
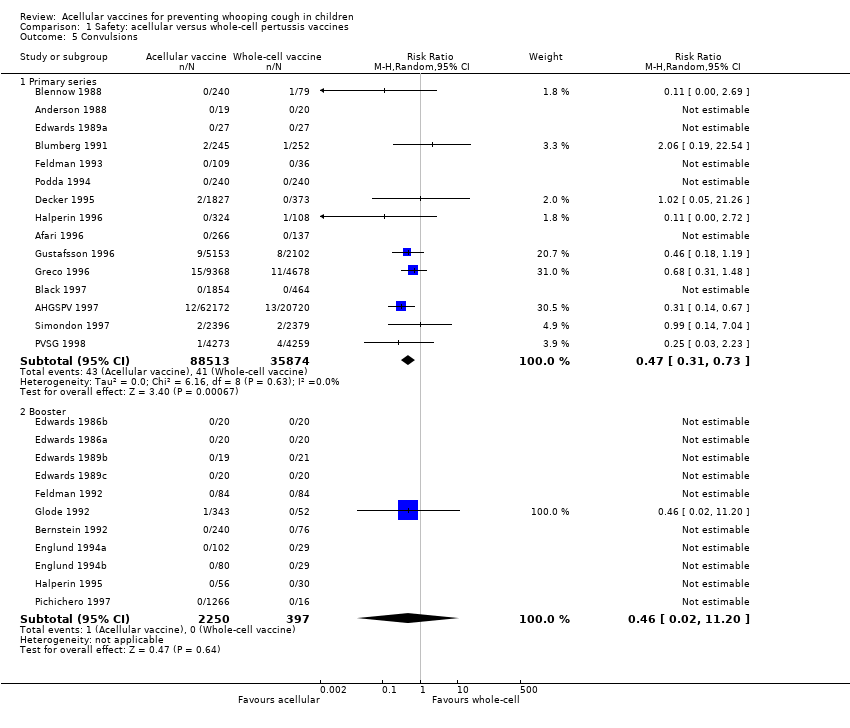
Comparison 1 Safety: acellular versus whole‐cell pertussis vaccines, Outcome 5 Convulsions.

Comparison 1 Safety: acellular versus whole‐cell pertussis vaccines, Outcome 6 Hypotonic hyporesponsive episodes.

Comparison 1 Safety: acellular versus whole‐cell pertussis vaccines, Outcome 7 Anorexia.
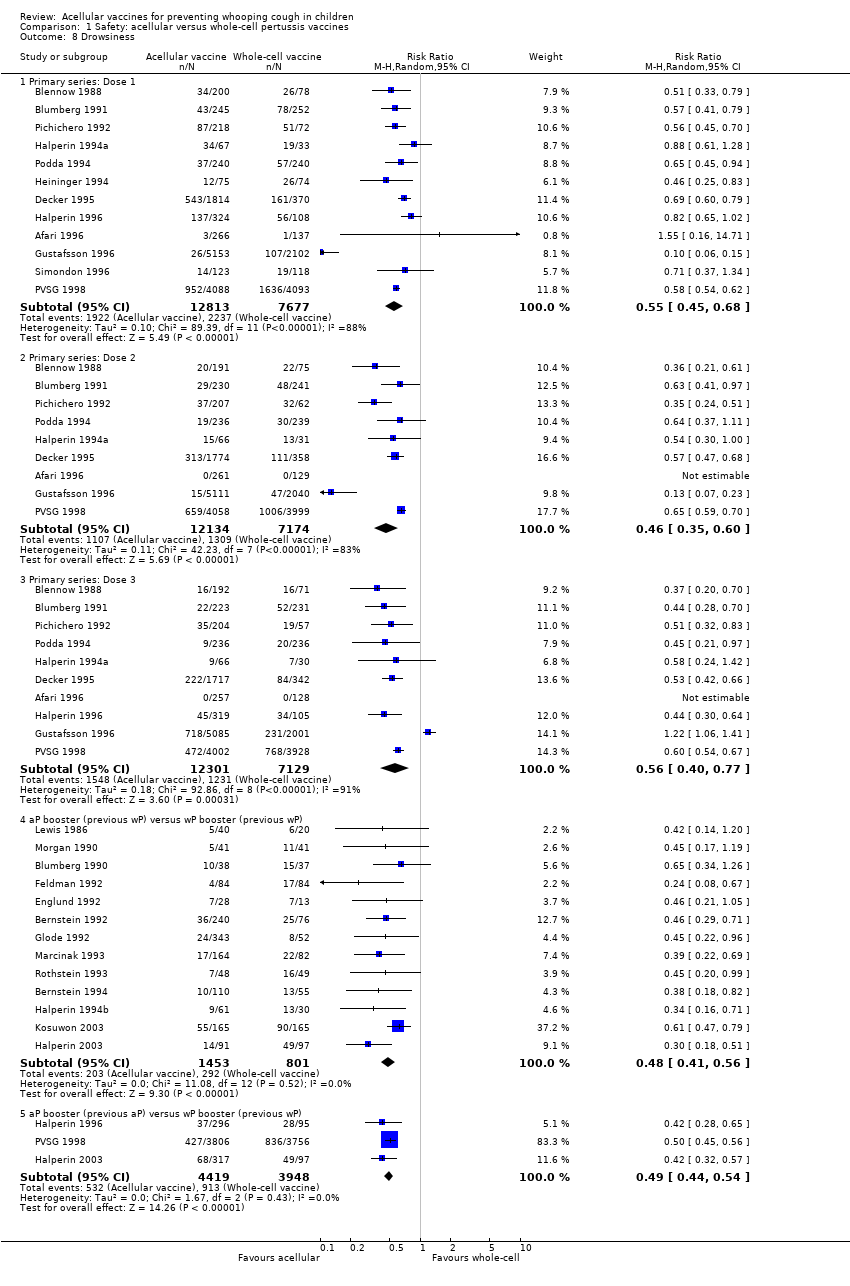
Comparison 1 Safety: acellular versus whole‐cell pertussis vaccines, Outcome 8 Drowsiness.

Comparison 1 Safety: acellular versus whole‐cell pertussis vaccines, Outcome 9 Fever.
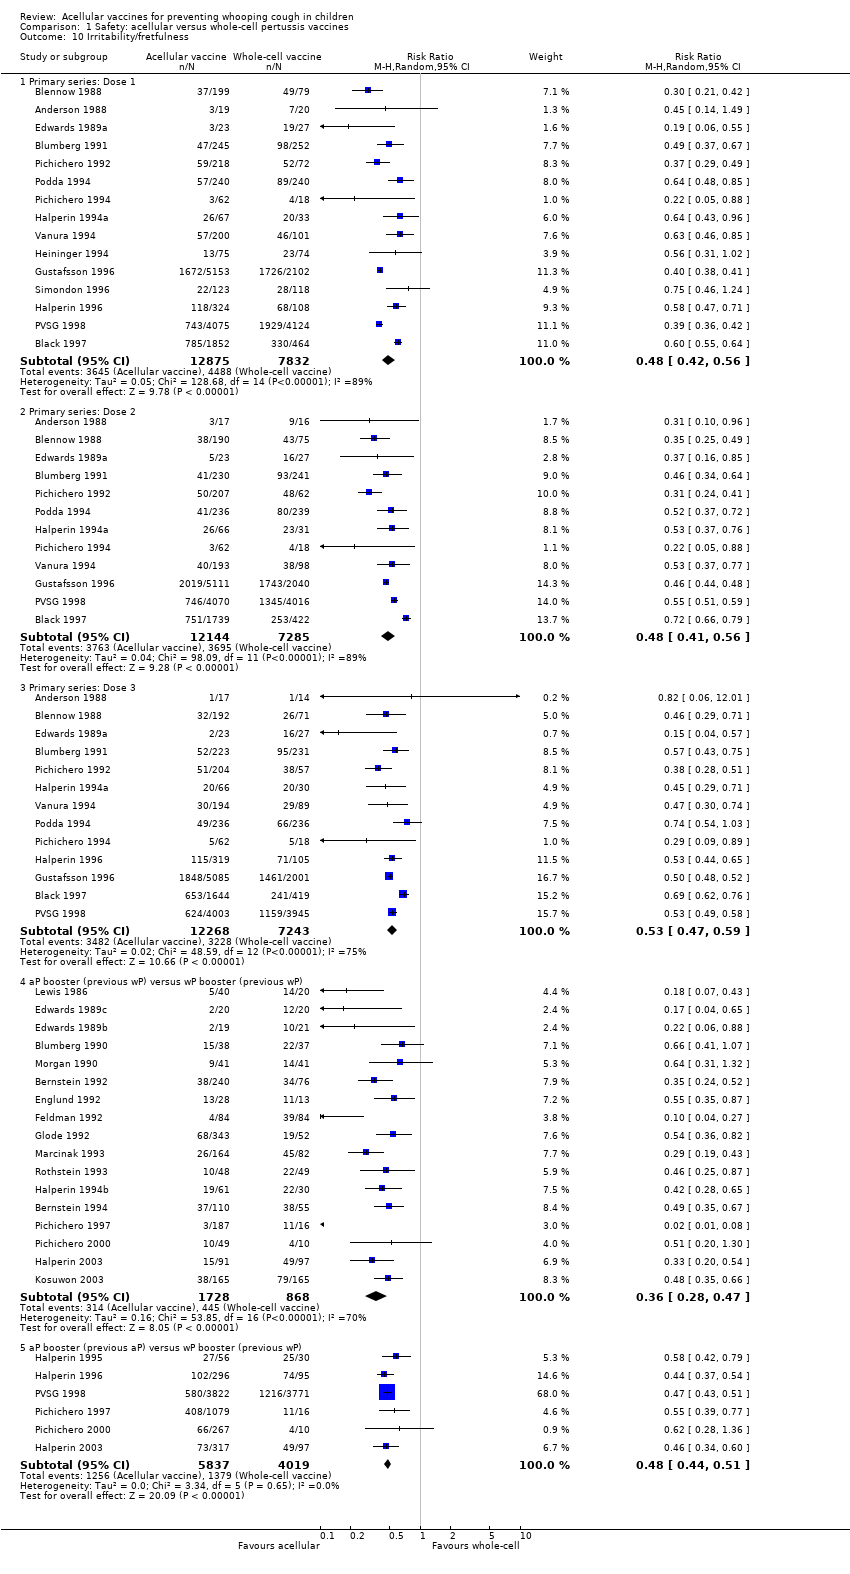
Comparison 1 Safety: acellular versus whole‐cell pertussis vaccines, Outcome 10 Irritability/fretfulness.
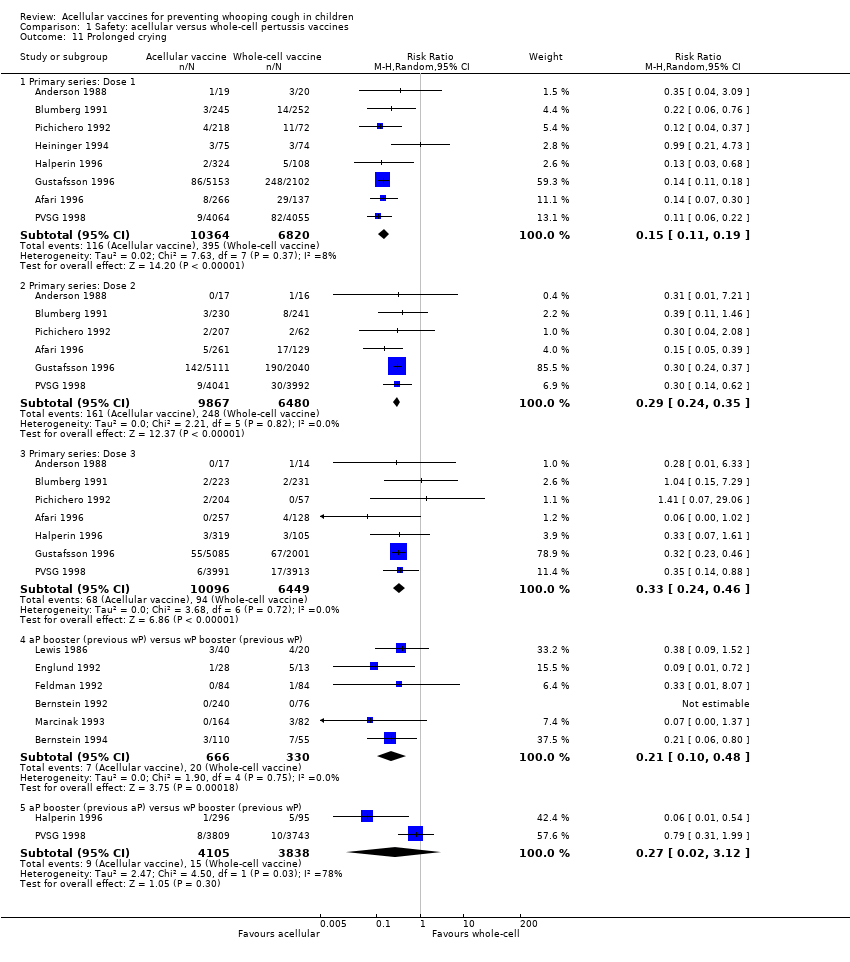
Comparison 1 Safety: acellular versus whole‐cell pertussis vaccines, Outcome 11 Prolonged crying.

Comparison 1 Safety: acellular versus whole‐cell pertussis vaccines, Outcome 12 Vomiting.

Comparison 1 Safety: acellular versus whole‐cell pertussis vaccines, Outcome 13 Pain/tenderness.
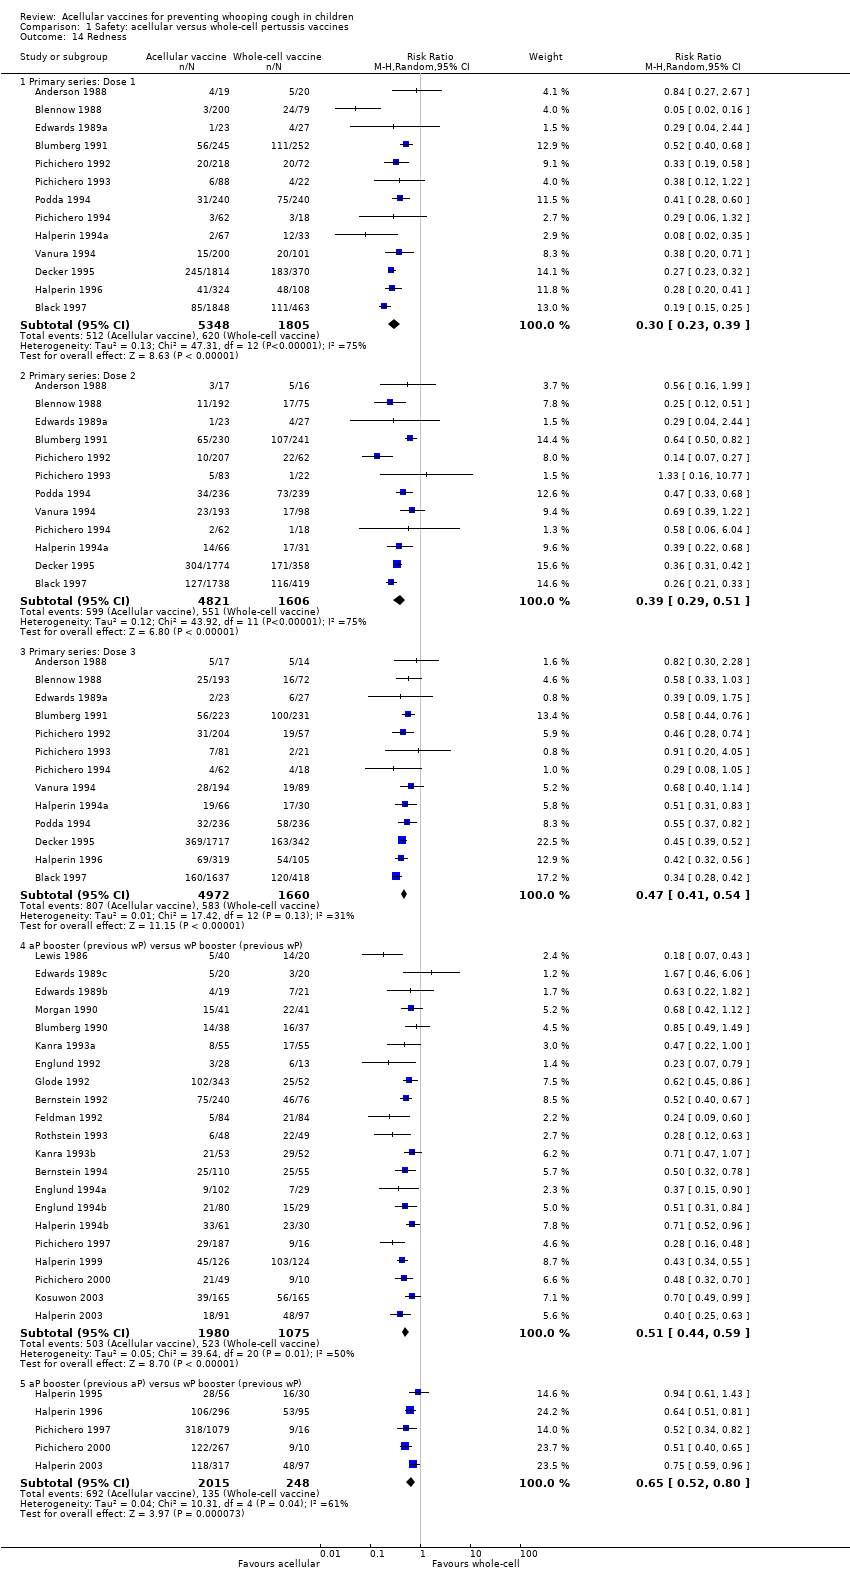
Comparison 1 Safety: acellular versus whole‐cell pertussis vaccines, Outcome 14 Redness.
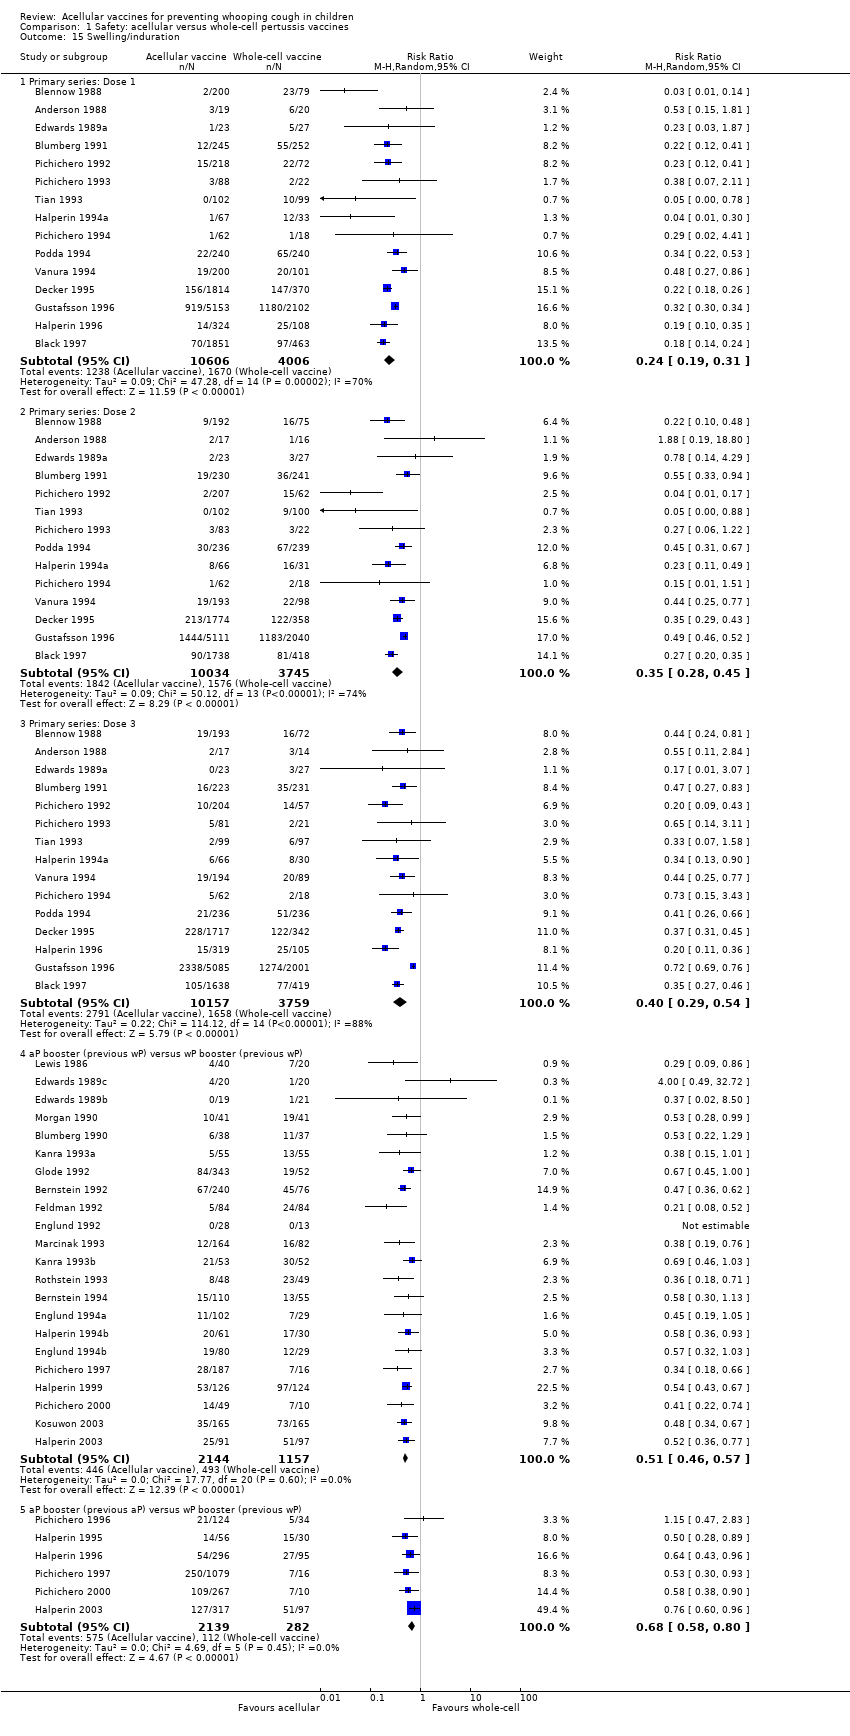
Comparison 1 Safety: acellular versus whole‐cell pertussis vaccines, Outcome 15 Swelling/induration.

Comparison 2 Safety: acellular vaccines versus placebo/DT, Outcome 1 Primary series non‐completion due to adverse events.

Comparison 2 Safety: acellular vaccines versus placebo/DT, Outcome 2 Death (all causes).

Comparison 2 Safety: acellular vaccines versus placebo/DT, Outcome 3 Death (infection).

Comparison 2 Safety: acellular vaccines versus placebo/DT, Outcome 4 Encephalopathy.
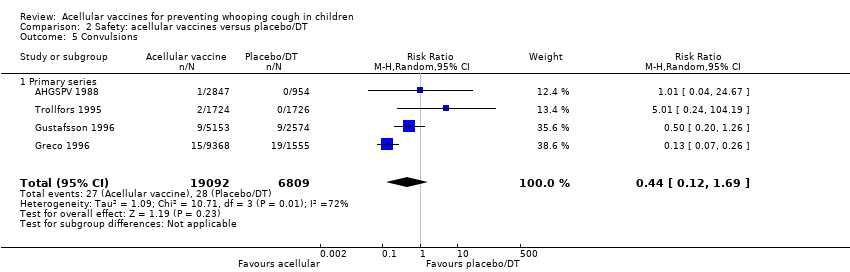
Comparison 2 Safety: acellular vaccines versus placebo/DT, Outcome 5 Convulsions.

Comparison 2 Safety: acellular vaccines versus placebo/DT, Outcome 6 Hypotonic hyporesponsive episodes.

Comparison 2 Safety: acellular vaccines versus placebo/DT, Outcome 7 Anorexia.
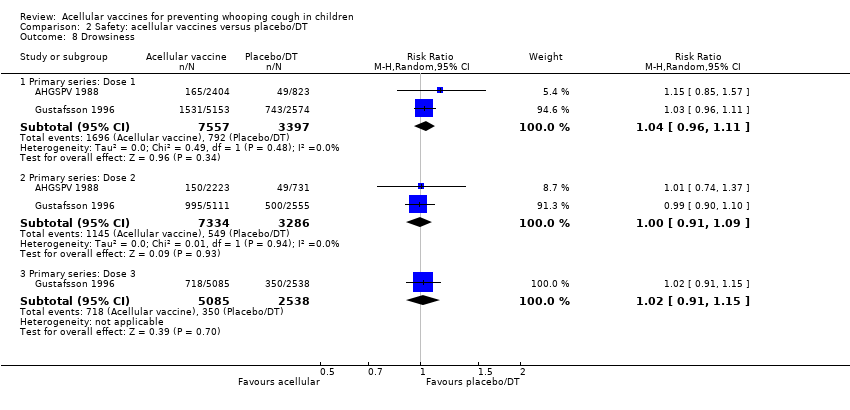
Comparison 2 Safety: acellular vaccines versus placebo/DT, Outcome 8 Drowsiness.
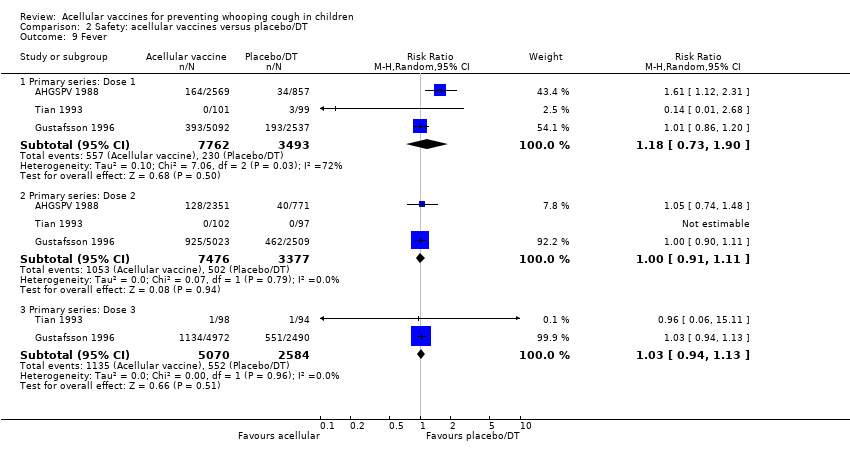
Comparison 2 Safety: acellular vaccines versus placebo/DT, Outcome 9 Fever.
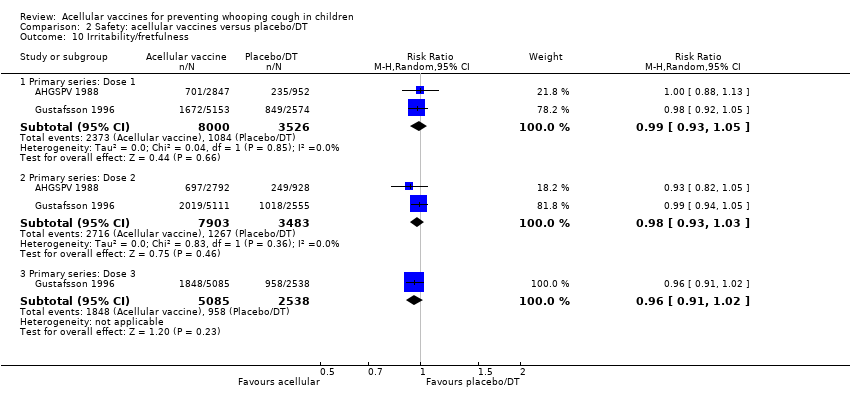
Comparison 2 Safety: acellular vaccines versus placebo/DT, Outcome 10 Irritability/fretfulness.

Comparison 2 Safety: acellular vaccines versus placebo/DT, Outcome 11 Prolonged crying.
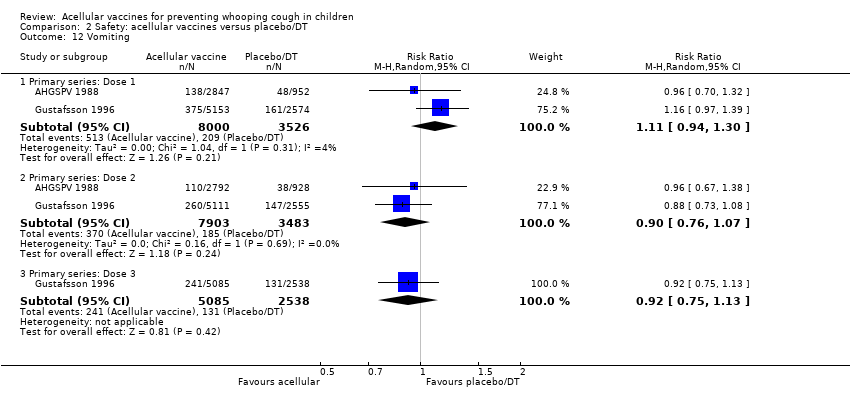
Comparison 2 Safety: acellular vaccines versus placebo/DT, Outcome 12 Vomiting.
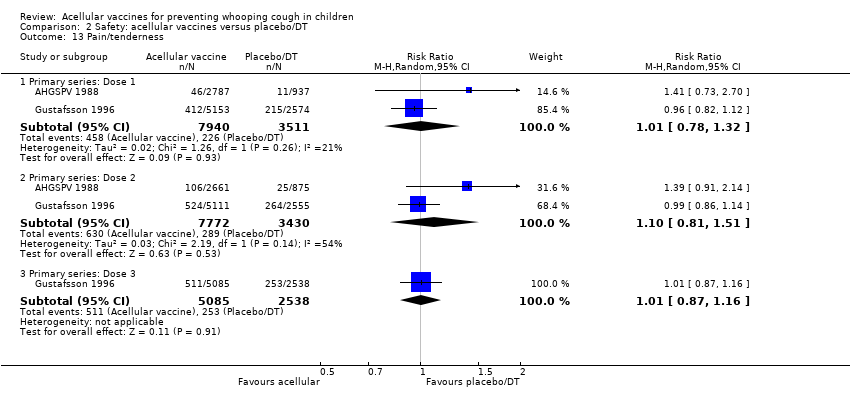
Comparison 2 Safety: acellular vaccines versus placebo/DT, Outcome 13 Pain/tenderness.

Comparison 2 Safety: acellular vaccines versus placebo/DT, Outcome 14 Swelling/induration.
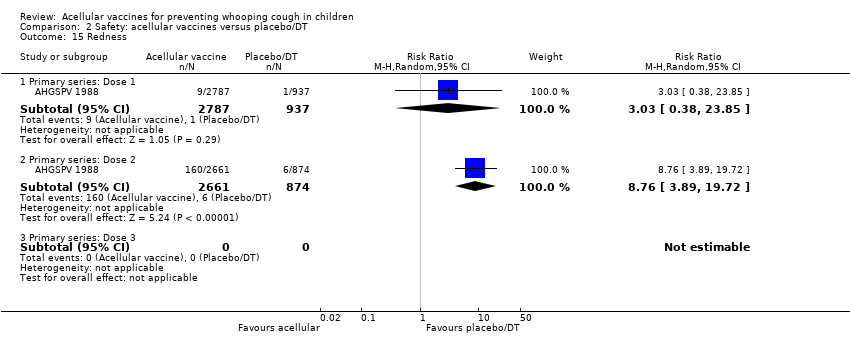
Comparison 2 Safety: acellular vaccines versus placebo/DT, Outcome 15 Redness.
| Outcome or subgroup title | No. of studies | No. of participants | Statistical method | Effect size |
| 1 Primary series non‐completion due to adverse events Show forest plot | 14 | 108909 | Risk Ratio (M‐H, Random, 95% CI) | 0.23 [0.12, 0.43] |
| 2 Death (all causes) Show forest plot | 16 | 122451 | Risk Ratio (M‐H, Random, 95% CI) | 0.87 [0.62, 1.22] |
| 2.1 Primary series | 16 | 122451 | Risk Ratio (M‐H, Random, 95% CI) | 0.87 [0.62, 1.22] |
| 3 Death (infection) Show forest plot | 13 | 34498 | Risk Ratio (M‐H, Random, 95% CI) | 0.97 [0.23, 4.16] |
| 3.1 Primary series | 13 | 34498 | Risk Ratio (M‐H, Random, 95% CI) | 0.97 [0.23, 4.16] |
| 4 Encephalopathy Show forest plot | 9 | 113762 | Risk Ratio (M‐H, Random, 95% CI) | 0.0 [0.0, 0.0] |
| 4.1 Primary series | 9 | 113762 | Risk Ratio (M‐H, Random, 95% CI) | 0.0 [0.0, 0.0] |
| 5 Convulsions Show forest plot | 26 | Risk Ratio (M‐H, Random, 95% CI) | Subtotals only | |
| 5.1 Primary series | 15 | 124387 | Risk Ratio (M‐H, Random, 95% CI) | 0.47 [0.31, 0.73] |
| 5.2 Booster | 11 | 2647 | Risk Ratio (M‐H, Random, 95% CI) | 0.46 [0.02, 11.20] |
| 6 Hypotonic hyporesponsive episodes Show forest plot | 18 | Risk Ratio (M‐H, Random, 95% CI) | Subtotals only | |
| 6.1 Primary series | 11 | 121573 | Risk Ratio (M‐H, Random, 95% CI) | 0.26 [0.08, 0.81] |
| 6.2 Booster | 7 | 2487 | Risk Ratio (M‐H, Random, 95% CI) | 0.0 [0.0, 0.0] |
| 7 Anorexia Show forest plot | 26 | Risk Ratio (M‐H, Random, 95% CI) | Subtotals only | |
| 7.1 Primary series: Dose 1 | 11 | 19632 | Risk Ratio (M‐H, Random, 95% CI) | 0.43 [0.32, 0.57] |
| 7.2 Primary series: Dose 2 | 8 | 18501 | Risk Ratio (M‐H, Random, 95% CI) | 0.45 [0.33, 0.60] |
| 7.3 Primary series: Dose 3 | 9 | 18646 | Risk Ratio (M‐H, Random, 95% CI) | 0.50 [0.43, 0.60] |
| 7.4 aP booster (previous wP) versus wP booster (previous wP) | 14 | 1939 | Risk Ratio (M‐H, Random, 95% CI) | 0.40 [0.30, 0.54] |
| 7.5 aP booster (previous aP) versus wP booster (previous wP) | 4 | 8447 | Risk Ratio (M‐H, Random, 95% CI) | 0.42 [0.31, 0.58] |
| 8 Drowsiness Show forest plot | 25 | Risk Ratio (M‐H, Random, 95% CI) | Subtotals only | |
| 8.1 Primary series: Dose 1 | 12 | 20490 | Risk Ratio (M‐H, Random, 95% CI) | 0.55 [0.45, 0.68] |
| 8.2 Primary series: Dose 2 | 9 | 19308 | Risk Ratio (M‐H, Random, 95% CI) | 0.46 [0.35, 0.60] |
| 8.3 Primary series: Dose 3 | 10 | 19430 | Risk Ratio (M‐H, Random, 95% CI) | 0.56 [0.40, 0.77] |
| 8.4 aP booster (previous wP) versus wP booster (previous wP) | 13 | 2254 | Risk Ratio (M‐H, Random, 95% CI) | 0.48 [0.41, 0.56] |
| 8.5 aP booster (previous aP) versus wP booster (previous wP) | 3 | 8367 | Risk Ratio (M‐H, Random, 95% CI) | 0.49 [0.44, 0.54] |
| 9 Fever Show forest plot | 46 | Risk Ratio (M‐H, Random, 95% CI) | Subtotals only | |
| 9.1 Primary series: Dose 1 | 19 | 23267 | Risk Ratio (M‐H, Random, 95% CI) | 0.17 [0.13, 0.20] |
| 9.2 Primary series: Dose 2 | 17 | 22001 | Risk Ratio (M‐H, Random, 95% CI) | 0.31 [0.26, 0.37] |
| 9.3 Primary series: Dose 3 | 17 | 21731 | Risk Ratio (M‐H, Random, 95% CI) | 0.34 [0.30, 0.38] |
| 9.4 aP booster (previous wP) versus wP booster (previous wP) | 24 | 3381 | Risk Ratio (M‐H, Random, 95% CI) | 0.33 [0.26, 0.43] |
| 9.5 aP booster (previous aP) versus wP booster (previous wP) | 8 | 9879 | Risk Ratio (M‐H, Random, 95% CI) | 0.35 [0.22, 0.55] |
| 10 Irritability/fretfulness Show forest plot | 33 | Risk Ratio (M‐H, Random, 95% CI) | Subtotals only | |
| 10.1 Primary series: Dose 1 | 15 | 20707 | Risk Ratio (M‐H, Random, 95% CI) | 0.48 [0.42, 0.56] |
| 10.2 Primary series: Dose 2 | 12 | 19429 | Risk Ratio (M‐H, Random, 95% CI) | 0.48 [0.41, 0.56] |
| 10.3 Primary series: Dose 3 | 13 | 19511 | Risk Ratio (M‐H, Random, 95% CI) | 0.53 [0.47, 0.59] |
| 10.4 aP booster (previous wP) versus wP booster (previous wP) | 17 | 2596 | Risk Ratio (M‐H, Random, 95% CI) | 0.36 [0.28, 0.47] |
| 10.5 aP booster (previous aP) versus wP booster (previous wP) | 6 | 9856 | Risk Ratio (M‐H, Random, 95% CI) | 0.48 [0.44, 0.51] |
| 11 Prolonged crying Show forest plot | 14 | Risk Ratio (M‐H, Random, 95% CI) | Subtotals only | |
| 11.1 Primary series: Dose 1 | 8 | 17184 | Risk Ratio (M‐H, Random, 95% CI) | 0.15 [0.11, 0.19] |
| 11.2 Primary series: Dose 2 | 6 | 16347 | Risk Ratio (M‐H, Random, 95% CI) | 0.29 [0.24, 0.35] |
| 11.3 Primary series: Dose 3 | 7 | 16545 | Risk Ratio (M‐H, Random, 95% CI) | 0.33 [0.24, 0.46] |
| 11.4 aP booster (previous wP) versus wP booster (previous wP) | 6 | 996 | Risk Ratio (M‐H, Random, 95% CI) | 0.21 [0.10, 0.48] |
| 11.5 aP booster (previous aP) versus wP booster (previous wP) | 2 | 7943 | Risk Ratio (M‐H, Random, 95% CI) | 0.27 [0.02, 3.12] |
| 12 Vomiting Show forest plot | 15 | Risk Ratio (M‐H, Random, 95% CI) | Subtotals only | |
| 12.1 Primary series: Dose 1 | 8 | 11450 | Risk Ratio (M‐H, Random, 95% CI) | 0.77 [0.66, 0.88] |
| 12.2 Primary series: Dose 2 | 7 | 10985 | Risk Ratio (M‐H, Random, 95% CI) | 0.62 [0.45, 0.86] |
| 12.3 Primary series: Dose 3 | 7 | 10813 | Risk Ratio (M‐H, Random, 95% CI) | 0.69 [0.46, 1.04] |
| 12.4 aP booster (previous wP) versus wP booster (previous wP) | 6 | 744 | Risk Ratio (M‐H, Random, 95% CI) | 0.50 [0.22, 1.11] |
| 12.5 aP booster (previous aP) versus wP booster (previous wP) | 1 | 86 | Risk Ratio (M‐H, Random, 95% CI) | 1.07 [0.10, 11.34] |
| 13 Pain/tenderness Show forest plot | 35 | Risk Ratio (M‐H, Random, 95% CI) | Subtotals only | |
| 13.1 Primary series: Dose 1 | 13 | 14180 | Risk Ratio (M‐H, Random, 95% CI) | 0.20 [0.16, 0.25] |
| 13.2 Primary series: Dose 2 | 11 | 13186 | Risk Ratio (M‐H, Random, 95% CI) | 0.18 [0.15, 0.22] |
| 13.3 Primary series: Dose 3 | 12 | 13333 | Risk Ratio (M‐H, Random, 95% CI) | 0.20 [0.17, 0.24] |
| 13.4 aP booster (previous wP) versus wP booster (previous wP) | 21 | 3051 | Risk Ratio (M‐H, Random, 95% CI) | 0.43 [0.36, 0.53] |
| 13.5 aP booster (previous aP) versus wP booster (previous wP) | 5 | 2263 | Risk Ratio (M‐H, Random, 95% CI) | 0.43 [0.32, 0.58] |
| 14 Redness Show forest plot | 35 | Risk Ratio (M‐H, Random, 95% CI) | Subtotals only | |
| 14.1 Primary series: Dose 1 | 13 | 7153 | Risk Ratio (M‐H, Random, 95% CI) | 0.30 [0.23, 0.39] |
| 14.2 Primary series: Dose 2 | 12 | 6427 | Risk Ratio (M‐H, Random, 95% CI) | 0.39 [0.29, 0.51] |
| 14.3 Primary series: Dose 3 | 13 | 6632 | Risk Ratio (M‐H, Random, 95% CI) | 0.47 [0.41, 0.54] |
| 14.4 aP booster (previous wP) versus wP booster (previous wP) | 21 | 3055 | Risk Ratio (M‐H, Random, 95% CI) | 0.51 [0.44, 0.59] |
| 14.5 aP booster (previous aP) versus wP booster (previous wP) | 5 | 2263 | Risk Ratio (M‐H, Random, 95% CI) | 0.65 [0.52, 0.80] |
| 15 Swelling/induration Show forest plot | 39 | Risk Ratio (M‐H, Random, 95% CI) | Subtotals only | |
| 15.1 Primary series: Dose 1 | 15 | 14612 | Risk Ratio (M‐H, Random, 95% CI) | 0.24 [0.19, 0.31] |
| 15.2 Primary series: Dose 2 | 14 | 13779 | Risk Ratio (M‐H, Random, 95% CI) | 0.35 [0.28, 0.45] |
| 15.3 Primary series: Dose 3 | 15 | 13916 | Risk Ratio (M‐H, Random, 95% CI) | 0.40 [0.29, 0.54] |
| 15.4 aP booster (previous wP) versus wP booster (previous wP) | 22 | 3301 | Risk Ratio (M‐H, Random, 95% CI) | 0.51 [0.46, 0.57] |
| 15.5 aP booster (previous aP) versus wP booster (previous wP) | 6 | 2421 | Risk Ratio (M‐H, Random, 95% CI) | 0.68 [0.58, 0.80] |
| Outcome or subgroup title | No. of studies | No. of participants | Statistical method | Effect size |
| 1 Primary series non‐completion due to adverse events Show forest plot | 4 | 25901 | Risk Ratio (M‐H, Random, 95% CI) | 0.70 [0.38, 1.29] |
| 2 Death (all causes) Show forest plot | 4 | 25901 | Risk Ratio (M‐H, Random, 95% CI) | 1.08 [0.26, 4.42] |
| 2.1 Primary series | 4 | 25901 | Risk Ratio (M‐H, Random, 95% CI) | 1.08 [0.26, 4.42] |
| 3 Death (infection) Show forest plot | 4 | 25902 | Risk Ratio (M‐H, Random, 95% CI) | 1.21 [0.19, 7.80] |
| 3.1 Primary series | 4 | 25902 | Risk Ratio (M‐H, Random, 95% CI) | 1.21 [0.19, 7.80] |
| 4 Encephalopathy Show forest plot | 2 | 18650 | Risk Ratio (M‐H, Random, 95% CI) | 0.0 [0.0, 0.0] |
| 4.1 Primary series | 2 | 18650 | Risk Ratio (M‐H, Random, 95% CI) | 0.0 [0.0, 0.0] |
| 5 Convulsions Show forest plot | 4 | 25901 | Risk Ratio (M‐H, Random, 95% CI) | 0.44 [0.12, 1.69] |
| 5.1 Primary series | 4 | 25901 | Risk Ratio (M‐H, Random, 95% CI) | 0.44 [0.12, 1.69] |
| 6 Hypotonic hyporesponsive episodes Show forest plot | 4 | 25901 | Risk Ratio (M‐H, Random, 95% CI) | 0.29 [0.02, 5.13] |
| 6.1 Primary series | 4 | 25901 | Risk Ratio (M‐H, Random, 95% CI) | 0.29 [0.02, 5.13] |
| 7 Anorexia Show forest plot | 2 | Risk Ratio (M‐H, Random, 95% CI) | Subtotals only | |
| 7.1 Primary series: Dose 1 | 2 | 11526 | Risk Ratio (M‐H, Random, 95% CI) | 1.06 [0.93, 1.20] |
| 7.2 Primary series: Dose 2 | 2 | 11386 | Risk Ratio (M‐H, Random, 95% CI) | 0.99 [0.66, 1.46] |
| 7.3 Primary series: Dose 3 | 1 | 7623 | Risk Ratio (M‐H, Random, 95% CI) | 1.07 [0.91, 1.26] |
| 8 Drowsiness Show forest plot | 2 | Risk Ratio (M‐H, Random, 95% CI) | Subtotals only | |
| 8.1 Primary series: Dose 1 | 2 | 10954 | Risk Ratio (M‐H, Random, 95% CI) | 1.04 [0.96, 1.11] |
| 8.2 Primary series: Dose 2 | 2 | 10620 | Risk Ratio (M‐H, Random, 95% CI) | 1.00 [0.91, 1.09] |
| 8.3 Primary series: Dose 3 | 1 | 7623 | Risk Ratio (M‐H, Random, 95% CI) | 1.02 [0.91, 1.15] |
| 9 Fever Show forest plot | 3 | Risk Ratio (M‐H, Random, 95% CI) | Subtotals only | |
| 9.1 Primary series: Dose 1 | 3 | 11255 | Risk Ratio (M‐H, Random, 95% CI) | 1.18 [0.73, 1.90] |
| 9.2 Primary series: Dose 2 | 3 | 10853 | Risk Ratio (M‐H, Random, 95% CI) | 1.00 [0.91, 1.11] |
| 9.3 Primary series: Dose 3 | 2 | 7654 | Risk Ratio (M‐H, Random, 95% CI) | 1.03 [0.94, 1.13] |
| 10 Irritability/fretfulness Show forest plot | 2 | Risk Ratio (M‐H, Random, 95% CI) | Subtotals only | |
| 10.1 Primary series: Dose 1 | 2 | 11526 | Risk Ratio (M‐H, Random, 95% CI) | 0.99 [0.93, 1.05] |
| 10.2 Primary series: Dose 2 | 2 | 11386 | Risk Ratio (M‐H, Random, 95% CI) | 0.98 [0.93, 1.03] |
| 10.3 Primary series: Dose 3 | 1 | 7623 | Risk Ratio (M‐H, Random, 95% CI) | 0.96 [0.91, 1.02] |
| 11 Prolonged crying Show forest plot | 2 | Risk Ratio (M‐H, Random, 95% CI) | Subtotals only | |
| 11.1 Primary series: Dose 1 | 2 | 11525 | Risk Ratio (M‐H, Random, 95% CI) | 1.29 [0.71, 2.34] |
| 11.2 Primary series: Dose 2 | 2 | 11386 | Risk Ratio (M‐H, Random, 95% CI) | 1.08 [0.83, 1.40] |
| 11.3 Primary series: Dose 3 | 1 | 7623 | Risk Ratio (M‐H, Random, 95% CI) | 1.06 [0.66, 1.68] |
| 12 Vomiting Show forest plot | 2 | Risk Ratio (M‐H, Random, 95% CI) | Subtotals only | |
| 12.1 Primary series: Dose 1 | 2 | 11526 | Risk Ratio (M‐H, Random, 95% CI) | 1.11 [0.94, 1.30] |
| 12.2 Primary series: Dose 2 | 2 | 11386 | Risk Ratio (M‐H, Random, 95% CI) | 0.90 [0.76, 1.07] |
| 12.3 Primary series: Dose 3 | 1 | 7623 | Risk Ratio (M‐H, Random, 95% CI) | 0.92 [0.75, 1.13] |
| 13 Pain/tenderness Show forest plot | 2 | Risk Ratio (M‐H, Random, 95% CI) | Subtotals only | |
| 13.1 Primary series: Dose 1 | 2 | 11451 | Risk Ratio (M‐H, Random, 95% CI) | 1.01 [0.78, 1.32] |
| 13.2 Primary series: Dose 2 | 2 | 11202 | Risk Ratio (M‐H, Random, 95% CI) | 1.10 [0.81, 1.51] |
| 13.3 Primary series: Dose 3 | 1 | 7623 | Risk Ratio (M‐H, Random, 95% CI) | 1.01 [0.87, 1.16] |
| 14 Swelling/induration Show forest plot | 3 | Risk Ratio (M‐H, Random, 95% CI) | Subtotals only | |
| 14.1 Primary series: Dose 1 | 3 | 11652 | Risk Ratio (M‐H, Random, 95% CI) | 1.29 [0.62, 2.68] |
| 14.2 Primary series: Dose 2 | 3 | 11401 | Risk Ratio (M‐H, Random, 95% CI) | 2.08 [0.54, 8.01] |
| 14.3 Primary series: Dose 3 | 2 | 7816 | Risk Ratio (M‐H, Random, 95% CI) | 1.13 [1.07, 1.20] |
| 15 Redness Show forest plot | 1 | Risk Ratio (M‐H, Random, 95% CI) | Subtotals only | |
| 15.1 Primary series: Dose 1 | 1 | 3724 | Risk Ratio (M‐H, Random, 95% CI) | 3.03 [0.38, 23.85] |
| 15.2 Primary series: Dose 2 | 1 | 3535 | Risk Ratio (M‐H, Random, 95% CI) | 8.76 [3.89, 19.72] |
| 15.3 Primary series: Dose 3 | 0 | 0 | Risk Ratio (M‐H, Random, 95% CI) | 0.0 [0.0, 0.0] |