Therapeutic ultrasound for venous leg ulcers
Abstract
Background
Venous leg ulcers are a type of chronic, recurring, complex wound that is more common in people aged over 65 years. Venous ulcers pose a significant burden to patients and healthcare systems. While compression therapy (such as bandages or stockings) is an effective first‐line treatment, ultrasound may have a role to play in healing venous ulcers.
Objectives
To determine whether venous leg ulcers treated with ultrasound heal more quickly than those not treated with ultrasound.
Search methods
We searched the Cochrane Wounds Specialised Register (searched 19 September 2016); the Cochrane Central Register of Controlled Trials (CENTRAL; the Cochrane Library 2016, Issue 8); Ovid MEDLINE (including In‐Process & Other Non‐Indexed Citations, MEDLINE Daily and Epub Ahead of Print) (1946 to 19 September 2016); Ovid Embase (1974 to 19 September 2016); and EBSCO CINAHL Plus (1937 to 19 September 2016). We also searched three clinical trials registries and the references of included studies and relevant systematic reviews. There were no restrictions based on language, date of publication or study setting.
Selection criteria
Randomised controlled trials (RCTs) that compared ultrasound with no ultrasound. Eligible non‐ultrasound comparator treatments included usual care, sham ultrasound and alternative leg ulcer treatments.
Data collection and analysis
Two authors independently assessed the search results and selected eligible studies. Details from included studies were summarised using a data extraction sheet, and double‐checked. We attempted to contact trial authors for missing data.
Main results
Eleven trials are included in this update; 10 of these we judged to be at an unclear or high risk of bias. The trials were clinically heterogeneous with differences in duration of follow‐up, and ultrasound regimens. Nine trials evaluated high frequency ultrasound; seven studies provided data for ulcers healed and two provided data on change in ulcer size only. Two trials evaluated low frequency ultrasound and both reported ulcers healed data.
It is uncertain whether high frequency ultrasound affects the proportion of ulcers healed compared with no ultrasound at any of the time points evaluated: at seven to eight weeks (RR 1.21, 95% CI 0.86 to 1.71; 6 trials, 678 participants; low quality evidence ‐ downgraded once for risk of bias and once for imprecision); at 12 weeks (RR 1.26, 95% CI 0.92 to 1.73; 3 trials, 489 participants; moderate quality evidence ‐ downgraded once for imprecision); and at 12 months (RR 0.93, 95% CI 0.73 to 1.18; 1 trial, 337 participants; low quality evidence ‐ downgraded once for unclear risk of bias and once for imprecision).
One trial (92 participants) reported that a greater percentage reduction in ulcer area was achieved at four weeks with high‐frequency ultrasound, while another (73 participants) reported no clear difference in change in ulcer size at seven weeks. We downgraded the level of this evidence to very low, mainly for risk of bias (typically lack of blinded outcome assessment and attrition) and imprecision.
Data from one trial (337 participants) suggest that high frequency ultrasound may increase the risk of non‐serious adverse events (RR 1.29, 95% CI 1.02 to 1.64; moderate quality evidence ‐ downgraded once for imprecision) and serious adverse events (RR 1.21, 95% CI 0.78 to 1.89; moderate quality evidence downgraded once for imprecision).
It is uncertain whether low frequency ultrasound affects venous ulcer healing at eight and 12 weeks (RR 3.91, 95% CI 0.47 to 32.85; 2 trials, 61 participants; very low quality evidence (downgraded for risk of bias and imprecision)).
High‐frequency ultrasound probably makes little or no difference to quality of life (moderate quality evidence, downgraded for imprecision). The outcomes of adverse effects, quality of life and cost were not reported for low‐frequency ultrasound treatment.
Authors' conclusions
It is uncertain whether therapeutic ultrasound (either high or low frequency) improves the healing of venous leg ulcers. We rated most of the evidence as low or very low quality due to risk of bias and imprecision.
PICO
Plain language summary
Can ultrasound therapy help to heal venous (varicose) leg ulcers and/or improve symptoms?
What are venous leg ulcers, and who is at risk?
Venous leg ulcers are common wounds caused by damage or blockages in leg veins. This leads to pooling of blood and increased pressure in these veins. Eventually these changes can damage the skin and underlying tissue and form a long‐lasting wound, or ulcer. These ulcers can be painful and leak fluid. They can also become infected. People at risk of developing venous leg ulcers include the elderly and those with mobility problems. They can be distressing for patients and costly to healthcare systems.
Why use ultrasound to treat leg ulcers?
Treatments for venous leg ulcers include compression bandages, which improve blood‐flow in the legs, wound dressings, and medication such as antibiotics. Ultrasound therapy is sometimes used as an additional intervention, especially for difficult, long‐standing ulcers. Sound waves are passed through the skin causing the tissue underneath to vibrate. The mechanisms by which ultrasound waves interact with healing tissues are not fully understood; they may have a positive or negative impact on the blood flow around the ulcers. We wanted to discover whether using ultrasound therapy can improve the healing of leg ulcers.
What we found?
In September 2016 we searched for randomised controlled trials (RCTs) that investigated whether ultrasound helps to heal or improves the symptoms of venous leg ulcers. We found 11 trials involving a total of 969 participants. The average (mean) age of participants ranged from 59 years to 70 years. The proportion of female participants ranged from 55% to 79%. Eight studies compared ultrasound with use of no ultrasound for venous leg ulcers and the other three compared ultrasound with sham ultrasound. Seven out of the eleven studies were at high risk of bias and we could not assess the potential bias in three studies due to poor reporting. One study was at low risk of bias. The trials were all different, for example in their duration of follow‐up (three weeks to 12 months), and the strength of the ultrasound waves used (high or low frequency ultrasound). It is not clear from this evidence whether ultrasound (high or low frequency) increases the healing of venous leg ulcers. The results of one study (337 participants) suggest that high‐frequency ultrasound may be associated with more adverse events such as pain and skin redness (moderate quality evidence). The two studies that evaluated low‐frequency ultrasound did not report whether participants experienced side effects. It is also uncertain whether either high‐ or low‐frequency ultrasound affects participants' quality of life.
Quality of the evidence
Most of the studies we found did not have many participants, had short follow‐up times and had weaknesses of study design that meant they were quite likely to give a misleading result. We consider the available evidence to be low quality due to these risks of bias.
This plain language summary is up to date as of September 2016.
Authors' conclusions
Summary of findings
| High frequency ultrasound compared with no ultrasound for people with venous leg ulcers | ||||||
| Patient or population: people with venous leg ulcers | ||||||
| Outcomes | Anticipated absolute effects* (95% CI) | Relative effect | № of participants | Quality of the evidence | Comments | |
| Risk with no ultrasound | Risk with high frequency ultrasound | |||||
| Proportion of ulcers completely healed at 3 weeks | Study population | RR 2.05 | 65 | ⊕⊝⊝⊝ | Highly uncertain whether high frequency ultrasound affects healing at 3 weeks. | |
| 45 per 1000 | 93 per 1000 | |||||
| Moderate | ||||||
| 45 per 1000 | 92 per 1000 | |||||
| Proportion of ulcers completely healed at 7 or 8 weeks: losses to follow‐up regarded as unhealed | Study population | RR 1.21 | 678 | ⊕⊕⊝⊝ | Highly uncertain whether high frequency ultrasound affects healing at 7 to 8 weeks. | |
| 166 per 1000 | 198 per 1000 | |||||
| Moderate | ||||||
| 218 per 1000 | 259 per 1000 | |||||
| Proportion of ulcers completely healed at 12 weeks: losses to follow‐up regarded as unhealed | Study population | RR 1.26 | 489 | ⊕⊕⊕⊝ | Uncertain whether high frequency ultrasound affects healing at 12 weeks. | |
| 202 per 1000 | 255 per 1000 | |||||
| Moderate | ||||||
| 304 per 1000 | 383 per 1000 | |||||
| High10 | ||||||
| 500 per 1000 | 630 per 1000 | |||||
| Healing at 12 months (nurse‐reported data) | Study population | RR 0.93 | 337 | ⊕⊕⊝⊝ | Uncertain whether high frequency ultrasound affects healing at 1 year. | |
| 462 per 1000 | 429 per 1000 | |||||
| Moderate | ||||||
| 461 per 1000 | 429 per 1000 | |||||
| High11 | ||||||
| 800 per 1000 | 744 per 1000 | |||||
| Change in ulcer size at 4 or 7 weeks | Mean percentage change in ulcer area was reported in both studies. Data were insufficient to conduct a meta‐analysis. One study (4‐week follow‐up) found a difference in change in ulcer size between groups. The other study reported no clear difference. | 165 (2 RCTs) | ⊕⊝⊝⊝ | Highly uncertain whether high frequency ultrasound affects change in ulcer size at 4 or 7 weeks. | ||
| Non‐serious adverse events | Study population | RR 1.29 | 337 | ⊕⊕⊕⊝ | The data refer to the number of people experiencing adverse events, rather than the number of adverse events. | |
| 172 per 1000 | 221 per 1000 | |||||
| Moderate | ||||||
| 172 per 1000 | 222 per 1000 | |||||
| Serious adverse events | Study population | RR 1.21 | 337 | ⊕⊕⊕⊝ | The data refer to the number of people experiencing adverse events, rather than the number of adverse events. | |
| 396 per 1000 | 480 per 1000 | |||||
| Moderate | ||||||
| 396 per 1000 | 479 per 1000 | |||||
| HRQoL: 12‐week SF‐12 mean Physical/Mental Component Scores | Physical Component Score (PCS) mean (SD): 34.96 (11.39) Mental Component Score (MCS) mean (SD): 46.83 (11.38) | PCS in the ultrasound group was 1.09 lower (3.75 lower to 1.57 higher) MCS in the ultrasound group was 0.88 lower (3.62 lower to 1.86 higher) | See comment | 285 | ⊕⊕⊕⊝ | No clear differences in physical or mental HRQoL at 12 weeks |
| HRQoL: 12‐month SF‐12 Physical Component Score | PCS mean (SD): 35.57 (1.88) MCS mean (SD): 45.41 (12.15) | PCS in ultrasound group was 0.96 lower (3.17 lower to 1.25 higher) MCS in ultrasound group was 2.1 higher (0.97 lower to 5.17 higher) | See comment | 229 | ⊕⊕⊕⊝ | No clear differences in physical or mental HRQoL at 12 months |
| Cost Follow‐up: 12 months | Addition of ultrasound treatment to standard care cost GBP 197.88 more per participant per year (95% bias‐corrected CI GBP ‐35.19 to GBP 420.32) | 337 | ⊕⊕⊕⊝ | No clear differences in cost at 12 months | ||
| *The risk in the intervention group (and its 95% confidence interval) is based on the assumed risk in the comparison group and the relative effect of the intervention (and its 95% CI). | ||||||
| GRADE Working Group grades of evidence | ||||||
| 1 Downgraded due to risk of bias (two levels) ‐ at high or unclear risk of performance bias; the use of US was not the only difference in treatment between groups 2 Downgraded due to imprecision (one level) ‐ 95% CIs were very wide 3 Downgraded due to imprecision (one level) ‐ very short follow‐up time 4 Only 5 participants reached the endpoint (complete ulcer healing) and 4 of them were in the intervention group 5 Downgraded due to risk of bias (one level) ‐ most studies at high or unclear risk of bias 6 Downgraded due to imprecision (one level) ‐ 95% CIs were wide with only 122 participants reaching the endpoint 7 Downgraded due to imprecision (one level) ‐ only 111 participants across the three trials reached the endpoints and the OIS is hard to reach (Guyatt 2011) 8 Downgraded due to risk of bias (one level) since the outcome of healed wounds was based on nurse‐reported data 9 Downgraded due to imprecision estimate (one level) ‐ low event rate; OIS is hard to reach 10 High risk of healing at 12 weeks of 50% taken from a large, well conducted RCT where patients all received best practice care (Iglesias 2004). Moderate risk taken from median control group healing rate in these trials 11 With best practice (i.e. high compression bandaging), a baseline risk of healing at 12 months would be approximately 80% (Iglesias 2004) | ||||||
| Low frequency ultrasound compared with no ultrasound for people with venous leg ulcers | ||||||
| Patient or population: venous leg ulcers | ||||||
| Outcomes | Anticipated absolute effects* (95% CI) | Relative effect | № of participants | Quality of the evidence | Comments | |
| Risk with no ultrasound | Risk with Low frequency US | |||||
| Proportion of ulcers completely healed at 8 to 12 weeks | Study population | RR 3.91 | 61 | ⊕⊝⊝⊝ | There were no events in the control groups so we added 0.5 to the cell as a fixed value (as per Cochrane Handbook). Highly uncertain whether low frequency ultrasound affects healing at 8 to 12 weeks. | |
| 17 per 1000 | 65 per 1000 | |||||
| High3 | ||||||
| 300 per 1000 | 1000 per 1000 | |||||
| Adverse events | No study reported adverse events | Pain was reported; however, this does not appear to have been measured systematically. | ||||
| HRQoL | No study reported HRQoL | |||||
| Cost | No study reported cost | |||||
| *The risk in the intervention group (and its 95% confidence interval) is based on the assumed risk in the comparison group and the relative effect of the intervention (and its 95% CI). | ||||||
| GRADE Working Group grades of evidence | ||||||
| 1 Downgraded due to risk of bias (one level) because both studies were at unclear or high risk 2 Downgraded due to imprecision (two levels): the OIS is hard to reach; very wide 95% CIs ‐ ranging in the ultrasound group from a 53% reduction of risk for ulcer healing to a 3285% increased risk (Guyatt 2011) 3 With best practice (i.e. high compression bandaging), a baseline risk of healing at 10 weeks (midpoint of 8 and 12 weeks) would be approximately 30% (Iglesias 2004) | ||||||
Background
Description of the condition
A venous leg ulcer can be defined as "an open sore in the skin of the lower leg due to high pressure of the blood in the leg veins" (British Association of Dermatologists 2010). Venous insufficiency is a term used most frequently to describe the lack of flow (stasis) of venous blood in the lower limbs. The stasis and pooling of blood in the venous system can be caused by dysfunctional valves of the superficial or deep venous system, deep venous outflow obstruction, or failure of the muscular pump mechanism of the lower limbs (Valencia 2001). The exact pathophysiology behind skin damage and ulcer formation in venous insufficiency is not known; multiple hypotheses include white cell trapping, growth factor trapping, pericapillary fibrin cuffs and fibrinolytic abnormalities (Valencia 2001).
The prevalence of active venous leg ulceration has been variously estimated as 0.29 per 1000 population (95% confidence interval 0.25 to 0.33 per 1000) (Hall 2014), and 1% of the adult population in the western world (Donnelly 2009). Leg ulcers are more common among women and prevalence increases with age (Callam 1985; Margolis 2002), reaching up to 3% in adults aged 65 years and over (Donnelly 2009). The incidence of venous ulceration in the elderly population has been estimated at 0.76/100 person‐years for men, and 1.42/100 person‐years for women (Margolis 2002).
Active ulceration is known to have a profoundly detrimental effect upon quality of life, inflicting significant pain and restriction in mobility, which result in limitations of physical and social roles (Carradice 2011; Michaels 2009). Typically, ulcers produce exudate, reduce mobility and can incapacitate, causing social isolation (Graham 2003). Reported healing times vary, but are often long; sometimes healing takes many years. One large trial found that even with treatment and close monitoring, only 65% of ulcers healed within 24 weeks, and only around 90% within three years (Barwell 2004). Once healed, recurrence is frequent, with recurrence rates of 26% to 70% within the year after healing (Barwell 2004). Ulcer management is costly due to the need for frequent changes of dressing, home visits, and hospitalisation (Olin 1999). The financial cost of treating an unhealed leg ulcer in the UK has most recently been estimated at around GBP 1700 per year (price year 2012) (Ashby 2014); and venous leg ulcers alone have been estimated to cost between GBP 300 million and GBP 600 million per year in health expenditure (Posnett 2008). Younger people of working age also experience venous leg ulcers (Nelzen 1994), and their reduced ability to participate in the labour market adds to the economic impact of this disease (Lafuma 1994; Ruckley 1997).
Description of the intervention
The effects of therapeutic ultrasound have been explored in a diverse array of conditions including fractures (Busse 2009), osteoarthritis (Robinson 2001), rheumatoid arthritis (Casimiro 2002), ankle sprains (Van der Windt 2002), pelvic and perineal pain (Hay‐Smith 1998) and pressure ulcers (Akbari Sari 2006). Therapeutic ultrasound has been proposed as a solution for venous leg ulcers that are difficult to treat, and a systematic review is required in order to summarize the results of existing studies accurately.
A typical therapeutic ultrasound device consists of a generator that is linked to an applicator head; this enables delivery of multiple frequencies in a continuous, or pulsed, manner. Ultrasound is administered directly, by application of the applicator head to the skin, usually with a coupling agent (direct ultrasound) (Hart 1998), or indirectly, where the affected area is placed in a constant‐temperature water bath and the ultrasound administered through the water. Directly‐applied ultrasound is usually applied to the skin around the ulcer (periulcer skin) rather than directly to the ulcer. Most trials in venous leg ulcers use a pulsed ultrasound, with a frequency range of 1 MHz to 3 MHz, and intensity of 0.5 W/cm2 to 1 W/cm2, for a duration of five to 10 minutes, although there does not seem to be any evidence base for this particular regimen (Hart 1998).
How the intervention might work
The effects of therapeutic ultrasound are classified as either thermal or non‐thermal on the basis of the proposed physiological effects (Baker 2001; Dyson 1987; Johns 2002; Ter Haar 1999). Careful choice of the exposure time, intensity and continuous movement of the ultrasound applicator are described as important factors to consider in the delivery of therapeutic ultrasound (McCulloch 2010).
Thermal effects
The thermal effects of ultrasound are achieved by using a higher intensity application to achieve, and maintain, a rise in tissue temperature to around 40°C (Dyson 1987). Thermal effects have been hypothesised as being capable of increasing blood flow (Dyson 1987), although some trials concluded that there was no obvious effect (Hansen 1973; Hogan 1982; Paul 1955). It has been suggested that the thermal effects of ultrasound produce favourable changes in the physical attributes of collagen‐rich structures (Dyson 1987; Ter Haar 1999).
Non‐thermal effects
The non‐thermal effects of ultrasound are thought to be due to two ultrasound‐induced phenomena:
-
acoustic streaming: flow and displacement of particles in a fluid medium due to the physical forces of sound waves (Baker 2001; Johns 2002; Ter Haar 1999). Streaming can be further classified into bulk streaming or microstreaming, the latter being more powerful mechanically.
-
cavitation: the formation and behaviour of microenvironmental gases within a fluid medium under the influence of sound waves (Baker 2001; Johns 2002; Ter Haar 1999).
Many in vitro studies investigating the non‐thermal effect of therapeutic ultrasound on the different elements of tissue healing have been conducted. Ultrasound has been reported as: potentiating enzymatic fibrinolysis (Francis 1992; Olsson 1994); stimulating protein synthesis (Doan 1999; Ross 1983; Webster 1978); inducing cell proliferation (Doan 1999); inducing release of preformed substances from cells (Ito 2000; Young 1990a); stimulating inflammatory cells (Maxwell 1994; Young 1990a); increasing deposition of collagen (Byl 1992); and promoting formation of new blood vessels (angiogenesis) (Young 1990b). It is not clear, however, whether these effects can be reproduced in vivo, and, while some argue that the biophysical phenomena (cavitation and acoustic streaming) do not occur in vivo (Baker 2001), there are conflicting results from different studies (Carstensen 2000; Ter Haar 1981). Furthermore, another study had extreme difficulty in observing the occurrence of these phenomena reliably (Crum 1992). Further analysis and discussion of this issue is out with the scope of this review, but additional information can be found in the following reviews (Baker 2001; Johns 2002).
Why it is important to do this review
The effectiveness of ultrasound in enhancing the healing of tissue both in vivo and in vitro is uncertain. The delivery of ultrasound requires investment of health resources and patient time, and the equipment can be a potential vector for hospital‐acquired (nosocomial) infection (Schabrun 2006), therefore, we need to establish whether ultrasound speeds the healing of venous ulcers. In the face of these uncertainties, an up‐to‐date review investigating the possible therapeutic effects of ultrasound in venous leg ulcers is important.
Objectives
To determine whether venous leg ulcers treated with ultrasound heal more quickly than those not treated with ultrasound.
Methods
Criteria for considering studies for this review
Types of studies
We included randomised controlled trials (RCTs) that evaluated the effectiveness of ultrasound therapy on the healing of venous leg ulcers. An earlier version of the review included quasi‐randomised studies, but we now deem these to be at high risk of selection bias and their results to be potentially misleading, and so have excluded them.
Types of participants
We included trials involving people of any age, and in any care setting, who were described as having leg ulcers of venous aetiology. As the method of obtaining a differential diagnosis of the ulcer varies, we used study authors' definitions of what constituted a venous leg ulcer.
Trials that recruited people with arterial, diabetic or rheumatoid ulceration were only included if the results for participants with venous ulcers were presented separately.
Types of interventions
The primary intervention was ultrasound. Eligible comparison interventions were 'no ultrasound' in the form of usual care, sham ultrasound, or a combination of the two, or alternative treatments.
Types of outcome measures
We list primary and secondary outcome measures below. If a trial was eligible (correct study design, population, and intervention/comparator) but did not report a listed outcome, we contacted the study authors, where possible, in order to establish whether a relevant outcome was measured but not reported. We did not exclude studies solely on the basis of reported outcomes.
Where possible, we anticipated grouping outcomes into the following periods of time:
-
short‐term: up to 30 days;
-
medium‐term: > 30 days to 12 months;
-
long‐term: ≥12 months.
The review authors used their judgement to decide whether statistical pooling within these time periods was appropriate.
Primary outcomes
We sought RCTs that reported objective measures of wound healing. Trialists use a range of different methods of measuring and reporting this outcome. We regard the following as the most relevant and rigorous measures of wound healing:
-
time to complete wound healing (correctly analysed using survival, time‐to‐event approaches). Ideally the outcome would be adjusted for appropriate covariates, e.g. baseline ulcer area/duration.
-
proportion of wounds completely healed during follow‐up (frequency of complete healing), within a trial time period, or at maximal follow‐up. We planned to use and report authors’ definitions of complete wound healing.
We also planned to analyse percentage change in ulcer surface area and rate of change of ulcer surface area, with adjustment for baseline size (we planned to contact study authors to request adjusted means when these were not presented). When change or rate of change in wound size was reported without adjustment for baseline size, we planned to document the use of the outcome in the study, but not to extract, summarize or use the data in any meta‐analysis.
Secondary outcomes
-
Health related quality of life
-
Adverse events, e.g. pain
-
Costs.
Search methods for identification of studies
Search strategies we used to search the Cochrane Central Register of Controlled Trials (CENTRAL) for this update and for the previous update can be found in Appendix 1 and Appendix 2 respectively.
Electronic searches
For this third update, we searched the following databases:
-
Cochrane Wounds Specialised Register (searched 19 September 2016);
-
the Cochrane Central Register of Controlled Trials (CENTRAL; the Cochrane Library 2016, Issue 8);
-
Ovid MEDLINE (1946 to 19 September 2016);
-
Ovid MEDLINE In‐Process & Other Non‐Indexed Citations (searched 19 September 2016);
-
Ovid Embase (1974 to 19 September 2016);
-
EBSCO CINAHL Plus (1937 to 19 September 2016).
The search strategies for Ovid MEDLINE, Ovid Embase and EBSCO CINAHL for this update can be found in Appendix 3, Appendix 4 and Appendix 5, respectively. The Ovid MEDLINE search was combined with the Cochrane Highly Sensitive Search Strategy for identifying randomised trials in MEDLINE: sensitivity‐ and precision‐maximizing version (2008 revision), Ovid format (Lefebvre 2011). The Embase and CINAHL searches were combined with the trial filters developed by the Scottish Intercollegiate Guidelines Network (SIGN 2015). There was no restriction by language, date or publication status.
We also searched the following clinical trials registries.
-
ClinicalTrials.gov (www.clinicaltrials.gov/).
-
WHO International Clinical Trials Registry Platform (apps.who.int/trialsearch/Default.aspx).
-
EU Clinical Trials Register (www.clinicaltrialsregister.eu/).
Searching other resources
We evaluated guidelines from SIGN for recommendations on the use of therapeutic ultrasound for treating leg ulcers (SIGN 2010). We also searched the reference lists of guidelines and potentially useful articles for further reports of RCTs. In addition, we searched the reference lists of retrieved included trials, as well as relevant systematic reviews, meta‐analyses and health technology assessment reports to identify other potentially eligible trials.
Data collection and analysis
Selection of studies
For this update, one review author (ZL) assessed the titles and abstracts of studies identified by the searches for eligibility. We obtained full reports if, from this initial assessment, they appeared to satisfy the inclusion criteria. Those rejected were checked by another review author (NC). ZL checked full text reports to identify those that were eligible for inclusion. We recorded all reasons for exclusion of studies that we obtained as full text reports. This was repeated independently by another review author (NC) to provide verification. Any disagreement was resolved by discussion. We completed a PRISMA (Preferred Reporting Items for Systematic Reviews and Meta‐Analyses) flow chart to summarise this process (Liberati 2009).
Data extraction and management
We extracted and summarised details of the studies using a data extraction sheet. If data were missing then we attempted to contact researchers to obtain the required information. All data extraction performed by one review author was checked by the other.
We extracted the following data:
-
country of origin and healthcare setting of the study;
-
eligibility criteria: baseline patient characteristics by treatment group;
-
details of the ultrasound regimen received by the intervention group plus co interventions;
-
details of the ulcer care regimen received by the comparison group;
-
primary and secondary trial outcome(s);
-
results including primary and secondary outcomes, adverse events, numbers of withdrawals, all by treatment group.
Assessment of risk of bias in included studies
Two review authors independently assessed each included study, without blinding to journal or authorship, using the Cochrane tool for assessing risk of bias (Higgins 2011). This tool addresses six specific domains, namely sequence generation, allocation concealment, blinding, incomplete outcome data, selective outcome reporting and other issues (e.g. extreme baseline imbalance) (see Appendix 6 for details of assessment criteria). We assessed blinding and completeness of outcome data separately for each outcome. We completed a risk of bias table for each eligible study. Both review authors discussed any disagreement to achieve a consensus (see Figure 1).

Methodological quality graph: review authors' judgements about each methodological quality item presented as percentages across all included studies.
We present an assessment of risk of bias using a 'Risk of bias' summary figure (Figure 2), which presents all of the judgments in a cross‐tabulation of study by entry. This display of internal validity indicates the weight the reader may give the results of each study. Studies were classed as being at high risk of bias if they were rated as 'high risk' for any of the four key criteria (random sequence generation, allocation concealment, blinding of outcome assessment and incomplete outcome data addressed) and they were classed as being at 'unclear risk' if they had at least one unclear criterion, with the remainder classed as 'low risk'.

Methodological quality summary: review authors' judgements about each methodological quality item for each included study.
Measures of treatment effect
For dichotomous outcomes we calculated the risk ratio (RR) with 95% confidence intervals (CI). For continuous outcomes that used the same assessment scale we used the mean difference (MD) with 95% CIs. If trials used different assessment scales, we used the standardised mean difference (SMD) with 95% CIs. We only considered mean or median time to healing without survival analysis as a valid outcome if reports specified that all wounds healed. Time‐to‐event data (e.g. time‐to‐complete wound healing) were reported as hazard ratios (HR) where possible, in accordance with the methods described in the Cochrane Handbook for Systematic Reviews of Interventions (Deeks 2011). If studies reporting time‐to‐event data (e.g. time to healing) did not report a hazard ratio, then, where feasible, we planned to estimate this using other reported outcomes, such as the number of events, through the application of available statistical methods (Parmar 1998).
For dichotomous outcomes we also present absolute risk differences in the summary of findings Table for the main comparison and summary of findings Table 2. Hoffrage and colleagues suggested that physicians’ inferences about statistical outcomes are more appropriate when they deal with ‘natural frequencies’ – whole numbers of people, both treated and untreated, than when effects are presented as percentages (Hoffrage 2000). In this case, we presented our outcomes as anticipated absolute effects.
Unit of analysis issues
Where studies randomised participants and reported outcomes for wounds, and the number of wounds appeared to be equal to the number of participants, we treated the participant as the unit of analysis.
We had anticipated a possible unit of analysis issue if: individual participants with multiple wounds were randomised; the allocated treatment was used on multiple wounds per participant (or perhaps only on some participants); and if data were presented and analysed by wound not person. This is a type of clustered data and presents a unit of analysis error that inflates precision. In cases where included studies contained some or only clustered data, we planned to report this alongside whether data had been (incorrectly) treated as independent. We recorded this as part of the 'Risk of bias' assessment. We did not plan to undertake further calculation to adjust for clustering.
Dealing with missing data
High rates of withdrawal from trials are common in chronic wounds research, and trialists have tended to exclude withdrawn and 'lost' participants from analysis. This approach clearly disrupts randomisation, and has a high potential for introducing bias ‐ largely by ignoring participants who have failed to heal. For the main analysis we have, therefore, regarded participants who were lost to follow‐up (i.e. randomised but do not appear in the analysis) as unhealed ‐ where healing was the main endpoint ‐ as this seems the most plausible outcome, however, we have also tested this approach by conducting complete case analyses (see Analysis 1.2; Analysis 1.3).
Since in a time‐to‐healing analysis that uses survival analysis methods, drop‐outs are accounted for as censored data, we took no action regarding missing data.
For continuous variables, for example, cost and for all secondary outcomes, we presented available data from the study reports or study authors and did not anticipate imputing missing data. We calculated missing measures of variance where possible. If calculation was not possible, we contacted the study authors. Where these measures of variation were not available, we excluded the study from any meta‐analyses.
We did not specify application and comparison of these two approaches in the original protocol.
Assessment of heterogeneity
Assessment of heterogeneity can be a complex, multi‐faceted process. Firstly, we planned to consider clinical and methodological heterogeneity, that is the degree to which the included studies varied in terms of participants, interventions, outcomes and characteristics such as length of follow‐up. We supplemented this assessment of clinical and methodological heterogeneity with information regarding statistical heterogeneity gained by using the Chi² test (we would consider a significance level of P < 0.10 to indicate statistically significant heterogeneity) in conjunction with the I2 measure (Higgins 2003). I2 examines the percentage of total variation across RCTs that is due to heterogeneity rather than chance (Higgins 2003). Very broadly, we consider that I2 values of 25% or less may mean a low level of heterogeneity (Higgins 2003), and values of 75% or more indicate very high heterogeneity (Deeks 2011). Where there was evidence of high heterogeneity we anticipated exploring this further where possible: see Data synthesis.
Assessment of reporting biases
Most reporting biases will be avoided by not restricting the literature search to published literature or by language and date. Due to the limited numbers of included studies, we were unable to investigate publication bias using a funnel plot.
Data synthesis
We combined the studies included in the review by narrative overview, with meta‐analysis of appropriate data conducted with Review Manager 5.3 software (RevMan 2014). We planned to assess clinical and methodological heterogeneity and anticipated pooling data when studies appeared similar in terms of intervention type, duration of follow‐up and outcome type. In terms of a meta‐analytical approach, in the presence of clinical heterogeneity (review author judgement), or evidence of statistical heterogeneity, or both, we used a random‐effects model. We planned to use a fixed‐effect approach only when clinical heterogeneity was thought to be minimal and statistical heterogeneity was estimated as non‐statistically significant for the Chi2 value and 0% for the I2 assessment (Higgins 2003).
For dichotomous outcomes we present the summary estimate as a risk ratio (RR) with 95% CI. Where continuous outcomes were measured in the same way across studies, we planned to present a pooled difference in means (MD) with 95% CI; we planned to pool standardised mean difference (SMD) estimates where studies measured the same outcome using different methods. For time‐to‐event data, we planned to plot (and, if appropriate, pool) estimates of hazard ratios and 95% CIs as presented in the study reports using the generic inverse variance method in RevMan 5.3. Where time to healing was analysed as a continuous measure, but it was not clear if all wounds healed, we planned to document use of the outcome in the study, but not to summarize or use the data in any meta‐analysis.
The studies are categorised into those delivering high or low frequency ultrasound (high frequency being 1 MHz and low frequency being 30 kHz). We compiled two 'Summary of findings' tables using GRADEpro (GRADEpro GDT 2015); one each for high frequency and low frequency ultrasound. We estimated control group event rates for patients at medium risk of healing using the average risk of healing in the included studies; we estimated control group event rates for patients at high risk of healing from a large, well conducted trial that exposed participants to best practice (Iglesias 2004).
Sensitivity analysis
We planned to undertake sensitivity analysis to test the impact of different assumptions regarding the outcomes of participants who were lost to follow up, specifically regarding losses as unhealed compared with regarding losses as healed.
Results
Description of studies
See Characteristics of included studies; Characteristics of excluded studies
Results of the search
The initial version of this review included seven studies (Flemming 2000). The first update added one new study (Franek 2004). The second update, Cullum 2010, added two new studies: Dolibog 2008 and Taradaj 2008. Two studies that were originally included were not randomised and so have now been excluded (Dyson 1976; Roche 1984). The literature search for this 2016 update yielded 66 abstracts that we screened for eligibility. We obtained these 66 reports (for 65 studies) for a more detailed assessment and included three new studies (Franek 2006; Taradaj 2007; Watson 2011) which brings the total number of included studies to 11. One further potentially eligible study (White 2016) is awaiting assessment (Figure 3).
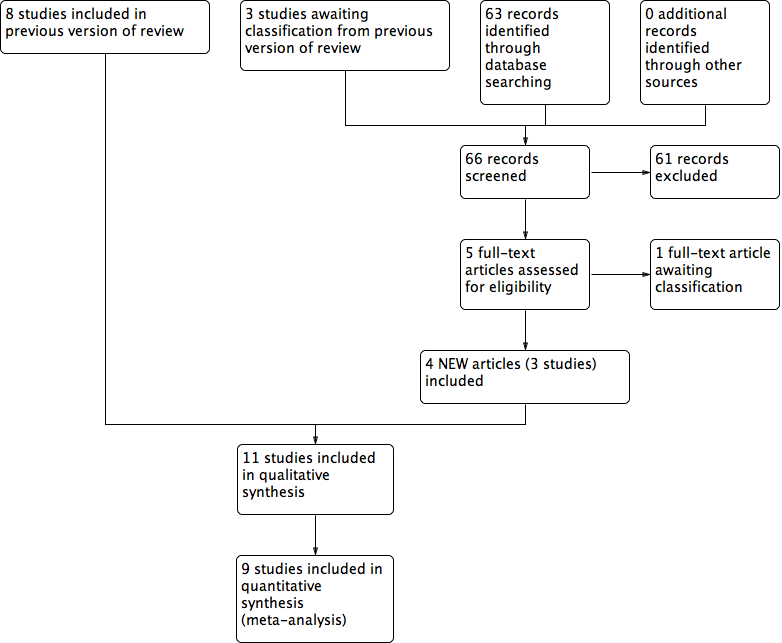
Study flow diagram
Included studies
Design
This 2016 update includes a total of 11 RCTs, and a total of 969 participants. Most included studies had two arms; two studies had three arms (Franek 2004; Taradaj 2007), and another two had four arms (Franek 2006; Taradaj 2008). Two studies were undertaken in Germany (Peschen 1997; Weichenthal 1997), two in Sweden (Eriksson 1991;Lundeberg 1990), five in Poland (Dolibog 2008; Franek 2004; Franek 2006; Taradaj 2007; Taradaj 2008), and two in the UK (Callam 1987; Watson 2011). Ten studies had follow‐up periods of 12 weeks or less, and only one had a 12‐month follow‐up (Watson 2011). The included RCTs were reported between 1987 and 2011.
Sample sizes
Most of the included studies were small; sample sizes ranged from 24 to 337 participants. All participants were diagnosed with venous leg ulceration, though only six out of 11 trials reported the criteria by which this diagnosis was made (Dolibog 2008; Eriksson 1991; Peschen 1997; Taradaj 2008; Watson 2011; Weichenthal 1997).
Setting
The setting in which the trial was undertaken was stated for seven studies: a physiotherapy department (Callam 1987); hospital and primary care (Eriksson 1991); hospitals (Franek 2004; Franek 2006); outpatient clinics (Peschen 1997; Weichenthal 1997); a range of services including community nurse services, community leg ulcer clinics, and hospital outpatient leg ulcer clinics (Watson 2011). The remaining four RCTs did not report the setting.
Participants
The mean age of participants ranged from 59 years to 70 years. The proportion of female participants ranged from 55% to 79%.
Interventions
Therapeutic ultrasound was compared with sham or placebo ultrasound in three trials (Eriksson 1991; Lundeberg 1990; Peschen 1997), and in the remaining eight it was compared with standard ulcer care. Four trials evaluated directly‐applied ultrasound (Callam 1987; Eriksson 1991; Lundeberg 1990; Watson 2011), and the other seven evaluated ultrasound that was applied indirectly though water. Nine trials evaluated high‐frequency therapeutic ultrasound (Callam 1987; Dolibog 2008; Eriksson 1991; Franek 2004; Franek 2006; Lundeberg 1990; Taradaj 2007; Taradaj 2008; Watson 2011), while the other two evaluated low‐frequency ultrasound.
Outcomes
Wound healing trialists vary hugely in their selection and reporting of outcome measures, and there is very little methodological research to validate the wound outcome measures used. Arguably, time to wound healing is the most patient‐oriented outcome, since, even in trials of treatments for chronic wounds, the majority do achieve healing. Survival analysis is the most appropriate strategy for analysing a time‐to‐event outcome such as time‐to‐healing, with hazard ratio as the effect measure; however, this is very rarely used. Three trials used life table methods to compare healing rates (Callam 1987; Lundeberg 1990; Peschen 1997), but did not undertake any adjustment for imbalances and did not report hazard ratios, whilst Watson 2011 conducted full survival analysis, implemented the Cox proportional hazards model and reported the hazard ratio. Eight trials reported the proportion of ulcers completely healed at arbitrary and varying follow‐up times (duration of follow‐up ranged from three weeks in Franek 2004 to 12 weeks in Callam 1987, Lundeberg 1990, and Peschen 1997); the remaining four trials reported healing by seven or eight weeks (Callam 1987; Dolibog 2008; Lundeberg 1990; Watson 2011). Watson 2011 reported median time to healing and the hazard ratio, but on request also supplied proportions of participants with healed ulcers at eight weeks, 12 weeks and 12 months. Franek 2006 and Taradaj 2007 only provided data on change in ulcer size at four and seven weeks respectively, without any healed data available.
Only one study, Watson 2011, measured and reported health‐related quality of life, adverse events and costs. Several trials reported numbers of withdrawals due to pain or bleeding, and mentioned some adverse events; these have been described in narrative form alongside the trial results however only Watson 2011 appears to have had robust and systematic adverse event reporting and recording procedures in place.
Excluded studies
We excluded six studies from the review (see Characteristics of excluded studies). The main reasons for exclusion were:
-
not a randomised controlled trial (five studies; Dissemond 2003; Dyson 1976; Kavros 2007b; Roche 1984; Tan 2007)
-
study mainly included people with ulcers due to arterial rather than venous disease (one study; Kavros 2007a).
Risk of bias in included studies
We deemed seven out of the 11 studies to be at a high risk of bias (Callam 1987; Dolibog 2008; Franek 2004; Lundeberg 1990; Peschen 1997; Taradaj 2008; Weichenthal 1997); we rated Eriksson 1991, Franek 2006, and Taradaj 2007 as being at an unclear risk of bias for every criterion, and Watson 2011 as being at a low risk for every criterion except for performance bias (for which it was high risk) (see Figure 1; Figure 2 for a summary of the risk of bias judgements).
Allocation
Adequacy of randomisation process
All study authors stated that the participants were randomised. Four studies provided sufficient information to indicate that participants were randomised according to an adequate randomisation sequence. Weichenthal 1997 used computer‐generated random numbers, Lundeberg 1990 and Callam 1987 used randomised permuted blocks, and Watson 2011 used computerised randomisation with varying block sizes of four and six participants. The randomisation method was not described in the remaining seven studies (Dolibog 2008; Eriksson 1991; Franek 2004; Franek 2006; Peschen 1997; Taradaj 2007; Taradaj 2008).
Allocation concealment
Callam 1987 and Watson 2011 used a central office to conceal allocation and were the only included studies to describe concealed allocation adequately; we rated the other studies as being at unclear risk of bias for allocation concealment.
Blinding
Studies that we classified as being at a high risk of performance bias reported that blinding of care providers to the allocation was not possible, because of the appearance of the ultrasound intervention (Callam 1987; Dolibog 2008; Franek 2004; Taradaj 2008; Watson 2011; Weichenthal 1997). Three studies used sham ultrasound (Eriksson 1991; Lundeberg 1990; Peschen 1997); it was unclear whether healthcare personnel were blinded, as they may have been responsible for setting the ultrasound machine. Franek 2006 and Taradaj 2007 did not report information that helped us to judge their risk of performance bias and were therefore judged as being at unclear risk of bias.
Determination of whether a wound has healed or not involves judgement, and thus can be influenced by an assessor's knowledge of the treatment allocation. No study reported what could be regarded as a fully blinded outcome assessment. In three studies (Callam 1987; Eriksson 1991; Lundeberg 1990), ulcer tracings were completed by unblinded staff, but the analysis (computer‐aided measurement of ulcer area) of coded tracings was undertaken by staff who were blinded to treatment group. In Watson 2011, photographs were taken by unblinded staff and healing judged from the photographs by assessors who were blinded to treatment allocation: we rated this as being at a low risk of detection bias. We judged blinding of outcome assessment to have been highly unlikely in three studies (Franek 2004; Taradaj 2008; Weichenthal 1997). Two trials did not provide sufficient information for us to judge whether outcome assessment was blinded (Dolibog 2008; Peschen 1997), and another two trials did not report any blinding of outcome assessment (Franek 2006; Taradaj 2007). These four trials were classified as being at unclear risk of bias.
Incomplete outcome data
Twenty‐four per cent of 108 participants in Callam 1987 and 9% of 337 participants in Watson 2011 were lost to follow‐up, but these two trials conducted final analysis on the basis of the intention‐to‐treat approach.These two studies were classified as being at a low risk of attrition bias. We rated seven trials as unclear for risk of attrition bias (Dolibog 2008; Eriksson 1991; Franek 2004; Franek 2006; Taradaj 2007; Taradaj 2008; Weichenthal 1997); two studies appear to have omitted non‐adherent participants from their analyses and we rated them as being at high risk of attrition bias (Lundeberg 1990; Peschen 1997).
Selective reporting
We deemed 10 studies to be at unclear risk of reporting bias, and one to be at low risk of reporting bias, as the protocol for this study was fully available and all outcomes had been reported (Watson 2011).
Other potential sources of bias
The results of Franek 2004 should be viewed with extreme caution, as the treatment groups differed in important aspects of care apart from the ultrasound treatment. The non‐ultrasound group received an intensive wound treatment regimen that was not given to the two ultrasound groups, and, furthermore, while participants in the two ultrasound groups were admitted to the same hospital, the non‐ultrasound group were admitted to a different hospital.
Effects of interventions
See: Summary of findings for the main comparison High frequency ultrasound compared with no ultrasound for people with venous leg ulcers; Summary of findings 2 Low frequency ultrasound compared with no ultrasound for people with venous leg ulcers
There was much heterogeneity in the nature and timing of outcomes reported across all trials. Trialists reported a combination of the number of ulcers healed at specified (and varied) time points, mean change in ulcer size at varied time points, or both.
Comparison 1: High‐frequency ultrasound compared with standard care/sham ultrasound (nine studies, 908 participants)
Nine RCTs, with a total of 908 randomised participants, evaluated high‐frequency ultrasound (Callam 1987; Dolibog 2008; Eriksson 1991; Franek 2004; Franek 2006; Lundeberg 1990;Taradaj 2007; Taradaj 2008; Watson 2011). The Franek 2006 and Taradaj 2007 studies did not report ulcer healing data, but the remaining seven studies (743 participants) did. The Franek 2004 study reported numbers of ulcers healed, and mean and median change in ulcer area at three weeks only. The Taradaj 2008 and Dolibog 2008 studies reported healing at seven weeks; the Eriksson 1991, Callam 1987 and Lundeberg 1990 studies reported healing at eight weeks and we obtained 8 week healing data for the Watson 2011study. Callam 1987, Lundeberg 1990 and Watson 2011 also reported ulcers healed at 12 weeks.
1.1. Primary outcome: ulcer healing
1.1.1 Ulcer healing at three weeks (one trial; 43 participants)
The results of Franek 2004 should be viewed with extreme caution for several reasons; apart from the paucity of endpoint data due to the brief follow‐up, the trial arms received systematically different co interventions and the study was likely to be subject to important performance bias. We have included it here since we did not pre specify that we would exclude trials where ultrasound was not the only systematic difference in treatments. The trial involved three treatment arms: two ultrasound arms (1 W/cm2 and 0.5 W/cm2) and a control arm with no ultrasound. However, the control group received co interventions (in the form of local wound treatments) that were not received by the ultrasound groups (potassium permanganate and wet dressings of 0.1M copper sulphate solution plus compresses of fibrolan, chloramphenicol, colistin, and gentamicin), and were treated in a different hospital. At three weeks, complete healing had occurred in 1/22 (4.5%) of the group receiving 1 W/cm2 ultrasound, 3/21 (14.3%) of the group receiving 0.5 W/cm2 ultrasound, and 1/22 (4.5%) of people receiving no ultrasound. For the purposes of the main analysis we have pooled both ultrasound arms and compared them with no ultrasound. This preserves randomisation, but results in unequally sized groups. There was no clear difference in the proportion of ulcers healed with ultrasound compared with no ultrasound at three weeks (RR 2.05, 95% CI 0.24 to 17.23; Analysis 1.1). Using the GRADE approach, we judged the quality of evidence for this result to be very low (downgraded twice for risk of bias given the problems of design and twice for extreme imprecision); see summary of findings Table for the main comparison.
1.1.2 Ulcer healing at seven to eight weeks (six trials; 678 participants)
We pooled the results for Callam 1987; Dolibog 2008; Eriksson 1991; Lundeberg 1990; Taradaj 2008 and Watson 2011 for seven to eight weeks' follow‐up as statistical heterogeneity was low (I2 = 13%). We regarded those randomised but lost to follow‐up as unhealed in this analysis (i.e. they appeared in the denominator only). After seven to eight weeks of ultrasound treatment, on average, there was no evidence of a difference in the proportion of ulcers healed with ultrasound compared with no ultrasound (pooled RR 1.21, 95% CI 0.86 to 1.71; I2 = 13%; Analysis 1.2) (we used a random‐effects model, which was possibly the more appropriate approach given the differences between the trials). When this analysis was undertaken using a fixed‐effect model, the estimate remained similar (RR 1.19, 95% CI 0.87 to 1.62, not shown). We judged this to be low quality evidence; we downgraded once for high or unclear risk of bias and once for imprecision.
1.1.3 Ulcer healing at 12 weeks (three trials; 489 participants)
We pooled the data from three studies using the fixed‐effect model, as there was no statistical heterogeneity (I2 = 0) (Callam 1987; Lundeberg 1990; Watson 2011). There was no evidence of a difference in healing at 12 weeks between participants treated with ultrasound and those treated without ultrasound (RR 1.26, 95% CI 0.92 to 1.73; fixed‐effect; Analysis 1.3). We regarded both Callam 1987 and Lundeberg 1990 as being at high risk of detection bias for healing outcomes (due to non‐blinding of outcome assessment). We regarded Watson 2011 as being at low risk for all criteria. We judged the quality of evidence to be moderate; we downgraded once for imprecision ‐ summary of findings Table for the main comparison.
1.1.4 Ulcer healing at 12 months (one trial; 337 participants)
We also obtained 12‐month healing data from the authors of Watson 2011 (maximal follow‐up in this study), who told us that 72/168 people (43%) healed with ultrasound at 12 months compared with 78/169 (46%) who received standard care alone (RR 0.93, 95% CI 0.73 to 1.18; Analysis 1.4). Meanwhile, fitting the Cox proportional hazard regression model with a centre frailty parameter resulted in a hazard ratio of ultrasound versus standard care of 0.99 (95% CI 0.70 to 1.40) (P = 0.97), adjusted for log (area), log (duration) and ulcer compression. This indicated that there was no current evidence of an effect of ultrasound treatment on the hazard of healing after adjustment for prespecified prognostic factors and treatment centre.We judged this to be low quality evidence; we downgraded once for unclear risk of bias and once for imprecision.
1.2 Primary outcome: change in ulcer size
The Franek 2006 study reported only unadjusted data for change in ulcer size; there was a greater reduction in mean percentage ulcer area for the ultrasound group compared with the control group (relative to baseline) at four weeks (P = 0.007) (Table 1). The Taradaj 2007 study provided data on change in ulcer size only; it reported the mean percentage change in ulcer area (relative to baseline) at seven weeks and found no significant difference between the ultrasound and control groups (P > 0.05).
| Study | Intervention and Co‐interventions | Comparison intervention | Participants | Results |
|
5 physiotherapy departments
Scotland
NB 2 related abstracts say there were 110 participants
| US group (n = 52): DIRECT and HIGH FREQUENCY
*Lancet paper reports this frequency as 1 mHz. Verified with M Callam in Dec 09 that this should have read 1 MHz. | Standard treatment group (n = 56): cleansing with 1% saline; application of Arachis oil to skin without massage; application of paste bandage (Calaband); application of support bandage (Lestreflex); advice on exercise.
Weekly treatment. | Included: patients attending clinics for treatment of chronic leg ulcers Excluded: non consent, allergy to standard treatment, PVD (lack of ankle pulses) | Ulcers completely healed by 12 wks: US: 25/52 (48%) C: 17/56 (30%)
Read from graph: Ulcers completely healed at 8 wks: US: 23/52 (45%) C: 14/56 (25%)
Ulcers completely healed by 12 wks (complete case): US: 25/41 (61%) C: 17/41 (41%)
US treated healed sig more quickly by log rank ;=0.03. this effect persisted even when withdrawals due to pain and deterioration counted as failures.
Mean % ulcer unhealed at 12 weeks (no variance): US: 9% C: 27% P<0.05
Withdrawals: US: 11/52 (21%) Allergy 4 Pain 4 DNA/refused 2 Death 2
C: 15/56 (27%) Allergy 6 Pain 3 Refused/DNA 3 Deterioration 2 Arterial disease 1 |
|
Poland
| US group: 33 participants treated with US, compression (Sigvaris), and drug therapy.
INDIRECT and HIGH FREQUENCY | Standard care group (n = 37): compression and drug therapy. Dressings changed daily for 7 weeks. | 70 participants with venous leg ulcers who all had venous surgery, and diagnosed as having venous disease with Duplex scanning.
Excluded: diabetes, rheumatoid arthritis Surgery included crossectomy, partial stripping of GSV or LSV, local phlebectomy, ligation of perforators. | Ulcers healed completely: Group 1: 10/33 Group 2: 12/37
Mean area after therapy (SD) Group 1: 13.15 (11.55) Group 2: 13.12 (14.57)
|
|
Hospital and primary care
Sweden | US group: 1.0 W/cm2 at 1 MHz. Enraf Nonius US machine with aquasonic gel. Ultrasound head was 2.8 cm diameter for superficial ulcers and 1.2 cm diameter for deep ulcers. US applied to ulcer surface area and surrounding tissue for 10 minutes twice a week for 8 weeks.
DIRECT and HIGH FREQUENCY | Sham US group: cleaned with saline; paste bandage, support bandage plus exercise advice (no further details provided). | Included; people with venous leg ulcers Excluded: allergy to standard treatment, arterial disease, rheumatoid arthritis, diabetic ulcers, traumatic venous ulcer | Ulcers completely healed at 8 wks: US: 6/19 (6/12 completers) C: 4/19 (4/13 completers)
Cumulative % healed compared using life table methods.
% ulcers completely healed at different times (wks) US:C 2 wks: 8:0 4 wks: 17:8 6 wks: 25:15 8 wks: 41:30
% ulcer area healed at 8 wks (SD): US: 42 (9) C: 48 (13)
Withdrawals: US: 7/19 C: 6/19
For allergy: US: 3 C: 2
For pain: US: 2 C: 1
Refusal/DNA: US: 2 C: 3 |
|
Poland
Hospital inpatients
| US group 1: US at 1 W/cm2 (n = 22) US group 2: US at 0.5 W/cm2 (n = 21)
Both groups received pulsed cycle of 1:5, frequency 1 MHz.
Cointerventions: saline soaked gauze. Single‐layer elastic compression (Hartmann). INDIRECT and HIGH FREQUENCY | Pharmacotherapy group (n = 22): no US. Local baths of potassium permanganate and wet dressings of 0.1M copper sulphate solution plus compresses of fibrolan, chloramphenicol, colistin, gentamicin. Drugs alternated every few days. Single layer elastic compression (Hartmann). Treatment for 3 weeks.
This was problematic as the use of US or not was not the only difference in treatment between the groups i.e. performance bias. Also US groups 1 and 2 were hospitalised in the Dermatology Clinic of Katowice and Group C in the Dermatology Dept of Zabrze.
| Included: people with venous ulcers (signs of venous disease) and ABPI > 1.0. Excluded: people with diabetes, advanced sclerosis
| Mean (median) area after treatment (cm2): A: 14 (11.14) p = 0.0001 B: 9.29 (3.78) p = 0.00006 C: 20.58 (9.86) p = 0.002
Complete ulcer healing by 3 weeks: A: 1/22 B: 3/21 C: 1/22
|
| Poland Hospital inpatients | Electrostimulation group: once a day, 50 minutes each session, 6 consecutive days, 4 weeks total (2 weeks cathodic and 2 weeks anodic stimulation), NaCl 0.9% locally (no further details provided) Laser therapy group: 65 mW once a day, 5 consecutive days, duration of each session depending of ulceration area – device was set up to develop 4J/cm2 on average power 65 mW, various pharmacological agents locally, 4 weeks total US group: 0.5 W/cm2 – once a day, duration of each session depending on ulceration area: 5 cm2 received 5 minutes, plus 1 minute more for each 1 cm2 of additional ulcer area, 4 weeks total, 0.9% NaCl locally | Compression therapy provided for all groups. Bandages were removed every time for purposes of physical therapy and then put back on. Compression + pharmacological agents group: 4 weeks total | People with venous leg ulcers | Mean % change in ulcer area (relative to baseline) at 4 weeks: Group 1: ‐55.26%; Group 2: ‐35.97%; Group 3: ‐63.42%; Group 4: ‐30.77% P(Group 3 & Group 4) = 0.007 |
|
Sweden
| US. group (n = 22): US: pulsed 1:9 0.5 W/cm2 at 1 MHz US applied to ulcer surface and surrounding tissue for 10 minutes; probe applied for 1 minute per probe head area (no further details provided). Treated 3 x per week for 4 weeks, then 2 x per week for 4 weeks, then once a week for 4 weeks. Plus standard care, which comprised of cleansing with saline; paste bandage; support bandage; exercise instructions.
DIRECT and HIGH FREQUENCY | Sham US (no further details provided) + standard treatment group (n = 22): standard care consisted of cleansing with saline; paste bandage; support bandage; exercise instructions. | Patients with VLUs referred from depts. of internal medicine, surgery, primary health care.
Exclusion: skin allergy, PVD, RA, DM, traumatic venous ulcer.
| Cumulative % (n) healed at 8 weeks: US: 30% (5) C: 20% (3)
Cumulative % (n) healed at 12 weeks: US: 59% (10) C: 52% (8)
Mean % ulcer area remaining at 8 weeks (SD) in patients completing: US: 47% (8) C: 53% (10)
Mean % ulcer area remaining at 12 weeks (SD) in patients completing: US: 39% (5) C: 43% (6)
12/44 patients withdrew (7 placebo group, 5 US group).
Placebo: 3 allergy, 1 pain, 3 DNA/refused.
US: 2 allergy, 1 pain, 2 DNA/refused |
|
Germany
Outpatient clinic | US group (n = 12): US treatment involved placing legs in footbath of water at 32 °C‐34 °C filled to 10 cm above the ulcer. US sound head transducer immersed in bath and placed in line with ulcer 5 cm away. The continuous US was given for 10 minutes at 30 kHz, 0.1 W/cm2 3 x per week. Standard care was also given. This comprised HCL dressings (Coloplast); compression therapy using “strong‐quality elastic compression bandages (Beiersdorf)”
INDIRECT and LOW FREQUENCY | Sham US group (n = 12): sham US plus standard care
Sham procedure involved placing legs in footbath of water at 32 °C‐34 °C filled to 10 cm above the ulcer. US sound head transducer immersed in bath and placed in line with ulcer 5 cm away. Sham US for 10 minutes 3 x per week. Standard care consisted of HCL dressings (Coloplast); compression therapy using “strong‐quality elastic compression bandages (Beiersdorf)” | 24 people attending outpatients clinic. Included: people with chronic VLUs at least 2 cm2 and 3 months’ duration. Clinical diagnosis of VLU confirmed by history, Doppler US, light reflection rheography, ABPI of 0.8 or above. Excluded: arterial disease, liver, cardiac or renal insufficiency, heamorrhagic gastroduodenitis, colitis, leukaemia, diabetes, RA, treatment allergy.
| Complete ulcer healing at 12 weeks: US: 2/12 C: 0/12 (or 0/10 completers)
Mean % decrease in ulcer area 12 weeks: US: 55.4% C: 16.5% No variance data p<0.007
Micro‐bleeding around the ulcer: US: 5 C: 0
Pain: US: 3/12 C: 4/10 pain free
Irritation: US: 8/12 C: 0
8 US patients felt tingling sensation during US.
After 12 wk treatment phase, standard care continued.
At 3 months post treatment: Mean ulcer area: US: 30.6% C: 70.2%
Mean change ulcer radius (mm) US: 9.9mm (n = 12) C: 5.3mm (n = 10) (P<0.012)
|
| Poland | US group (n = 24): sonotherapy with sonicator 730 device, in water bath, 1 MHZ, 0.5 W/cm2, duration dependent on area of ulceration ‐ e.g. 5 min for ≦ 5 cm2), 6 days/week for 7 weeks plus pharmacotherapy | All participants used moist normal saline dressing, and pharmacotherapy (diosmin 450 mg and hesperidin 50 mg combined as proprietary preparation (Detralex) All patients: treatment duration 7 weeks. Compression group (n = 25): compression plus stocking and pharmacotherapy Standard care group (n = 24): pharmacotherapy | People with venous ulcers who had undergone venous surgery by modified Babcock method. | Mean % change in ulcer area (relative to baseline) at 7 weeks: Group 1: ‐53.6%; Group 2: ‐69.4%; Group 3: ‐62.6% (P > 0.05 for all 3 comparisons between groups). Mean ± SD ulcer area in cm2 at 7 weeks (NB: comparisons are within group vs baseline): Group 1: 14.1 ± 11.7 (P = 0.00002); Group 2: 8.8 ± 10.0 (P = 0.00001); Group 3: 11.4 ± 14.1 (P = 0.00002). |
|
Poland | Surgery + US group (n = 21): surgery plus US, compression stockings (Sigvaris, 30 mmHg‐40 mmHg at ankle), drug therapy
No surgery + US group: US, compression and drug therapy
Drug therapy was flavonoid (450 mg diosmin, 50 mg hesperidin), 2 tabs (one of each) twice daily.
Ulcers covered by saline soaks. Dressings changed once day only in clinic.
Ultrasound; 0.5 W/cm2 pulsed; impulse 2 mS, interval 8 mS. Frequency 1 MHz. Performed in a bath of water with temp 34 °C. probe head 10 cm2 placed 2 cm above ulcer. An ulcer of 5 cm2 or less had 5 minutes treatment, with 1 minute more for each 1 cm2 by which the ulcer exceeded this size. If larger than 20 cm2 the ulcer was divided in 2. Treatment daily for 6 days/week for 7 weeks.
INDIRECT and HIGH FREQUENCY | Surgery ‐ US group (n = 20): surgery plus compression and drug therapy
No surgery ‐ US group (n = 20): compression and drug therapy
Drug therapy was flavonoid (450 mg diosmin, 50 mg hesperidin), 2 tabs (one of each) twice daily. Ulcers covered by saline soaks. Dressings changed once day only in clinic. | People with venous disease assessed by symptoms and Duplex scanning. All offered venous surgery. Those refusing surgery were randomised to US or no US.
| Group 1 vs. Group 2 Group 3 vs. Group 4
Numbers completely healed at 7 weeks: Group 1: 6/21 Group 2: 6/20
Group 3: 6/20 Group 4: 3/20
|
|
UK Community nurse services, community leg ulcer clinics, and hospital outpatient leg ulcer clinics | US group (n = 168): low‐dose (0.5 W/cm2) US, 1 MHz, with a pulsed pattern of 1:4, applied for 5 to 10 minutes to periulcer skin, weekly for up to 12 weeks, plus standard care, then standard care alone. DIRECT and HIGH FREQUENCY
| Standard care group (n = 169): simple low‐adherent dressing and high compression (4‐layer bandage), reduced compression or no compression depending on participant tolerance.
| 337 patients with hard‐to‐heal venous leg ulcers i.e., ulcer of 6 months’ duration or more and/or area greater than 5 cm2. Considered a venous ulcer if no other obvious causative factor and ulcer appeared clinically venous (moist, shallow, irregular shape, venous eczema, ankle oedema, lipodermatosclerosis, ulcer not confined to the foot). Participants had to have ABPI of 0.8 or greater. Excluded if poorly controlled diabetes, ankle prostheses, thrombophlebitis, active infection including cellulitis, local or metastatic cancer.
| Hazard ratio* for US vs. SC 0.99 (0.70 to 1.40), p = 0.969 (NSD). * the analysis adjusted for centre as a random effect, ulcer area (from baseline tracing), ulcer duration and whether or not the patient was treated with high‐compression bandaging. Median time (for all ulcers) to complete healing: US: 365 days (95% CI 224, inestimable) SC: 328 days (95% CI 235, inestimable) P = 0.9051, log rank.
Ulcers completely healed/not healed (%) at 8 wks (personal communication): US: 9/168 SC: 15/169
Ulcers completely healed/not healed (%) at 12 wks (personal communication): US: 26/168 SC: 25/169 Ulcers completely healed/not healed (%) at 12 month (personal communication): US: 72/168 SC: 78/169 HRQoL by SF‐12: Mean Baseline PCS (SD): US: 36.55 (11.32); n = 160 SC: 35.33 (11.47); n = 167
3 month PCS (SD): US:33.87 (11.49); n = 143 SC: 34.96 (11.39); n = 142
12 month PCS (SD): US:34.61 (12.09); n = 118 SC: 35.57 (11.39); n = 111 Baseline MCS (SD): US: 46.72 (11.52); n = 160 SC: 47.11 (11.29); n = 167
3 month MCS (SD): US: 45.95 (12.22); n = 143 SC: 46.83 (11.38); n = 142
12 month MCS (SD): US: 47.51 (11.54); n = 118 SC: 45.41 (12.15); n = 111 Serious Adverse Events (SAEs): US: 35/168 patients SC: 29/169 patients Non serious AEs: SC: 67/169 patients NS using random effects negative binomial regression (p = 0.3904).
Using random effects negative binomial regression showed that significantly more non serious AEs in US group (p = 0.0411).
For all adverse events in random effects binomial regression, there was a significant effect of treatment (p = 0.0446). Adjusted annual costs ( 95% bias‐corrected CI): US arm 1583.39 (1427.51 to 1728.70) vs. SC arm 1385.51 (1223.84 to 1549.21 |
|
Outpatient clinic
Germany | US group: 'experimental' 30 kHz US applicator mounted to footbath. Transducer positioned within 5 cm of ulcer surface. Surface subjected to 30 kHz US at 0.1 W/cm2 for 10 minutes, plus standard care.
INDIRECT and LOW FREQUENCY | Conventional therapy group: topical fibrinolytic agents, antibiotics or other antiseptics and occlusive dressings. Eczema of surrounding skin could be treated with topical steroids. Compression with elastic bandages. Dressings changed at least 3 x per week.
Participants received foot bathing but participants in US group did not. | Inclusion: presence of ulceration for min. 3 mo. plus evidence of venous incompetence. Excluded: diabetes, arterial disease. | Mean ulcer area at 3 weeks (SD): US: 8.3 (6.4) C: 14.7 (10.4)
Mean ulcer area at 8 weeks (SD): US: 6.2 (5.9) C: 13.4 (12.1)
Ulcers completely healed at 8 weeks: US: 1/19 C: 0/19 (0/18 completers)
US: no/minor complaints about pain with US. Mild to mod erythema often observed with US. |
1.3 Secondary outcomes
1.3.1 Adverse events
Watson 2011 reported outcomes for all 337 randomised participants, and reported data from participants who withdrew from the trial in the final analysis. The study reported a total of 88 serious adverse events (SAEs) experienced by 64 participants: 29 (45%) in the standard care group and 35 (55%) in the ultrasound group. The SAEs included death, life threatening risk, hospitalisation, persistent or significant disability, and new diagnosis as diabetic. There were 445 non‐serious adverse events in 153 participants: 67 participants (44%) in the standard care group and 86 participants (56%) in the ultrasound group. Significantly more people receiving ultrasound experienced adverse events than those receiving standard care (from original trial report, as analysed by random‐effects negative binomial regression); most were non‐serious (Watson 2011). We judged the quality of evidence to be moderate; we downgraded once for imprecision ‐ summary of findings Table for the main comparison.
In Callam 1987 a total of 26/108 (24%) randomised participants withdrew, leaving 76% of those randomised to provide outcome data. Proportions and reasons for withdrawal were similar across the two treatment groups: 11/52 (21%) withdrew from the ultrasound group because of allergy (four), pain (four), death (two), and withdrawn consent (two); 15/56 (27%) withdrew from the standard care group for reasons of allergy (six), pain (three), deterioration (two), withdrawal of consent (three), and newly‐diagnosed arterial disease (one).
In the Eriksson 1991 trial 7/19 (37%) participants withdrew from the ultrasound group (three for allergy, two for pain, and two withdrew consent) compared with 6/19 (32%) from the control group (two for allergy, one for pain, three withdrew consent).
In the Lundeberg 1990 trial, 5/22 participants (23%) randomised to ultrasound withdrew (two for allergy, one for pain, two withdrew consent) compared with seven out of 22 (32%) from the sham group (three for allergy, one for pain, three withdrew consent). Dolibog 2008, Franek 2004, Franek 2006, Taradaj 2007 and Taradaj 2008 did not report any withdrawals or adverse events.
1.3.2 Quality of life
Only the Watson 2011 study reported on quality of life. There was no observable change in the physical component scores (PCS) or mental component scores (MCS) of the SF‐12 over 12 months' follow‐up, and no observed difference between treatment groups (n = 229). The mean health‐related quality of life (HRQoL) PCS in the intervention group was 0.96 less (3.17 less to 1.25 more); and the MCS in the intervention group was 2.1 more (0.97 less to 5.17 more). Participants in both groups exhibited lower mean PCS and MCS than the general population of the USA, suggesting the leg ulcer patients in this trial had lower HRQoL than the USA population of a similar age (Watson 2011). The quality of evidence was moderate, downgraded for imprecision ‐ summary of findings Table for the main comparison.
1.3.3 Cost
Watson 2011 also reported the outcome of cost: addition of ultrasound treatment to standard care cost, on average, GBP 197.88 more per participant per year (95% bias‐corrected CI GBP ‐35.19 to GBP 420.32). This difference was not statistically significant. The quality of evidence was moderate, downgraded for imprecision ‐ summary of findings Table for the main comparison.
Summary: high‐frequency ultrasound compared with no ultrasound
Current evidence suggests no clear difference in the proportion of venous ulcers healed at any time‐point nor for the hazard of healing, when high‐frequency ultrasound was compared with no ultrasound. There are few comparative data available at most of the follow‐up time points, especially for the short‐term periods. The majority of trials included were small, reported very limited outcome data and were at an unclear or high risk of bias. Only one study (newly included in this 2016 update) was conducted well methodologically and contributed usefully to this review. One small, poor quality study reported a greater mean reduction in ulcer size at four weeks in the ultrasound group compared with the control group.
Comparison 2: Low‐frequency ultrasound compared with standard care or sham ultrasound (two trials; 61 participants)
Two RCTs evaluated indirectly‐applied, low‐frequency ultrasound. Both Peschen 1997 and Weichenthal 1997 applied ultrasound at 30 kHz, 0.1 W/cm2, three times a week via a water bath. These trials reported healing outcomes at different time points (12 weeks in Peschen 1997, and eight weeks in Weichenthal 1997).
2.1 Primary outcome: ulcer healing at eight to 12 weeks
We pooled these two studies for the outcome of healing at eight to 12 weeks, and used a fixed‐effect model as the I2 value was 0 (Analysis 2.1). These studies found no clear difference in the risk of healing associated with low‐frequency ultrasound applied three times a week (RR 3.91, 95% CI 0.47 to 32.85). This result did not change appreciably when we applied a random‐effects model (RR 3.85, 95% CI 0.45 to 32.84, not shown), however, as there were only three ulcers healed across these two trials, this comparison is underpowered and a treatment effect cannot be excluded. We judged that the quality of evidence to be very low: we downgraded once for risk of bias due to both studies being at unclear or high risk of bias, and twice for extreme imprecision; seesummary of findings Table 2.
2.2 Secondary outcomes
Weichenthal 1997: microbleeding around the ulcer occurred in 5/12 ulcers in the ultrasound group compared with none in the sham ultrasound group. Participants' experiences of pain were reported, however, this does not appear to have been measured systematically. Pain was reported as follows: in the ultrasound group one participant reported no change in baseline pain, eight complained of pain prior to treatment; and pain was no longer reported by any participants at the start of week four. In the sham ultrasound group one participant reported no change in baseline pain, while 10 complained of pain at various time points. There was no reporting of HRQoL or cost.
Peschen 1997: this study reported treatment‐related adverse events only for participants in the ultrasound group. Eleven out of 19 participants in the ultrasound group felt no pain or mild pain on fewer than three treatment occasions; 7/19 reported pain on more than two occasions, but severe pain on fewer than three treatment occasions; 1/19 reported severe pain on more than two occasions. Twelve out of 19 ultrasound participants experienced erythema on more than two occasions. There was no reporting of HRQoL or costs.
Summary: Low‐frequency ultrasound compared with no ultrasound at eight to 12 weeks' follow‐up
Two small studies with short follow‐up periods that were at an unclear of bias reported limited outcome data. These found no evidence of a difference in ulcer healing with low‐frequency ultrasound compared with no ultrasound at eight to 12 weeks' follow‐up.
Sensitivity analyses
Where the number randomised differed from the number analysed, we undertook the primary analysis using the numbers randomised as the denominator (i.e. assuming losses to follow‐up were unhealed). We then examined the impact of this decision in a sensitivity analysis where we analysed complete cases only.
High‐frequency ultrasound
The result of the sensitivity analysis for high‐frequency ultrasound at seven to eight weeks for the Callam 1987, Eriksson 1991, Lundeberg 1990, Dolibog 2008, and Taradaj 2008 studies; Analysis 1.2), using a complete case analysis (Average treatment RR for healing with ultrasound 1.21, 95% CI 0.88 to 1.67; I2 = 8%, random‐effects) was consistent with the result when losses were regarded as unhealed (Average treatment RR for healing with ultrasound 1.21, 95% CI 0.86 to 1.71; I2 = 13%, random‐effects). This was also the case for results at 12‐week follow‐up (RR for healing with ultrasound compared with no ultrasound using a complete case analysis was 1.20, 95% CI 0.89 to 1.62 (I2 = 0%, fixed‐effect); compared with an RR of 1.26, 95% CI 0.92 to 1.73 (I2 = 0%, fixed‐effect) when losses were regarded as unhealed (Analysis 1.3).
Low‐frequency ultrasound
In the Peschen 1997 study, two participants were withdrawn from the control group for non‐compliance, however different assumptions about the healing outcome of these two participants did not affect the results (RR for ulcer healing at 12 weeks for ultrasound compared with no ultrasound when losses regarded as unhealed 5.00, 95% CI 0.27 to 94.34; RR for ulcer healing at 12 weeks using complete case analysis 4.23, 95% CI 0.23 to 79.10, not shown).
'Summary of findings' tables
We have included two 'Summary of findings' tables (summary of findings Table for the main comparison; summary of findings Table 2), which give an overview of the volume and quality of the evidence.
Discussion
Summary of main results
This review has identified, appraised and presented all available randomised controlled trial (RCT) evidence regarding the clinical effectiveness of ultrasound in the treatment of venous leg ulcers. The review includes 11 relevant studies with a total of 969 participants. Overall the evidence was limited: most included studies were small and therefore statistically underpowered to detect treatment differences, had they existed.
The addition of a large, multicentre trial (Watson 2011) of high‐frequency, therapeutic ultrasound to this review update has made no appreciable difference to the conclusions of this review; we remain uncertain as to whether high‐frequency therapeutic ultrasound affects the healing rate of venous leg ulcers. The addition of a 337 participant trial, Watson 2011, to a review which hitherto contained data from only 467 randomised participants greatly increased the power of this review update. Furthermore, while most of the previous evidence came from trials that were deemed to be at high risk of bias, we assessed the newly added Watson 2011 study as being at low risk of bias for all domains except blinding of participants and personnel (where it was deemed to be at high risk). Thus the addition of Watson 2011 represents the inclusion of a large amount of high‐quality data for which we have greater confidence than that from the previous studies.
The primary outcome for this review was complete wound healing. Though nine of the 11 included studies reported this outcome, they did so at different time‐points. There was no clear evidence of a difference in the number of ulcers healed between the ultrasound and non‐ultrasound groups. Most included studies were small and underpowered, and our GRADE assessment classed the estimates from this evidence as being mainly of low quality. Only at 12 weeks, there was moderate quality evidence (due to Watson 2011) showing that it was uncertain whether high frequency ultrasound affects healing.
Another primary outcome, change in wound size (adjusted for baseline size), was reported by two studies ‐ both reported percentage reduction in area compared with baseline (Franek 2006; Taradaj 2007). Only one study reported a greater reduction in ulcer area with ultrasound than without (Franek 2006), however this study was at unclear risk of bias.
In terms of secondary outcomes, only one trial, Watson 2011, measured and reported health‐related quality of life and found no association with treatment. The same trial found significantly more adverse events in the ultrasound arm than in the standard care arm, though most of these were non‐serious. It also reported the outcome of cost, and showed no significant difference between the two arms.
In summary, it is unclear whether therapeutic ultrasound increases the healing of venous leg ulcers and any effect is likely to be very small.
Overall completeness and applicability of evidence
There are significant weaknesses in the completeness and applicability of the evidence overall. The trials were clinically heterogeneous with differences in duration of follow‐up (ranging from three weeks, through four weeks, seven weeks, eight weeks, and 12 weeks to 12 months). Four of the 11 studies were conducted by a single research team in Poland (Franek 2004; Franek 2006; Taradaj 2007; Taradaj 2008), and two of these studies were not included in meta‐analysis due to the lack of complete healing data in the original published trial reports.
Only one study reported costs, adverse events and quality of life via reliable methodologies (Watson 2011). Clearly any impact of treatments on patients' quality of life is invaluable information for all decision makers ‐ particularly patients. The relative cost‐effectiveness of ultrasound treatment is essential information for healthcare founders and providers. We therefore urge that future research in this field uses reliable methodologies to measure these outcomes.
There is relatively little replication of studies, with single, small studies for most comparisons. This weak evidence base makes it impossible to draw conclusions with confidence.
Quality of the evidence
Limitations of design and implementation
RCTs need to be adequately powered so that they are able to detect treatment effects of a specified size, should they exist. This means that sample size calculations should be used to help estimate the number of people who should be recruited to a trial. Additionally trials should have an adequate follow‐up period to ensure enough time for important outcome events, such as complete wound healing, to occur. The trials included in this study were all small and their follow‐up periods were generally short. This resulted in an evidence base with almost no complete healing data; generally the relevant outcome data that were reported were underpowered and imprecise, with wide confidence intervals.
Most studies included in this review were at a high or unclear risk of bias. In general, studies did not follow good practice for conduct and reporting guidelines, for example CONSORT (Schulz 2010). Key areas of good practice are the robust generation of a randomisation sequence, for example one that is computer‐generated; robust allocation concealment, for example by use of a telephone randomisation service; and blinded outcome assessment where possible. All this information should be clearly stated in the study report, as all trial authors should anticipate the inclusion of their trials in systematic reviews. Additionally, studies should report clearly how they planned to collect adverse event data and how this process was standardised for both treatment arms. In terms of analysis, where possible, data from all participants should be included, that is, an intention‐to‐treat analysis should be conducted and measurements of variation such as the standard deviation or standard error should be presented around outcome measurements where appropriate. As far as is possible when conducting trials, steps should be taken to prevent missing data.
Where possible, studies should use validated scales to measure outcomes. The use of invalidated scales, including those that have been modified in an ad hoc way, can limit the value of the data collected, as it can be difficult to interpret and to synthesis across studies.
Potential biases in the review process
The review considered as much evidence as it was possible to obtain, including studies that were not published in English language journals. While there is a potential for publication bias, this is unlikely to be a problem for this review given the large number of negative findings that have been published.
Agreements and disagreements with other studies or reviews
Current evidence does not indicate a difference in the healing of venous leg ulcers when using or not using ultrasound. This finding is consistent with that of another systematic review of ultrasound on pressure ulcers (Akbari Sari 2006), which also found uncertain evidence of benefit of ultrasound therapy.

Methodological quality graph: review authors' judgements about each methodological quality item presented as percentages across all included studies.
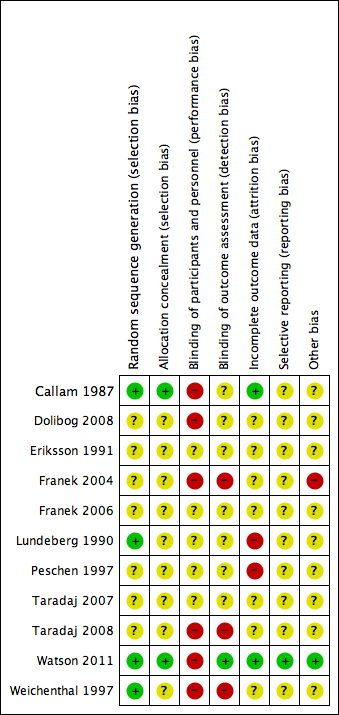
Methodological quality summary: review authors' judgements about each methodological quality item for each included study.

Study flow diagram

Comparison 1 High frequency US vs no US, Outcome 1 Proportion of ulcers completely healed at 3 weeks.

Comparison 1 High frequency US vs no US, Outcome 2 Proportion of ulcers completely healed at 7 or 8 weeks.

Comparison 1 High frequency US vs no US, Outcome 3 Proportion of ulcers completely healed at 12 weeks.

Comparison 1 High frequency US vs no US, Outcome 4 Proportion of ulcers completely healed at 12 months (nurse‐reported data).

Comparison 1 High frequency US vs no US, Outcome 5 HRQoL: 12‐week SF‐12 Physical Component Score.

Comparison 1 High frequency US vs no US, Outcome 6 HRQoL: 12‐week SF‐12 Mental Component Score.

Comparison 1 High frequency US vs no US, Outcome 7 HRQoL: 12‐month SF‐12 Physical Component Score.

Comparison 1 High frequency US vs no US, Outcome 8 HRQoL: 12‐month SF‐12 Mental Component Score.
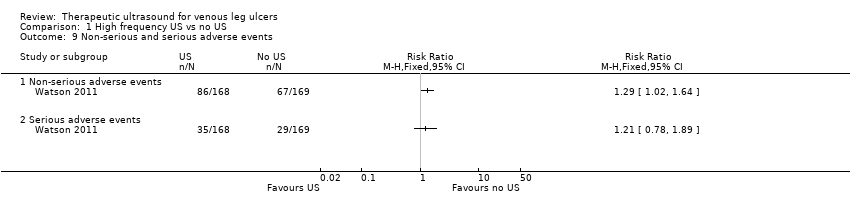
Comparison 1 High frequency US vs no US, Outcome 9 Non‐serious and serious adverse events.

Comparison 2 Low frequency US vs no US, Outcome 1 Proportion of ulcers completely healed at 8‐12 weeks.
| High frequency ultrasound compared with no ultrasound for people with venous leg ulcers | ||||||
| Patient or population: people with venous leg ulcers | ||||||
| Outcomes | Anticipated absolute effects* (95% CI) | Relative effect | № of participants | Quality of the evidence | Comments | |
| Risk with no ultrasound | Risk with high frequency ultrasound | |||||
| Proportion of ulcers completely healed at 3 weeks | Study population | RR 2.05 | 65 | ⊕⊝⊝⊝ | Highly uncertain whether high frequency ultrasound affects healing at 3 weeks. | |
| 45 per 1000 | 93 per 1000 | |||||
| Moderate | ||||||
| 45 per 1000 | 92 per 1000 | |||||
| Proportion of ulcers completely healed at 7 or 8 weeks: losses to follow‐up regarded as unhealed | Study population | RR 1.21 | 678 | ⊕⊕⊝⊝ | Highly uncertain whether high frequency ultrasound affects healing at 7 to 8 weeks. | |
| 166 per 1000 | 198 per 1000 | |||||
| Moderate | ||||||
| 218 per 1000 | 259 per 1000 | |||||
| Proportion of ulcers completely healed at 12 weeks: losses to follow‐up regarded as unhealed | Study population | RR 1.26 | 489 | ⊕⊕⊕⊝ | Uncertain whether high frequency ultrasound affects healing at 12 weeks. | |
| 202 per 1000 | 255 per 1000 | |||||
| Moderate | ||||||
| 304 per 1000 | 383 per 1000 | |||||
| High10 | ||||||
| 500 per 1000 | 630 per 1000 | |||||
| Healing at 12 months (nurse‐reported data) | Study population | RR 0.93 | 337 | ⊕⊕⊝⊝ | Uncertain whether high frequency ultrasound affects healing at 1 year. | |
| 462 per 1000 | 429 per 1000 | |||||
| Moderate | ||||||
| 461 per 1000 | 429 per 1000 | |||||
| High11 | ||||||
| 800 per 1000 | 744 per 1000 | |||||
| Change in ulcer size at 4 or 7 weeks | Mean percentage change in ulcer area was reported in both studies. Data were insufficient to conduct a meta‐analysis. One study (4‐week follow‐up) found a difference in change in ulcer size between groups. The other study reported no clear difference. | 165 (2 RCTs) | ⊕⊝⊝⊝ | Highly uncertain whether high frequency ultrasound affects change in ulcer size at 4 or 7 weeks. | ||
| Non‐serious adverse events | Study population | RR 1.29 | 337 | ⊕⊕⊕⊝ | The data refer to the number of people experiencing adverse events, rather than the number of adverse events. | |
| 172 per 1000 | 221 per 1000 | |||||
| Moderate | ||||||
| 172 per 1000 | 222 per 1000 | |||||
| Serious adverse events | Study population | RR 1.21 | 337 | ⊕⊕⊕⊝ | The data refer to the number of people experiencing adverse events, rather than the number of adverse events. | |
| 396 per 1000 | 480 per 1000 | |||||
| Moderate | ||||||
| 396 per 1000 | 479 per 1000 | |||||
| HRQoL: 12‐week SF‐12 mean Physical/Mental Component Scores | Physical Component Score (PCS) mean (SD): 34.96 (11.39) Mental Component Score (MCS) mean (SD): 46.83 (11.38) | PCS in the ultrasound group was 1.09 lower (3.75 lower to 1.57 higher) MCS in the ultrasound group was 0.88 lower (3.62 lower to 1.86 higher) | See comment | 285 | ⊕⊕⊕⊝ | No clear differences in physical or mental HRQoL at 12 weeks |
| HRQoL: 12‐month SF‐12 Physical Component Score | PCS mean (SD): 35.57 (1.88) MCS mean (SD): 45.41 (12.15) | PCS in ultrasound group was 0.96 lower (3.17 lower to 1.25 higher) MCS in ultrasound group was 2.1 higher (0.97 lower to 5.17 higher) | See comment | 229 | ⊕⊕⊕⊝ | No clear differences in physical or mental HRQoL at 12 months |
| Cost Follow‐up: 12 months | Addition of ultrasound treatment to standard care cost GBP 197.88 more per participant per year (95% bias‐corrected CI GBP ‐35.19 to GBP 420.32) | 337 | ⊕⊕⊕⊝ | No clear differences in cost at 12 months | ||
| *The risk in the intervention group (and its 95% confidence interval) is based on the assumed risk in the comparison group and the relative effect of the intervention (and its 95% CI). | ||||||
| GRADE Working Group grades of evidence | ||||||
| 1 Downgraded due to risk of bias (two levels) ‐ at high or unclear risk of performance bias; the use of US was not the only difference in treatment between groups 2 Downgraded due to imprecision (one level) ‐ 95% CIs were very wide 3 Downgraded due to imprecision (one level) ‐ very short follow‐up time 4 Only 5 participants reached the endpoint (complete ulcer healing) and 4 of them were in the intervention group 5 Downgraded due to risk of bias (one level) ‐ most studies at high or unclear risk of bias 6 Downgraded due to imprecision (one level) ‐ 95% CIs were wide with only 122 participants reaching the endpoint 7 Downgraded due to imprecision (one level) ‐ only 111 participants across the three trials reached the endpoints and the OIS is hard to reach (Guyatt 2011) 8 Downgraded due to risk of bias (one level) since the outcome of healed wounds was based on nurse‐reported data 9 Downgraded due to imprecision estimate (one level) ‐ low event rate; OIS is hard to reach 10 High risk of healing at 12 weeks of 50% taken from a large, well conducted RCT where patients all received best practice care (Iglesias 2004). Moderate risk taken from median control group healing rate in these trials 11 With best practice (i.e. high compression bandaging), a baseline risk of healing at 12 months would be approximately 80% (Iglesias 2004) | ||||||
| Low frequency ultrasound compared with no ultrasound for people with venous leg ulcers | ||||||
| Patient or population: venous leg ulcers | ||||||
| Outcomes | Anticipated absolute effects* (95% CI) | Relative effect | № of participants | Quality of the evidence | Comments | |
| Risk with no ultrasound | Risk with Low frequency US | |||||
| Proportion of ulcers completely healed at 8 to 12 weeks | Study population | RR 3.91 | 61 | ⊕⊝⊝⊝ | There were no events in the control groups so we added 0.5 to the cell as a fixed value (as per Cochrane Handbook). Highly uncertain whether low frequency ultrasound affects healing at 8 to 12 weeks. | |
| 17 per 1000 | 65 per 1000 | |||||
| High3 | ||||||
| 300 per 1000 | 1000 per 1000 | |||||
| Adverse events | No study reported adverse events | Pain was reported; however, this does not appear to have been measured systematically. | ||||
| HRQoL | No study reported HRQoL | |||||
| Cost | No study reported cost | |||||
| *The risk in the intervention group (and its 95% confidence interval) is based on the assumed risk in the comparison group and the relative effect of the intervention (and its 95% CI). | ||||||
| GRADE Working Group grades of evidence | ||||||
| 1 Downgraded due to risk of bias (one level) because both studies were at unclear or high risk 2 Downgraded due to imprecision (two levels): the OIS is hard to reach; very wide 95% CIs ‐ ranging in the ultrasound group from a 53% reduction of risk for ulcer healing to a 3285% increased risk (Guyatt 2011) 3 With best practice (i.e. high compression bandaging), a baseline risk of healing at 10 weeks (midpoint of 8 and 12 weeks) would be approximately 30% (Iglesias 2004) | ||||||
| Study | Intervention and Co‐interventions | Comparison intervention | Participants | Results |
|
5 physiotherapy departments
Scotland
NB 2 related abstracts say there were 110 participants
| US group (n = 52): DIRECT and HIGH FREQUENCY
*Lancet paper reports this frequency as 1 mHz. Verified with M Callam in Dec 09 that this should have read 1 MHz. | Standard treatment group (n = 56): cleansing with 1% saline; application of Arachis oil to skin without massage; application of paste bandage (Calaband); application of support bandage (Lestreflex); advice on exercise.
Weekly treatment. | Included: patients attending clinics for treatment of chronic leg ulcers Excluded: non consent, allergy to standard treatment, PVD (lack of ankle pulses) | Ulcers completely healed by 12 wks: US: 25/52 (48%) C: 17/56 (30%)
Read from graph: Ulcers completely healed at 8 wks: US: 23/52 (45%) C: 14/56 (25%)
Ulcers completely healed by 12 wks (complete case): US: 25/41 (61%) C: 17/41 (41%)
US treated healed sig more quickly by log rank ;=0.03. this effect persisted even when withdrawals due to pain and deterioration counted as failures.
Mean % ulcer unhealed at 12 weeks (no variance): US: 9% C: 27% P<0.05
Withdrawals: US: 11/52 (21%) Allergy 4 Pain 4 DNA/refused 2 Death 2
C: 15/56 (27%) Allergy 6 Pain 3 Refused/DNA 3 Deterioration 2 Arterial disease 1 |
|
Poland
| US group: 33 participants treated with US, compression (Sigvaris), and drug therapy.
INDIRECT and HIGH FREQUENCY | Standard care group (n = 37): compression and drug therapy. Dressings changed daily for 7 weeks. | 70 participants with venous leg ulcers who all had venous surgery, and diagnosed as having venous disease with Duplex scanning.
Excluded: diabetes, rheumatoid arthritis Surgery included crossectomy, partial stripping of GSV or LSV, local phlebectomy, ligation of perforators. | Ulcers healed completely: Group 1: 10/33 Group 2: 12/37
Mean area after therapy (SD) Group 1: 13.15 (11.55) Group 2: 13.12 (14.57)
|
|
Hospital and primary care
Sweden | US group: 1.0 W/cm2 at 1 MHz. Enraf Nonius US machine with aquasonic gel. Ultrasound head was 2.8 cm diameter for superficial ulcers and 1.2 cm diameter for deep ulcers. US applied to ulcer surface area and surrounding tissue for 10 minutes twice a week for 8 weeks.
DIRECT and HIGH FREQUENCY | Sham US group: cleaned with saline; paste bandage, support bandage plus exercise advice (no further details provided). | Included; people with venous leg ulcers Excluded: allergy to standard treatment, arterial disease, rheumatoid arthritis, diabetic ulcers, traumatic venous ulcer | Ulcers completely healed at 8 wks: US: 6/19 (6/12 completers) C: 4/19 (4/13 completers)
Cumulative % healed compared using life table methods.
% ulcers completely healed at different times (wks) US:C 2 wks: 8:0 4 wks: 17:8 6 wks: 25:15 8 wks: 41:30
% ulcer area healed at 8 wks (SD): US: 42 (9) C: 48 (13)
Withdrawals: US: 7/19 C: 6/19
For allergy: US: 3 C: 2
For pain: US: 2 C: 1
Refusal/DNA: US: 2 C: 3 |
|
Poland
Hospital inpatients
| US group 1: US at 1 W/cm2 (n = 22) US group 2: US at 0.5 W/cm2 (n = 21)
Both groups received pulsed cycle of 1:5, frequency 1 MHz.
Cointerventions: saline soaked gauze. Single‐layer elastic compression (Hartmann). INDIRECT and HIGH FREQUENCY | Pharmacotherapy group (n = 22): no US. Local baths of potassium permanganate and wet dressings of 0.1M copper sulphate solution plus compresses of fibrolan, chloramphenicol, colistin, gentamicin. Drugs alternated every few days. Single layer elastic compression (Hartmann). Treatment for 3 weeks.
This was problematic as the use of US or not was not the only difference in treatment between the groups i.e. performance bias. Also US groups 1 and 2 were hospitalised in the Dermatology Clinic of Katowice and Group C in the Dermatology Dept of Zabrze.
| Included: people with venous ulcers (signs of venous disease) and ABPI > 1.0. Excluded: people with diabetes, advanced sclerosis
| Mean (median) area after treatment (cm2): A: 14 (11.14) p = 0.0001 B: 9.29 (3.78) p = 0.00006 C: 20.58 (9.86) p = 0.002
Complete ulcer healing by 3 weeks: A: 1/22 B: 3/21 C: 1/22
|
| Poland Hospital inpatients | Electrostimulation group: once a day, 50 minutes each session, 6 consecutive days, 4 weeks total (2 weeks cathodic and 2 weeks anodic stimulation), NaCl 0.9% locally (no further details provided) Laser therapy group: 65 mW once a day, 5 consecutive days, duration of each session depending of ulceration area – device was set up to develop 4J/cm2 on average power 65 mW, various pharmacological agents locally, 4 weeks total US group: 0.5 W/cm2 – once a day, duration of each session depending on ulceration area: 5 cm2 received 5 minutes, plus 1 minute more for each 1 cm2 of additional ulcer area, 4 weeks total, 0.9% NaCl locally | Compression therapy provided for all groups. Bandages were removed every time for purposes of physical therapy and then put back on. Compression + pharmacological agents group: 4 weeks total | People with venous leg ulcers | Mean % change in ulcer area (relative to baseline) at 4 weeks: Group 1: ‐55.26%; Group 2: ‐35.97%; Group 3: ‐63.42%; Group 4: ‐30.77% P(Group 3 & Group 4) = 0.007 |
|
Sweden
| US. group (n = 22): US: pulsed 1:9 0.5 W/cm2 at 1 MHz US applied to ulcer surface and surrounding tissue for 10 minutes; probe applied for 1 minute per probe head area (no further details provided). Treated 3 x per week for 4 weeks, then 2 x per week for 4 weeks, then once a week for 4 weeks. Plus standard care, which comprised of cleansing with saline; paste bandage; support bandage; exercise instructions.
DIRECT and HIGH FREQUENCY | Sham US (no further details provided) + standard treatment group (n = 22): standard care consisted of cleansing with saline; paste bandage; support bandage; exercise instructions. | Patients with VLUs referred from depts. of internal medicine, surgery, primary health care.
Exclusion: skin allergy, PVD, RA, DM, traumatic venous ulcer.
| Cumulative % (n) healed at 8 weeks: US: 30% (5) C: 20% (3)
Cumulative % (n) healed at 12 weeks: US: 59% (10) C: 52% (8)
Mean % ulcer area remaining at 8 weeks (SD) in patients completing: US: 47% (8) C: 53% (10)
Mean % ulcer area remaining at 12 weeks (SD) in patients completing: US: 39% (5) C: 43% (6)
12/44 patients withdrew (7 placebo group, 5 US group).
Placebo: 3 allergy, 1 pain, 3 DNA/refused.
US: 2 allergy, 1 pain, 2 DNA/refused |
|
Germany
Outpatient clinic | US group (n = 12): US treatment involved placing legs in footbath of water at 32 °C‐34 °C filled to 10 cm above the ulcer. US sound head transducer immersed in bath and placed in line with ulcer 5 cm away. The continuous US was given for 10 minutes at 30 kHz, 0.1 W/cm2 3 x per week. Standard care was also given. This comprised HCL dressings (Coloplast); compression therapy using “strong‐quality elastic compression bandages (Beiersdorf)”
INDIRECT and LOW FREQUENCY | Sham US group (n = 12): sham US plus standard care
Sham procedure involved placing legs in footbath of water at 32 °C‐34 °C filled to 10 cm above the ulcer. US sound head transducer immersed in bath and placed in line with ulcer 5 cm away. Sham US for 10 minutes 3 x per week. Standard care consisted of HCL dressings (Coloplast); compression therapy using “strong‐quality elastic compression bandages (Beiersdorf)” | 24 people attending outpatients clinic. Included: people with chronic VLUs at least 2 cm2 and 3 months’ duration. Clinical diagnosis of VLU confirmed by history, Doppler US, light reflection rheography, ABPI of 0.8 or above. Excluded: arterial disease, liver, cardiac or renal insufficiency, heamorrhagic gastroduodenitis, colitis, leukaemia, diabetes, RA, treatment allergy.
| Complete ulcer healing at 12 weeks: US: 2/12 C: 0/12 (or 0/10 completers)
Mean % decrease in ulcer area 12 weeks: US: 55.4% C: 16.5% No variance data p<0.007
Micro‐bleeding around the ulcer: US: 5 C: 0
Pain: US: 3/12 C: 4/10 pain free
Irritation: US: 8/12 C: 0
8 US patients felt tingling sensation during US.
After 12 wk treatment phase, standard care continued.
At 3 months post treatment: Mean ulcer area: US: 30.6% C: 70.2%
Mean change ulcer radius (mm) US: 9.9mm (n = 12) C: 5.3mm (n = 10) (P<0.012)
|
| Poland | US group (n = 24): sonotherapy with sonicator 730 device, in water bath, 1 MHZ, 0.5 W/cm2, duration dependent on area of ulceration ‐ e.g. 5 min for ≦ 5 cm2), 6 days/week for 7 weeks plus pharmacotherapy | All participants used moist normal saline dressing, and pharmacotherapy (diosmin 450 mg and hesperidin 50 mg combined as proprietary preparation (Detralex) All patients: treatment duration 7 weeks. Compression group (n = 25): compression plus stocking and pharmacotherapy Standard care group (n = 24): pharmacotherapy | People with venous ulcers who had undergone venous surgery by modified Babcock method. | Mean % change in ulcer area (relative to baseline) at 7 weeks: Group 1: ‐53.6%; Group 2: ‐69.4%; Group 3: ‐62.6% (P > 0.05 for all 3 comparisons between groups). Mean ± SD ulcer area in cm2 at 7 weeks (NB: comparisons are within group vs baseline): Group 1: 14.1 ± 11.7 (P = 0.00002); Group 2: 8.8 ± 10.0 (P = 0.00001); Group 3: 11.4 ± 14.1 (P = 0.00002). |
|
Poland | Surgery + US group (n = 21): surgery plus US, compression stockings (Sigvaris, 30 mmHg‐40 mmHg at ankle), drug therapy
No surgery + US group: US, compression and drug therapy
Drug therapy was flavonoid (450 mg diosmin, 50 mg hesperidin), 2 tabs (one of each) twice daily.
Ulcers covered by saline soaks. Dressings changed once day only in clinic.
Ultrasound; 0.5 W/cm2 pulsed; impulse 2 mS, interval 8 mS. Frequency 1 MHz. Performed in a bath of water with temp 34 °C. probe head 10 cm2 placed 2 cm above ulcer. An ulcer of 5 cm2 or less had 5 minutes treatment, with 1 minute more for each 1 cm2 by which the ulcer exceeded this size. If larger than 20 cm2 the ulcer was divided in 2. Treatment daily for 6 days/week for 7 weeks.
INDIRECT and HIGH FREQUENCY | Surgery ‐ US group (n = 20): surgery plus compression and drug therapy
No surgery ‐ US group (n = 20): compression and drug therapy
Drug therapy was flavonoid (450 mg diosmin, 50 mg hesperidin), 2 tabs (one of each) twice daily. Ulcers covered by saline soaks. Dressings changed once day only in clinic. | People with venous disease assessed by symptoms and Duplex scanning. All offered venous surgery. Those refusing surgery were randomised to US or no US.
| Group 1 vs. Group 2 Group 3 vs. Group 4
Numbers completely healed at 7 weeks: Group 1: 6/21 Group 2: 6/20
Group 3: 6/20 Group 4: 3/20
|
|
UK Community nurse services, community leg ulcer clinics, and hospital outpatient leg ulcer clinics | US group (n = 168): low‐dose (0.5 W/cm2) US, 1 MHz, with a pulsed pattern of 1:4, applied for 5 to 10 minutes to periulcer skin, weekly for up to 12 weeks, plus standard care, then standard care alone. DIRECT and HIGH FREQUENCY
| Standard care group (n = 169): simple low‐adherent dressing and high compression (4‐layer bandage), reduced compression or no compression depending on participant tolerance.
| 337 patients with hard‐to‐heal venous leg ulcers i.e., ulcer of 6 months’ duration or more and/or area greater than 5 cm2. Considered a venous ulcer if no other obvious causative factor and ulcer appeared clinically venous (moist, shallow, irregular shape, venous eczema, ankle oedema, lipodermatosclerosis, ulcer not confined to the foot). Participants had to have ABPI of 0.8 or greater. Excluded if poorly controlled diabetes, ankle prostheses, thrombophlebitis, active infection including cellulitis, local or metastatic cancer.
| Hazard ratio* for US vs. SC 0.99 (0.70 to 1.40), p = 0.969 (NSD). * the analysis adjusted for centre as a random effect, ulcer area (from baseline tracing), ulcer duration and whether or not the patient was treated with high‐compression bandaging. Median time (for all ulcers) to complete healing: US: 365 days (95% CI 224, inestimable) SC: 328 days (95% CI 235, inestimable) P = 0.9051, log rank.
Ulcers completely healed/not healed (%) at 8 wks (personal communication): US: 9/168 SC: 15/169
Ulcers completely healed/not healed (%) at 12 wks (personal communication): US: 26/168 SC: 25/169 Ulcers completely healed/not healed (%) at 12 month (personal communication): US: 72/168 SC: 78/169 HRQoL by SF‐12: Mean Baseline PCS (SD): US: 36.55 (11.32); n = 160 SC: 35.33 (11.47); n = 167
3 month PCS (SD): US:33.87 (11.49); n = 143 SC: 34.96 (11.39); n = 142
12 month PCS (SD): US:34.61 (12.09); n = 118 SC: 35.57 (11.39); n = 111 Baseline MCS (SD): US: 46.72 (11.52); n = 160 SC: 47.11 (11.29); n = 167
3 month MCS (SD): US: 45.95 (12.22); n = 143 SC: 46.83 (11.38); n = 142
12 month MCS (SD): US: 47.51 (11.54); n = 118 SC: 45.41 (12.15); n = 111 Serious Adverse Events (SAEs): US: 35/168 patients SC: 29/169 patients Non serious AEs: SC: 67/169 patients NS using random effects negative binomial regression (p = 0.3904).
Using random effects negative binomial regression showed that significantly more non serious AEs in US group (p = 0.0411).
For all adverse events in random effects binomial regression, there was a significant effect of treatment (p = 0.0446). Adjusted annual costs ( 95% bias‐corrected CI): US arm 1583.39 (1427.51 to 1728.70) vs. SC arm 1385.51 (1223.84 to 1549.21 |
|
Outpatient clinic
Germany | US group: 'experimental' 30 kHz US applicator mounted to footbath. Transducer positioned within 5 cm of ulcer surface. Surface subjected to 30 kHz US at 0.1 W/cm2 for 10 minutes, plus standard care.
INDIRECT and LOW FREQUENCY | Conventional therapy group: topical fibrinolytic agents, antibiotics or other antiseptics and occlusive dressings. Eczema of surrounding skin could be treated with topical steroids. Compression with elastic bandages. Dressings changed at least 3 x per week.
Participants received foot bathing but participants in US group did not. | Inclusion: presence of ulceration for min. 3 mo. plus evidence of venous incompetence. Excluded: diabetes, arterial disease. | Mean ulcer area at 3 weeks (SD): US: 8.3 (6.4) C: 14.7 (10.4)
Mean ulcer area at 8 weeks (SD): US: 6.2 (5.9) C: 13.4 (12.1)
Ulcers completely healed at 8 weeks: US: 1/19 C: 0/19 (0/18 completers)
US: no/minor complaints about pain with US. Mild to mod erythema often observed with US. |
| Outcome or subgroup title | No. of studies | No. of participants | Statistical method | Effect size |
| 1 Proportion of ulcers completely healed at 3 weeks Show forest plot | 1 | Risk Ratio (M‐H, Fixed, 95% CI) | Totals not selected | |
| 2 Proportion of ulcers completely healed at 7 or 8 weeks Show forest plot | 6 | Risk Ratio (M‐H, Random, 95% CI) | Subtotals only | |
| 2.1 Losses as unhealed | 6 | 678 | Risk Ratio (M‐H, Random, 95% CI) | 1.21 [0.86, 1.71] |
| 2.2 Complete case analysis | 6 | 627 | Risk Ratio (M‐H, Random, 95% CI) | 1.21 [0.88, 1.67] |
| 3 Proportion of ulcers completely healed at 12 weeks Show forest plot | 3 | Risk Ratio (M‐H, Fixed, 95% CI) | Subtotals only | |
| 3.1 Losses as unhealed | 3 | 489 | Risk Ratio (M‐H, Fixed, 95% CI) | 1.26 [0.92, 1.73] |
| 3.2 Complete case analysis | 3 | 451 | Risk Ratio (M‐H, Fixed, 95% CI) | 1.20 [0.89, 1.62] |
| 4 Proportion of ulcers completely healed at 12 months (nurse‐reported data) Show forest plot | 1 | Risk Ratio (M‐H, Fixed, 95% CI) | Totals not selected | |
| 5 HRQoL: 12‐week SF‐12 Physical Component Score Show forest plot | 1 | Mean Difference (IV, Fixed, 95% CI) | Totals not selected | |
| 6 HRQoL: 12‐week SF‐12 Mental Component Score Show forest plot | 1 | Mean Difference (IV, Fixed, 95% CI) | Totals not selected | |
| 7 HRQoL: 12‐month SF‐12 Physical Component Score Show forest plot | 1 | Mean Difference (IV, Fixed, 95% CI) | Totals not selected | |
| 8 HRQoL: 12‐month SF‐12 Mental Component Score Show forest plot | 1 | Mean Difference (IV, Fixed, 95% CI) | Totals not selected | |
| 9 Non‐serious and serious adverse events Show forest plot | 1 | Risk Ratio (M‐H, Fixed, 95% CI) | Totals not selected | |
| 9.1 Non‐serious adverse events | 1 | Risk Ratio (M‐H, Fixed, 95% CI) | 0.0 [0.0, 0.0] | |
| 9.2 Serious adverse events | 1 | Risk Ratio (M‐H, Fixed, 95% CI) | 0.0 [0.0, 0.0] | |
| Outcome or subgroup title | No. of studies | No. of participants | Statistical method | Effect size |
| 1 Proportion of ulcers completely healed at 8‐12 weeks Show forest plot | 2 | 61 | Risk Ratio (M‐H, Fixed, 95% CI) | 3.91 [0.47, 32.85] |