Inhaled anti‐pseudomonal antibiotics for long‐term therapy in cystic fibrosis
Abstract
Background
Inhaled antibiotics are commonly used to treat persistent airway infection with Pseudomonas aeruginosa that contributes to lung damage in people with cystic fibrosis. Current guidelines recommend inhaled tobramycin for individuals with cystic fibrosis and persistent Pseudomonas aeruginosa infection who are aged six years or older. The aim is to reduce bacterial load in the lungs so as to reduce inflammation and deterioration of lung function. This is an update of a previously published review.
Objectives
To evaluate the effects long‐term inhaled antibiotic therapy in people with cystic fibrosis on clinical outcomes (lung function, frequency of exacerbations and nutrition), quality of life and adverse events (including drug sensitivity reactions and survival).
Search methods
We searched the Cochrane Cystic Fibrosis Trials Register, compiled from electronic database searches and handsearching of journals and conference abstract books. We also searched ongoing trials registries.
Date of last search: 13 February 2018.
Selection criteria
We selected trials if inhaled anti‐pseudomonal antibiotic treatment was used for at least three months in people with cystic fibrosis, treatment allocation was randomised or quasi‐randomised, and there was a control group (either placebo, no placebo or another inhaled antibiotic).
Data collection and analysis
Two authors independently selected trials, judged the risk of bias, extracted data from these trials and judged the quality of the evidence using the GRADE system.
Main results
The searches identified 333 citations to 98 trials; 18 trials (3042 participants aged between five and 56 years) met the inclusion criteria. Limited data were available for meta‐analyses due to the variability of trial design and reporting of results. A total of 11 trials (1130 participants) compared an inhaled antibiotic to placebo or usual treatment for a duration between three and 33 months. Five trials (1255 participants) compared different antibiotics, two trials (585 participants) compared different regimens of tobramycin and one trial (90 participants) compared intermittent tobramycin with continuous tobramycin alternating with aztreonam. One of the trials (18 participants) compared to placebo and a different antibiotic and so fell into both groups. The most commonly studied antibiotic was tobramycin which was studied in 12 trials.
We found limited evidence that inhaled antibiotics improved lung function (four of the 11 placebo‐controlled trials, n = 814). Compared to placebo, inhaled antibiotics also reduced the frequency of exacerbations (three trials, n = 946), risk ratio 0.66 (95% confidence interval (CI) 0.47 to 0.93). There were insufficient data for us to be able to report an effect on nutritional outcomes or survival and there were insufficient data for us to ascertain the effect on quality of life. There was no significant effect on antibiotic resistance seen in the two trials that were included in meta‐analyses. Tinnitus and voice alteration were the only adverse events significantly more common in the inhaled antibiotics group. The overall quality of evidence was deemed to be low for most outcomes due to risk of bias within the trials and imprecision due to low event rates.
Of the eight trials that compared different inhaled antibiotics or different antibiotic regimens, there was only one trial in each comparison. Forced expiratory volume at one second (FEV1) % predicted was only found to be significantly improved with aztreonam lysine for inhalation compared to tobramycin (n = 273), mean difference ‐3.40% (95% CI ‐6.63 to ‐0.17). However, the method of defining the endpoint was different to the remaining trials and the participants were exposed to tobramycin for a long period making interpretation of the results problematic. No significant differences were found in the remaining comparisons with regard to lung function. Pulmonary exacerbations were measured in different ways, but one trial (n = 273) found that the number of people treated with antibiotics was lower in those receiving aztreonam than tobramycin, risk ratio 0.66 (95% CI 0.51 to 0.86). We found the quality of evidence for these comparisons to be directly related to the risk of bias within the individual trials and varied from low to high.
Authors' conclusions
Inhaled anti‐pseudomonal antibiotic treatment probably improves lung function and reduces exacerbation rate, but pooled estimates of the level of benefit were very limited. The best evidence is for inhaled tobramycin. More evidence from trials measuring similar outcomes in the same way is needed to determine a better measure of benefit. Longer‐term trials are needed to look at the effect of inhaled antibiotics on quality of life, survival and nutritional outcomes.
PICO
Plain language summary
Inhaling antibiotics to treat lung infection in people with cystic fibrosis
Review question
We reviewed the evidence for the benefit of inhaled antibiotics against persistent Pseudomonas aeruginosa infection in people with cystic fibrosis.
Background
Cystic fibrosis is an inherited disease which results in abnormal mucus in several parts of the body. The main part of the body affected is the lungs which are susceptible to infection by certain bacteria. Infection causes inflammation which results in progressive damage to the lungs. As people with cystic fibrosis get older, they are more likely to become infected on a long‐term basis with Pseudomonas aeruginosa. This is the most common cause of chronic lung infection in people with CF.
We wanted to find out whether antibiotics targeting Pseudomonas aeruginosa would reduce the effects of infection when they are inhaled into the lungs. We wanted to learn whether this treatment would improve lung function, quality of life and survival. We also looked for any harmful effects.
Search date
The evidence is current to: 13 February 2018.
Trial characteristics
The review included 18 trials with 3042 people with cystic fibrosis aged between five and 56 years of age. The trials lasted from three months to 33 months. Eleven of these trials compared inhaled antibiotics with placebo (an inhaled substance without the medication in it) and people were selected for one treatment or the other randomly. Eight of the trials compared one inhaled antibiotic with either a different inhaled antibiotic or a different schedule of the same inhaled antibiotic. One of the trials compared an antibiotic to placebo as well as to a different antibiotic and so fell into both groups.
Key results
Results from four trials showed that when compared to placebo, inhaled antibiotics improved lung function and reduced the number of times the people with cystic fibrosis had a worsening of symptoms (exacerbation). We did not find enough evidence to be able to comment on how these antibiotics affect quality of life, height and weight, or survival.
Where the trials compared different inhaled antibiotics, there was only one trial in each of the eight comparisons. In one trial we found that aztreonam improved lung function more than tobramycin, but no important differences were found in the other trials with regard to lung function.
Important side effects that were related to the treatment were not very common in the trials, but they were less common with tobramycin than with other antibiotics.
Quality of the evidence
The trials that we included in this review were very different in the way that they measured how well the lungs work after treatment and how often people experienced a sudden worsening of symptoms. That made it difficult for us to combine the results of different trials to strengthen our evidence. We thought the overall quality of evidence was low for most outcomes, mainly due to risks of bias within the trials and low event rates meaning results were not precise.
Authors' conclusions
Summary of findings
| Anti‐pseudomonal antibiotics compared with placebo for long‐term therapy in CF | ||||||
| Patient population: adults and children with CF and P aeruginosa Settings: outpatients Intervention: inhaled anti‐pseudomonal antibiotics Comparison: placebo | ||||||
| Outcomes | Illustrative comparative risks* (95% CI) | Relative effect | No of participants | Quality of the evidence | Comments | |
| Assumed risk | Corresponding risk | |||||
| Placebo | Inhaled anti‐pseudomonal antibiotics | |||||
| FEV1 (% predicted) Follow‐up: at 3 months and up to 36 months | 4 trials found a significant improvement in FEV1 with inhaled antibiotics compared to placebo, although no data were available for 3 of these. 1 trial reported that the rate of decline in FEV1 favoured antibiotics. The remaining 6 trials showed no significant difference between inhaled antibiotics and placebo. | NA | 1130 | ⊕⊕⊝⊝ | The included trials all measured FEV1 but in different ways and for different lengths of time. It was not possible to combine the trials in a meta‐analysis. | |
| FVC (% predicted) Follow‐up: at 3 months and up to 36 months | 5 of the 10 trials found significant changes in FVC at the end of the trial period, favouring inhaled antibiotics when compared to placebo. 1 trial found no significant difference in absolute values of FVC % predicted between inhaled antibiotics and control but found that mean change in FVC % predicted was significantly different (favouring antibiotics). 1 trial found a combination of gentamycin and carbenicillin versus placebo to be significantly different and favouring antibiotics yet ceftazidime versus placebo was not significantly different. 3 trials found no significant difference between antibiotics and placebo with regard to FVC % predicted. | NA | 1097 | ⊕⊕⊝⊝ | FVC was measured differently across the trials. | |
| Pulmonary exacerbations: frequency of one or more hospital admissions Follow‐up: over 3 months and up to 12 months | 397 per 1000 | 262 per 1000 | RR 0.66 (0.47 to 0.93) | 946 | ⊕⊕⊝⊝ | |
| Quality of life: lost school or working days. Follow‐up: over 3 months and up to 12 months | The mean number of lost school or working days in the control group was 10 days. | The mean number of lost school or working days in the inhaled antibiotic group was 5.3 days lower (8.59 lower to 2.01 lower). | NA | 245 | ⊕⊕⊝⊝ | |
| Survival: number of deaths Follow‐up: over 3 months and up to 12 months | 17 per 1000 | 3 per 1000 | RR 0.17 (0.03 to 1.09) | 767 | ⊕⊕⊝⊝ | |
| Antibiotic resistance: frequency of tobramycin‐resistant P aeruginosa Follow‐up: at end of trial (12 months) | 105 per 1000 | 205 per 1000 | RR 1.95 (0.86 to 4.42) | 672 | ⊕⊕⊕⊝ | |
| Adverse events Follow‐up: at the end of the trial (84 days to 33 months) | There were no significant differences between inhaled antibiotics and placebo for auditory impairment, pneumothorax, haemoptysis. Tinnitus and voice alteration were significantly more common in the inhaled antibiotics groups. | NA | 1014 (6) | ⊕⊝⊝⊝ | Rate of auditory impairment reported in 5 trials for 996 participants. Rate of pneumothorax reported in 3 trials for 558 participants. Rate of haemoptysis reported in 1 trial for 520 participants. Rate of tinnitus reported in 1 trial for 520 participants. Rate of voice alteration reported in 2 trials for 701 participants. | |
| *The basis for the assumed risk (e.g. the median control group risk across studies) is provided in footnotes. The corresponding risk (and its 95% CI) is based on the assumed risk in the comparison group and the relative effect of the intervention (and its 95% CI). | ||||||
| GRADE Working Group grades of evidence | ||||||
| 1. Downgraded twice due to most trials included in the comparison being at unclear or high risk of bias. Three trials were at high or unclear risk of bias across all domains. All of the 11 trials were at high or unclear risk of bias for randomisation or allocation concealment (or both) and also blinding of participants or outcome assessors (or both). | ||||||
| Colistimethate dry powder (Colobreathe®) compared with TIS for long‐term therapy in CF | ||||||
| Patient population: children and adults with CF and P aeruginosa infection Settings: outpatients Intervention: colistimethate dry powder for inhalation (one 1.6625 MU capsule twice daily for 24 weeks) Comparison: TIS (3 cycles of 28‐days of TIS (300 mg/5 mL) twice daily followed by a 28‐day off period) | ||||||
| Outcomes | Illustrative comparative risks* (95% CI) | Relative effect | No of participants | Quality of the evidence | Comments | |
| Assumed risk | Corresponding risk | |||||
| TIS | Colistimethate dry powder for inhalation (Colobreathe®) | |||||
| FEV1 (% predicted): mean change from baseline Follow‐up: 24 weeks | Adjusted mean difference between the groups (ITT population LOCF) for the change in FEV1 % predicted, MD ‐0.98% (95% CI‐2.74% to 0.86%). There was no significant difference between the 2 groups for this outcome. | NA | 374 | ⊕⊕⊝⊝ | The data were not normally distributed and were analysed using log‐transformation analysis. We have reported the results directly from the paper. | |
| FVC (% predicted): mean change from baseline Follow‐up: 24 weeks | There was no significant difference between groups for FVC % predicted in the ITT population (LOCF), MD 0.01 L (95% CI ‐0.09 to 0.10). | NA | 374 (1) | ⊕⊕⊝⊝ | The data were not normally distributed and were analysed using log‐transformation analysis. We have reported the results directly from the paper. | |
| Pulmonary exacerbations: number of pulmonary exacerbations Follow‐up: 24 weeks | 262 per 1000 | 312 per 1000 | RR 1.19 (0.86 to 1.64) | 374 | ⊕⊕⊕⊝ | |
| Quality of life: adjusted mean change in CFQ‐R score at the end of treatment Follow‐up: 24 weeks | The adjusted mean changes at the end of the trial favoured the Colobreathe® group in terms of treatment burden (P = 0.091). This difference was significant at Week 4 (P < 0.001). | NA | 374 | ⊕⊕⊝⊝ | The trial was not powered to detect differences in overall quality of life. Results reported directly from paper. | |
| Survival: number of deaths Follow‐up: over 3 months and up to 12 months | 10 per 1000 | 2 per 1000 | RR 0.21 (0.01 to 4.32) | 374 | ⊕⊕⊝⊝ | |
| Antibiotic resistance: change in mean MIC50 and MIC90 at the end of the trial Follow‐up: 24 weeks | The mean MIC50 (breakpoint of ≥ 8 mg/L) changed in the TIS group by 0.5 compared to 0.0 in the Colobreathe® group. The mean MIC90 (breakpoint of ≥ 8 mg/L) changed in the both groups by 4.0 | NA | 374 (1) | ⊕⊕⊝⊝ | ||
| Adverse events: number of treatment related adverse events. Follow‐up: 24 weeks | 466 per 1000 | 820 per 1000 | RR 1.76 (1.50 to 2.08) | 379 | ⊕⊕⊝⊝ | Treatment‐related adverse events were significantly lower in the TIS group than the Colobreathe® group P < 0.0001. |
| *The basis for the assumed risk (e.g. the median control group risk across studies) is provided in footnotes. The corresponding risk (and its 95% CI) is based on the assumed risk in the comparison group and the relative effect of the intervention (and its 95% CI). | ||||||
| GRADE Working Group grades of evidence | ||||||
| 1. Downgraded once due to an unclear or high risk of bias across four out of the seven domains, particularly randomisation, allocation concealment and participant blinding. | ||||||
| Inhaled TOBI® (IV preparation) compared with TIS for long‐term therapy in CF | ||||||
| Patient population: adults and children with CF and P aeruginosa Settings: outpatients Intervention: TIS intermittent (four‐weekly on‐off cycles) twice‐daily 300 mg/5 mL Comparison: inhaled tobramycin (TOBI®) (IV preparation) continuous twice‐daily 80 mg | ||||||
| Outcomes | Illustrative comparative risks* (95% CI) | Relative effect | No of participants | Quality of the evidence | Comments | |
| Assumed risk | Corresponding risk | |||||
| TIS intermittent | Inhaled tobramycin (IV preparation) continuous | |||||
| FEV1 (% predicted): change from baseline Follow‐up: the end of the first treatment phase (12 weeks) | The change from baseline in FEV1 % predicted was on average 1.07% less in the TIS group than in the inhaled tobramycin (IV preparation) group, values ranged from 11.20% less to 9.06% higher. | NA | 32 | ⊕⊝⊝⊝ | Trial investigators provided individual participant data for lung function and we have analysed the first‐period data ourselves using the generic inverse variance method in RevMan. | |
| FVC (% predicted): change from baseline Follow‐up: the end of the first treatment phase (12 weeks) | The change from baseline in FVC % predicted was on average 0.01% more in the TIS group than in the inhaled tobramycin (IV preparation) group, values ranged from 9.48% less to 9.50% higher. | NA | 32 | ⊕⊝⊝⊝ | Trial investigators provided individual participant data for lung function and we have analysed the first‐period data ourselves using the generic inverse variance method in RevMan. | |
| Pulmonary exacerbations Follow‐up: NA | Outcome not reported. | NA | ||||
| Quality of life Follow‐up: NA | Outcome not reported. | NA | ||||
| Survival Follow‐up: NA | Outcome not reported. | NA | ||||
| Antibiotic resistance Follow‐up: NA | Outcome not reported. | NA | ||||
| Adverse events Follow‐up: NA | Outcome not reported. | NA | ||||
| *The basis for the assumed risk (e.g. the median control group risk across studies) is provided in footnotes. The corresponding risk (and its 95% CI is based on the assumed risk in the comparison group and the relative effect of the intervention (and its 95% CI). | ||||||
| GRADE Working Group grades of evidence | ||||||
| 1. Downgraded twice due to risk of bias being unclear or high across all of the domains. The trial was at risk due to lack of blinding of participants or outcome measurement. This was because of the interventions being significantly different making it impossible to blind. Some outcomes (sputum bacteriology and oxygen saturation) were listed in the methods but not reported in the results. | ||||||
| TIP compared with TIS for long‐term therapy in CF | ||||||
| Patient population: children and adults with CF and P aeruginosa Settings: outpatients Intervention: TIP twice‐daily 4 capsules (total of 112 mg) (3 cycles (28 days on‐drug, 28 days off‐drug)) Comparison: TIS twice‐daily 300 mg/5 mL | ||||||
| Outcomes | Illustrative comparative risks* (95% CI) | Relative effect | No of participants | Quality of the evidence | Comments | |
| Assumed risk | Corresponding risk | |||||
| TIS | TIP | |||||
| FEV1 (% predicted): relative change from baseline Follow‐up: 24 weeks | The MD between the 2 groups was 1.10 (95% CI ‐2.33 to 4.53) favouring TIS, but not significantly. | NA | 517 | ⊕⊕⊕⊝ | TIP was found to be non‐inferior to TIS. | |
| FVC Follow‐up: NA | Outcome not reported. | NA | ||||
| Pulmonary exacerbations: number of participants experiencing pulmonary exacerbation Follow‐up: 24 weeks | 301 per 1000 | 337 per 1000 (259 to 436 per 1000) | RR 1.12 (0.86 to 1.45) | 517 | ⊕⊕⊕⊝ | |
| Survival: number of deaths Follow‐up: 24 weeks | Not calculable as there were no deaths in the TIS group. There were 3 deaths in the TIP group. | RR 4.76 (0.25 to 91.62) | 517 | ⊕⊕⊝⊝ | ||
| Antibiotic resistance: mean change from baseline in P aeruginosa sputum density Follow‐up: 24 weeks | Mucoid and non‐mucoid P aeruginosa sputum densities showed a decrease from baseline in both groups at all time points. Mean change was ‐1.6 versus ‐0.92 log10 CFU/g for mucoid phenotype and ‐1.77 versus ‐0.73 log10 CFU/g for non‐mucoid phenotype. | NA | 517 (1) | ⊕⊕⊕⊝ | ||
| Adverse events: number of any adverse event reported Follow‐up: 24 weeks | 842 per 1000 | 901 per 1000 | RR 1.07 (1.00 to 1.15) | 517 | ⊕⊕⊕⊝ | A range of adverse events were reported but the only adverse events which were significantly different between the two groups were favouring TIS
|
| *The basis for the assumed risk (e.g. the median control group risk across studies) is provided in footnotes. The corresponding risk (and its 95% CI) is based on the assumed risk in the comparison group and the relative effect of the intervention (and its 95% CI). | ||||||
| GRADE Working Group grades of evidence | ||||||
| 1. Downgraded once due to risk of bias within the trial. This was an open‐label trial and so was at high risk of bias for blinding and had an unclear risk for randomisation and allocation concealment. | ||||||
| TIS compared with AZLI for long‐term therapy in CF | ||||||
| Patient population: children and adults with CF and P aeruginosa Settings: outpatients Intervention: AZLI 75 mg 3 times daily Comparison: TIS 300 mg twice‐daily | ||||||
| Outcomes | Illustrative comparative risks* (95% CI) | Relative effect | No of participants | Quality of the evidence | Comments | |
| Assumed risk | Corresponding risk | |||||
| TIS | AZLI | |||||
| FEV1 (% predicted): mean relative change from baseline averaged across 3 cycles Follow‐up: 24 weeks | The MD between groups was ‐3.40 (95% CI ‐6.63 to ‐0.17), favouring AZLI. | NA | 268 | ⊕⊕⊕⊝ | ||
| Pulmonary exacerbations: need for additional antibiotics. Follow‐up: 24 weeks | 576 per 1000 | 380 per 1000 | RR 0.66 (0.51 to 0.86) | 268 | ⊕⊕⊕⊝ | |
| Quality of life: mean change from baseline in CFQ‐R respiratory symptom scale averaged across 3 cycles. Follow‐up: 24 weeks | The mean (SD) change in CFQ‐R score was 2.2 (17.7) in the TIS group. | The mean change in CFQ‐R score in the AZLI group was | NA | 268 | ⊕⊕⊕⊝ | |
| Survival Follow‐up: 24 weeks | See comments. | 268 | ⊕⊕⊝⊝ | 2 participants died during the trial, but neither were related to treatment and the treatment group was not specified. | ||
| Antibiotic resistance: change from baseline in P aeruginosa CFU/g of sputum at week 24 Follow‐up: 24 weeks | The mean (SD) change in log10 CFU/g was ‐0.32 (1.87) in the TIS group. | The mean change in log10 CFU/g in the AZLI group was 0.23 lower (0.76 lower to 0.3 log10 CFU/g higher). | NA | 268 | ⊕⊕⊕⊝ | |
| Adverse events: number of treatment‐related adverse events Follow‐up: 24 weeks | 129 per 1000 | 228 per 1000 | RR 1.77 (1.03 to 3.04) | 268 | ⊕⊕⊕⊝ | Whilst treatment‐related events were significantly more likely in the AZLI treated group P < 0.04), the difference in serious adverse events (also more likely in the AZLI group) did not quite reach significance. No significant difference was reported for any other reported adverse event. |
| *The basis for the assumed risk (e.g. the median control group risk across studies) is provided in footnotes. The corresponding risk (and its 95% CI) is based on the assumed risk in the comparison group and the relative effect of the intervention (and its 95% CI). | ||||||
| GRADE Working Group grades of evidence | ||||||
| 1. Downgraded once due to risk of bias within the trial. The trial was open‐label with the treatments given at a different frequency and so obvious to participants. There was also an unclear risk attributed to blinding of outcome assessment. | ||||||
| LAI compared with TIS for long‐term therapy in CF | ||||||
| Patient or population: children and adults with CF and P aeruginosa Settings: outpatients Intervention: LAI 560 mg once daily with eFlow® nebuliser Comparison: TIS 300 mg twice daily via PARI LC® PLUS nebuliser | ||||||
| Outcomes | Illustrative comparative risks* (95% CI) | Relative effect | No of participants | Quality of the evidence | Comments | |
| Assumed risk | Corresponding risk | |||||
| TIS | LAI | |||||
| FEV1 : LS relative mean change from baseline (%) Follow‐up: 168 days | The LS MD in FEV1 (LAI ‐ TIS) was ‐1.31 % (95 % CI ‐4.95 to 2.34) favouring TIS but not significantly (P = 0.48). | NA | 262 | ⊕⊕⊝⊝ | Results taken from abstract (Bilton 2014). The lower CI was above ‐5 % indicating non‐inferiority of LAI to TIS. | |
| Quality of Life CFQ‐R respiratory symptom scores (mean (SE)) Follow‐up: 140 days | Mean increase from baseline at day 140 (end of trial) was 4.94 for LAI (which is greater than the 4 points which show a minimally important difference) but only 2.13 for TIS. | NA | 302 | ⊕⊕⊝⊝ | Minimally important differences (≥ 4 points) on the CFQ‐R Respiratory symptoms scale were seen after each treatment cycle with LAI but only after the first cycle of TIS. | |
| Antibiotic resistance: change from baseline in P aeruginosa CFU/g of sputum Follow‐up: 168 days | Mean reductions in P aeruginosa sputum density were similar during on‐treatment periods and off‐treatment periods with no significant difference between LAI and TIS (P = 0.038). | NA | 259 | ⊕⊕⊝⊝ | Taken directly from abstract. | |
| Adverse events: number of treatment‐related adverse events | 84% of participants in the LAI group experienced at least 1 treatment‐related adverse event, whilst 78.8 % of the TIS group experienced at least 1 treatment‐related adverse event. Serious adverse events were experienced by 17.6 % of LAI participants and 19.9 % of TIS participants. | NA | 294 | ⊕⊕⊝⊝ | Narrative taken directly from abstract (Bilton 2014). | |
| *The basis for the assumed risk (e.g. the median control group risk across studies) is provided in footnotes. The corresponding risk (and its 95% CI) is based on the assumed risk in the comparison group and the relative effect of the intervention (and its 95% CI). | ||||||
| GRADE Working Group grades of evidence | ||||||
| 1. Downgraded once due to risk of bias within the trial being unclear or high across all domains, largely due to the trial being published only in abstract form. 2. Downgraded once due to publication bias as we only have an abstract with limited information about the trial and the results. | ||||||
| LIS compared with TIS for long‐term therapy in CF | ||||||
| Patient population: adults and children aged over 12 with CF and P aeruginosa Settings: outpatients Intervention: LIS (Aeroquin™, MP376, APT‐1026) 240 mg (2.4 mL of 100 mg per mL solution) twice daily Comparison: TIS 300 mg/5 mL twice daily | ||||||
| Outcomes | Illustrative comparative risks* (95% CI) | Relative effect | No of participants | Quality of the evidence | Comments | |
| Assumed risk | Corresponding risk | |||||
| TIS | LIS | |||||
| FEV1 (% predicted): relative mean change from baseline Follow‐up: six months | The mean (SD) change in % predicted FEV1 was ‐1.5 (14.8) in the TIS group. | The mean change in % predicted FEV1 in the LIS group was 0.30 higher (3.02 lower to 3.62 higher). | NA | 282 | ⊕⊕⊕⊕ | |
| FVC (% predicted): relative mean change from baseline Follow‐up: six months | The mean (SD) change in FVC % predicted was ‐1.3 (12.8) in the TIS group. | The mean change in FVC % predicted in the LIS group was 0.60 higher (2.23 lower to 3.43 higher). | NA | 282 | ⊕⊕⊕⊕ | |
| Pulmonary exacerbations: number of hospitalisations due to respiratory exacerbations Follow‐up: six months | 280 per 1000 | 173 per 1000 | RR 0.62 (0.40 to 0.98) | 282 | ⊕⊕⊕⊕ | |
| Quality of life: change from baseline in CFQ‐R | The trial reported that scores in the respiratory domain of the CFQ‐R were similar in the 2 groups at baseline, increased in the LIS group and decreased in the TIS group at day 28 and were similar again by the end of the trial. | NA | 282 | ⊕⊕⊝⊝ | No data could be entered into analysis. | |
| Survival Follow‐up: NA | Outcome not reported. | NA | ||||
| Antibiotic resistance: mean change in P aeruginosa sputum density (log10 CFU/g) Follow‐up: six months | The mean (SD) sputum density in the TIS group was ‐0.25 (1.76) log10 CFU/g. | The mean sputum density in the LIS group was 0.12 higher (0.31 log10 CFU/g lower to 0.55 log10 CFU/g higher). | NA | 282 | ⊕⊕⊕⊕ | |
| Adverse events: number of treatment‐related adverse events | Significantly fewer participants in the LIS group reported epistaxis, RR 0.2 (95% CI 0.04 to 1.00), general malaise, RR 0.1 (95% CI 0.01 to 0.83) and increased blood glucose, RR 0.28 (95% CI 0.08 to 0.94). Significantly more participants in the LIS group reported dysgeusia, RR 46.25 (95% CI 2.88 to 742). No other differences were noted. | NA | 282 | ⊕⊕⊕⊕ | ||
| *The basis for the assumed risk (e.g. the median control group risk across studies) is provided in footnotes. The corresponding risk (and its 95% CI) is based on the assumed risk in the comparison group and the relative effect of the intervention (and its 95% CI). | ||||||
| GRADE Working Group grades of evidence | ||||||
| 1. Downgraded once due to indirectness. Quality of life was measured by the CFQ‐R score but no data was provided, just a summary. It is unclear which participants were included in this outcome. 2. Downgraded once due to publication bias as the results were not presented in full for this outcome. | ||||||
| Continuous AZLI/TIS compared with continuous placebo/TIS (i.e. intermittent TIS) for long‐term therapy in CF | ||||||
| Patient population: children and adults with CF and P aeruginosa Settings: outpatients Intervention: continuous alternating cycles of AZLI (75 mg (diluted in 0.17% NaCL) 3 times‐daily) and TIS (300 mg/5 mL twice‐daily) Comparison: alternating cycles of placebo (lactose monohydrate and sodium chloride reconstituted with the same diluent used for AZLI 3 times daily) and TIS (300 mg/5 mL twice‐daily) | ||||||
| Outcomes | Illustrative comparative risks* (95% CI) | Relative effect | No of participants | Quality of the evidence | Comments | |
| Assumed risk | Corresponding risk | |||||
| TIS/placebo | AZLI/TIS | |||||
| FEV1 (% predicted): mean change from baseline (average values across the end of the three treatment cycles) Follow‐up: six months (24 weeks) | The change from baseline in FEV1 % predicted was on average 1.33% more in the AZLI/TIS group than in the in the TIS/placebo group, values ranged from 0.51% lower to 3.17% higher. | NA | 90 | ⊕⊕⊝⊝ | ||
| FVC Follow‐up: NA | Outcome not reported. | NA | ||||
| Pulmonary exacerbations: rate of PDEs per participant year Follow‐up: 24 weeks | 489 per 1000 | 347 per 1000 | RR 0.71 (0.43 to 1.18) | 90 | ⊕⊕⊝⊝ | The rate of PDEs was lower in the AZLI/TIS group (1.31 PDEs per participant year) than in the placebo/TIS group (1.76 PDEs per participant year). The difference between the groups was not reported to be significant (P = 0.25, RR 0.74 (95% CI 0.45 to 1.24)). |
| Quality of life: CFQ‐R respiratory symptom scores averaged from weeks 4, 12 and 20 Follow‐up: 24 weeks | Scores improved by a mean (SE) 1.00 (1.74) in the AZLI/tobramycin group, they worsened by a mean (SE) ‐2.06 (1.63) in the placebo/TIS group. The difference between the groups was not found to be significant, MD 3.06 (95% CI ‐1.61 to 7.73). | 90 | ⊕⊕⊝⊝ | |||
| Survival Follow‐up NA | Outcome not reported. | NA | ||||
| Antibiotic resistance: mean change from baseline in P aeruginosa sputum density (CFU/g) Follow‐up: 24 weeks | Adjusted mean changes from baseline sputum P aeruginosa density after each course of AZLI/placebo or TIS during the comparative phase were small (0.36 to ‐0.55 log10 CFU/g) and differences between treatment groups were not statistically significant. | ⊕⊕⊝⊝ | ||||
| Adverse events: any adverse event in the comparative phase Follow‐up: 24 weeks | 978 per 1000 | 949 per 1000 | RR 0.97 (0.90 to 1.05) | 88 | ⊕⊕⊝⊝ | A range of adverse events were reported but the only adverse events which were significantly different between the 2 groups were: favouring continuous treatment
favouring intermittent treatment
|
| *The basis for the assumed risk (e.g. the median control group risk across studies) is provided in footnotes. The corresponding risk (and its 95% CI) is based on the assumed risk in the comparison group and the relative effect of the intervention (and its 95% CI). AZLI: inhaled aztreonam lysine; CFQ‐R: cystic fibrosis questionnaire ‐ revised; CFU: colony forming units; CI: confidence interval; FEV1: forced expiratory volume at 1 second; FVC: forced vital capacity; MD: mean difference; PDE: protocol‐defined exacerbation; P aeruginosa : Pseudomonas aeruginosa;RR: risk ratio; SE: standard error; TIS: tobramycin for inhalation solution. | ||||||
| GRADE Working Group grades of evidence | ||||||
| 1. Downgraded once due to risk of bias being unclear across five of the domains around randomisation, allocation concealment, blinding of participants and incomplete outcome data. | ||||||
Background
Description of the condition
Cystic fibrosis (CF) is a life‐limiting inherited disease caused by mutations in the cystic fibrosis transmembrane conductance regulator (CFTR) gene which results in abnormal ion transfer at the apical surface of epithelial cells (Rosenstein 1998). This leads to production of thick sticky mucus affecting many systems around the body. One major impact of this genetic abnormality is lung disease, which is characterised by abnormal airway secretions, persistent bacterial infection and inflammation.
CF affects around 10,400 people in the UK and around 100,000 people worldwide (CF Trust 2017). Whilst it was once viewed as a disease of childhood, the median life expectancy has been improving with children born in the year 2000 having a median life expectancy greater than 50 years (Dodge 2007). More than half of the CF population is now aged 18 or over (CF Foundation 2017).
The pattern of bacterial infection changes with age. As people with CF approach adulthood, acquisition of Pseudomonas aeruginosa (P aeruginosa) becomes more common with almost 50% of UK adults with CF being chronically infected (CF Trust 2016). This is associated with an accelerated decline in lung function, increased frequency of exacerbations, increased burden of treatment, and ultimately hastened mortality (Emerson 2002; Zemanick 2015). This review will focus on inhaled anti‐pseudomonal antibiotic therapy.
Description of the intervention
Delivering anti‐pseudomonal antibiotics by the inhalation of an aerosol is used to achieve high concentrations of the antibiotic in airways so as to control infection without the disadvantages of oral or parenteral administration (Touw 1995). The clinical settings in which inhaled anti‐pseudomonal antibiotics have been used are:
-
eradication of infection in the early stages of infection;
-
prophylaxis;
-
treatment of acute exacerbations of lung infection; and
-
for longer‐term suppression of chronic infection.
The fourth of these indications is the subject of this review. There is a recommendation to use inhaled tobramycin for treating individuals with CF who are six years of age and older, who have moderate to severe lung disease and with persistent P aeruginosa infection (Flume 2007; Mogayzel 2013). Information from the CF Trust registry in 2016 showed that at least one of the following inhaled antibiotics were used in people with chronic P aeruginosa infection:
-
tobramycin solution (20.9 %);
-
other aminoglycoside (2.6 %);
-
colistin (25.3 %);
-
promixin (29.8 %);
-
aztreonam (18.8 %);
-
colistimethate (DPI) (16.7 %);
-
tobramycin inhalation powder (TIP) (27.8 %);
-
at least one of the above (87.6 %).
The current consensus view is that 90% of people chronically infected with P aeruginosa in the UK should be treated with at least one of the above inhaled antibiotics (CF Trust 2016). Inhaled anti‐pseudomonal antibiotics were typically given in 28 day cycles of one month on and one month off (CF Trust 2009). Current practice in the UK is to give continuous nebulised colistin as first‐line treatment although the antibiotic regimen may be changed to treat exacerbations (NICE 2017). In the USA, chronic suppression of P aeruginosa is with continuous inhaled tobramycin. Colistin is not recommended in USA guidelines for chronic suppression of P aeruginosa (Yankaskas 2004).
How the intervention might work
The aim of treatment is to reduce the bacterial load in the lung, which in turn should reduce inflammation in the lung, thereby reducing lung damage and so reduce the rate of deterioration of lung function and frequency of exacerbations of infection. These outcomes should be associated with improvement in quality of life (QoL) and in survival. Additional issues of relevance around the use of inhaled anti‐pseudomonal antibiotics in CF include financial cost, increased time of treatment, risks of adverse effects of the drugs and an increase in the likelihood of acquisition of infection with drug‐resistant organisms by long‐term exposure to antibiotics.
Why it is important to do this review
This review aims to identify the most effective inhaled anti‐pseudomonal antibiotic treatment regimens for long‐term maintenance therapy in people with CF.
We know that antibiotic treatment can clear P aeruginosa from respiratory secretions in children with CF, and that treating early P aeruginosa with nebulised antibiotics (or a combination of inhaled and oral antibiotics) is better than not treating (Langton Hewer 2017). There is also evidence from earlier versions of this review that inhaled antibiotic treatment of chronic infection is of some benefit in terms of improvement in lung function and reduction in exacerbations (Ryan 2011). However, we do not know what the best treatment is for suppressing chronic P aeruginosa infection (Ryan 2011). We consider it to be important to extend the minimum duration for included trials from one month and over, to three months and over at this update in order to study the longer‐term effects of treatment.
This is an updated version of the 2011 Cochrane Review previously titled 'Inhaled antibiotics for long‐term therapy cystic fibrosis' which was first published with the original title 'Nebulised anti‐pseudomonal antibiotics for cystic fibrosis' in 1999 (Ryan 1999; Ryan 2003; Ryan 2011).
Objectives
To evaluate the effects long‐term inhaled antibiotic therapy in people with CF on clinical outcomes (lung function, frequency of exacerbations and nutrition), QoL and adverse events (including drug sensitivity reactions and survival).
Methods
Criteria for considering studies for this review
Types of studies
Randomised (RCTs) or quasi‐RCTs. We included parallel designed trials and cross‐over trials where appropriate.
Please see the Cochrane glossary of terms (www.community.cochrane.org/glossary) for the explanation of these terms.
Types of participants
People with CF diagnosed by clinical features associated with an abnormal sweat electrolyte test or mutations of the CFTR gene or both. All ages and all levels of severity of respiratory disease were included.
Types of interventions
Any inhaled antibiotic (all doses and methods of inhalation) with activity against P aeruginosa given for at least three months* compared to an inhaled placebo or no placebo, i.e. usual treatment (where this did not include any oral or intravenous antibiotic therapy during the trial), or another inhaled anti‐pseudomonal antibiotic. Trials in which an antibiotic was tested at two or more doses are also eligible.
* In a post hoc change the duration of the intervention was extended from that stated in the original review where the duration of intervention considered was one month or over.
Types of outcome measures
Primary outcomes
-
Lung function (measured in litres or per cent (%) predicted)
-
forced expiratory volume in one second (FEV1)
-
forced vital capacity (FVC)
-
-
Exacerbation of respiratory infection (defined as any deterioration in clinical condition resulting in treatment with oral or intravenous antibiotics, either at home or in hospital)
-
hospital admissions
-
days in hospital
-
courses of intravenous antibiotics
-
pulmonary exacerbations
-
frequency
-
time to first exacerbation
-
-
Secondary outcomes
-
Nutrition
-
height
-
weight
-
-
QoL
-
Survival
-
Antibiotic resistance in P aeruginosa or other organisms
-
Adverse events
-
renal impairment ‐ serum creatinine increase
-
auditory impairment ‐ impaired audiometry
-
sensitivity reactions ‐ bronchospasm
-
other (post hoc change)
-
Search methods for identification of studies
Trial searches were not restricted by date, language, or publication status.
Electronic searches
Relevant trials were identified from the Group's Cystic Fibrosis Trials Register using the terms: antibiotics AND (maintenance OR unknown) AND (inhaled or not stated), ALSO: macrolide AND inhaled.
The Cystic Fibrosis Trials Register is compiled from electronic searches of the Cochrane Central Register of Controlled Trials (CENTRAL) (updated each new issue of the Cochrane Library), weekly searches of MEDLINE, a search of Embase to 1995 and the prospective handsearching of two journals ‐ Pediatric Pulmonology and the Journal of Cystic Fibrosis. Unpublished work is identified by searching through the abstract books of three major cystic fibrosis conferences: the International Cystic Fibrosis Conference; the European Cystic Fibrosis Conference and the North American Cystic Fibrosis Conference. For full details of all searching activities for the register, please see the relevant sections of the Cystic Fibrosis and Genetic Disorders Group website.
Date of the most recent search of the Group's Cystic Fibrosis Trials Register: 13 February 2018.
Additional search strategies for online databases are detailed in the appendices (Appendix 1); date last searched was 26 February 2018.
Searching other resources
We have previously contacted manufacturers of inhaled antibiotics; however, due to the poor response from them, we have decided not to pursue this approach for this update (2018).
Data collection and analysis
Selection of studies
Two authors (for earlier versions of the review GR and MS, for later versions of the review two of the three authors SS, NR and KR) independently reviewed the full text of articles or abstracts identified from the search to select trials which fulfilled the inclusion criteria. They recorded reasons for excluding trials. The authors settled any disagreement on article selection by consensus. Full text articles from the previous version of the review were not re‐scored for this update.
Data extraction and management
The authors prepared a form to record details of trial design, participant numbers and characteristics, interventions, and outcomes. Two authors (for earlier versions of the review GR and MS, for later versions of the review SS, NR and KR) independently recorded the quality characteristics of each included trial and extracted the relevant outcome data. The authors settled any disagreement by consensus. At the 2018 update, the new author team did not repeat this process for previously assessed and recorded trials.
The authors reported outcome measures at three months, over three and up to 12 months and annually thereafter to accommodate trials of different lengths. Where trials reported multiple time‐points for one category, the authors only used only the longest time‐point data.
Assessment of risk of bias in included studies
The authors (initially GR and MS, 2010 update GR and KD, 2017 update SS and NR) assessed the risk of bias for each included trial using the criteria specified in the Cochrane Handbook for Systematic Reviews of Interventions (Higgins 2011). This involves a judgement of how the investigators generated the allocation sequence and how well they concealed the allocation schedule, how they blinded participants and investigators, whether they included all randomised participants in the analysis and reported all outcomes measured, and if they avoided other factors with a potential for biased results. The authors recorded judgements as having a low, unclear or high risk of bias (which related to the original judgements of adequate, unclear or inadequate respectively). At the 2018 update, the new author team did not re‐assess the judgements for previously assessed trials.
Two authors (as above) planned to assess outcome reporting bias by either comparing outcomes stated in the trial protocols to their full publications when available, or by obtaining data from a clinical trial registry, or by comparing the methods section to the results section in a publication with our knowledge of the clinical area. If they had suspected outcome reporting bias, they planned to contact the trial investigators to find out if they had measured and analysed the outcome in question and to obtain the data. The review authors also planned to contact experts in the field to attempt to identify any unpublished trials.
Measures of treatment effect
For dichotomous outcome data (exacerbation of respiratory infection, survival, antibiotic resistance in P aeruginosa or other organisms, adverse events), the authors calculated a pooled estimate of the treatment effect for each outcome across trials using risk ratio (RR) and 95% confidence intervals (95% CIs) where appropriate.
For continuous outcome data (lung function, nutrition, QoL), they recorded either mean relative change from baseline for each group or mean post‐treatment or post‐intervention values and standard deviations (SDs). If standard errors (SEs) were reported (and if possible) they converted these to SDs. The authors calculated a pooled estimate of treatment effect by calculating the mean difference (MD) and 95% CIs where appropriate.
Unit of analysis issues
The protocol for this review did not exclude trials using a cross‐over design although they are not the ideal trial design because of the progressive nature and deterioration of CF lung function. There are methods for meta‐analysis of results from cross‐over trials (Elbourne 2002), which rely on the data that are reported within the primary paper. In this review the authors have only used data from the first treatment period, ignoring the second period, i.e. regarding as a parallel trial. If results of the first period were not available, the authors describe the results of the trial in the text. The trial was only included if the first period was at least three months in duration.
Dealing with missing data
If the authors needed additional information on the trials considered for this review, they planned to contact the original investigators. They did request additional information from the authors of the Wiesemann trial, but have not yet received a reply (Wiesemann 1998). They have also contacted the lead investigators of three trials on two occasions (Chuchalin 2007; McCoy 2008; Nikolaizik 2008), and have received data from one trial (Nikolaizik 2008).
Assessment of heterogeneity
The authors planned to assess the degree of heterogeneity between trials using the I² statistic which describes the percentage of total variation across trials which is due to heterogeneity rather than by chance (Higgins 2003). The values of I² lie between 0% and 100%, and a simplified categorization of heterogeneity that the authors planned to use is (Higgins 2011):
-
0% to 40%: might not be important;
-
30% to 60%: may represent moderate heterogeneity;
-
50% to 90%: may represent substantial heterogeneity;
-
75% to 100%: considerable heterogeneity.
Assessment of reporting biases
The authors planned to assess publication bias by constructing a funnel plot if 10 or more trials had been available. If the funnel plot is not symmetrical, publication bias may be present. However, there are other reasons for funnel plot asymmetry (i.e. heterogeneity), so the plot should be interpreted with caution. To minimise publication bias, the authors searched trial registries and contacted experts in the field for any unpublished trials.
The authors checked outcomes reported against the protocol for the trial (if this was available) or against the methods section of the paper if not.
The authors aimed to check the different methods of reporting certain outcome measures (i.e. FEV1) to ensure they have not been selectively reported.
Data synthesis
The authors mainly analysed the data using a fixed‐effect model, but where they identified a moderate to high degree of heterogeneity (see above), they used a random‐effects model to analyse the data.
Subgroup analysis and investigation of heterogeneity
We considered the major potential sources of heterogeneity to be the intervention (drugs, dose, regimens, method of aerosol generation and inhalation) and severity of disease (baseline FEV1, clinical stability). The authors investigated these with informal subgroup analyses when they were able to combine data from at least two trials and where there was at least substantial heterogeneity (I² greater than 50 %) in the results (two instances). We considered the reasons for heterogeneity and described why it may have occurred in the text. If we are able to include and combine more trials in future updates, we will carry out the following formal sub‐group analyses:
-
different drugs or doses;
-
different drug regimens;
-
drug delivery method;
-
severity of disease.
Sensitivity analysis
Where we carried out meta‐analyses, we planned to perform sensitivity analyses based on the risk of bias in the trials to look at the effect of removing trials at high risk of bias; however, there were not a sufficient number of trials included and combined in the meta‐analyses to be able to do this. We also planned to look at the effect of removing quasi‐randomised trials. In a post hoc change we also planned a sensitivity analysis with and without cross‐over trials where this was possible. Again, there were not sufficient trials included in the meta‐analyses for us to be able to do this.
Summary of findings tables
In a post hoc change, and in accordance with current Cochrane guidance, we have included a summary of findings table for each comparison in the review at the 2017 update. The three main comparisons are as follows (the exception to this is where a particular antibiotic or combination of antibiotics is no longer included in current guidelines):
-
inhaled anti‐pseudomonal antibiotics versus placebo or usual treatment;
-
inhaled anti‐pseudomonal antibiotics compared to another inhaled anti‐pseudomonal antibiotic, including different dose or regimen (where different antibiotics are used, a separate summary of findings table has been created for each comparison, e.g. tobramycin versus aztreonam, tobramycin versus levofloxacin);
-
continuous versus intermittent cycles of inhaled antibiotics.
We have selected the following seven outcomes, which we consider to be the most important, to include in the tables, but have also graded our other outcomes and described the quality judgements in the text alone.
-
FEV1
-
FVC
-
Pulmonary exacerbations
-
QoL
-
Survival
-
Antibiotic resistance
-
Adverse events
We used the GRADE approach to assess the quality of the evidence for each outcome based on the risk of bias within the trials, relevance to our population of interest (indirectness), unexplained heterogeneity or inconsistency, imprecision of the results or high risk of publication bias. We downgraded the evidence once if the risk was serious and twice if the risk was deemed to be very serious.
Results
Description of studies
Please see the tables for the characteristics of the trials (Characteristics of included studies; Characteristics of excluded studies; Characteristics of studies awaiting classification).
Results of the search
The searches retrieved 333 citations to 98 trials (no new trials were identified from the ongoing trials databases). In total, 18 trials (95 citations) with 3042 participants were included in the review and 76 trials (230 citations) were excluded. Four trials are listed under 'Studies awaiting classification' until more information becomes available (Flume 2015; Herrmann 2017; Nikonova 2010; Ramsey 2017). No trials are currently listed as ongoing. Results of the search are shown in a PRISMA diagram (Figure 1).

Study flow diagram.
Included studies
1. Inhaled anti‐pseudomonal antibiotic compared to placebo or usual treatment
An inhaled anti‐pseudomonal antibiotic was compared to placebo or usual treatment in 11 of the 18 included trials (n = 1130 participants) (Chuchalin 2007; Day 1988; Hodson 1981; Jensen 1987; Kun 1984; MacLusky 1989; Murphy 2004; Nathanson 1985; Ramsey 1999; Stead 1987; Wiesemann 1998). Two trials were published only as abstracts in conference proceedings (Day 1988; Nathanson 1985). There was large variation between trials in terms of design, intervention and outcome measures. One trial compared to both placebo and another inhaled antibiotic and is therefore included in two comparisons in this review (Stead 1987).
Searches of the Group's CF Trials Register identified 32 citations that report data from a single trial which was first fully published in 1999 (Ramsey 1999). This trial is widely known as the 'TOBI' trial from the trade name of the preservative‐free formulation of tobramycin used in the trial (Ramsey 1999). Another report of this trial is published in full and provides information on the effect of tobramycin treatment on the isolation of drug‐resistant organisms (Burns 1999). A third report of this trial is on the effect of tobramycin on hospitalisation and home intravenous antibiotic use; it is only an abstract and results are not able to be analysed (Birnbaum 1998).
a. Trial design
Seven out of 11 trials were described as double‐blinded (Chuchalin 2007; Day 1988; Hodson 1981; Jensen 1987; Nathanson 1985; Ramsey 1999; Wiesemann 1998), three trials were described as single‐blinded (Kun 1984; MacLusky 1989; Stead 1987). One trial was not blinded (Murphy 2004).
A cross‐over design was used in five trials with 92 participants (8% of the total participants for this comparison) (Day 1988; Hodson 1981; Kun 1984; Nathanson 1985; Stead 1987). In one of these trials, the first period could be analysed as a parallel design trial for the first year (Kun 1984). None of the five cross‐over trials examined for carry‐over or period effects. The remaining six trials were of parallel design (Chuchalin 2007; Jensen 1987; MacLusky 1989; Murphy 2004; Ramsey 1999; Wiesemann 1998).
Duration of treatment ranged from a minimum of three months (Jensen 1987; Nathanson 1985) to the longest which had a mean treatment duration of 33 months (MacLusky 1989). Treatment lasted three months in two trials (Jensen 1987; Nathanson 1985), four months in one trial (Stead 1987), six months in four trials (Chuchalin 2007; Day 1988; Hodson 1981; Ramsey 1999), 12 months in two trials (Kun 1984; Wiesemann 1998), 56 weeks in one trial (Murphy 2004) and there was a mean treatment duration of 33 months in one trial (MacLusky 1989).
Four of the trials were multicentre, these were carried out in: Hungary, Poland and Russia (Chuchalin 2007); USA and Canada (Murphy 2004); USA (Ramsey 1999); and Germany (Wiesemann 1998). Two were single‐centre trials carried out in Australia (Kun 1984) and Canada (MacLusky 1989). The remaining five trials did not state whether they were single centre or multicentre or in which country they were carried out (Day 1988; Hodson 1981; Jensen 1987; Nathanson 1985; Stead 1987).
The sample size for each trial varied from seven randomised participants (Nathanson 1985) to 520 randomised participants (Ramsey 1999), with a total of 1130 participants enrolled across all included trials.
b. Participants
Participants were both children and adults, with the youngest being five years of age (Day 1988) and the eldest being 45 years old (Chuchalin 2007), although an accurate age distribution is difficult to determine from the reports and is not available for the largest trial (Ramsey 1999). The gender split within the trials was equally distributed in seven of the trials where 50 to 55% of the participants were male (Chuchalin 2007; Day 1988; Hodson 1981; Jensen 1987; MacLusky 1989; Murphy 2004; Ramsey 1999). Two of the trials were weighted towards males with 67% male participants in the Stead trial (Stead 1987) and 60% male participants in the Wiesemann trial (Wiesemann 1998). The gender split of participants was not stated in either the Kun trial or the Nathanson trial (Kun 1984; Nathanson 1985).
Six out of 11 trials stated criteria for the diagnosis of CF (Chuchalin 2007; Hodson 1981; MacLusky 1989; Murphy 2004; Ramsey 1999; Stead 1987); however since participants were recruited from CF centres we accepted all 11 trials. It is unlikely that an important number of participants without CF were included.
There is also a wide range of disease severity as measured by baseline FEV1, with some participants having an FEV1 lower than 30% predicted and some over 100% predicted. However, it is not possible to know the numbers in categories of 'no', 'mild', 'moderate' or 'severe' impairment of lung function. Evidence of P aeruginosa in sputum culture was an inclusion requirement in all trials except one, in which P aeruginosa was present in 8 out of 33 participants (Kun 1984).
The pattern of respiratory disease in CF tends to be of progressive deterioration over years and with episodes of acute deterioration and some recovery. Due to these short‐term fluctuations in severity, the timing of entry of participants into a trial in relation to exacerbations may determine outcome. In two trials, participants were recruited immediately after a course of anti‐pseudomonal intravenous antibiotics (Day 1988; Jensen 1987). Three trials stated that participants were recruited at least two weeks after a course of intravenous antibiotics in an attempt to ensure a stable state (Hodson 1981; Ramsey 1999; Stead 1987). One trial excluded participants if they had had an exacerbation in the previous month (Chuchalin 2007). This aspect of participant selection was not stated in the remaining five trials (Kun 1984; MacLusky 1989; Murphy 2004; Stead 1987; Wiesemann 1998).
c. Interventions
A unique feature of two trials was the intermittent use of nebulised tobramycin, i.e. cycles of tobramycin 300 mg twice daily for four weeks, followed by four weeks off treatment for a trial duration of six months (Ramsey 1999) and 56 weeks (Murphy 2004).
The dose of drug delivered to the lung depends on a number of factors including the method of aerosol generation and delivery, the volume of solution in the nebuliser and the method of inhalation (Newman 1985). Four trials reported details of the nebuliser and pump system (Chuchalin 2007; Kun 1984; Murphy 2004; Ramsey 1999). Another four trials stated which nebuliser the participants used (Jensen 1987; MacLusky 1989; Stead 1987; Wiesemann 1998). The volume of solution used was stated in five of the eight trials which reported using jet nebulisers and varied from 1 mL to 5 mL (Jensen 1987; MacLusky 1989; Ramsey 1999; Stead 1987; Wiesemann 1998). Three trials did not provide any details of aerosol delivery (Day 1988; Hodson 1981; Nathanson 1985).
In three of the seven double‐blinded trials, the placebo was normal saline and it is possible that in these trials the taste of the antibiotic solution was not completely masked (Day 1988; Jensen 1987; Nathanson 1985). In the remaining four double‐blinded trials, varying saline concentrations and the addition of other chemicals (lactose or quinine or preservatives) were used to match drug and placebo solutions (Chuchalin 2007; Hodson 1981; Ramsey 1999; Wiesemann 1998). Of the four trials which did not use a double‐blind design, Kun and Murphy used usual treatment as control (Kun 1984; Murphy 2004), MacLusky used normal saline (MacLusky 1989) and Stead used 3.5% sodium chloride solution (hypertonic saline) as a placebo (Stead 1987), but since then hypertonic saline has been shown to have a therapeutic effect in CF (Wark 2009).
The following individual antibiotics were used in the trials.
i. Colistin
Two trials with 54 participants compared colistin to placebo, using a dose of one million units twice daily for three months (Jensen 1987) and for six months (Day 1988).
ii. Tobramycin
Five trials with 998 participants compared tobramycin to placebo or usual treatment for between six and 33 months (Chuchalin 2007; MacLusky 1989; Murphy 2004; Ramsey 1999; Wiesemann 1998); 52% of participants were in one high‐quality trial (Ramsey 1999). Tobramycin was used in varying doses; two trials used 80 mg (MacLusky 1989; Wiesemann 1998) and three trials used 300 mg (Chuchalin 2007; Murphy 2004; Ramsey 1999). The frequency of dosing also varied with four trials using twice‐daily nebulisation (Chuchalin 2007; Murphy 2004; Ramsey 1999; Wiesemann 1998) and one trial using three‐times daily nebulisation (MacLusky 1989).
iii. Gentamicin
Two cross‐over trials (n = 40) compared gentamicin as a single agent; one trial used 20 mg twice daily for 12 months (Kun 1984) and the second used 80 mg three times daily for three months (Nathanson 1985).
iv. Ceftazidime
Only one trial with 18 participants used ceftazidime in the third arm of a three‐way cross‐over trial without a washout period; the dose was 1.0 g twice daily (Stead 1987).
v. Gentamicin and carbenicillin
Two cross‐over trials with 38 participants tested a combination of gentamicin 80 mg with carbenicillin 1.0 g twice daily (Hodson 1981; Stead 1987).
vi. Aztreonam lysine (AZLI)
No trial investigated the use of AZLI compared to placebo.
d. Outcomes
All 11 trials included lung function (FEV1 and FVC) as an outcome measure; however, the duration of the trials and the method of expression of results varied across the trials. The most common method (five trials) was the change in FEV1 and FVC from baseline to the end of treatment; this change was expressed as change as % predicted in four trials (Chuchalin 2007; Jensen 1987; Kun 1984; Ramsey 1999) and as change in litres in one trial (Stead 1987). The Jensen trial reported on lung function over three months (see 'Effects of interventions') and also on improvement in clinical score and inflammatory parameters, neither of which are outcome measures for this review (Jensen 1987). Two trials compared absolute FEV1 and FVC at the end of treatment, one as % predicted (Day 1988) and one in litres (Nathanson 1985). Lung function was reported as the mean of monthly measurements for six months in one trial (Hodson 1981) and the rate of decline of predicted FEV1 in two trials (MacLusky 1989; Murphy 2004). One trial only provided a narrative statement on difference between groups (Wiesemann 1998). Four of the trials did not include SDs or SEs for lung function (Day 1988; Hodson 1981; Kun 1984; Nathanson 1985).
Seven trials included some measurement of frequency of exacerbations of lung infection; four measured number of hospital admissions (Chuchalin 2007; Day 1988; Ramsey 1999; Stead 1987), one reported days in hospital during the trial (Kun 1984) and two trials reported both hospital admissions and number of days (MacLusky 1989; Murphy 2004). Seven trials measured the number of courses of antibiotics during the trial (Chuchalin 2007; Day 1988; Hodson 1981; Kun 1984; Murphy 2004; Ramsey 1999; Stead 1987).
Six trials reported some score of disease severity, which included symptoms, but were not consistent in their methodology (Day 1988; Jensen 1987; Kun 1984; MacLusky 1989; Nathanson 1985; Ramsey 1999).
Sputum bacteriology for antibiotic sensitivity was reported in seven trials (Chuchalin 2007; Hodson 1981; Jensen 1987; Kun 1984; MacLusky 1989; Ramsey 1999; Stead 1987).
Four trials measured renal function (Chuchalin 2007; MacLusky 1989; Murphy 2004; Ramsey 1999) and five trials measured hearing as a marker of toxicity (Chuchalin 2007; Hodson 1981; MacLusky 1989; Murphy 2004; Ramsey 1999).
Other outcome measures used infrequently were death, chest X‐ray score, blood antibiotic levels, quantitative bacterial count in sputum, blood levels of inflammatory parameters, weight, treatment satisfaction and number of lost school or working days.
2. Inhaled anti‐pseudomonal antibiotics compared
Seven of the 18 included trials reported on this comparison with 1840 participants (Assael 2013; Bilton 2014; Elborn 2015; Schuster 2013; Konstan 2010b; Nikolaizik 2008; Stead 1987). One trial (n = 18) compared to both placebo and another inhaled antibiotic and is therefore included in two comparisons in this review (Stead 1987).
a. Trial design
Two of the trials (n = 50) were cross‐over in design (Nikolaizik 2008; Stead 1987). One trial employed two arms with each arm lasting three months and no washout period described (Nikolaizik 2008). The second cross‐over trial had three treatment arms with each one lasting four months (Stead 1987). The remaining five trials (n = 1790) employed a parallel design (Assael 2013; Bilton 2014; Elborn 2015; Konstan 2010b; Schuster 2013).
The duration of the trials varied; five trials lasted six months (Assael 2013: Bilton 2014; Elborn 2015; Konstan 2010b; Schuster 2013). The Nikolaizik trial ran over three months (Nikolaizik 2008) and Stead over four months (Stead 1987).
Sample size ranged from 18 participants (Stead 1987) to 553 participants (Konstan 2010b).
Two of the seven trials did not state whether they were multicentre or single centre or in which country they were carried out (Nikolaizik 2008; Stead 1987). The remaining five trials were multicentre: one being set in Europe and USA (Assael 2013); one in Europe and Canada (Bilton 2014); one in Europe, USA and Israel (Elborn 2015); and one across Europe, Russia and Ukraine (Schuster 2013). The Konstan trial was conducted in 127 centres in 15 countries, though the individual countries were not stated (Konstan 2010b).
b. Participants
All seven trials enrolled both adults and children with age ranges from six to 56 years. With regards to gender split, in two trials there was an almost equal split between males and females (Assael 2013; Nikolaizik 2008) and in four trials there were more males than females (Elborn 2015; Schuster 2013; Konstan 2010b; Stead 1987). One trial did not specify the gender split (Bilton 2014).
All trials enrolled participants with a confirmed diagnosis of CF and presence of P aeruginosa in the sputum (Assael 2013; Bilton 2014; Elborn 2015; Konstan 2010b; Nikolaizik 2008; Schuster 2013; Stead 1987).
Disease severity at baseline was measured in all trials. Four trials reported the number of participants whose FEV1 results at baseline were less than 50% of predicted: in the Assael trial 43.7% of participants (Assael 2013); in the Bilton trial 23.7% of participants (Bilton 2014); in the Schuster trial 47.3% of participants (Schuster 2013); Konstan reported separately for each arm of the trial, 41.6% and 42.6% (Konstan 2010b). Elborn reported that 55.9% and 52.9% of participants in the two arms had an FEV1 at baseline of less than 55% of predicted (Elborn 2015). One trial reported the mean (SD) FEV1 % predicted in each of the two arms of the trial, 48.4% (15.8) and 63.1% (21.6) (Nikolaizik 2008). Stead reported a median FVC at baseline of 53% of the predicted value (Stead 1987).
c. Interventions
In two of the trials, different preparations of tobramycin were compared (Konstan 2010b; Nikolaizik 2008). Konstan compared twice‐daily inhaled tobramycin powder (four capsules, total of 112 mg) with twice‐daily tobramycin for inhalation solution (TIS) (300 mg in 5 mL) for six months (Konstan 2010b). Over three months, Nikolaizik compared twice‐daily inhalations of the intravenous preparation of tobramycin (80 mg) and intermittent (four‐weekly on‐off cycles) TIS (300 mg) (Nikolaizik 2008).
A further four trials compared TIS to other inhaled antibiotics (Assael 2013; Bilton 2014; Elborn 2015; Schuster 2013). Assael compared 75 mg AZLI inhaled three times daily to 300 mg TIS inhaled twice daily (Assael 2013). Bilton compared once‐daily 560 mg liposomal amikacin for inhalation (LAI) (Arikace™) with twice‐daily 300 mg TIS (Bilton 2014). Elborn compared 240 mg levofloxacin for inhalation solution (LIS) (Aeroquin™, MP376, APT‐1026) with 300 mg TIS; both treatments were inhaled twice daily (Elborn 2015). In the fourth trial, Schuster compared twice‐daily 125 mg colistimethate dry powder for inhalation with twice‐daily 300 mg TIS for six months; the tobramycin regimen consisted of three cycles of 28 days on and 28 days off treatment (Schuster 2013).
Finally, over four months Stead compared twice‐daily inhalations of 1 g ceftazidine (in 2 mL to 4 mL solution) to twice‐daily inhalations of a combination of 80 mg gentamicin (in 2 mL solution) and 1 g carbenicillin (3 mL of sterile water) inhaled separately and also to placebo (2 mL to 4 mL of 3.5% saline solution) inhaled twice daily (Stead 1987).
d. Outcomes
All seven trials reported on FEV1 (Assael 2013; Bilton 2014; Elborn 2015; Konstan 2010b; Nikolaizik 2008; Schuster 2013; Stead 1987) and five reported FVC (Elborn 2015; Konstan 2010b; Nikolaizik 2008; Schuster 2013; Stead 1987). Four trials reported on sputum bacteriology (Assael 2013; Bilton 2014; Elborn 2015; Stead 1987) and two reported on participant preference (Nikolaizik 2008; Stead 1987). A further two trials measured treatment satisfaction (Assael 2013; Konstan 2010b) and one reported on treatment burden (Bilton 2014). Three trials reported on pulmonary exacerbations (Elborn 2015; Schuster 2013; Stead 1987), four reported the number of respiratory hospitalisations (Elborn 2015; Konstan 2010b; Schuster 2013; Stead 1987) and four reported on safety outcomes or adverse events (Bilton 2014; Elborn 2015; Konstan 2010b; Schuster 2013).
3. Continuous inhaled anti‐pseudomonal antibiotics versus intermittent inhaled anti‐pseudomonal antibiotics compared
One of the trials included at this update compared continuous treatment with a combination of inhaled anti‐pseudomonal antibiotics versus intermittent treatment with inhaled antibiotics (Flume 2016b). This trial included 90 participants.
a. Trial design
This multicentre trial (45 CF centres in the USA) employed a double‐blind parallel design with a run‐in period of 28 days of TIS followed by three 28 day cycles of AZLI or placebo. The three treatment cycles were alternated with 28 days of TIS. Participants either received a continuous course of alternate antibiotics (AZLI alternating with TIS) or an intermittent course of TIS alternating with placebo.
The total duration of the trial was 28 weeks with the intervention period lasting 24 weeks. 90 participants were randomised and included in the intention‐to‐treat (ITT) analysis.
b. Participants
The trial enrolled both adults and children with a mean (SD) age of 28.5 (12.1) years in the AZLI group and a mean (SD) age of 28.3 (10.8) years in the placebo group. Both arms of the trial were weighted towards females with only 42.9 % male in the AZLI group and 41.3 % male in the placebo group.
All enrolled participants had a confirmed diagnosis of CF and presence of P aeruginosa in the sputum.
Disease severity at baseline was measured using the mean (SD) FEV1 % predicted at day one; in the AZLI group this was 49.9% (17.7) and in the placebo group it was 50.1% (15.3)
c. Interventions
All participants received a run‐in of 28 days of TIS 300 mg twice daily. In the comparison phase, participants were randomised to AZLI 75 mg three times daily (diluted in 0.17% NaCl) delivered by the eFlow nebuliser system (PARI) or placebo. The placebo treatment was lactose monohydrate and sodium chloride reconstituted with the same diluent used for AZLI (0.17% w/v NaCl solution) and given to the same schedule. The alternating treatment was 300 mg of TIS twice daily for each four‐week period.
d. Outcomes
The trial measured mean change from baseline in FEV1 % predicted where values at the end of weeks four, 12 and 20 (AZLI or placebo phases) were averaged. The primary outcome for the trial was rate of protocol‐defined exacerbations (PDEs) at the end of treatment. The trial also reported on median time (95% CI) to first exacerbation and rate of hospitalisation. Nutritional outcomes were not reported although the change in weight was listed in adverse events. Quality of life was reported using the CFQ‐R respiratory symptom score with scores averaged from weeks four, 12 and 20. The changes in Cystic Fibrosis Respiratory Symptom Diary (CFRSD) scores and Chronic Respiratory Infection Symptom Scores (CRISS) were also exploratory endpoints. The trial did not report on survival. Antibiotic resistance was measured by measuring change from baseline in P aeruginosa density, presence of other respiratory pathogens and change from baseline in minimum inhibitory concentrations (MIC) of aztreonam, tobramycin and other antibiotics active against P aeruginosa. Adverse events were reported for the comparative phase of the trial and included treatment‐emergent adverse events, severe adverse events and treatment‐related adverse events (Flume 2016b).
Excluded studies
There are 76 trials listed as excluded, full details are given in the tables (Characteristics of excluded studies). The reasons for exclusion varied and some had more than one exclusion factor, but we have presented the main reason for exclusion in the following text. The most frequent reason for exclusion was duration of the trial, which in the original review was a minimum of 28 days and after the post hoc change in 2018 was a minimum of three months of treatment. Duration of the intervention was less than 28 days in 29 trials that were excluded from the original version of the review; nine of these trials were single‐dose trials (Alothman 2000; App 2000; Chua 1990; Geller 2011a; Gulliver 2003; Mullinger 2005; Stass 2014; Westerman 2003; Westerman 2007) or less than 28 days (Eisenberg 1997). Duration of the intervention was over 28 days but under three months in 20 trials, which were subsequently excluded from the 2018 update of the review (Dorkin 2015; Dupont 2008; Flume 2016a; Galeva 2011; Geller 2011b; Gibson 2003; Goss 2009; Hodson 2002; Konstan 2010a; Lenoir 2007; Mainz 2014; Mazurek 2014; McCoy 2008; Nasr 2004; Ramsey 1993; Retsch‐Bogart 2007; Rietschel 2009; Sands 2014; Trapnell 2012; Wainwright 2011) and in one trial that was listed as 'Awaiting classification' prior to the 2017 update (Davies 2004). A summary of the information contained in the trials that are more than 28 days in duration but less than three months can be found in the additional tables (Table 1). Eight trials were not RCTs (Franz 1985; Nikolaizik 1996; Oermann 2009; Smith 1989; Stass 2009; Steinkamp 1989; Wall 1984; Wang 1984) and in a further four trials the control was not appropriate for testing the effect of an inhaled antibiotic (Rosenfeld 2006; Ruddy 2013; Shatunov 2001; Stroobant 1985). In three trials the antibiotic was not inhaled (Pradal 2002; Steinkamp 2006; Wainwright 2008). Two trials did not examine an anti‐pseudomonal antibiotic treatment (Ledson 2002; Nolan 1982). Three trials looked at treatment to eradicate P aeruginosa (Proesmans 2008; Ramsey 2005; Ratjen 2006). Finally, seven trials compared a combination of antibiotics administered differently and not just inhaled (Carswell 1987; Cooper 1985; Frederiksen 1997; Noah 2007; Schaad 1997; Tramper‐Stranders 2009; Valerius 1991).
| Trial | Trial characteristics | Participants | Interventions | Summary of results |
| Duration: 28 days. Design: double‐blind, placebo‐controlled parallel RCT. Location: multicentre ‐ 73 sites in 9 countries (USA, Australia and Europe). Clinical trials identifier: NCT00645788 | Number: estimated enrolment 245, 288 randomised but only 286 received 1 of the 4 treatments. Age: 12 years and older (split children 12 ‐ 17 years and adults 18 years and over). Gender: males or females. Disease status: chronic colonisation with P aeruginosa, clinically stable. | Intervention 1: 32.5 mg ciprofloxacin betaine corresponding to 50 mg ciprofloxacin Pulmonsphere inhalation powder 2x daily. Intervention 2: placebo (50 mg matching placebo powder formulation) 2x daily. Intervention 3: 48.75 mg ciprofloxacin betaine corresponding to 75 mg ciprofloxacin Pulmonsphere inhalation powder 2x daily. Intervention 4: placebo (75 mg matching placebo powder formulation) 2x daily. Interventions 3 and 4 were introduced after amendment 2. | No significant difference in change in FEV1 between ciprofloxacin dry powder inhalation at either dose (P = 0.154). In pooled analyses, FEV1 decline from baseline to treatment end was significantly lower with ciprofloxacin There were positive effects on sputum bacterial load and quality of life which weren't maintained in the 4‐week follow‐up. There were no significant | |
| Duration: 28 days. Design: placebo‐controlled phase IIa parallel RCT (stratified by baseline FEV1 (% predicted) and randomised 2:1 to Arikace™ or placebo). Location: multicentre ‐ 13 centres in Europe. | Number: 66 participants enrolled. Age: 23 adults, 25 adolescents (13 ‐ 18 years) and 18 children (6 ‐ 12 years). Gender: no details. Disease status: chronic P aeruginosa infection; baseline FEV1 (% predicted) 40 ‐ 75% in 43 participants; >75% in 23 participants. | Cohort 1: (n = 32) 280 mg Arikace™ or placebo (hypertonic saline solution (1.5% NaCl)) once daily. Inhaled with PARI eFlow® nebuliser. | Relative change in FEV1 was higher in the 560 mg group at day 28 (P = 0.033) compared to placebo. The adverse event profile was similar among Arikace™ and placebo groups. | |
| Duration: 28 days. Design: placebo‐controlled parallel RCT. Location: multicentre ‐ 17 centres in 8 countries. | Number: 62 randomised (target was 100). Age: 6 to 21 years. Gender: no details. Disease status: diagnosed with CF by at least 1 clinical feature plus sweat test, FEV1 of 25 ‐ 80% predicted. | Intervention 1: TIP (n = 32) 112 mg 2x daily. Intervention 2: placebo (n = 30) 2x daily. | Mean treatment difference in absolute change in FEV1 between TIP ‐ placebo was 4.4 % (P < 0.05). Mean treatment difference in relative change in FEV1 between TIP ‐ placebo was 5.9 % (P < 0.0.184). TIP significantly reduced sputum density. | |
| Duration: 28 days. Design: double‐blind, placebo‐controlled parallel RCT (3 arms). Location: multicentre ‐ 51 centres across USA and Europe. | Number: 151 randomised. Age: mean age 29 years. Gender: 85 males, 66 females. Disease status: diagnosed CF, chronic P aeruginosa airways infection, FEV1 between 25 ‐ 85% predicted, and 3 courses of inhaled antibiotics over the past 12 months. | Intervention 1: (n = 38) MP‐376 120 mg daily. Intervention 2: (n = 37) MP‐376 240 mg daily. Intervention 3: (n = 39) MP‐376 240 mg 2x daily. Intervention 4: (n = 37) placebo. Delivered by a customized investigational PARI eFlow nebulizer. | All doses of MP‐376 resulted in reduced sputum density at day 28 (240 mg twice a day showed a 0.96 log difference compared with placebo P = 0.001) There was a dose‐dependent increase in FEV1 for MP‐376. There was a difference of 8.7 % in FEV1 between MP‐376 240 mg twice a day and placebo (P = 0.003). There was a significant reduction in the need for other anti‐pseudomonal antibiotics compared to placebo. | |
| Duration: 28 days. Design: double‐blind, placebo‐controlled parallel RCT. Early termination due to poor recruitment. | Number: 21 randomised (planned 98). Age: 6 months ‐ 6 years. Gender: 11 males, 10 females. Disease status: positive P aeruginosa culture. | Intervention 1: (n = 8) tobramycin 300 mg 2x daily. Intervention 2: (n = 13) placebo 2x daily. | There was a significant difference between treatment groups and placebo in the reduction in P aeruginosa density (no P aeruginosa was detected at day 28 in 8 out of 8 active group patients compared to 1 out of 13 placebo patients). There were no significant differences between treatment groups for clinical indices or adverse events. | |
| Duration: 28 days (with 28‐day follow‐up). Design: placebo‐controlled parallel phase 2 RCT (stratified by baseline FEV1 (% predicted) and randomised 2:1 to Arikace™ or placebo). Location: multicentre ‐ 18 centres across USA. | Number: 46 randomised. Age: mean (SD) Arikace™ 70 mg: 33.1 (9.7) years. Arikace™ 140 mg: 35.4 (6.0) years. Placebo 70 mg and 140 mg: 24.4 (6.3) years Arikace™ 560 mg: 31.5 (14.5) years. Placebo 560 mg: 26.3 (6.7) years. Gender: 27 males, 19 females. Disease status: Cohorts 1 and 2: baseline FEV1 % predicted 40 ‐ 75% n = 16 and > 75% n = 5. Cohort 3: baseline FEV1 % predicted 40 ‐ 75% n = 19 and > 75% n = 6. More details on lung function and BMI in supplementary papers | Arikace™ or placebo (hypertonic saline (1.5% NaCl). Cohort 1: (n = 14) 70 mg Arikace™ or placebo 1x daily. Cohort 2: (n = 12) 40 mg Arikace™ or placebo 1x daily. Cohort 3: (n = 22) 560 mg Arikace™ or placebo 1x daily. Inhaled using eFlow nebulizer system (PARI Pharma GmbH). Follow‐up for 28 days after trial finish. Review of interim data in combination with data from similar European trial led to addition of Cohort 3 for a further 28 days with follow‐up of 56 days after trial finish. | Arikace™ was well tolerated at doses of 70 mg, 140 mg and 560 mg. | |
| Duration: 28 days. Design: open‐label parallel RCT (stratified by age and centre). | Number: 126 randomised, 11 withdrew before treatment, 115 treated. Age: range 7 ‐ 50 years. Gender: males 45% of total. Disease status: criteria for diagnosis abnormal sweat electrolytes, gene mutation. | Intervention 1: tobramycin 300 mg in 5 mL 2x daily, delivered by Pari LC plus nebuliser with CR50 compressor. Intervention 2: colistin 1MU in 3 mL in saline 2x daily, delivered by Ventstream nebuliser with CR50 compressor. | Tobramycin significantly improved lung function (mean improvement in FEV1 % predicted from baseline to week 4 was 6.7 % P = 0.006). The mean change in FEV1 % predicted was not significant in the colistin group (0.37 %). Both antibiotic regimes produced a significant decrease in sputum density, there was no development of highly resistant strains and the safety profile for both antibiotics was good. | |
| Duration: total of 24 weeks, 3 cycles each of 28 days on treatment followed by 28 days off treatment (only cycle 1 was double‐blind and randomised, cycles 2 and 3 were open‐label extension phases in which all participants received the same treatment). Design: double‐blind, placebo‐controlled parallel RCT. Location; multicentre ‐ 38 centres in Europe, Latin America and USA. Clinical trials identifier: NCT00125346. Known as the EVOLVE Trial. Trial terminated after showing a statistically significant benefit of TIP. | Number: 102 randomised, 95 received intended treatment, unclear in which group 7 withdrawals were from. Age: mean (SD): TIP 13.4 (4.42) years; placebo 13.2 (3.91) years. Gender: 42 males, 53 females. Disease status: baseline lung function (FEV1 % predicted) (mean (SD)): TIP 54.7 (18.89)%; placebo 58.5 (20.03)%. | Intervention 1: (n = 46) TIP 112 mg 2x daily. Intervention 2: (n = 49) placebo 2x daily. Cycle 1 (28 days on and 28 days off treatment or placebo). Cycles 2 and 3: open‐label cycles of TIP for all participants. | TIP significantly improved FEV1 % predicted from baseline to day 28 (difference 13.3, 95% CI 5.31 to 21.28 P = 0.0016). TIP reduced sputum P aeruginosa density, respiratory related hospitalisation and anti‐pseudomonal antibiotic use. The most common adverse event was cough but the frequency was higher in the placebo group (26.5 %) versus TIP (13.0%). No evidence of ototoxicity or nephrotoxicity. | |
| Duration: 4 weeks followed by a 4‐week run‐out phase. Design: double‐blind, placebo‐controlled parallel RCT. Location: multicentre ‐ 13 sites in 4 countries. | Number: 59 participants. Age: range 6 ‐ 30 years. Gender: 32 males, 27 females. Disease status: participants diagnosed with CF and P aeruginosa. | Intervention 1: tobramycin 300 mg (Bramitob®) 2x daily. Intervention 2: placebo 2x daily. Active drug and placebo both delivered by Pari LC Plus nebuliser and Pari TurboBoy compressor. | There was a significant increase in FEV1 from baseline in the tobramycin group but not in the placebo group (absolute difference 13.3% P = 0.003). Similar improvements were also seen for FVC in the tobramycin group. Adverse events were lower in the in the tobramycin group. Microbiological outcomes were significantly improved. | |
| Duration: 28 days. Design: double‐blind placebo‐controlled parallel RCT. Location: multicentre ‐ 2 centres in Germany (Jena and Tuebingen). | Number: 9 participants. Age: mean (SD): 22.4 (7.6) years; range 10.6 to 38.7 years. Gender: 6 males, 3 females. Disease status: diagnosed with CF by 2 positive sweat tests or genetic analysis (or both) and with chronic P aeruginosa colonisation. | Intervention 1: 80 mg tobramycin daily. Intervention 2: placebo (isotonic saline). Sinonasal inhalation using PARI Sinus™ compressor with a PARI LC SPRINT STAR™ nebuliser. Drug administered to each nostril for 4 minutes with the other nostril occluded, maximum volume of 1 mL per nostril. | P aeruginosa quantity decreased in 4 out of 6 (67%) participants receiving tobramycin and in none of the placebo group. Sinonasal inhalation was well tolerated. | |
| Duration: single cycle of 28 days on and 28 days off (8 weeks total duration). Design: parallel RCT (non‐inferiority trial). Location: multicentre ‐ 38 centres in Europe. Clinical trials identifier: NCT00885365. Follow‐on 48 week extension of TNS4 only: ClinicalTrials ID: NCT01111383. | Number: 406 individuals screened, 324 participants randomised. Age: mean (SD): TNS4 15.89 (6.25) years; TNS5 15.58 (7.31) years. Gender: no details. Disease status: diagnosed with CF. Chronic P aeruginosa infection and FEV1 ≥ 40% and ≤ 80% predicted. | Intervention 1: (n = 156) TNS4 (Bramitob®) 300 mg/4 mL 2x daily. Intervention 2: (n = 168) TNS5 (TOBI®) 300 mg/5 mL 2x daily. Both interventions delivered via PARI Boy N® compressor and the PARI LC Plus® nebuliser. Other standard therapies allowed. | TNS4 showed similar short‐term clinical benefits to TNS5. Adverse event reporting was similar between the 2 treatment groups. | |
| Duration: 4 weeks. Design: double‐blind, placebo‐controlled parallel RCT. Location: multicentre ‐ 56 centres in USA. | Number: 246 participants randomised; 173 completed 28‐day treatment phase; and 90 completed open‐label follow‐up for 56 days. Age: 7 to 65 years. Gender: 121 males. Disease status: documented diagnosis of CF and P aeruginosa, 3 or more courses of tobramycin in previous year, FEV1 between 25 and 75% predicted. | Intervention 1: aztreonam 75 mg for 4 weeks, 2x or 3xdaily. Intervention 2: placebo (5 mg lactose in 1mL 0.17% NaCl) for 4 weeks, 2x or 3x daily. | AZLI treatment increased the median time to need for additional anti‐pseudomonal antibiotics by 21 days compared to placebo (AZLI 92 days; placebo 71 days P = 0.007). AZLI improved mean CFQ‐R respiratory scores (P = 0.02) and sputum density (P = 0.006. Adverse events were reported in both groups but were consistent with CF lung disease. | |
| Duration: 28 days. Design: double‐blind, placebo‐controlled parallel RCT. Location: single centre in USA. | Number: 32 people with CF (31 completed). Age: mean (SD) and range ‐ TSI group 11.81 (7.46) years, 6.0 to 34.7 years; placebo group 15.86 (7.25) years, 7.4 to 28.8 years. Gender: 12 males, 20 females ‐ TSI group 6 males and 10 females, placebo group 6 males and 10 females. Disease status: CF diagnosis by sweat test or genotype testing. Colonised with P aeruginosa. Lung function FEV1 % predicted mean (SD) and range: TSI group 95.73 (17.21)%, 55.0% to 134.1%; placebo group 83.71 (21.07)%, 45.0% to 108.73%. | Intervention 1: (n = 16) TSI 5 mL (solution of 300 mg tobramycin and 11.25 mg sodium chloride in sterile water) 2x daily. Intervention 2: (n = 16) placebo (solution of 1.25 quinine sulphate in normal saline) 2x daily. Interventions both administered using PARI LC Plus™ jet nebuliser and PulmoAide compressor. | % predicted FEV1 increased slightly for both groups by mean (SD) 1.29 (3.33) for TSI and 1.17 (1.4) for placebo. | |
| Duration: 3x 28‐day periods (only results of first 28‐day parallel group comparison suitable for analysis). Design: double‐blind placebo‐controlled 3‐period cross‐over RCT. | Number: 71 participants. Age: mean (SD): 17.7 (1.25) years and 16.6 (1.24) years in 2 groups. Gender: 37 males, 34 females. Disease status: CF diagnosed by sweat test. Sputum culture of P aeruginosa susceptible to tobramycin. Mean baseline FEV1 55% (SE 3.7) and 60% (SE 3.2) predicted in 2 treatment arms. | Intervention 1: tobramycin 600 mg 3x daily for 28 days, then cross‐over for 2 further 28‐day periods. Intervention 2: placebo (0.5 normal saline) 3x daily for 28 days, then cross‐over for 2 further 28‐day periods. Delivered by Ultrasonic (Ultraneb 100/99) nebuliser with 30 mL solution and 200 inhalations. | In the first 28‐day period there was an increase in % predicted FEV1 compared to placebo (P < 0.001) and FVC (P = 0.014). There was a decrease in the density of P aeruginosa in sputum (P < 0.001). | |
| Duration: 28 days. Design: double‐blind, placebo‐controlled parallel Phase III RCT. Location: multicentre: 53 centres in USA, Canada, Australia and New Zealand. Clinical trials identifier: NCT00112359. Known as AIR‐CF1 Trial. | Number: 164 participants. Age: mean (range)): AZLI 27.4 (7 – 54) years; placebo 31.7 (11 – 74) years. Gender: 93 males, 71 females. Disease status: stable condition. P aeruginosa in sputum or throat swab. No use of anti‐pseudomonal antibiotics in previous 14 days. Baseline lung function (FEV1 % predicted) (mean (SD)): AZLI 54.4 (13.4)%; placebo 54.8 (14.0)%. | Intervention 1: AZLI 75 mg 3x daily. Intervention 2: placebo 3x daily. Doses administered at least 4 hours apart using PARI eFlow™ Electronic Nebuliser after pre‐treatment with bronchodilator. Concommitant standard CF therapies allowed except anti‐pseudomonal antibiotics, azithromycin or hypertonic saline. | AZLI improved FEV1 % predicted (P < 0.001), CFQ‐R respiratory score (P < 0.001) and sputum P aeruginosa density (P < 0.001) compared to placebo. Adverse events were comparable between groups with the exception of productive cough. This outcome was reduced by half in AZLI‐treated participants. | |
| Duration: 20 weeks in total (8 weeks intervention 1, followed by 4 week washout, followed by 8 weeks intervention 2). Design: cross‐over. Location: multicentre in Germany. | Number: 35 stated as randomised in first abstract, but 29 randomised and 24/29 as having completed in second abstract. Age: 6 years and over, mean (SD) age 19.8 (6.3) years, range 8 ‐ 35 years. Disease status: chronically infected with P aeruginosa. | Intervention 1: continuous TIS 300 mg/d 1x daily. Intervention 2: continuous TIS 300 mg/d 2x daily. | Mean FEV1 was not markedly different between treatment periods or from baseline. No audiological or nephrotoxic side effects were noted. Once or twice daily dose was shown to be safe and tolerable. | |
| Duration: 3 months in total, but only 4 weeks taking each intervention (4 weeks intervention 1, 4 weeks washout period, 4 weeks intervention 2). Design: Cross‐over. Location: multicentre in Poland. | Number: 58 randomised, 54 in ITT population Age: 4 years and older. Mean (SD) age 15.4 (6.81) years, range 7 to 36 years. Gender: 25 males, 33 females. Disease status: mean (SD) FEV1 % predicted: VANTOBRA group 63.8 (17.1)%, range 30.0% to 82.8%; TIS group 64.2 (17.7)%, range 28.0% to 83.9%. | Intervention 1 (n = 28): T100 also known as VANTOBRA (170 mg tobramycin in 1.7 mL solution) via drug‐specific eFlow nebuliser Tolero with an eBase controller 2x daily. Intervention 2 (n = 30): TOBI (300 mg tobramycin in 5 mL solution) via PARI LC Plus nebuliser with PARI BOY SX compressor 2x daily. | Treatment with both products were comparable in terms of clinical efficacy (reduction of P aeruginosa density and improvement in lung function. Safety profiles were also comparable. | |
| Duration: 28 days. Design: placebo‐controlled parallel RCT. Location: multicentre ‐ 33 sites in the USA. | Number: 119 participants randomised. Age: mean (SD)): FTI 80/20mg 35 (10.9) years; FTI 160/40mg 31 (10.2) years; placebo 31 (8.8) years. Gender: 68 males, 51 females. Disease status: lung function (FEV1 % predicted) (mean (SD)): FTI 80/20mg 50 (13.4)%; FTI 160/40mg 21 (51)%; placebo 48 (13.6)%. | Intervention 1: (n = 38) FTI 80/20 mg 2x daily. Intervention 2: (n = 41) FTI 160/40 mg 2x daily. Intervention 3: (n = 40) placebo 2x daily. | Improvements in mean FEV1 % predicted achieved in the AZLI run‐in period were maintained in the FTI group compared with placebo (P = 0.002). The treatment effect on P aeruginosa sputum density significantly favoured FTI compared to placebo. Respiratory symptoms were less common in the FTI group. | |
| Duration: 28 days. Design: placebo‐controlled parallel RCT. Location: multicentre ‐ 40 centres in USA, Canada and Australia. | Number: 160 people randomised, 157 received treatment. Age: mean (SD): AZLI 19.5 (9.1) years; placebo 18.9 (9.1) years. Gender: 90 males, 70 females. Disease status: FEV1 % predicted: AZLI 95.5 (12.7)%; placebo 94.7 (12.9)%. | Intervention 1: (n = 76; 75 analysed, 1 discontinued trial) AZLI (75 mg aztreonam, 52.5 mg lysine monohydrate diluted in 0.17% saline (1 mL)) 3x daily. Intervention 2: (n = 81) placebo (5 mg lactose, 7.3 mg NaCl diluted in 0.17% saline (1 mL)) 3x daily. Both interventions self‐administered with the investigational eFlow® electronic nebulizer (PARI GmbH, Starnberg, Germany). | Treatment effect at 28 days for relative FEV1 % predicted was 2.7 % (P = 0.021 favouring AZLI). Treatment effect for CFQ‐R respiratory symptom score at day 28 was modest at 1.8 points (95% CI ‐2.8 to 6.4 P = 0.443). Sputum density was improved in the AZLI group (P = 0.016). |
AZLI: aztreonam lysine for inhalation
CF: cystic fibrosis
FEV1: forced expiratory volume in one second
FTI: fosfomycin/tobramycin for inhalation
ITT: intention to treat
P aeruginosa: Pseudomonas aeruginosa
RCT: randomised controlled trial
SD: standard deviation
SE: standard error
TIP: tobramycin inhalation powder
Studies awaiting classification
There are four trials listed as 'Studies awaiting classification'. The Flume 2015 trial is only reported in five abstracts and there is insufficient information to be able to decide if it is a separate trial or linked to one of the already included or excluded trials (Flume 2015). Two trials are only presented in abstract form and there is not sufficient information to be able to include them at this stage (Herrmann 2017; Ramsey 2017). The Nikonova trial is a three‐arm parallel comparison of TIS, Bramitob and inhaled colistin (Nikonova 2010). In this trial treatment duration is not clear and some participants have chronic infection and some had initial isolates of P aeruginosa.
Risk of bias in included studies
A summary of the risk of bias found across all of the included trials is presented here (Figure 2) and described in the tables (Characteristics of included studies).
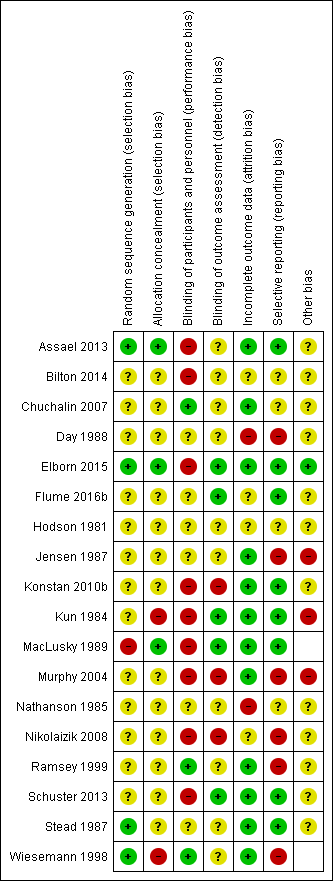
Risk of bias summary: review authors' judgements about each risk of bias item for each included study.
Inhaled anti‐pseudomonal antibiotic compared to placebo or to usual treatment
A total of 11 trials reported on this comparison (Chuchalin 2007; Day 1988; Hodson 1981; Jensen 1987; Kun 1984; MacLusky 1989; Murphy 2004; Nathanson 1985; Ramsey 1999; Stead 1987; Wiesemann 1998).
Allocation
Generation of sequence
In one trial, the treatment sequence in the cross‐over design used a 'Latin square' method and therefore has a low risk of bias (Stead 1987).
Five trials stated only that generation of allocation sequence was randomised and so these are rated as having an unclear risk of bias (Chuchalin 2007; Hodson 1981; Jensen 1987; Murphy 2004; Ramsey 1999). In two further trials randomisation was not described, and these are also rated as having an unclear risk of bias (Day 1988; Nathanson 1985).
In three trials the method of generating the allocation sequence has a high risk of bias as a coin toss or chance was used for randomisation of only the first participant (Kun 1984; MacLusky 1989; Wiesemann 1998).
Concealment of allocation
One trial which used alternate allocation had a low risk of bias for allocation concealment as a trial nurse was responsible for randomisation and the trial physician was reported to be blind to treatment allocation throughout the trial (MacLusky 1989). In eight trials, the concealment of the allocation schedule was not described and so these trials were judged to have an unclear risk of bias (Chuchalin 2007; Day 1988; Hodson 1981; Jensen 1987; Murphy 2004; Nathanson 1985; Ramsey 1999; Stead 1987). Two trials which allocated participants to alternate groups, were rated as having a high risk of bias with regards to the concealment of treatment allocation schedule as it could be foretold which treatment the next participant would be allocated to (Kun 1984; Wiesemann 1998).
Blinding (of participants, clinicians and outcome assessors)
We judged three trials to have a low risk of performance bias (blinding of participants and clinicians) as they attempted to mask the taste of the antibiotic solutions (although it is possible that this may not have been achieved adequately); two trials reported using quinine to attempt to mask nebulised solutions adequately (Chuchalin 2007; Ramsey 1999) and one used the tobramycin preservative solution to saline as the placebo (Wiesemann 1998). Five trials were judged to have an unclear risk of bias ‐ four of these were described as being double blind, but no further details were given (Day 1988; Hodson 1981; Jensen 1987; Nathanson 1985) and one did not give any details (Stead 1987). Three trials had a high risk of bias ‐ one trial stated that only trial physicians were blinded (MacLusky 1989), in one trial the participants and clinicians were not blinded since one group received treatment prior to physiotherapy and the second group received treatment both before and after physiotherapy (Kun 1984) and the third trial was described as open label (Murphy 2004).
With regards to detection bias (blinding of outcome assessors), two trials had a low risk of bias as they specified that outcome assessors were blinded (Kun 1984; MacLusky 1989). Eight trials had an unclear risk of bias ‐ seven of these were described as double blind but gave no details of who exactly had been blinded to treatment (Chuchalin 2007; Day 1988; Hodson 1981; Jensen 1987; Nathanson 1985; Ramsey 1999; Wiesemann 1998) and one trial did not give any details at all (Stead 1987). One trial was open label and had a high risk of bias for the blinding of outcome assessors (Murphy 2004).
Incomplete outcome data
The proportion of participants enrolled that were not available for analysis varied from 0.8% (2 out of 247) (Chuchalin 2007) to 65% (118 of 181) (Murphy 2004).
Use of an ITT analysis was stated in two trials and these were rated as having a low risk of bias (Chuchalin 2007; Ramsey 1999). In seven trials the risk of bias from incomplete outcome data was judged to be unclear (Hodson 1981; Jensen 1987; Kun 1984; MacLusky 1989; Murphy 2004; Stead 1987; Wiesemann 1998). In one of these, a parallel group trial, there was marked inequality in dropouts between the placebo group (9 out of 20) and the active treatment group (2 out of 20) (Jensen 1987).
The number of participants enrolled but not analysed was not stated in two trials and therefore these were rated as having a high risk of bias (Day 1988; Nathanson 1985).
Selective reporting
Protocols were not available for the included trials, therefore assessment was based upon the information in the trial reports and related abstracts. Three trials appeared free of selective reporting as all outcomes stated in the methods section were reported and these were rated as having a low risk of bias (Kun 1984; MacLusky 1989; Stead 1987). The risk of bias from selective reporting was rated as unclear for four trials (Chuchalin 2007; Hodson 1981; Jensen 1987; Nathanson 1985). The remaining four trials were judged to have a risk of selective reporting as the results for outcomes stated in the methods section were either not reported at all or only partially reported (e.g. P value only) (Day 1988; Murphy 2004; Ramsey 1999; Wiesemann 1998).
It should be noted that there are a number of methods of expressing FEV1 as a parameter of lung function and of measuring rates of exacerbations, hospitalisation and additional antibiotic use. This raises the possibility that analyses were performed in a number of ways of expressing these outcomes and non‐significant results not reported.
Other potential sources of bias
With regards to publication bias, it was not possible to produce a funnel plot as there were not 10 trials included in any single meta‐analysis. Outcome reporting bias was assessed by comparing the methods sections to the results sections for all articles as protocols were not available (see above). One trial had early termination for benefit (Murphy 2004), which may overestimate benefit (Montori 2005). Five trials reported pharmaceutical company support (Chuchalin 2007; Hodson 1981; Kun 1984; Murphy 2004; Stead 1987). Four trials were of cross‐over design with insufficient information regarding analysis, washout periods and carryover effects and therefore had an uncertain risk of bias (Day 1988; Hodson 1981; Kun 1984; Nathanson 1985).
Inhaled anti‐pseudomonal antibiotics compared
Seven trials reported on this comparison (Assael 2013; Bilton 2014; Elborn 2015; Schuster 2013; Konstan 2010b; Nikolaizik 2008; Stead 1987).
Allocation
Generation of sequence
Two trials were judged to have a low risk of bias (Assael 2013; Stead 1987). One trial used an interactive voice or web response system using a code generated by the pharmaceutical company sponsoring the trial (Assael 2013); the second trial generated the treatment sequence in the cross‐over design using a Latin square method (Stead 1987). The method of allocation in the remaining five trials was not described in detail leading to an unclear risk of bias (Bilton 2014; Elborn 2015; Schuster 2013; Konstan 2010b; Nikolaizik 2008).
Concealment of allocation
One trial used an interactive voice or web response system and so had a low risk of bias (Assael 2013). None of the remaining six trials commented on the treatment allocation schedule and so all were rated as having an uncertain risk of bias (Bilton 2014; Elborn 2015; Schuster 2013; Konstan 2010b; Nikolaizik 2008; Stead 1987).
Blinding (of participants, clinicians and outcome assessors)
There was a high risk of performance bias (blinding of participants and clinicians) in four trials which were described as open label (Assael 2013; Schuster 2013; Konstan 2010b; Nikolaizik 2008) and in two trials which used different treatment schedules (Bilton 2014) or explicitly stated that participants were not blinded (Elborn 2015). The Stead trial was partially blinded with one of the treatment arms being open but the remaining treatment arm and placebo arm being blind to patients and investigators leading to a judgement of an unclear risk of bias (Stead 1987).
There was a high risk of detection bias (blinding of outcome assessors) in three open‐label trials (Assael 2013; Konstan 2010b; Nikolaizik 2008). The risk of bias was judged to be unclear due to a lack of information in two trials (Bilton 2014; Stead 1987). A further two trials specifically stated that the outcome assessors were blinded and were judged to have a low risk of detection bias (Elborn 2015; Schuster 2013).
Incomplete outcome data
Withdrawal rates (with full reasons) were given in the full reports for five trials and therefore indicates a low risk of bias (Assael 2013; Elborn 2015; Schuster 2013; Konstan 2010b; Stead 1987). In a further trial, the number of participants randomised was not stated and therefore the dropout rate is unknown; we judged this trial to have an unclear risk of bias (Nikolaizik 2008). We also judged the risk of bias to be unclear for the remaining trial, where no reasons for withdrawals were given (Bilton 2014).
Selective reporting
Five trials appear free of selective reporting based on the information taken from the trial reports and were judged to have a low risk of bias (Assael 2013; Elborn 2015; Schuster 2013; Konstan 2010b; Stead 1987). The risk of bias due to selective reporting was unclear for one trial due to lack of information as the trial reports were in abstract form only (Bilton 2014). In one trial, oxygen saturation and sputum bacteriology were measured, but the results were not reported, giving a high risk of bias (Nikolaizik 2008).
Other potential sources of bias
There were no additional sources of bias identified for the Elborn trial which was therefore considered to have a low risk of bias (Elborn 2015). Two trials had an unclear risk of bias on account of their cross‐over design coupled with insufficient information regarding washout periods, carryover effects and analysis (Nikolaizik 2008; Stead 1987). One further trial was judged to have an unclear risk of other potential sources of bias since to date it has only been published in abstract form (Bilton 2014). Five trials had a risk of bias due to reported pharmaceutical company support (Assael 2013; Schuster 2013; Konstan 2010b; Nikolaizik 2008; Stead 1987).
Continuous inhaled anti‐pseudomonal antibiotics versus intermittent inhaled anti‐pseudomonal antibiotics compared
One trial reports on this comparison (Flume 2016b).
Allocation
Generation of sequence
The trial was judged to have an unclear risk of bias because although eligible participants were stratified by disease severity and number of acute respiratory exacerbations and randomised 1:1, the method of randomisation was not described (Flume 2016b).
Concealment of allocation
There was no description of allocation concealment and so the trial was rated as having an uncertain risk of bias (Flume 2016b).
Blinding (of participants, clinicians and outcome assessors)
The authors report the trial as double‐blind and say that both participants and investigators are blinded. No further description of blinding is given therefore we have deemed this domain to be at an unclear risk of bias (Flume 2016b).
There was however, a low risk of detection bias (blinding of outcome assessors) due to there being an independent, blinded adjudication committee to review outcome data.
Incomplete outcome data
The withdrawal rate (with full reasons) was given for the trial but more than 15% of randomised participants failed to complete the trial, so we rated this domain as having an unclear risk of bias (Flume 2016b)
Selective reporting
We deemed the Flume trial to be free of selective reporting bias as all the outcomes reported in the methods are subsequently reported in the results. We were also able to access the trial registration documentation to check that outcomes reported at the protocol stage were included in the full report (Flume 2016b).
Other potential sources of bias
Trial enrolment was limited for the trial and it was therefore underpowered and at an unclear risk of bias for this domain (Flume 2016b).
Effects of interventions
See: Summary of findings for the main comparison Summary of findings: anti‐pseudomonal antibiotics versus placebo; Summary of findings 2 Summary of findings: colistimethate dry powder for inhalation (Colobreathe®) versus tobramycin for inhalation solution; Summary of findings 3 Summary of findings: inhaled TOBI® (IV preparation) versus tobramycin for inhalation solution; Summary of findings 4 Summary of findings: tobramycin for inhalation powder versus tobramycin for inhalation solution; Summary of findings 5 Summary of findings: aztreonam lysine for inhalation versus tobramycin for inhalation solution; Summary of findings 6 Summary of findings: liposomal amikacin for inhalation versus tobramycin for inhalation solution; Summary of findings 7 Summary of findings: levofloxacin for inhalation solution versus tobramycin for inhalation solution; Summary of findings 8 Summary of findings: continuous cycles alternating aztreonam lysine for inhalation with tobramycin for inhalation solution versus continuous cycles alternating placebo with tobramycin for inhalation solution
Not all outcomes reported results that can be analysed. Pooling of results for analysis is not possible for most outcomes because of differences in trial duration, methods of measuring and expressing results of the outcome and because of missing estimates of variance. A major problem was the high proportion of cross‐over trials, six out of 18 included trials. There must be doubt about the suitability of this design for trials of antibiotic treatment in people with CF (see 'Discussion'). Despite this doubt we have included such trials in the review. They are excluded from meta‐analyses unless the first‐period parallel group comparison was available. Outcomes not reported by any trial in a comparison are not listed below; we only present those outcomes that have been reported in the included trials.
Inhaled anti‐pseudomonal antibiotics compared to placebo
Primary outcomes
1. Lung function
a. FEV1
All 11 trials (n = 1130) reported on FEV1 (Chuchalin 2007; Day 1988; Hodson 1981; Jensen 1987; Kun 1984; MacLusky 1989; Murphy 2004; Nathanson 1985; Ramsey 1999; Stead 1987; Wiesemann 1998). Trials reported FEV1 using in different units of measurement and most lacked information needed for a meta‐analysis.
The analysis of data for FEV1 % predicted (absolute values) was not significant in one trial (n = 29) at three months, MD ‐2.00% (95% CI ‐22.41 to 18.41) or in a further trial (n = 245) at up to one year, MD 3.10 (95% CI ‐2.35 to 8.55) (Analysis 1.1). Two trials reported simply that FEV1 % predicted was not significantly different between groups at three months (no data) (Nathanson 1985;Wiesemann 1998).
Two trials reported the mean change in FEV1 % predicted (Chuchalin 2007; Jensen 1987). At three months, the Jensen trial (n = 29) reported no significant difference in the mean change between inhaled antibiotics and placebo, MD 6.00% (95% CI ‐1.07 to 13.07) (Analysis 1.2). Chuchalin (n = 247) showed there to be a greater change in FEV1 after tobramycin than placebo, with a 6.38% difference between groups (95% CI 2.94 to 9.82) (Analysis 1.3) (Figure 3). The largest trial (n = 520) reported a 10% mean increase in FEV1 % predicted in the tobramycin group compared to a 2% mean decrease in FEV1 % predicted in the control group after 20 weeks (P < 0.001) (Ramsey 1999). A further trial (n = 33) reported that the difference in the change in FEV1 % predicted between groups was statistically significant, but provided no data for analysis (Kun 1984). One trial (n = 14) reported within‐group differences in FEV1 % predicted narratively, but did not report between‐group differences at the end of treatment (Day 1988).
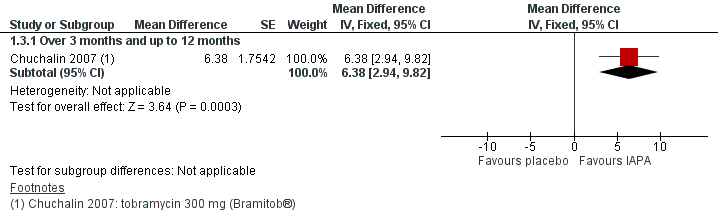
Two trials lasting over 12 months reported the rate of decline in FEV1 as the primary endpoint (MacLusky 1989; Murphy 2004). In the MacLusky trial (n = 27), the difference in rate of change of FEV1 % predicted per year favoured inhaled antibiotics, MD 7.80% (95% CI 3.29 to 12.31) (Analysis 1.4). The second trial (n = 181) reported no difference in FEV1 decline; but in this trial only 57% of participants had the minimum number of measurements (Murphy 2004).
Two reports (n = 38) stated that the differences between groups (one measuring FEV1 in mL and one in L) were statistically significant, but provided no data (Hodson 1981; Stead 1987).
Our GRADE analysis assessed the evidence for this outcome to be low (summary of findings Table for the main comparison).
b. FVC
A result for FVC was reported in 10 trials (n = 1097) (Chuchalin 2007; Day 1988; Hodson 1981; Jensen 1987; MacLusky 1989; Murphy 2004; Nathanson 1985; Ramsey 1999; Stead 1987; Wiesemann 1998). Again, trials reported FVC in different units and usually lacked information needed for meta‐analysis.
The Jensen trial (n = 29) reported absolute values for FVC % predicted at three months; the results were not significantly different between the groups, MD 8.00 (95% CI ‐12.18 to 28.18) (Analysis 1.5). Day (n = 14) reported that FVC % predicted was significantly greater in the antibiotic group (74.0%) than the control group (67.5%) at the end of the trial (six months) (P < 0.05); no further data were provided, therefore we are unable to present the results from this cross‐over trial in the analysis (Day 1988). One 12‐month trial (n = 22) reported no difference in FVC % predicted between the treatment and control groups (Wiesemann 1998).
Data from the Jensen trial (n = 29) showed that the change in FVC % predicted at three months was significantly greater for inhaled antibiotics compared to placebo, MD 11.00 (95% CI 1.94 to 20.06) (Jensen 1987) (Analysis 1.6). Data from the Chuchalin trial (n = 245) at up to 12 months also reported a significant difference in favour of the antibiotic group, MD 4.60 (95% CI 1.01 to 8.19) (Chuchalin 2007) (Analysis 1.6) (Figure 4). Ramsey was the largest trial (n = 520), but did not present any data we were able to analyse; at 20 weeks investigators reported a greater change in FVC % predicted in the antibiotic group (8%) compared to the control group (‐1%) (Ramsey 1999).

Forest plot of comparison: 1 Inhaled anti‐pseudomonal antibiotic versus placebo, outcome: 1.6 Mean change in FVC (% predicted).
Two trials had a duration of more than 12 months and measured the rate of decline of FVC % predicted (MacLusky 1989; Murphy 2004). In one trial (n = 27), the difference in rate of change of FVC % predicted per year significantly favoured antibiotics, MD 5.40 (95% CI 0.86 to 9.94) (Analysis 1.7) (MacLusky 1989). In the remaining trial (n = 181), it was reported that no difference was found between groups, but only 57% of participants in the Murphy trial had the minimum number of measurements for analysis (Murphy 2004).
Nathanson and Stead measured FVC in L (Nathanson 1985; Stead 1987). Nathanson (n = 7) reported no difference between groups at three months (end of trial) (Nathanson 1985). Stead (n = 18) used different antibiotics compared to placebo in a three‐arm cross‐over trial and values for FVC were higher during each of the four‐month active treatment arms than when taking placebo; results were significant for the combination of gentamicin and carbenicillin compared to placebo, but not for ceftazidime compared to placebo (Stead 1987). Hodson reported the mean FVC in mL over six months; this was higher during antibiotic treatment for 16 out of 17 participants, for seven of these participants the difference was significant (Hodson 1981).
Our GRADE analysis assessed the evidence for this outcome to be low (summary of findings Table for the main comparison).
2. Exacerbation of respiratory infection
a. Hospital admissions
Hospital admission was measured in six trials (n = 1008), but reported using different methods or scores (Chuchalin 2007; Day 1988; MacLusky 1989; Murphy 2004; Ramsey 1999; Stead 1987). Where possible, data have been entered into the analysis (Analysis 1.8).
Three trials (n = 946) reported data at over three months and up to 12 months (Chuchalin 2007; Murphy 2004; Ramsey 1999). When these were combined, data show a significantly lower risk of one or more hospital admissions for the antibiotic group, RR 0.66 (95% CI 0.47 to 0.93) (Analysis 1.8). This analysis showed heterogeneity between the three included trials (I² = 57 %), but they all favoured inhaled antibiotics compared to placebo. All three trials investigated the same drug (tobramycin) at the same dose (300 mg) in four‐week on‐off cycles with a jet nebuliser and air compressor. Severity of disease at baseline was greatest in the Ramsey trial which had a lower risk ratio for hospital admissions than the other two trials and this may be the cause of heterogeneity (Ramsey 1999). Two trials (n = 14) reporting hospital admission were cross‐over in design; one reported hospital admissions were "similar" (Day 1988) and the remaining trial (n = 18) reported that four out of five hospital admissions were during the four‐month placebo period (Stead 1987).
Neither of the longer trials reported significant results for the risk of one or more hospital admissions; in one trial (n = 181) at over 12 months and up to two years, RR 0.59 (95% CI 0.34 to 1.05) (Murphy 2004) and in the second (n = 27) at 32 months, RR 0.80 (95% CI 0.39 to 1.65) (MacLusky 1989) (Analysis 1.8).
We rated the quality of the evidence for this outcome in our GRADE analysis as low due to the risk of bias within the trials, particularly with regard to randomisation, allocation concealment and blinding (summary of findings Table for the main comparison).
b. Days in hospital
Four trials (n = 762) reported days in hospital in some form (Kun 1984; MacLusky 1989; Murphy 2004; Ramsey 1999), but only data from the longest trial (n = 28) could be analysed (MacLusky 1989). MacLuskey reported no significant difference between the antibiotic group (10.3 days) and the control group (13.5 days) at 32 months, MD ‐3.20 days (95% CI ‐9.04 to 2.64) (Analysis 1.9). Of the remaining trials, the largest trial (n = 520) reported that at six months the average number of days of hospitalisation in the treatment group was 5.1 and 8.1 in the control group (Ramsey 1999). In a two‐year cross‐over trial (n = 33), Kun reported fewer hospital inpatient days in the treatment group (15 days (range (0 to 68)) compared to the control group (26 days (range 0 to 92)) (Kun 1984). Murphy (n = 181) reported that the number of annualised days in hospital was similar for treatment (4.6 days per year) and control (4.5 days per year) groups (Murphy 2004).
Our GRADE analysis assessed the evidence for this outcome to be very low due to high or unclear risks of bias within the trials and inconsistency of outcome measurement.
c. Courses of intravenous antibiotics
Six trials (n = 1023) reported information relevant to this outcome (Chuchalin 2007; Hodson 1981; Kun 1984; Murphy 2004; Ramsey 1999; Wiesemann 1998), but only three (n = 940) provided data for the analysis (Chuchalin 2007; Murphy 2004; Ramsey 1999).
Four trials (n = 968) reported the frequency of courses of intravenous antibiotics during the trial (Chuchalin 2007; Hodson 1981; Murphy 2004; Ramsey 1999). Combined data at over three and up to 12 months from two of these trials (n = 765) significantly favoured inhaled antibiotics, RR 0.77 (95% CI 0.67 to 0.88) (Chuchalin 2007; Ramsey 1999) (Analysis 1.10). In contrast, data from one trial (n = 181) at over 12 months showed a non‐significant difference, RR of 0.62 (95% CI 0.35 to 1.08) (Murphy 2004) (Analysis 1.10).
The Hodson cross‐over trial (n = 20) reported that over six months the treatment group had three courses of antibiotics compared to seven in the control group (Hodson 1981).
Furthermore, one trial (n = 22) reported the need for intravenous antibiotics as the cause of withdrawal from the trial in two out of 11 participants using placebo (Wiesemann 1998). The final trial reporting on this outcome, provided an antibiotic score of uncertain validity which we have not presented here (Kun 1984).
GRADE analysis for this outcome showed the evidence to be very low due to risk of bias within the trials and inconsistency of results.
d. Pulmonary exacerbations
i. Frequency
One trial (n = 245) reported the frequency of pulmonary exacerbations, but did not give a definition of a pulmonary exacerbation used (Chuchalin 2007). After 24 weeks 39.8% of the tobramycin group and 51.2% of the control group had experienced at least one exacerbation; this result was not significant, RR 0.78 (95% CI 0.59 to 1.03) (Chuchalin 2007) (Analysis 1.11).
GRADE deemed the evidence to be very low due to the risk of bias within the trial and imprecision due to low participant numbers and only one trial measuring the outcome.
Secondary outcomes
1. Nutrition
b. Weight
Four trials (n = 460) reported an increase in weight with antibiotic treatment, but did not have results available for meta‐analysis (Chuchalin 2007; Day 1988; Murphy 2004; Stead 1987); two of these were of cross‐over design (Day 1988; Stead 1987). Murphy also reported that the control group gained weight as well and there were no between‐group differences (Murphy 2004).
Our GRADE analysis assessed the evidence for this outcome to be very low due to risk of bias being high / unclear in the underlying trials and there being no data available for meta‐analysis.
2. QoL
One trial (n = 245) reported significantly fewer lost school or working days in the tobramycin‐treated group than in the placebo control group, MD ‐5.30 (95% CI ‐8.59 to ‐2.01) (Analysis 1.12) (Chuchalin 2007). Murphy (n = 181) also reported on this outcome and found no difference between the treatment and control groups in the number of school days missed due to illness (Murphy 2004).
Our GRADE analysis assessed the evidence for this outcome to be low (summary of findings Table for the main comparison).
3. Survival
Four trials reported on this outcome (n = 828) (Chuchalin 2007; Kun 1984; MacLusky 1989; Ramsey 1999). Nine deaths were reported in three parallel‐group trials with 795 participants (Chuchalin 2007; MacLusky 1989; Ramsey 1999). There were no significant differences in two trials (n = 767) at over three and up to 12 months, RR 0.17 (95% CI 0.03 to 1.09) or in one trial (n = 27) at over 24 months and up to 36 months, RR 0.27 (95% CI 0.01 to 6.11) (Analysis 1.13). In addition, Kun reported two deaths in 33 participants from a cross‐over design trial. These deaths occurred at three and six months after changing from gentamicin to the saline mixture (Kun 1984).
Our GRADE analysis assessed the evidence for this outcome to be low, particularly due to low event rates (summary of findings Table for the main comparison).
4. Antibiotic resistance in P aeruginosa or other organisms
a. Antibiotic‐resistant P aeruginosa
Three parallel‐design trials (n = 795) measured the MIC of tobramycin for isolates of P aeruginosa (Chuchalin 2007; MacLusky 1989; Ramsey 1999). Chuchalin (n = 247) reported that the frequency of isolates of mucoid strains of P aeruginosa (about 60 % of all participants) having an MIC90 greater than 16 mcg/mL for tobramycin changed from 9.7% to 23.6% in the tobramycin group and from 17% to 18.2% in the control group after 24 weeks (Chuchalin 2007). However, the different baseline rate should be noted which may indicate that the change post‐treatment may not be attributable to the treatment. Ramsey (n = 520) reported that the proportion of isolates of P aeruginosa resistant to tobramycin increased from 13% to 23% in the tobramycin group and decreased from 10% to 8% in the control group between Week 0 and Week 24 of the trial; the RR for frequency of tobramycin resistance at end of trial was significant, RR 2.93 (95% CI 1.75 to 4.91) (Burns 1999; Ramsey 1999). When combined for the time‐point over three months and up to 12 months, while these data (n = 672) favoured the control group they did not show a significant result, RR 1.95 (95% CI 0.86 to 4.42) (Analysis 1.14). The I² value showed that there was moderate heterogeneity between these two trials (I² = 79 % ) with the Ramsey trial having a higher frequency of tobramycin resistant P aeruginosa at 12 months (Ramsey 1999). Both the Chuchalin trial and the Ramsey trial studied tobramycin at the same dose and regimen. The only difference and possible cause of the heterogeneity was that disease severity was greater in the Ramsey trial at baseline (Chuchalin 2007; Ramsey 1999). MacLusky (n = 26) reported that in the first 24 months of the trial, four out of 14 participants (28.5%) in the tobramycin group and in none of the 12 participants in the control group became resistant, i.e. an MIC greater than 16 mcg/mL, RR 7.80 (95% CI 0.46 to 131.62) (MacLusky 1989).
Interpretation of data for this outcome is difficult in the four trials (n = 78) using a cross‐over design, two of which used combinations of drugs (Hodson 1981; Kun 1984; Nathanson 1985; Stead 1987). In one trial, gentamicin resistance developed in three out of 25 participants during the treatment with gentamicin and in two out of 25 participants during treatment with placebo (Kun 1984). There was no information on gentamicin resistance in two trials (n = 27) (Hodson 1981; Nathanson 1985). Furthermore, Hodson (n = 20) reported only transient resistance to carbenicillin in two out of 17 participants (Hodson 1981). Stead reported partial resistance to ceftazidime in one out of 13 participants and to carbenicillin in two out of 13 participants (Stead 1987).
Our GRADE analysis assessed the evidence for this outcome to be moderate (summary of findings Table for the main comparison).
b. Other organisms
Data on B cepacia isolation were reported by two parallel trials of six and 32 months (n = 548) (MacLusky 1989; Ramsey 1999). No significant differences between treatment arms were found, RR 0.26 (95% CI 0.03 to 1.99) (Analysis 1.15). A subsequent report on the Ramsey trial indicated there were intermittent isolates of B cepacia (two in the tobramycin group and three in the placebo group), but none of the isolates of B cepacia were persistent, i.e. not present on all three sputum specimens during the six‐month trial (Burns 1999).
Persistent isolates of Stenotrophomonas maltophilia (S maltophilia) and Alcaligenes xylosoxidans (A xylosoxidans) were also uncommon, although intermittent isolates were more frequent in the Ramsey trial (n = 520) that reported this detail, RR 3.05 (95% CI 0.32 to 29.10) and RR 1.02 (95% CI 0.06 to 16.15), respectively (Burns 1999) (Analysis 1.15). Intermittent isolates in tobramycin and placebo groups for S maltophilia were 14.7% and 21.8% respectively and for A xylosoxidans were 7.4% and 9.2% respectively. For treatment‐emergent Aspergillus species there was a significant difference in favour of placebo (n = 389), RR 2.12 (95% CI 1.29 to 3.46) (Burns 1999) (Analysis 1.15).
No difference in isolation of new pathogens were found in trials using tobramycin (n = 767) (Chuchalin 2007; Ramsey 1999) or colistin (n = 40) (Jensen 1987).
Four cross‐over design trials (n = 78) reported that sputum was cultured during the trial (Hodson 1981; Kun 1984; Nathanson 1985; Stead 1987). There is little information on results other than a statement that no new pathogens were isolated during the trial.
5. Adverse events
a. Renal impairment
Four trials (n = 976) measured renal function (serum creatinine), but no data were available for meta‐analysis. They found no significant evidence of persistent renal impairment (Chuchalin 2007; MacLusky 1989; Murphy 2004; Ramsey 1999). In the largest trial (n = 520), nine people in both the tobramycin group (300 mg twice daily) and the placebo group had transient increases of 50% or more in the creatinine level (Ramsey 1999). Chuchalin (n = 247) reported that median creatinine levels in the tobramycin and placebo groups were similar both at baseline and at the end of the trial (Chuchalin 2007).
b. Auditory impairment
Five trials (n = 996) measured audiometry (Chuchalin 2007; Hodson 1981; MacLusky 1989; Murphy 2004; Ramsey 1999); and four (n = 968) stated that no abnormality was found (Chuchalin 2007; Hodson 1981; Murphy 2004; Ramsey 1999). MacLusky found a change in hearing in one participant which was a conductive loss attributed to auditory polyp and not related to the study drug (treatment group not stated); it was further stated that no significant ototoxicity was seen in either group (MacLusky 1989) (Analysis 1.16).
Ramsey reported tinnitus more frequently in the tobramycin‐treated group (8 out of 258) than in the placebo group (0 out of 262), RR 17.26 (95% CI 1.00 to 297.54) (Ramsey 1999).
c. Bronchospasm
One trial (n = 520) measured FEV1 response to an inhalation of the nebulised solutions, at first dose and at Week 20 (Ramsey 1999). In both groups, the median FEV1 fell 30 minutes after the first dose, tobramycin ‐1.8% (range ‐34.4 to 22.1) and placebo ‐2.6% (range ‐43.6 to 34.1); results at Week 20 were similar (Ramsey 1999). MacLusky (n = 28) reported that three participants complained of dyspnoea after inhaling tobramycin, but had a negative challenge and continued the trial (MacLusky 1989). Stead (n = 18) reported one participant with transient chest tightness with gentamicin (Stead 1987).
d. Other
There was a significant increase in voice alteration in two trials using tobramycin 300 mg twice daily (n = 701), RR 2.66 (95% CI 1.14 to 6.25) (Analysis 1.16) (Murphy 2004; Ramsey 1999).
The best estimate of the risk of pneumothorax was from five episodes in 520 participants, RR 0.25 (95% CI 0.03 to 2.26), favouring tobramycin (Ramsey 1999). Two other cross‐over trials (n = 38) reported an episode of pneumothorax (Hodson 1981; Stead 1987). Hodson reported that the participant was in the third arm of the trial and receiving ceftazidime when the pneumothorax developed (Hodson 1981); and Stead did not specify which treatment arm the participant was in when this occurred (Stead 1987).
In one trial (n = 520) the risk for haemoptysis with tobramycin was reported as RR of 0.87 (95% CI 0.66 to 1.13), but this was not significant (Analysis 1.16) (Ramsey 1999).
Murphy (n = 181) recorded the incidence of several adverse events which was significantly lower in the antibiotic group compared to the placebo group (Murphy 2004):
| Adverse event | Antibiotic Group | Placebo Group |
| Aggravated cough | 35.2% | 64.4% |
| Cough | 40.7% | 53.3% |
| Pyrexia | 26.4% | 46.7% |
| Nasal congestion | 22.0% | 36.7% |
| Pharyngytis | 17.6% | 28.9% |
| Rhinorrhea | 14.3% | 26.7% |
| Increased sputum | 4.4% | 18.9% |
However, two participants were withdrawn from the trial due to treatment‐emergent adverse events (cough in one participant and cough, sneeze and sore throat in the second); a further six participants had the tobramycin dosing interrupted and in three of these the adverse events were considered treatment‐related (Murphy 2004).
Our GRADE analysis assessed the evidence for this outcome to be very low due to risk of bias within individual trials and low event rates (summary of findings Table for the main comparison).
Individual anti‐pseudomonal drugs versus placebo
There was no subgroup analysis by any of the individual drugs or combinations because of the small number of trials, different duration of these trials, different methods of expressing results of outcomes and absence of variance in results.
Inhaled anti‐pseudomonal antibiotics compared
Colistimethate sodium dry powder for inhalation versus tobramycin for inhalation solution (TOBI®)
One six‐month parallel trial (n = 380) compared colistimethate sodium dry powder for inhalation (Colobreathe®) (one capsule of 1.6625 MU (125 mg) twice daily) to TIS (300 mg per 5 mL twice daily) (Schuster 2013). The paper reported that the data were not normally distributed and results were evaluated using log‐transformation analysis; we therefore present the results directly reported from the original paper (Schuster 2013).
Primary outcome
1. Lung function
a. FEV1
Schuster observed a mean change from baseline to Week 24 in FEV1 % predicted of 0.964 in the Colobreathe® group and 0.986 in the TIS group. Using the last observation carried forward (LOCF) for the ITT population, Schuster reported the adjusted MD between the groups for the change in FEV1 % predicted, MD ‐0.98% (95% CI‐2.74% to 0.86%). The online supplement also presented mean (SD) data for baseline and end of trial for FEV1 L; however, due to its limitations we are not able to calculate and present any results for the change in FEV1 L. The data show equally small decreases in FEV1 L for both the Colobreathe® and the TIS groups (Schuster 2013).
Our GRADE analysis assessed the evidence for this outcome to be low (summary of findings Table 2).
b. FVC
Schuster reported a non‐significant difference for FVC at 24 weeks in the ITT population (LOCF), MD 0.01 L (95% CI ‐0.09 to 0.10). Again, the online supplement presented absolute baseline and end of treatment data for FVC L and showed even smaller changes than for FEV1 L (Schuster 2013).
Our GRADE analysis assessed the evidence for this outcome to be low (summary of findings Table 2).
2. Exacerbation of respiratory infection
c. Courses of intravenous antibiotics
Schuster reported the number of additional anti‐pseudomonal antibiotics used, but not specifically if theses were intravenous. In the ITT population, the mean duration of additional anti‐pseudomonal antibiotic use was 13.6 days in the Colobreathe® group compared to 14.4 days in the TIS group (Schuster 2013).
d. Pulmonary exacerbations
i. Frequency
Schuster reported that 57 out of 183 participants in the Colobreathe® group and 50 out of 191 participants in the TIS group experienced a PDE (Schuster 2013). When analysed this was not significant, RR 1.19 (95% CI 0.86 to 1.64) (Analysis 2.1).
ii. Time to fist recorded exacerbation
Schuster also provided data for the mean time in days until the first PDE which favoured Colobreathe® but was not significant, MD 6.21 (95% CI ‐11.70 to 24.12) (Analysis 2.2).
Our GRADE analysis assessed the evidence for this outcome to be moderate (summary of findings Table 2).
Secondary outcomes
1. Nutrition
Schuster reported that there were no relevant changes in weight, BMI or growth in either group (Schuster 2013).
Our GRADE analysis assessed the evidence for this outcome to be very low due to unclear risk of bias within the trial and imprecision from small numbers.
2. QoL
While the trial was not powered to detect differences in overall QoL, there were no statistically significant treatment differences for the change in overall QoL scores using the CFQ‐R, although the adjusted mean changes at the end of the trial favoured the Colobreathe® group in terms of treatment burden (P = 0.091). This difference was significant at Week 4 (P < 0.001; figure 4 in paper). Data for the individual domains are reported in supplementary tables of the trial report (Schuster 2013).
Our GRADE analysis assessed the evidence for this outcome to be low (summary of findings Table 2).
3. Survival
Schuster reported that there were no deaths (out of 183 participants) in the Colobreathe® group and two deaths (out of 191 participants) in the TIS group (Schuster 2013), RR 0.21 (95% CI 0.01 to 4.32) (Analysis 2.3).
Our GRADE analysis assessed the evidence for this outcome to be low (summary of findings Table 2).
4. Antibiotic resistance in P aeruginosa and other organisms
a. Antibiotic‐resistant P aeruginosa
The supplementary data from the Schuster trial presented values for the mean MIC50 and MIC90 values of respiratory isolates of P aeruginosa in the ITT population at monthly intervals from baseline to the end of the trial. No SDs were reported and we have calculated the changed data for each group from the data presented, but are not able to enter these data in the analysis. The mean MIC50 (breakpoint of ≥ 8 mg/L) changed in the Colobreathe® group by 0.0 compared to 0.5 in the TIS group. The mean MIC90 (breakpoint of ≥ 8 mg/L) changed in the both groups by 4.0 (Schuster 2013).
Our GRADE analysis assessed the evidence for this outcome to be low (summary of findings Table 2).
5. Adverse events
The analysis of the adverse event data presented by Schuster in the supplementary data tables showed that there was no significant difference in the risk of experiencing any adverse event, RR 1.06 (95% CI 0.99 to 1.12), there was a significantly higher risk of a treatment‐related adverse event in the Colobreathe® group, RR 1.76 (95% CI 1.50 to 2.08) Analysis 2.4).
Schuster also reported adverse events by severity; mild adverse events were most common and there was no significant difference in risk between the groups, RR 1.00 (95% CI 0.92 to 1.09). However, the risks of moderate or severe adverse events were significantly higher in the Colobreathe® group, RR 1.32 (95% CI 1.11 to 1.57) and RR 3.83 (95% CI 2.15 to 6.83) (Analysis 2.4). Most adverse events (2302 out of 2426 (95%)) were mild to moderate and the majority resolved without sequelae. The incidence of treatment‐related adverse events was higher in the Colobreathe® group, 153 out of 186 participants (82.3%) compared with 90 out of 193 participants (46.6%); and discontinuations where the primary cause was an adverse event were also higher in this group (18 out of 186 participants (9.7%) compared with 3 out of 193 participants (1.6%)). A further six participants mentioned adverse events as a reason for discontinuation, but not as the main reason. Severe adverse events were higher in the TIS group (6.2% participants compared with 4.3% participants) (Schuster 2013).
| Most frequent adverse events by preferred term (≥ 5% of total number of events) | Colobreathe® | TIS | Total |
| Participants experiencing an adverse event | 175 (93.6) | 172 (89.1) | 347 (91.3) |
| Participants experiencing a treatment‐related adverse event | 153 (81.8) | 90 (46.6) | 243 (63.9) |
| Withdrawals due to an adverse event | 22 (11.8) | 5 (2.6) | 27 (7.1) |
| Severity: mild | 159 (85.0) | 165 (85.5) | 324 (85.3) |
| Severity: moderate | 123 (65.8) | 97 (50.3) | 220 (57.9) |
| Severity: severe | 48 (25.7) | 13 (6.7) | 61 (16.1) |
| Total number of adverse events | 1232 | 1194 | 2426 |
| Cough | 193 (15.7) | 123 (10.3) | 316 (13.0) |
| Abnormal taste | 132 (10.7) | 62 (5.2) | 194 (8.0) |
| Dyspnoea | 81 (6.6) | 98 (8.2) | 179 (7.4) |
| Lower respiratory tract infection | 79 (6.4) | 85 (7.1) | 164 (6.8) |
| Throat irritation | 94 (7.6) | 63 (5.3) | 157 (6.5) |
| Productive cough | 62 (5.0) | 76 (6.4) | 138 (5.7) |
Data presented as n (%), safety population.
*One participant was randomised but received no treatment.
c. Sensitivity reactions
Schuster reported the number of adverse events rather than the number of participants experiencing each type of event for cough, productive cough and throat irritation, which precluded the analysis of the data here. Incidences of cough and throat irritation were more common in the Colobreathe® group than the TIS group, 193 versus 123 and 94 versus 63 respectively. However, there were more incidences of productive cough reported in the TIS group (76) compared to the Colobreathe® group (62) (Schuster 2013).
d. Other
Schuster also reported a fewer reports of abnormal taste in the TIS group (62) compared to the Colobreathe® group (132). However, there were more reports of dyspnoea and lower respiratory tract infections in the TIS group compared to the Colobreathe® group, 98 versus 81 and 85 versus 79 respectively. Haemoptysis was below the 5% reporting level, but was reported by more participants receiving Colobreathe® (10.7%) than TIS (6.7%) (Schuster 2013).
Our GRADE analysis assessed the evidence for this outcome to be low due to low event rates and risk of bias (summary of findings Table 2).
Inhaled tobramycin (intravenous preparation) versus tobramycin for inhalation solution (TOBI®)
One cross‐over trial with 32 participants compared continuous twice‐daily 80 mg inhaled tobramycin (intravenous‐preparation) for three months to intermittent (four‐weekly on‐off cycles) twice‐daily 300 mg/5 mL TIS for three months (Nikolaizik 2008). The Nikolaizik paper reported on FEV1 % predicted, FVC % predicted, participant preference and oxygen saturation and the results from the published papers showed some variation, so we contacted the trial investigators for clarification. They have kindly provided individual participant data for lung function and we have analysed the first‐period data ourselves using the generic inverse variance method in RevMan (RevMan 2014).
Primary outcome
1. Lung function
a. FEV1
Analysis of the data provided by the trial investigators showed a non‐significant difference in FEV1 % predicted between the groups, MD ‐1.07 (95% CI ‐11.20 to 9.06) (Analysis 3.1).
b. FVC
Analysis of the data provided by the trial investigators showed no statistically significant difference in FVC % predicted between the groups, MD 0.01 (95% CI ‐9.48 to 9.50) (Analysis 3.2).
Our GRADE analysis assessed the evidence for both these outcomes to be very low and was downgraded twice due to risk of bias and once due to imprecision (small sample size) (summary of findings Table 3).
Tobramycin inhalation powder versus tobramycin for inhalation solution (TOBI®)
One large parallel trial (n = 553) compared tobramycin inhalation powder (TIP) (a total of 112 mg, four capsules) to 300 mg/5 mL TIS, both given twice daily (Konstan 2010b).
Primary outcome
1. Lung function
a. FEV1
Konstan reported the relative change in FEV1 % predicted between baseline and Day 28 of the third treatment cycle. When analysed data showed a non‐significant difference between treatments, MD 1.10 (95% CI ‐2.33 to 4.53) (Analysis 4.1).
Our GRADE analysis assessed the evidence for this outcome to be moderate (summary of findings Table 4).
2. Exacerbation of respiratory infection
a. Hospital admissions
Konstan reported that the number of participants hospitalised for respiratory‐related events was similar between groups (Konstan 2010b); 24.4% in the TIP group and 22.0% in the TIS group, RR 1.11 (95% CI 0.80 to 1.53) (Analysis 4.2).
c. Courses of intravenous antibiotics
Konstan reported the number of participants requiring additional anti‐pseudomonal antibiotics was significantly higher in the TIP group (64.9%) compared to the TIS group (54.5%) (P = 0.0148) although the average number of days of usage was less in the TIP group (Konstan 2010b). It was not explicitly stated how these additional antibiotics were administered, except to say that most were oral and were used in 55.5% and 39.7% of participants in the TIP and TIS groups, respectively; also, that the percentage of participants receiving intravenous anti‐pseudomonal antibiotics was well‐matched across groups.
d. Pulmonary exacerbations
i. Frequency
Konstan stated that lung disorders presented in the table of adverse events were generally reported as pulmonary exacerbations (Konstan 2010b); when analysed the difference between groups was not significant, RR 1.12 (95% CI 0.86 to 1.45) (Analysis 4.3).
Konstan reported that 31.1% of participants in the TIP group and 30.4% of participants in the TIS group experienced a pulmonary exacerbation (Konstan 2010b).
Our GRADE analysis assessed the evidence for this outcome to be moderate (summary of findings Table 4).
Secondary outcomes
3. Survival
Konstan reported that there were three deaths in the TIP group and no deaths in the TIS group, RR 4.76 (95% CI 0.25 to 91.62) (Analysis 4.4).
Our GRADE analysis assessed the evidence for this outcome to be low (summary of findings Table 4).
4. Antibiotic resistance
Konstan reported that sputum densities showed a decrease from baseline in both groups at all time points. Mean change at the end of 24 weeks in P aeruginosa sputum density was ‐1.6 log10 CFU/g in the TIP group versus ‐0.92 log10 CFU/g in the TIS group (mucoid phenotype), and ‐1.77 log10 CFU/g in the TIP group versus ‐0.73 log10 CFU/g in the TIS group (non‐mucoid phenotype) (Konstan 2010b)
On day 28 of the last cycle of treatment (24 weeks), 11.6 % of TIP participants and 9.9 % of TIS participants had negative P aeruginosa cultures.
Our GRADE analysis assessed the evidence for this outcome to be moderate (summary of findings Table 4).
5. Adverse events
Konstan reported the rates for any adverse event were 90.3% in the TIP group and 84.2% in the TIS group, most of which were mild or moderate. The proportion of participants experiencing adverse events was highest in the first cycle and decreased successively with each following cycle (Konstan 2010b).
a. Renal impairment
Konstan stated there were few reports of changes in renal function and the reported incidence of renal and urinary disorders was less than 1% in both groups (Konstan 2010b).
b. Auditory impairment
Audiology was only performed in a subgroup of participants (78 out of 308 in the TIP group and 45 out of 209 in the TIS group); 20 participants (25.6%) in the TIP group experienced a decrease from baseline at any visit compared to seven participants (15.6%) in the TIS group and the decrease was of a similar magnitude in both groups (Konstan 2010b).
c. Sensitivity reactions ‐ bronchospasm
Konstan reported incidences of clinically significant bronchospasm (defined as a decrease of at least 20% in FEV1 % predicted from pre‐dose to 30 minutes post‐dose) in 16 participants (5.2%) in the TIP group and 11 participants (5.3%) in the TIS group (Konstan 2010b).
d. Other
Konstan reported a range of adverse events, but only two showed significant differences between groups (both in favour of the TIS group): cough, RR 1.56 (95% CI 1.23 to 1.96); and hoarseness, RR 3.56 (95% CI 1.71 to 7.43) (Analysis 4.5).
Our GRADE analysis assessed the evidence for this outcome to be moderate (summary of findings Table 4).
Aztreonam lysine versus tobramycin for inhalation solution (TOBI®)
One parallel trial (n = 273, 268 included in analysis) compared AZLI 75 mg three times daily to TIS 300 mg twice daily in three consecutive cycles of four weeks on and four weeks off treatment (Assael 2013).
Primary outcomes
1. Lung function
a. FEV1
Assael reported the mean relative change from baseline in FEV1 % predicted at Week 24 (end of the third cycle) (Assael 2013). The data provided at Week 24 are an average across the three cycles and significantly favour AZLI, MD ‐3.40 (95% CI ‐6.63 to ‐0.17) (Analysis 5.1). Assael reported that the mean relative change across three cycles was MD 3.4%, P = 0.02 (Assael 2013).
Assael also reported the mean actual change from baseline averaged across the three cycles; our analysis shows a significant difference in favour of AZLI at Week 24, MD 2.71 (95% CI 0.76 to 4.66) (Analysis 5.2), which is similar to the report in the paper (MD 2.70% (95% CI 0.98 to 4.43) (P = 0.002)); the slight discrepancies may be due to the fact that we calculated the SD from the SE presented in the original paper to allow us to enter the data into RevMan.
Our GRADE analysis assessed the evidence for this outcome to be moderate (summary of findings Table 5).
2. Exacerbation of respiratory infection
a. Hospital admissions
Assael reported that 84 out of 136 participants (61.76%) in the AZLI group and 121 out of 132 participants (91.67%) in the TIS group experienced a respiratory event (not defined) (Assael 2013). There were 40 hospitalisations due to respiratory events among the 136 participants in the AZLI group compared to 58 hospitalisations among the 132 participants in the TIS group (P = 0.044); however, it is not clear from the original paper if these data refer to total hospitalisations or number of participants who were hospitalised, therefore we do not present these data in the analysis.
c. Courses of intravenous antibiotics
Assael did report the number of participants requiring additional antibiotics (intravenous or inhaled, or both) for each group. When the data are analysed, the risk of requiring additional antibiotics was significantly lower in the AZLI group, RR 0.66 (95% CI 0.51 to 0.86) (Analysis 5.3). Assael further reported the mean number of days of additional antibiotics which was significantly lower for the AZLI group, MD ‐7.10 (95% CI ‐13.90 to ‐0.30) (Analysis 5.4).
Our GRADE analysis assessed the evidence for this outcome to be moderate (summary of findings Table 5).
Secondary outcomes
1. Nutrition
b. Weight
At Week 24, Assael reported the mean (SE) relative change in weight from baseline for each group; 0.58% (0.41) in the AZLI group and 0.06% (0.43) in the TIS group. Our analysis of the data showed a non‐significant difference between groups, MD 0.52 (95% CI ‐0.64 to 1.68) (Analysis 5.5).
Our GRADE analysis deemed the evidence from this trial to be of moderate quality, downgraded once due to some risk of bias within the trial.
2. QoL
Assael reported the mean (SE) change from baseline in CFQ‐R respiratory symptom scale at the end of the trial (average across three cycles of treatment) for each group (Assael 2013). The change was greater in the AZLI group at the end of the trial, but this did not reach statistical significance, MD 4.10 (95% CI ‐0.06 to 8.26) (Analysis 5.6).
Assael also used the Treatment Satisfaction Questionnaire for Medication (TSQM) and reported on the domains of effectiveness, side effects, convenience and global satisfaction at Week 24 (Assael 2013). Results for effectiveness and global satisfaction significantly favoured AZLI: effectiveness, MD 15.50 (95% CI 8.84 to 22.16) (Analysis 5.7); global satisfaction, MD 14.10 (95% CI 0.93 to 27.27) (Analysis 5.8). However, for the remaining domains of side effects and convenience the results showed no significant difference between treatments: side effects, MD 1.80 (95% CI ‐2.77 to 6.37) (Analysis 5.9); convenience MD 1.90 (95% CI ‐4.48 to 8.28) (Analysis 5.10).
Our GRADE analysis assessed the evidence for this outcome to be moderate (summary of findings Table 5).
3. Survival
Assael reported that two participants died due to complications of CF disease, both were considered unrelated to treatment and the treatment group was not specified (Assael 2013).
Our GRADE analysis assessed the evidence for this outcome to be low (summary of findings Table 5).
4. Antibiotic resistance in P aeruginosa or other organisms
Assael reported on the change from baseline in P aeruginosa in sputum (CFU/g) at Week 24 (Assael 2013). Results were not significant MD ‐0.23 (95% CI ‐0.76 to 0.30) (Analysis 5.11).
Our GRADE analysis assessed the evidence for this outcome to be moderate (summary of findings Table 5).
5. Adverse events
Assael reported significantly more treatment‐related adverse events in the AZLI group compared to the TIS group, RR 1.77 (95% CI 1.03 to 3.04) and more serious adverse events in the AZLI group, although this result was not statistically significant. There were no significant differences between the groups for other adverse events (Analysis 5.12).
Our GRADE analysis assessed the evidence for this outcome to be moderate (summary of findings Table 5).
Liposomal amikacin for inhalation (Arikace™) versus tobramycin for inhalation solution (TOBI®)
One parallel trial (n = 302) compared LAI 590 mg once daily to TIS 300 mg twice daily; to date this trial has only been presented in abstract form and available data are limited (Bilton 2014).
Primary outcomes
1. Lung function
a. FEV1
The abstract states that the primary endpoint was reached and LAI was found to be non‐inferior to TIS with respect to the relative change from baseline to the end of the trial in FEV1 % predicted (LS mean difference (LAI ‐ TIS), adjusted for treatment and randomisation strata, at day 168 –1.31% (95% CI, –4.95 to 2.34; P = 0.4809)). The lower bound of the 95% CI was above –5%, indicating non‐inferiority of LAI to TOBI® (Bilton 2014).
Our GRADE analysis assessed the evidence for this outcome to be low (summary of findings Table 6).
Secondary outcomes
2. QoL
Respiratory symptoms,treatment burden and health scales were measured by the CFQ‐R. Bilton reported that minimally important differences (≥ 4 points) on the CFQ‐R Respiratory symptoms scale were seen after each treatment cycle with LAI but only after the first cycle of TIS. Mean increase from baseline at day 140 (end of trial) was 4.94 for LAI which is greater than the four points which show minimally important difference but only 2.13 for TIS. A comparison of 'on treatment' versus 'off treatment' demonstrated that the mean (SE) effects were significantly greater for LAI for respiratory symptoms (2.80 (1.25); P = 0.03)), treatment burden (2.53 (0.97); P < 0.01)) and health scales (2.47 (1.23); P = 0.05)) (Bilton 2014).
Our GRADE analysis assessed the evidence for this outcome to be low (summary of findings Table 6).
4. Antibiotic resistance to P aeruginosa or other organisms
The mean difference between LAI and TOBI with regard to reduction in sputum density of P aeruginosa was not found to be significant (P = 0.13) (Bilton 2014).
Our GRADE analysis assessed the evidence for this outcome to be low (summary of findings Table 6).
5. Adverse events
In the LAI group, 84% of participants experienced at least one treatment emergent‐adverse event, whilst 78.8 % of the TIS group experienced at least one treatment‐emergent adverse event. Serious adverse events were experienced by 17.6 % of LAI participants and 19.9 % of TOBI participants (Bilton 2014).
Our GRADE analysis assessed the evidence for this outcome to be low (summary of findings Table 6).
Levofloxacin for inhalation solution versus tobramycin for inhalation solution (TOBI®)
One trial (n = 282) compared LIS to TIS (Elborn 2015).
Primary outcomes
1. Lung function
a. FEV1
Elborn reported means and SDs for both the absolute and the relative changes in FEV1 % predicted from baseline at up to three months and up to six months (Elborn 2015). Our analysis of the data showed no significant difference in the absolute change in FEV1 % predicted either at up to three months, MD 1.50 (95% CI ‐0.20 to 3.20) or up to six months, MD 0.70 (95% CI ‐0.85 to 2.25) (Analysis 6.1). This was also true for the relative change at both time points; at up to three months, MD 2.70 (95% CI ‐0.74 to 6.14) and at up to six months, MD 0.30 (95% CI ‐3.02 to 3.62) (Analysis 6.2).
Our GRADE analysis assessed the evidence for this outcome to be high (summary of findings Table 7).
b. FVC
Elborn also reported means and SDs for both the absolute and the relative changes in FVC % predicted from baseline at up to three months and up to six months (Elborn 2015). At three months (after two four‐week periods of the active treatment with four weeks off treatment in between) there was a significant absolute change in FVC in favour of LIS, MD 2.60 (95% CI 0.77 to 4.43), but this was not maintained at the six‐month time point, MD ‐0.10 (95% CI ‐1.91 to 1.71) (Analysis 6.3). Similarly there was a significant difference in the relative change in FVC % predicted at three months favouring LIS, MD 3.50 (95% CI 0.92 to 6.08), which again was not maintained to the end of the trial, MD 0.60 (95% CI ‐2.23 to 3.43) (Analysis 6.4).
Our GRADE analysis assessed the evidence for this outcome to be high (summary of findings Table 7).
2. Exacerbation of respiratory infection
a. Hospital admissions
Elborn reported that 17.5% of participants in the LIS group were hospitalised compared to 28% of participants in the TIS group (Elborn 2015). When analysed there was a significantly lower risk of hospitalisation due to respiratory infection in the LIS group, RR 0.62 (95% CI 0.40 to 0.98) (Analysis 6.5).
Our GRADE analysis assessed the evidence for this outcome to be high (summary of findings Table 7).
Secondary outcomes
1. Nutrition
b. Weight
Elborn reported the incidence of weight loss as an adverse event (Elborn 2015). There was no difference found between the two groups, RR 0.78 (95% CI 0.56 to 1.09) (Analysis 6.6).
Our GRADE analysis for this outcome assessed the evidence to be high quality.
2. QoL
Elborn did not provide data we were able to analyse, but reported that scores in the respiratory domain of the CFQ‐R were similar at baseline; at Day 28 they increased in the LIS group and decreased in the TIS group (difference in least squares means was 3.9 units, P = 0.05), but results were again similar by the end of the trial (Elborn 2015).
Our GRADE analysis for this outcome assessed the evidence to be low quality.
4. Antibiotic resistance in P aeruginosa or other organisms
Data showed that no difference between groups for the change in P aeruginosa sputum density (log10 CFU/g) at up to six months, MD 0.12 (95% CI ‐0.31 to 0.55) (Analysis 6.7). Least squares mean difference was reported to be 0.44 log 10 CFU/g; 95% CI ‐0.01 to 0.88) (Elborn 2015).
Elborn also reported that the proportion of participants experiencing a greater than four‐fold increase in the levofloxacin MIC of their most levofloxacin‐resistant P aeruginosa isolate was similar in both groups (21% for LIS compared to 17% for TIS; P = 0.5). Investigators did not observe the significant emergence of other pathogens in either treatment group (Elborn 2015).
Our GRADE analysis assessed the evidence for this outcome to be high (summary of findings Table 7).
5. Adverse events
Adverse event data are presented in the analysis (Analysis 6.8). No data were reported for renal or auditory impairment.
d. Other
There were significantly fewer participants in the LIS group who reported: epistaxis, RR 0.20 (95% CI 0.04 to 1.00)); general malaise, RR 0.10 (95% CI 0.01 to 0.83); and increased blood glucose, RR 0.28 (95% CI 0.08 to 0.94). Significantly more participants in the LIS group reported dysgeusia, RR 46.25 (95% CI 2.88 to 741.95). None of the other reported adverse events showed differences between the groups (Analysis 6.8).
Our GRADE analysis assessed the evidence for this outcome to be high (summary of findings Table 7).
Ceftazidime versus combined gentamicin and carbenicillin
We have not produced a summary of findings table for this comparison as combined gentamicin and carbenicillin are no longer in use. One trial reported on this comparison (n = 18) (Stead 1987).
Primary outcome
1. Lung function
This outcome was reported narratively as part of the three‐arm cross‐over trial that looked at this combination of antibiotics. Lung function was stated to be similar in both groups at the end of treatment (Stead 1987).
Secondary outcomes
1. Nutrition
b. Weight
Weight was stated to be similar in both groups at the end of treatment (Stead 1987).
Continuous inhaled anti‐pseudomonal antibiotics versus intermittent inhaled anti‐pseudomonal antibiotics compared
One 28‐week parallel trial (n = 90) compared a continuous antibiotic regimen (three cycles) of 28 days AZLI (75 mg three times daily) followed by 28 days TIS (300 mg twice daily) to an intermittent antibiotic regimen (three cycles) of 28 days of placebo (three times daily) followed by 28 days TIS (300 mg twice daily) (Flume 2016b).
Primary outcome
1. Lung function
a. FEV1
Values from the end of each treatment cycle (end of weeks four, 12 and 20) were averaged and the adjusted mean change from baseline was presented. The mean change in FEV1 % predicted was greater in the group that received AZLI alternating with TIS than the group that received placebo alternating with TIS, 1.37 (SE 0.67) versus 0.04 (SE 0.66). However, analysis showed that the difference between the groups was not significant, MD 1.33 (95% CI ‐0.51 to 3.17) (Analysis 7.1).
Our GRADE analysis assessed the evidence for this outcome to be low (summary of findings Table 8).
2. Exacerbation of respiratory infection
a. Hospital admissions
The rate of hospitalisations was reported to be higher in the placebo/TIS group (1.62 per participant year) than in the AZLI/TIS group (1.04 per participant year), but the reported difference between groups was not significant, RR 0.642 (95% CI 0.36 to 1.16) (P = 0.14) (Flume 2016b). We have entered the RR and CIs into our analysis (Analysis 7.2).
c. Courses of intravenous antibiotics
Flume reported the number of participants needing additional antibiotics during the trial, but included intravenous or inhaled antibiotics, or both. A larger percentage of participants in the placebo/TIS group (n = 26/47 (55.3%)) required non‐study antibiotics for exacerbations during the comparison phase than those in the AZLI/TIS group (n = 21/43 (48.8%)) but this was not significant, RR 0.88 (95% CI 0.59 to 1.32) (Analysis 7.3).
d. Pulmonary exacerbations
i. Frequency
The rate of PDEs was the primary outcome in the Flume trial and investigators found that the rate was lower in the AZLI/TIS group (1.31 PDEs per participant‐year) than in the placebo/TIS group (1.76 PDEs per participant year) (Flume 2016b). However, the difference between the groups was not reported to be significant, RR 0.74 (95% CI 0.45 to 1.24) (P = 0.25) (Flume 2016b); we have entered this result into our analysis (Analysis 7.4).
Our GRADE analysis assessed the evidence for this outcome to be low (summary of findings Table 8).
Secondary outcomes
1. Nutrition
b. Weight
A decrease in weight was recorded as an adverse event (see adverse events) (Flume 2016b).
2. QoL
Flume reported the change in adjusted mean CFQ‐R RSS scores from baseline for the continuous AZLI/TIS group and the placebo/TIS group using an average from weeks four, 12 and 20. Whilst the scores improved 1.00 (SE 1.74) in the AZLI/TIS group, they decreased ‐2.06 (SE 1.63) in the placebo/TIS group. When we entered this into our analysis, the difference between the groups was not found to be significant, MD 3.06 (95% CI ‐1.61 to 7.73) (Analysis 7.5).
Our GRADE analysis assessed the evidence for this outcome to be low (summary of findings Table 8).
4. Antibiotic resistance in P aeruginosa or other organisms
a. Antibiotic‐resistant P aeruginosa
We were not able to enter data for this outcome into our analysis, but the authors state that the adjusted mean changes from baseline sputum P aeruginosa density after each course of inhaled treatment (AZLI or placebo or TIS) during the comparative phase were small (0.36 to ‐0.55 log10 CFU/g) and that differences between treatment groups were not statistically significant (Flume 2016b). The authors also reported that the MIC50 values for P aeruginosa isolates changed at least two‐fold from baseline for both treatment groups (Flume 2016b).
b. Other organisms
Flume reported the incidence of other organisms during the comparative phase of the trial although and found no difference between treatment groups (Analysis 7.6).
Our GRADE analysis assessed the evidence for this outcome to be low (summary of findings Table 8).
5. Adverse events
We have presented adverse events by severity in the analyses, none of which were significantly different between groups (Analysis 7.7). There were only three participants in each group reporting treatment‐related adverse events and these were all grade 1 or 2 in severity (AZLI/TIS n = 3/42 (7.1 %); placebo/TIS n = 3/46 (6.5 %); RR 1.10 (95% CI 0.23 to 5.13)). None of the serious adverse events (AZLI/TIS n = 21/42 (50.0 %); placebo/TIS n = 24/46 (52.2 %)) were considered to be treatment‐related.
Treatment‐emergent adverse events were reported only for those participants who received the treatment (safety population n = 88). We have presented specific adverse events in the analysis (Analysis 7.8).
c. Sensitivity reactions
The most commonly reported adverse events (none of which showed a significant difference between groups) were cough (AZLI/TIS n = 32 out of 42 participants (76.2 %); placebo/TIS n = 33 out of 46 participants (71.7 %); RR 1.06 (95% CI 0.83 to 1.36)), increased sputum (AZLI/TIS n = 20 out of 42 participants (47.6 %); placebo/TIS n = 31 out of 46 participants (67.4 %); RR 0.71 (95% CI 0.49 to 1.03)) and dyspnoea (AZLI/TIS n = 13 out of 42 participants (31.0 %); placebo/TIS n = 24 out of 46 participants (52.2 %); RR 0.59 (95% CI 0.35 to 1.01)).
d. Other
Decreased exercise tolerance was reported to be significantly more common in the placebo/TIS group, (RR 0.27, 95% CI 0.08 to 0.90); this was also true for decreased appetite, RR 0.34 (95% CI 0.14 to 0.85) and nasal congestion, RR 3.01 (95% CI 1.04 to 8.74). No significant differences were found between groups for any of the other treatment‐emergent adverse events (Flume 2016b).
Our GRADE analysis assessed the evidence for this outcome to be low (summary of findings Table 8).
Discussion
Summary of main results
The purpose of this review was to determine the benefits and harms of inhaling antibiotics for longer‐term suppression of chronic lung infection with P aeruginosa in people with CF. We wanted to distinguish this pattern of use from inhaled antibiotics to treat pulmonary exacerbations or to eradicateP aeruginosa (Langton Hewer 2017; Ryan 2012).
We originally used an arbitrary definition of treatment for at least one month as the criteria for accepting trials to guide long‐term suppression. In retrospect, this criterion was judged to be erroneous and the 2018 update of the review only includes trials where treatment lasted at least three months. The main reason for this was that treatment to suppress chronic infection with P aeruginosa in the lungs of people with CF will be used for more than a month, so there is a need to know the benefit and harms of inhaled antibiotic treatment used over a longer time period.
The review found 18 trials with 3042 participants that examined the effect of any inhaled antibiotic treatment as long‐term therapy (i.e. three to 32 months) in people with CF. Of these, 11 trials compared one or more antibiotics to placebo or usual treatment (n = 1130). There were four trials that compared two different antibiotics (n = 1237). Two trials compared two regimens of inhaled tobramycin (n = 585) and one trial (n = 90) compared intermittent treatment with tobramycin compared to continuous treatment with tobramycin and aztreonam. The Stead trial (n = 18) was a three arm trial which fell into to both groups as they compared different antibiotics and compared antibiotics to placebo (Stead 1987). Overall the most studied antibiotic is tobramycin and was reported in 12 of the included trials.
Inhaled anti‐pseudomonal antibiotics versus placebo
The review found some evidence that inhaled antibiotics improved lung function (FEV1 and FVC) and reduced the frequency of exacerbations of respiratory infection in people with CF when compared to placebo (summary of findings Table for the main comparison). There were insufficient data for us to be able to report an effect on nutritional outcomes and survival. The effect on QoL could not be ascertained and there were only a small number of deaths during these trials.There was no significant effect on antibiotic resistance seen in the two trials that were included in the meta‐analysis.
Important adverse effects were not common in these trials, and it was difficult to know what the acceptability of treatment was to the individual.
Inhaled anti‐pseudomonal antibiotics compared
Each of the comparisons of different anti‐pseudomonal antibiotics that we report, only included one trial. We report the findings in summary of findings tables (summary of findings Table 2; summary of findings Table 3; summary of findings Table 4; summary of findings Table 5; summary of findings Table 7). Lung function only improved significantly in the comparison of TIS and AZLI (n = 268) and this was in favour of AZLI (Assael 2013). No significant differences in this outcome were found in the remaining comparisons.
Pulmonary exacerbations were measured in different ways with hospital admissions, courses and duration of antibiotics and number of exacerbations being used as a measure of the effect of the intervention on exacerbations. Assael (n = 268) reported that both the number of people requiring antibiotics and the number of days they required them for were higher in those participants in the TIS group compared to the AZLI group (Assael 2013). The evidence from this trial was deemed to be of moderate quality; the quality judgement was downgraded because of the risk of bias within the trial caused by the design being open label. When comparing LIS to TIS, Elborn found that the number of hospitalisations due to an exacerbation was significantly lower in the LIS group compared to the TIS group (n = 282); the quality of the evidence from this trial was deemed to be high (Elborn 2015).
Due to paucity of data we are unable to make conclusions about quality of life changes for these comparisons or for nutritional outcomes. Similarly, the low numbers of deaths in the trials precludes us from commenting on the effect of the interventions on this outcome.
Adverse events were common for all comparisons, but few significant differences were reported. With regard to treatment‐related adverse events, there was a lower number reported in the TIS group compared to the AZLI group in the Assael trial (n = 268) and similarly in the TIS group compared to colistimethate group in the Schuster trial (n = 379) (Assael 2013; Schuster 2013).
Continuous inhaled anti‐pseudomonal antibiotics versus intermittent inhaled anti‐pseudomonal antibiotics compared
We only found one trial that compared continuous alternating treatment of AZLI/TIS with an intermittent course of TIS (n = 90) (Flume 2016b). The results are presented in the tables (summary of findings Table 8). Few differences were reported for the outcomes in which we are interested and none reached statistical significance. The authors only conclusion was that the continuous alternating regimen was well‐tolerated and may provide additional clinical benefit (Flume 2016b).
Overall completeness and applicability of evidence
It is unlikely that any trials of inhaled antibiotics, particularly good quality trials, have not been identified and included. The search strategy was thorough and the selection of trials for inclusion in the review from those found in the search strategy has favoured inclusion rather than exclusion, e.g. quasi‐randomised trials and trials in which the criteria for diagnosis of CF were not explicitly stated were included. For three of the included trials, we were only able to find an abstract to the trial. Two of these trials were published over 30 years ago and it is unlikely that we will find any further details (Day 1988; Nathanson 1985). The Bilton trial was first published in abstract form in 2013 and we have made contact with the authors to find out if there is a full paper that we can include (Bilton 2014). Any extra information obtained will be included in the next update.
There was important heterogeneity amongst these trials in terms of design and outcome measures, which led to difficulties in performing the review and interpreting the results. In particular, only a few trials were able to be included in a meta‐analysis of any outcome, raising the possibility of bias.
The most frequently measured outcomes were lung function, hospitalisation and antibiotic use and a measure of pulmonary exacerbations experienced. Inhaled therapy is time‐consuming and this will have a negative impact on the QoL and the independence of people with CF. We were less able to make conclusions relating to QoL and survival, as these are longer‐term measures; particularly with QoL measures, some trials did not report the outcome at all.
Previous versions of this review included trials of at least one month's duration and found there to be some evidence that inhaled antibiotics benefited participants in terms of improving lung function and reducing exacerbations (Ryan 1999; Ryan 2003; Ryan 2011). In this version of the review, we have changed the criteria and include only those where participants were treated for at least three months. The changing face of CF care in recent decades has lead to improved survival and as such, a greater focus on the long‐term risks and benefits of different treatments. With 56.8% of adults with CF culturing P aeruginosa on a chronic or intermittent basis (CF Trust 2016), and 87% of them on long‐term inhaled antibiotic therapy, the inclusion of short trials in the review does not provide evidence that is comparable to current clinical practice, which recommends three months of treatment with inhaled antibiotics even at the first isolation of P aeruginosa, and essentially lifelong treatment in cases of failed eradication.
Quality of the evidence
The design, performance and reporting of trials has changed since the first included trial (n = 20) was reported 36 years ago; this first report of the use of inhaled antibiotics in CF renewed interest in this therapy (Hodson 1981). Following this, six trials (n = 140) were published between 1984 and 1989; these were all single‐centre trials with small sample sizes and with important problems in trial design (Day 1988; Jensen 1987; Kun 1984; MacLusky 1989; Nathanson 1985; Stead 1987). Furthermore, the doses of antibiotic used in these trials was relatively small and probably determined by the size of the ampoule for intravenous therapy, e.g. doses of gentamicin or tobramycin from 20 mg to 80 mg. In vitro data suggested much higher doses would be needed to ensure bacterial killing. The next development was production of a preservative‐free tobramycin in a dose of 300 mg in 5 mL solution and able to be delivered by jet nebuliser (n = 520) (Ramsey 1999). This trial was multicentre with larger numbers of participants. It was performed at a time when there was more critical examination of trial design in trials involving people with CF and was of higher quality. There were two trials in children with early isolation of P aeruginosa or persistent isolation but with mild impairment of lung function (n = 203) (Murphy 2004; Wiesemann 1998).
Two design features that are problematic for trials of nebulised antibiotics in CF are cross‐over periods and double blinding. Cross‐over design for antibiotic therapy in CF is probably inappropriate. Firstly, the clinical course of lung disease in CF is unstable with a frequent pattern of progressive deterioration and exacerbations causing further temporary deterioration. Secondly, an effective antibiotic treatment may have a carry‐over effect. Thirdly, treatment of exacerbations with antibiotics and more physiotherapy and other treatment will cause an improvement in lung function that is likely to persist with time, with potential for carry‐over benefit. Six of our trials used a cross‐over design (n = 124) (Day 1988; Hodson 1981; Kun 1984; Nathanson 1985; Nikolaizik 2008; Stead 1987).
We assessed the quality of the evidence using the GRADE system and evaluate our specified outcomes in the summary of findings tables (summary of findings Table for the main comparison; summary of findings Table 2; summary of findings Table 3; summary of findings Table 4; summary of findings Table 5; summary of findings Table 6; summary of findings Table 7; summary of findings Table 8). The most common reason for downgrading evidence in this review was the risk of bias in the included trials. Blinding is important for these trials, but care is needed to mask the taste of antibiotic solutions and this may not have been achieved in a number of trials using normal saline for placebo. In some cases blinding was not possible due to the difference in treatment regimens and seven trials were open label (Assael 2013; Bilton 2014; Elborn 2015; Konstan 2010b; Murphy 2004; Nikolaizik 2008; Schuster 2013), one trial was partially blinded (Stead 1987) and two were single‐blinded (observer) (Kun 1984; MacLusky 1989).
We also downgraded the evidence due to imprecision with many trials reporting low event rates or small sample sizes, or both. Difficulty in recruiting and maintaining trial numbers was a challenge and some of the included trials were underpowered for some or all of the outcomes measured (n = 470) (Flume 2016b; Schuster 2013). The sample of trials gives an example for the debate on the relative validity of pooling results from a number of small trials with results that are prone to error or the results from a single large well‐designed trial. In this review, one well‐designed trial contributed 45% of all participants (n = 520) in the 11 trials comparing an inhaled antibiotic to placebo (Ramsey 1999).
Potential biases in the review process
We feel that all the relevant trials have been identified and data rigorously and independently extracted by two review authors. At least two review authors also assessed the risks of bias for each trial and a third review author was brought in to arbitrate if needed. There has been a change to the review team, and although data extraction has always been done by two review authors, it has not always been the same two review authors. This may have introduced an element of bias to the way which we have reported the results of the trials.
The original protocol for this review was written in 1997. A general objective was to include as much evidence as possible from controlled trials on the use of inhaled antibiotics to suppress infection with P aeruginosa. This resulted in a large review with much heterogeneity in trial design and reporting, meaning that the review was difficult to analyse and interpret. Two design features open to debate are the length of the trial that is needed to support long‐term use and the inclusion of cross‐over trials (see preceding discussion). In the current update we have amended the protocol to include only trials of at least three months duration and we have treated results from cross‐over trials with caution.
Agreements and disagreements with other studies or reviews
In the UK, the first‐line treatment for P aeruginosa is colistin followed by alternating therapy with tobramycin, as recommended by the UK CF Trust guidelines, supported by UK NICE guidance on the use of colistin or tobramycin dry powders for inhalation rather than nebuliser therapy and is also seen in local CF guidelines (CF Trust 2009; GOSH 2011; NICE 2013). In the USA, chronic suppression of P aeruginosa is treated with inhaled tobramycin due to the sustained improvement in pulmonary function outweighing the risk of resistance developing (Yankaskas 2004). Colistin is not recommended in US guidelines for chronic suppression of P aeruginosa, which is consistent with the findings of this review, i.e. that there is not adequate evidence to support its use (Mogayzel 2013).
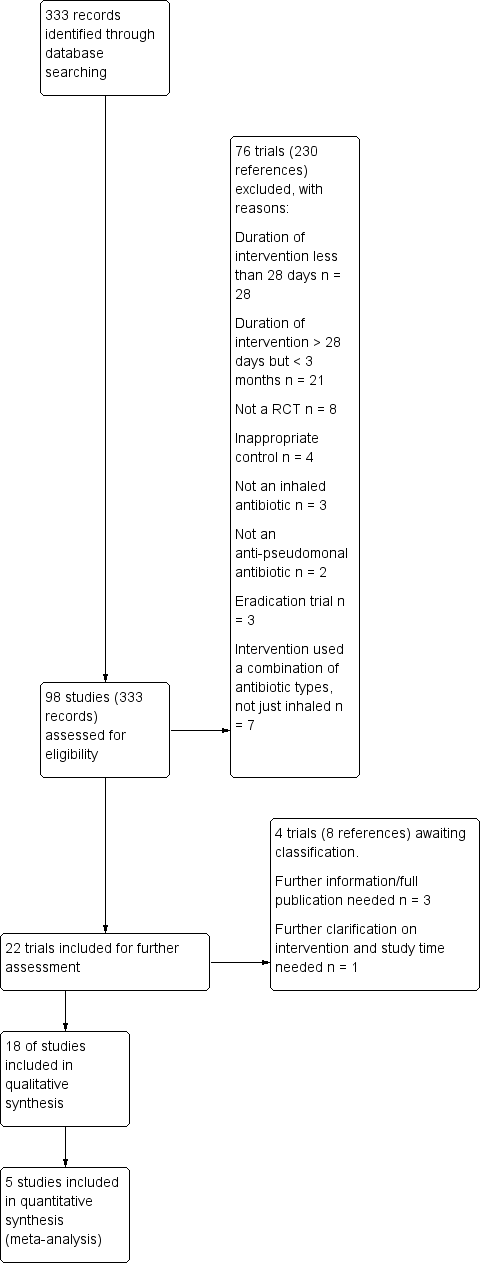
Study flow diagram.

Risk of bias summary: review authors' judgements about each risk of bias item for each included study.


Forest plot of comparison: 1 Inhaled anti‐pseudomonal antibiotic versus placebo, outcome: 1.6 Mean change in FVC (% predicted).

Comparison 1 Inhaled anti‐pseudomonal antibiotic (IAPA) versus placebo, Outcome 1 Mean absolute FEV1 (% predicted).

Comparison 1 Inhaled anti‐pseudomonal antibiotic (IAPA) versus placebo, Outcome 2 Mean change in FEV1 (% predicted).

Comparison 1 Inhaled anti‐pseudomonal antibiotic (IAPA) versus placebo, Outcome 3 Mean change in % predicted FEV1.

Comparison 1 Inhaled anti‐pseudomonal antibiotic (IAPA) versus placebo, Outcome 4 Rate of change of FEV1 (% predicted per year).

Comparison 1 Inhaled anti‐pseudomonal antibiotic (IAPA) versus placebo, Outcome 5 Mean absolute FVC (% predicted) at end of treatment.
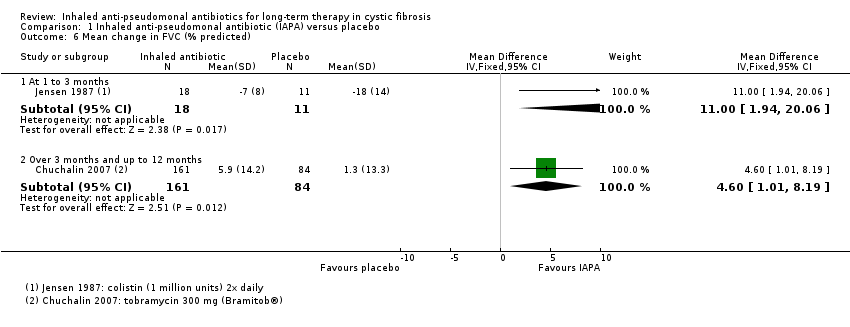
Comparison 1 Inhaled anti‐pseudomonal antibiotic (IAPA) versus placebo, Outcome 6 Mean change in FVC (% predicted).
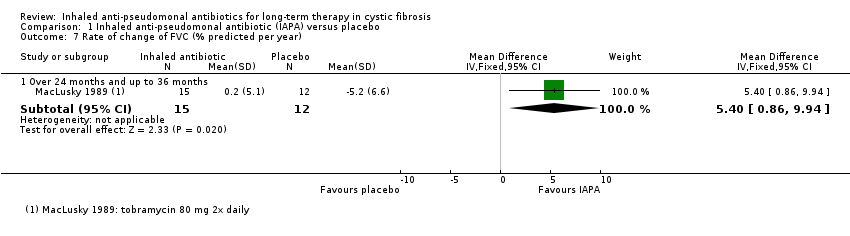
Comparison 1 Inhaled anti‐pseudomonal antibiotic (IAPA) versus placebo, Outcome 7 Rate of change of FVC (% predicted per year).

Comparison 1 Inhaled anti‐pseudomonal antibiotic (IAPA) versus placebo, Outcome 8 Frequency of one or more hospital admissions.

Comparison 1 Inhaled anti‐pseudomonal antibiotic (IAPA) versus placebo, Outcome 9 Hospital admissions, mean number of days in hospital.

Comparison 1 Inhaled anti‐pseudomonal antibiotic (IAPA) versus placebo, Outcome 10 Frequency of one or more courses of intravenous antibiotics.

Comparison 1 Inhaled anti‐pseudomonal antibiotic (IAPA) versus placebo, Outcome 11 Pulmonary exacerbations.

Comparison 1 Inhaled anti‐pseudomonal antibiotic (IAPA) versus placebo, Outcome 12 Lost school or working days.
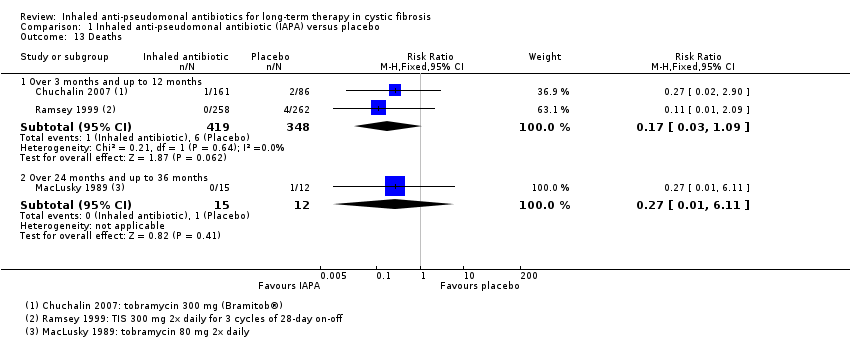
Comparison 1 Inhaled anti‐pseudomonal antibiotic (IAPA) versus placebo, Outcome 13 Deaths.
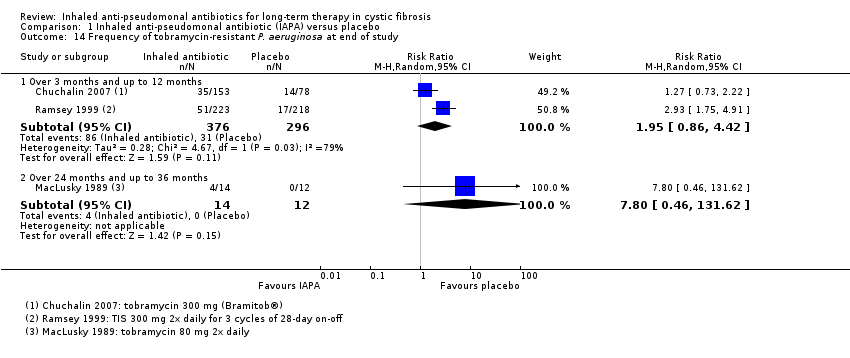
Comparison 1 Inhaled anti‐pseudomonal antibiotic (IAPA) versus placebo, Outcome 14 Frequency of tobramycin‐resistant P. aeruginosa at end of study.
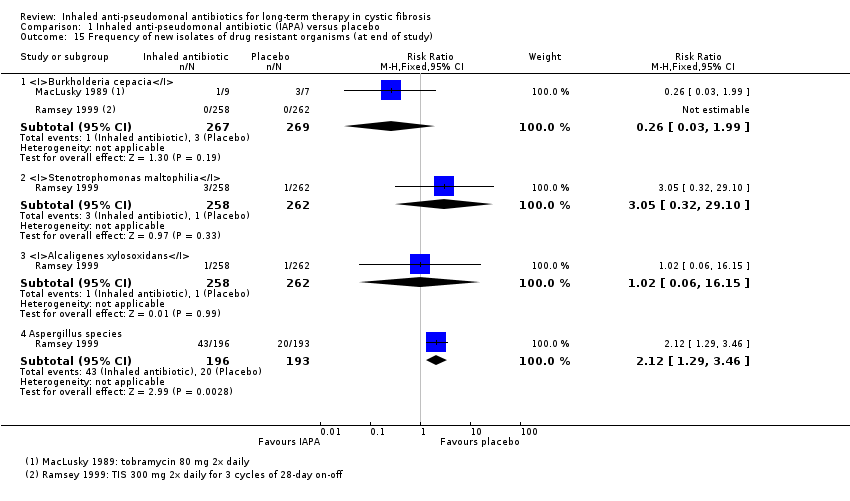
Comparison 1 Inhaled anti‐pseudomonal antibiotic (IAPA) versus placebo, Outcome 15 Frequency of new isolates of drug resistant organisms (at end of study).

Comparison 1 Inhaled anti‐pseudomonal antibiotic (IAPA) versus placebo, Outcome 16 Number experiencing adverse event (at end of study).

Comparison 2 Colistimethate sodium dry powder (CDPI) versus tobramycin for inhalation solution (TIS), Outcome 1 Number of pulmonary exacerbations.

Comparison 2 Colistimethate sodium dry powder (CDPI) versus tobramycin for inhalation solution (TIS), Outcome 2 Time to first pulmonary exacerbation.

Comparison 2 Colistimethate sodium dry powder (CDPI) versus tobramycin for inhalation solution (TIS), Outcome 3 Deaths.

Comparison 2 Colistimethate sodium dry powder (CDPI) versus tobramycin for inhalation solution (TIS), Outcome 4 Adverse events (at end of study).

Comparison 3 Inhaled TOBI® (IV preparation) versus tobramycin for inhalation solution (TIS), Outcome 1 FEV1 % predicted.
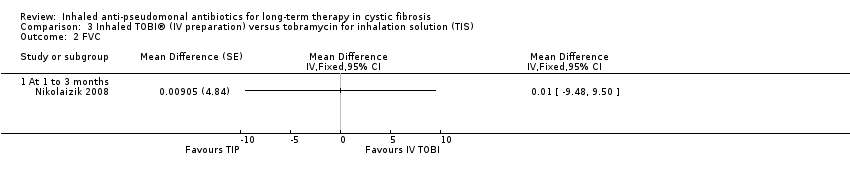
Comparison 3 Inhaled TOBI® (IV preparation) versus tobramycin for inhalation solution (TIS), Outcome 2 FVC.
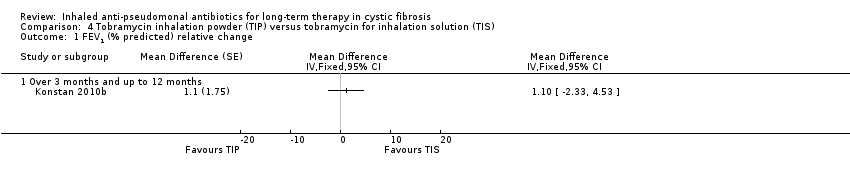
Comparison 4 Tobramycin inhalation powder (TIP) versus tobramycin for inhalation solution (TIS), Outcome 1 FEV1 (% predicted) relative change.

Comparison 4 Tobramycin inhalation powder (TIP) versus tobramycin for inhalation solution (TIS), Outcome 2 Hospitalisations.

Comparison 4 Tobramycin inhalation powder (TIP) versus tobramycin for inhalation solution (TIS), Outcome 3 Pulmonary exacerbations.
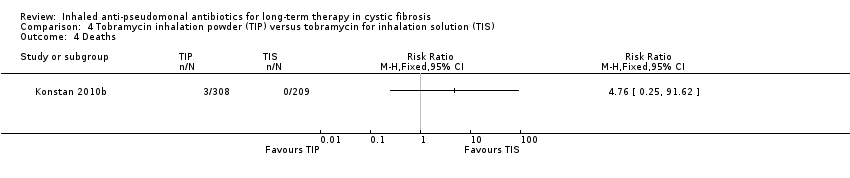
Comparison 4 Tobramycin inhalation powder (TIP) versus tobramycin for inhalation solution (TIS), Outcome 4 Deaths.

Comparison 4 Tobramycin inhalation powder (TIP) versus tobramycin for inhalation solution (TIS), Outcome 5 Adverse events (at end of study).

Comparison 5 Inhaled aztreonam lysine (AZLI) versus tobramycin for inhalation solution (TIS), Outcome 1 FEV1 % predicted ‐ mean relative change from baseline.
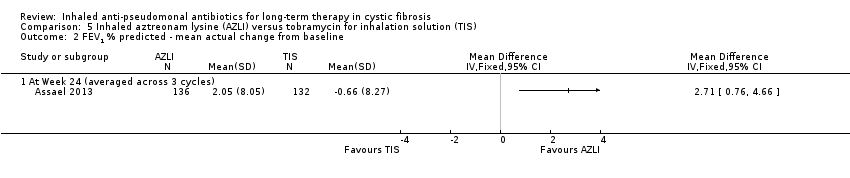
Comparison 5 Inhaled aztreonam lysine (AZLI) versus tobramycin for inhalation solution (TIS), Outcome 2 FEV1 % predicted ‐ mean actual change from baseline.

Comparison 5 Inhaled aztreonam lysine (AZLI) versus tobramycin for inhalation solution (TIS), Outcome 3 Need for additional antibiotics.
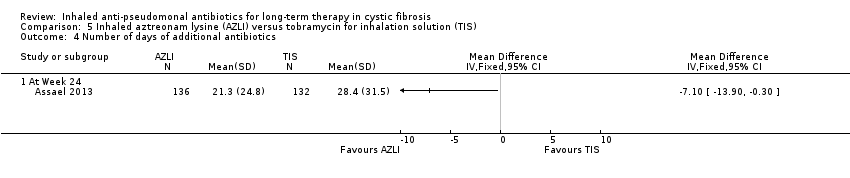
Comparison 5 Inhaled aztreonam lysine (AZLI) versus tobramycin for inhalation solution (TIS), Outcome 4 Number of days of additional antibiotics.

Comparison 5 Inhaled aztreonam lysine (AZLI) versus tobramycin for inhalation solution (TIS), Outcome 5 Weight (relative change from baseline).

Comparison 5 Inhaled aztreonam lysine (AZLI) versus tobramycin for inhalation solution (TIS), Outcome 6 Quality of Life ‐ CFQR respiratory symptom scale.

Comparison 5 Inhaled aztreonam lysine (AZLI) versus tobramycin for inhalation solution (TIS), Outcome 7 TSQM ‐ effectiveness.
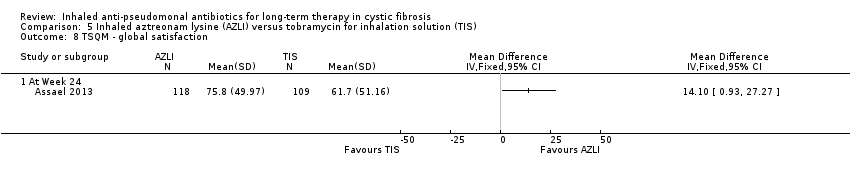
Comparison 5 Inhaled aztreonam lysine (AZLI) versus tobramycin for inhalation solution (TIS), Outcome 8 TSQM ‐ global satisfaction.

Comparison 5 Inhaled aztreonam lysine (AZLI) versus tobramycin for inhalation solution (TIS), Outcome 9 TSQM ‐ side effects.
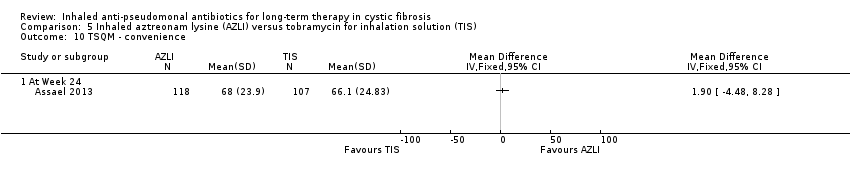
Comparison 5 Inhaled aztreonam lysine (AZLI) versus tobramycin for inhalation solution (TIS), Outcome 10 TSQM ‐ convenience.

Comparison 5 Inhaled aztreonam lysine (AZLI) versus tobramycin for inhalation solution (TIS), Outcome 11 Log10Pseudomonas aeruginosa CFU/g sputum.

Comparison 5 Inhaled aztreonam lysine (AZLI) versus tobramycin for inhalation solution (TIS), Outcome 12 Adverse events (at end of study).
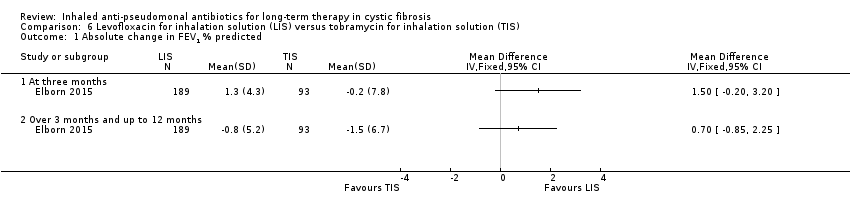
Comparison 6 Levofloxacin for inhalation solution (LIS) versus tobramycin for inhalation solution (TIS), Outcome 1 Absolute change in FEV1 % predicted.
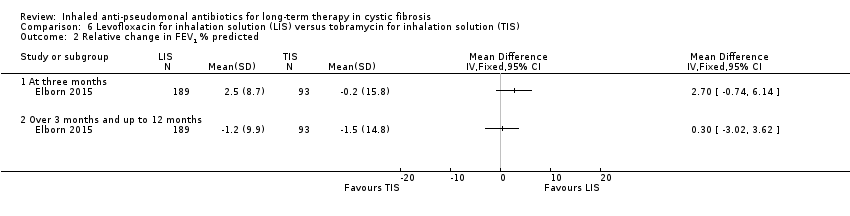
Comparison 6 Levofloxacin for inhalation solution (LIS) versus tobramycin for inhalation solution (TIS), Outcome 2 Relative change in FEV1 % predicted.
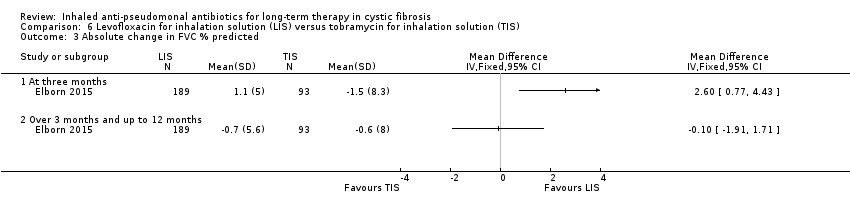
Comparison 6 Levofloxacin for inhalation solution (LIS) versus tobramycin for inhalation solution (TIS), Outcome 3 Absolute change in FVC % predicted.
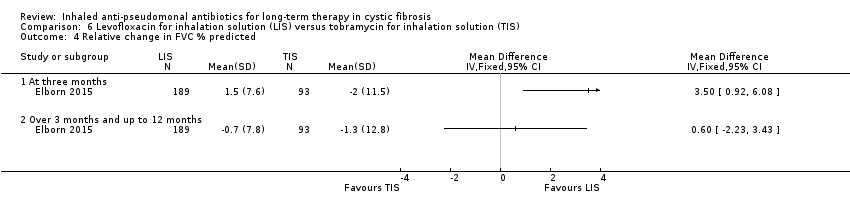
Comparison 6 Levofloxacin for inhalation solution (LIS) versus tobramycin for inhalation solution (TIS), Outcome 4 Relative change in FVC % predicted.

Comparison 6 Levofloxacin for inhalation solution (LIS) versus tobramycin for inhalation solution (TIS), Outcome 5 Hospitalisations due to respiratory exacerbations.
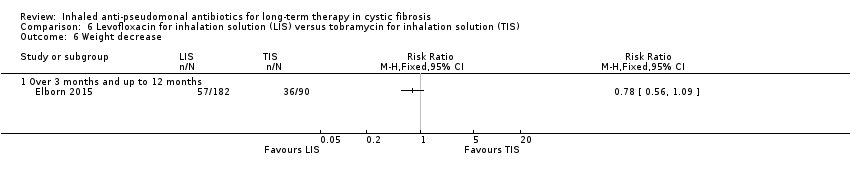
Comparison 6 Levofloxacin for inhalation solution (LIS) versus tobramycin for inhalation solution (TIS), Outcome 6 Weight decrease.

Comparison 6 Levofloxacin for inhalation solution (LIS) versus tobramycin for inhalation solution (TIS), Outcome 7 Change in P aeruginosa sputum density (log10 CFU/g).

Comparison 6 Levofloxacin for inhalation solution (LIS) versus tobramycin for inhalation solution (TIS), Outcome 8 Adverse events (at end of study).

Comparison 7 Continuous aztreonam (AZLI)/tobramycin (TIS) versus intermittent tobramycin (TIS), Outcome 1 Mean change from baseline ‐ FEV1 % predicted.
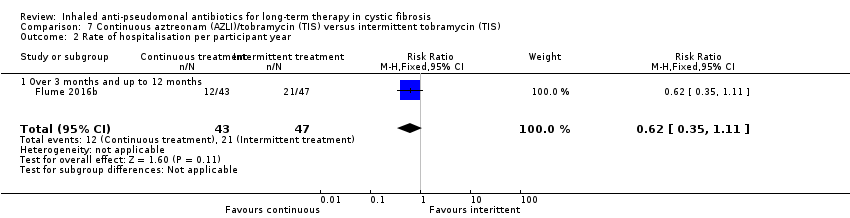
Comparison 7 Continuous aztreonam (AZLI)/tobramycin (TIS) versus intermittent tobramycin (TIS), Outcome 2 Rate of hospitalisation per participant year.

Comparison 7 Continuous aztreonam (AZLI)/tobramycin (TIS) versus intermittent tobramycin (TIS), Outcome 3 Need for additional antibiotics for an exacerbation.

Comparison 7 Continuous aztreonam (AZLI)/tobramycin (TIS) versus intermittent tobramycin (TIS), Outcome 4 Rate of protocol defined pulmonary exacerbations per participant year.

Comparison 7 Continuous aztreonam (AZLI)/tobramycin (TIS) versus intermittent tobramycin (TIS), Outcome 5 Quality of life ‐ CFQ‐R respiratory symptom score.

Comparison 7 Continuous aztreonam (AZLI)/tobramycin (TIS) versus intermittent tobramycin (TIS), Outcome 6 Incidence of other respiratory pathogens (at end of study).

Comparison 7 Continuous aztreonam (AZLI)/tobramycin (TIS) versus intermittent tobramycin (TIS), Outcome 7 Adverse events (at end of study).

Comparison 7 Continuous aztreonam (AZLI)/tobramycin (TIS) versus intermittent tobramycin (TIS), Outcome 8 Treatment‐emergent adverse events (at end of study).
| Anti‐pseudomonal antibiotics compared with placebo for long‐term therapy in CF | ||||||
| Patient population: adults and children with CF and P aeruginosa Settings: outpatients Intervention: inhaled anti‐pseudomonal antibiotics Comparison: placebo | ||||||
| Outcomes | Illustrative comparative risks* (95% CI) | Relative effect | No of participants | Quality of the evidence | Comments | |
| Assumed risk | Corresponding risk | |||||
| Placebo | Inhaled anti‐pseudomonal antibiotics | |||||
| FEV1 (% predicted) Follow‐up: at 3 months and up to 36 months | 4 trials found a significant improvement in FEV1 with inhaled antibiotics compared to placebo, although no data were available for 3 of these. 1 trial reported that the rate of decline in FEV1 favoured antibiotics. The remaining 6 trials showed no significant difference between inhaled antibiotics and placebo. | NA | 1130 | ⊕⊕⊝⊝ | The included trials all measured FEV1 but in different ways and for different lengths of time. It was not possible to combine the trials in a meta‐analysis. | |
| FVC (% predicted) Follow‐up: at 3 months and up to 36 months | 5 of the 10 trials found significant changes in FVC at the end of the trial period, favouring inhaled antibiotics when compared to placebo. 1 trial found no significant difference in absolute values of FVC % predicted between inhaled antibiotics and control but found that mean change in FVC % predicted was significantly different (favouring antibiotics). 1 trial found a combination of gentamycin and carbenicillin versus placebo to be significantly different and favouring antibiotics yet ceftazidime versus placebo was not significantly different. 3 trials found no significant difference between antibiotics and placebo with regard to FVC % predicted. | NA | 1097 | ⊕⊕⊝⊝ | FVC was measured differently across the trials. | |
| Pulmonary exacerbations: frequency of one or more hospital admissions Follow‐up: over 3 months and up to 12 months | 397 per 1000 | 262 per 1000 | RR 0.66 (0.47 to 0.93) | 946 | ⊕⊕⊝⊝ | |
| Quality of life: lost school or working days. Follow‐up: over 3 months and up to 12 months | The mean number of lost school or working days in the control group was 10 days. | The mean number of lost school or working days in the inhaled antibiotic group was 5.3 days lower (8.59 lower to 2.01 lower). | NA | 245 | ⊕⊕⊝⊝ | |
| Survival: number of deaths Follow‐up: over 3 months and up to 12 months | 17 per 1000 | 3 per 1000 | RR 0.17 (0.03 to 1.09) | 767 | ⊕⊕⊝⊝ | |
| Antibiotic resistance: frequency of tobramycin‐resistant P aeruginosa Follow‐up: at end of trial (12 months) | 105 per 1000 | 205 per 1000 | RR 1.95 (0.86 to 4.42) | 672 | ⊕⊕⊕⊝ | |
| Adverse events Follow‐up: at the end of the trial (84 days to 33 months) | There were no significant differences between inhaled antibiotics and placebo for auditory impairment, pneumothorax, haemoptysis. Tinnitus and voice alteration were significantly more common in the inhaled antibiotics groups. | NA | 1014 (6) | ⊕⊝⊝⊝ | Rate of auditory impairment reported in 5 trials for 996 participants. Rate of pneumothorax reported in 3 trials for 558 participants. Rate of haemoptysis reported in 1 trial for 520 participants. Rate of tinnitus reported in 1 trial for 520 participants. Rate of voice alteration reported in 2 trials for 701 participants. | |
| *The basis for the assumed risk (e.g. the median control group risk across studies) is provided in footnotes. The corresponding risk (and its 95% CI) is based on the assumed risk in the comparison group and the relative effect of the intervention (and its 95% CI). | ||||||
| GRADE Working Group grades of evidence | ||||||
| 1. Downgraded twice due to most trials included in the comparison being at unclear or high risk of bias. Three trials were at high or unclear risk of bias across all domains. All of the 11 trials were at high or unclear risk of bias for randomisation or allocation concealment (or both) and also blinding of participants or outcome assessors (or both). | ||||||
| Colistimethate dry powder (Colobreathe®) compared with TIS for long‐term therapy in CF | ||||||
| Patient population: children and adults with CF and P aeruginosa infection Settings: outpatients Intervention: colistimethate dry powder for inhalation (one 1.6625 MU capsule twice daily for 24 weeks) Comparison: TIS (3 cycles of 28‐days of TIS (300 mg/5 mL) twice daily followed by a 28‐day off period) | ||||||
| Outcomes | Illustrative comparative risks* (95% CI) | Relative effect | No of participants | Quality of the evidence | Comments | |
| Assumed risk | Corresponding risk | |||||
| TIS | Colistimethate dry powder for inhalation (Colobreathe®) | |||||
| FEV1 (% predicted): mean change from baseline Follow‐up: 24 weeks | Adjusted mean difference between the groups (ITT population LOCF) for the change in FEV1 % predicted, MD ‐0.98% (95% CI‐2.74% to 0.86%). There was no significant difference between the 2 groups for this outcome. | NA | 374 | ⊕⊕⊝⊝ | The data were not normally distributed and were analysed using log‐transformation analysis. We have reported the results directly from the paper. | |
| FVC (% predicted): mean change from baseline Follow‐up: 24 weeks | There was no significant difference between groups for FVC % predicted in the ITT population (LOCF), MD 0.01 L (95% CI ‐0.09 to 0.10). | NA | 374 (1) | ⊕⊕⊝⊝ | The data were not normally distributed and were analysed using log‐transformation analysis. We have reported the results directly from the paper. | |
| Pulmonary exacerbations: number of pulmonary exacerbations Follow‐up: 24 weeks | 262 per 1000 | 312 per 1000 | RR 1.19 (0.86 to 1.64) | 374 | ⊕⊕⊕⊝ | |
| Quality of life: adjusted mean change in CFQ‐R score at the end of treatment Follow‐up: 24 weeks | The adjusted mean changes at the end of the trial favoured the Colobreathe® group in terms of treatment burden (P = 0.091). This difference was significant at Week 4 (P < 0.001). | NA | 374 | ⊕⊕⊝⊝ | The trial was not powered to detect differences in overall quality of life. Results reported directly from paper. | |
| Survival: number of deaths Follow‐up: over 3 months and up to 12 months | 10 per 1000 | 2 per 1000 | RR 0.21 (0.01 to 4.32) | 374 | ⊕⊕⊝⊝ | |
| Antibiotic resistance: change in mean MIC50 and MIC90 at the end of the trial Follow‐up: 24 weeks | The mean MIC50 (breakpoint of ≥ 8 mg/L) changed in the TIS group by 0.5 compared to 0.0 in the Colobreathe® group. The mean MIC90 (breakpoint of ≥ 8 mg/L) changed in the both groups by 4.0 | NA | 374 (1) | ⊕⊕⊝⊝ | ||
| Adverse events: number of treatment related adverse events. Follow‐up: 24 weeks | 466 per 1000 | 820 per 1000 | RR 1.76 (1.50 to 2.08) | 379 | ⊕⊕⊝⊝ | Treatment‐related adverse events were significantly lower in the TIS group than the Colobreathe® group P < 0.0001. |
| *The basis for the assumed risk (e.g. the median control group risk across studies) is provided in footnotes. The corresponding risk (and its 95% CI) is based on the assumed risk in the comparison group and the relative effect of the intervention (and its 95% CI). | ||||||
| GRADE Working Group grades of evidence | ||||||
| 1. Downgraded once due to an unclear or high risk of bias across four out of the seven domains, particularly randomisation, allocation concealment and participant blinding. | ||||||
| Inhaled TOBI® (IV preparation) compared with TIS for long‐term therapy in CF | ||||||
| Patient population: adults and children with CF and P aeruginosa Settings: outpatients Intervention: TIS intermittent (four‐weekly on‐off cycles) twice‐daily 300 mg/5 mL Comparison: inhaled tobramycin (TOBI®) (IV preparation) continuous twice‐daily 80 mg | ||||||
| Outcomes | Illustrative comparative risks* (95% CI) | Relative effect | No of participants | Quality of the evidence | Comments | |
| Assumed risk | Corresponding risk | |||||
| TIS intermittent | Inhaled tobramycin (IV preparation) continuous | |||||
| FEV1 (% predicted): change from baseline Follow‐up: the end of the first treatment phase (12 weeks) | The change from baseline in FEV1 % predicted was on average 1.07% less in the TIS group than in the inhaled tobramycin (IV preparation) group, values ranged from 11.20% less to 9.06% higher. | NA | 32 | ⊕⊝⊝⊝ | Trial investigators provided individual participant data for lung function and we have analysed the first‐period data ourselves using the generic inverse variance method in RevMan. | |
| FVC (% predicted): change from baseline Follow‐up: the end of the first treatment phase (12 weeks) | The change from baseline in FVC % predicted was on average 0.01% more in the TIS group than in the inhaled tobramycin (IV preparation) group, values ranged from 9.48% less to 9.50% higher. | NA | 32 | ⊕⊝⊝⊝ | Trial investigators provided individual participant data for lung function and we have analysed the first‐period data ourselves using the generic inverse variance method in RevMan. | |
| Pulmonary exacerbations Follow‐up: NA | Outcome not reported. | NA | ||||
| Quality of life Follow‐up: NA | Outcome not reported. | NA | ||||
| Survival Follow‐up: NA | Outcome not reported. | NA | ||||
| Antibiotic resistance Follow‐up: NA | Outcome not reported. | NA | ||||
| Adverse events Follow‐up: NA | Outcome not reported. | NA | ||||
| *The basis for the assumed risk (e.g. the median control group risk across studies) is provided in footnotes. The corresponding risk (and its 95% CI is based on the assumed risk in the comparison group and the relative effect of the intervention (and its 95% CI). | ||||||
| GRADE Working Group grades of evidence | ||||||
| 1. Downgraded twice due to risk of bias being unclear or high across all of the domains. The trial was at risk due to lack of blinding of participants or outcome measurement. This was because of the interventions being significantly different making it impossible to blind. Some outcomes (sputum bacteriology and oxygen saturation) were listed in the methods but not reported in the results. | ||||||
| TIP compared with TIS for long‐term therapy in CF | ||||||
| Patient population: children and adults with CF and P aeruginosa Settings: outpatients Intervention: TIP twice‐daily 4 capsules (total of 112 mg) (3 cycles (28 days on‐drug, 28 days off‐drug)) Comparison: TIS twice‐daily 300 mg/5 mL | ||||||
| Outcomes | Illustrative comparative risks* (95% CI) | Relative effect | No of participants | Quality of the evidence | Comments | |
| Assumed risk | Corresponding risk | |||||
| TIS | TIP | |||||
| FEV1 (% predicted): relative change from baseline Follow‐up: 24 weeks | The MD between the 2 groups was 1.10 (95% CI ‐2.33 to 4.53) favouring TIS, but not significantly. | NA | 517 | ⊕⊕⊕⊝ | TIP was found to be non‐inferior to TIS. | |
| FVC Follow‐up: NA | Outcome not reported. | NA | ||||
| Pulmonary exacerbations: number of participants experiencing pulmonary exacerbation Follow‐up: 24 weeks | 301 per 1000 | 337 per 1000 (259 to 436 per 1000) | RR 1.12 (0.86 to 1.45) | 517 | ⊕⊕⊕⊝ | |
| Survival: number of deaths Follow‐up: 24 weeks | Not calculable as there were no deaths in the TIS group. There were 3 deaths in the TIP group. | RR 4.76 (0.25 to 91.62) | 517 | ⊕⊕⊝⊝ | ||
| Antibiotic resistance: mean change from baseline in P aeruginosa sputum density Follow‐up: 24 weeks | Mucoid and non‐mucoid P aeruginosa sputum densities showed a decrease from baseline in both groups at all time points. Mean change was ‐1.6 versus ‐0.92 log10 CFU/g for mucoid phenotype and ‐1.77 versus ‐0.73 log10 CFU/g for non‐mucoid phenotype. | NA | 517 (1) | ⊕⊕⊕⊝ | ||
| Adverse events: number of any adverse event reported Follow‐up: 24 weeks | 842 per 1000 | 901 per 1000 | RR 1.07 (1.00 to 1.15) | 517 | ⊕⊕⊕⊝ | A range of adverse events were reported but the only adverse events which were significantly different between the two groups were favouring TIS
|
| *The basis for the assumed risk (e.g. the median control group risk across studies) is provided in footnotes. The corresponding risk (and its 95% CI) is based on the assumed risk in the comparison group and the relative effect of the intervention (and its 95% CI). | ||||||
| GRADE Working Group grades of evidence | ||||||
| 1. Downgraded once due to risk of bias within the trial. This was an open‐label trial and so was at high risk of bias for blinding and had an unclear risk for randomisation and allocation concealment. | ||||||
| TIS compared with AZLI for long‐term therapy in CF | ||||||
| Patient population: children and adults with CF and P aeruginosa Settings: outpatients Intervention: AZLI 75 mg 3 times daily Comparison: TIS 300 mg twice‐daily | ||||||
| Outcomes | Illustrative comparative risks* (95% CI) | Relative effect | No of participants | Quality of the evidence | Comments | |
| Assumed risk | Corresponding risk | |||||
| TIS | AZLI | |||||
| FEV1 (% predicted): mean relative change from baseline averaged across 3 cycles Follow‐up: 24 weeks | The MD between groups was ‐3.40 (95% CI ‐6.63 to ‐0.17), favouring AZLI. | NA | 268 | ⊕⊕⊕⊝ | ||
| Pulmonary exacerbations: need for additional antibiotics. Follow‐up: 24 weeks | 576 per 1000 | 380 per 1000 | RR 0.66 (0.51 to 0.86) | 268 | ⊕⊕⊕⊝ | |
| Quality of life: mean change from baseline in CFQ‐R respiratory symptom scale averaged across 3 cycles. Follow‐up: 24 weeks | The mean (SD) change in CFQ‐R score was 2.2 (17.7) in the TIS group. | The mean change in CFQ‐R score in the AZLI group was | NA | 268 | ⊕⊕⊕⊝ | |
| Survival Follow‐up: 24 weeks | See comments. | 268 | ⊕⊕⊝⊝ | 2 participants died during the trial, but neither were related to treatment and the treatment group was not specified. | ||
| Antibiotic resistance: change from baseline in P aeruginosa CFU/g of sputum at week 24 Follow‐up: 24 weeks | The mean (SD) change in log10 CFU/g was ‐0.32 (1.87) in the TIS group. | The mean change in log10 CFU/g in the AZLI group was 0.23 lower (0.76 lower to 0.3 log10 CFU/g higher). | NA | 268 | ⊕⊕⊕⊝ | |
| Adverse events: number of treatment‐related adverse events Follow‐up: 24 weeks | 129 per 1000 | 228 per 1000 | RR 1.77 (1.03 to 3.04) | 268 | ⊕⊕⊕⊝ | Whilst treatment‐related events were significantly more likely in the AZLI treated group P < 0.04), the difference in serious adverse events (also more likely in the AZLI group) did not quite reach significance. No significant difference was reported for any other reported adverse event. |
| *The basis for the assumed risk (e.g. the median control group risk across studies) is provided in footnotes. The corresponding risk (and its 95% CI) is based on the assumed risk in the comparison group and the relative effect of the intervention (and its 95% CI). | ||||||
| GRADE Working Group grades of evidence | ||||||
| 1. Downgraded once due to risk of bias within the trial. The trial was open‐label with the treatments given at a different frequency and so obvious to participants. There was also an unclear risk attributed to blinding of outcome assessment. | ||||||
| LAI compared with TIS for long‐term therapy in CF | ||||||
| Patient or population: children and adults with CF and P aeruginosa Settings: outpatients Intervention: LAI 560 mg once daily with eFlow® nebuliser Comparison: TIS 300 mg twice daily via PARI LC® PLUS nebuliser | ||||||
| Outcomes | Illustrative comparative risks* (95% CI) | Relative effect | No of participants | Quality of the evidence | Comments | |
| Assumed risk | Corresponding risk | |||||
| TIS | LAI | |||||
| FEV1 : LS relative mean change from baseline (%) Follow‐up: 168 days | The LS MD in FEV1 (LAI ‐ TIS) was ‐1.31 % (95 % CI ‐4.95 to 2.34) favouring TIS but not significantly (P = 0.48). | NA | 262 | ⊕⊕⊝⊝ | Results taken from abstract (Bilton 2014). The lower CI was above ‐5 % indicating non‐inferiority of LAI to TIS. | |
| Quality of Life CFQ‐R respiratory symptom scores (mean (SE)) Follow‐up: 140 days | Mean increase from baseline at day 140 (end of trial) was 4.94 for LAI (which is greater than the 4 points which show a minimally important difference) but only 2.13 for TIS. | NA | 302 | ⊕⊕⊝⊝ | Minimally important differences (≥ 4 points) on the CFQ‐R Respiratory symptoms scale were seen after each treatment cycle with LAI but only after the first cycle of TIS. | |
| Antibiotic resistance: change from baseline in P aeruginosa CFU/g of sputum Follow‐up: 168 days | Mean reductions in P aeruginosa sputum density were similar during on‐treatment periods and off‐treatment periods with no significant difference between LAI and TIS (P = 0.038). | NA | 259 | ⊕⊕⊝⊝ | Taken directly from abstract. | |
| Adverse events: number of treatment‐related adverse events | 84% of participants in the LAI group experienced at least 1 treatment‐related adverse event, whilst 78.8 % of the TIS group experienced at least 1 treatment‐related adverse event. Serious adverse events were experienced by 17.6 % of LAI participants and 19.9 % of TIS participants. | NA | 294 | ⊕⊕⊝⊝ | Narrative taken directly from abstract (Bilton 2014). | |
| *The basis for the assumed risk (e.g. the median control group risk across studies) is provided in footnotes. The corresponding risk (and its 95% CI) is based on the assumed risk in the comparison group and the relative effect of the intervention (and its 95% CI). | ||||||
| GRADE Working Group grades of evidence | ||||||
| 1. Downgraded once due to risk of bias within the trial being unclear or high across all domains, largely due to the trial being published only in abstract form. 2. Downgraded once due to publication bias as we only have an abstract with limited information about the trial and the results. | ||||||
| LIS compared with TIS for long‐term therapy in CF | ||||||
| Patient population: adults and children aged over 12 with CF and P aeruginosa Settings: outpatients Intervention: LIS (Aeroquin™, MP376, APT‐1026) 240 mg (2.4 mL of 100 mg per mL solution) twice daily Comparison: TIS 300 mg/5 mL twice daily | ||||||
| Outcomes | Illustrative comparative risks* (95% CI) | Relative effect | No of participants | Quality of the evidence | Comments | |
| Assumed risk | Corresponding risk | |||||
| TIS | LIS | |||||
| FEV1 (% predicted): relative mean change from baseline Follow‐up: six months | The mean (SD) change in % predicted FEV1 was ‐1.5 (14.8) in the TIS group. | The mean change in % predicted FEV1 in the LIS group was 0.30 higher (3.02 lower to 3.62 higher). | NA | 282 | ⊕⊕⊕⊕ | |
| FVC (% predicted): relative mean change from baseline Follow‐up: six months | The mean (SD) change in FVC % predicted was ‐1.3 (12.8) in the TIS group. | The mean change in FVC % predicted in the LIS group was 0.60 higher (2.23 lower to 3.43 higher). | NA | 282 | ⊕⊕⊕⊕ | |
| Pulmonary exacerbations: number of hospitalisations due to respiratory exacerbations Follow‐up: six months | 280 per 1000 | 173 per 1000 | RR 0.62 (0.40 to 0.98) | 282 | ⊕⊕⊕⊕ | |
| Quality of life: change from baseline in CFQ‐R | The trial reported that scores in the respiratory domain of the CFQ‐R were similar in the 2 groups at baseline, increased in the LIS group and decreased in the TIS group at day 28 and were similar again by the end of the trial. | NA | 282 | ⊕⊕⊝⊝ | No data could be entered into analysis. | |
| Survival Follow‐up: NA | Outcome not reported. | NA | ||||
| Antibiotic resistance: mean change in P aeruginosa sputum density (log10 CFU/g) Follow‐up: six months | The mean (SD) sputum density in the TIS group was ‐0.25 (1.76) log10 CFU/g. | The mean sputum density in the LIS group was 0.12 higher (0.31 log10 CFU/g lower to 0.55 log10 CFU/g higher). | NA | 282 | ⊕⊕⊕⊕ | |
| Adverse events: number of treatment‐related adverse events | Significantly fewer participants in the LIS group reported epistaxis, RR 0.2 (95% CI 0.04 to 1.00), general malaise, RR 0.1 (95% CI 0.01 to 0.83) and increased blood glucose, RR 0.28 (95% CI 0.08 to 0.94). Significantly more participants in the LIS group reported dysgeusia, RR 46.25 (95% CI 2.88 to 742). No other differences were noted. | NA | 282 | ⊕⊕⊕⊕ | ||
| *The basis for the assumed risk (e.g. the median control group risk across studies) is provided in footnotes. The corresponding risk (and its 95% CI) is based on the assumed risk in the comparison group and the relative effect of the intervention (and its 95% CI). | ||||||
| GRADE Working Group grades of evidence | ||||||
| 1. Downgraded once due to indirectness. Quality of life was measured by the CFQ‐R score but no data was provided, just a summary. It is unclear which participants were included in this outcome. 2. Downgraded once due to publication bias as the results were not presented in full for this outcome. | ||||||
| Continuous AZLI/TIS compared with continuous placebo/TIS (i.e. intermittent TIS) for long‐term therapy in CF | ||||||
| Patient population: children and adults with CF and P aeruginosa Settings: outpatients Intervention: continuous alternating cycles of AZLI (75 mg (diluted in 0.17% NaCL) 3 times‐daily) and TIS (300 mg/5 mL twice‐daily) Comparison: alternating cycles of placebo (lactose monohydrate and sodium chloride reconstituted with the same diluent used for AZLI 3 times daily) and TIS (300 mg/5 mL twice‐daily) | ||||||
| Outcomes | Illustrative comparative risks* (95% CI) | Relative effect | No of participants | Quality of the evidence | Comments | |
| Assumed risk | Corresponding risk | |||||
| TIS/placebo | AZLI/TIS | |||||
| FEV1 (% predicted): mean change from baseline (average values across the end of the three treatment cycles) Follow‐up: six months (24 weeks) | The change from baseline in FEV1 % predicted was on average 1.33% more in the AZLI/TIS group than in the in the TIS/placebo group, values ranged from 0.51% lower to 3.17% higher. | NA | 90 | ⊕⊕⊝⊝ | ||
| FVC Follow‐up: NA | Outcome not reported. | NA | ||||
| Pulmonary exacerbations: rate of PDEs per participant year Follow‐up: 24 weeks | 489 per 1000 | 347 per 1000 | RR 0.71 (0.43 to 1.18) | 90 | ⊕⊕⊝⊝ | The rate of PDEs was lower in the AZLI/TIS group (1.31 PDEs per participant year) than in the placebo/TIS group (1.76 PDEs per participant year). The difference between the groups was not reported to be significant (P = 0.25, RR 0.74 (95% CI 0.45 to 1.24)). |
| Quality of life: CFQ‐R respiratory symptom scores averaged from weeks 4, 12 and 20 Follow‐up: 24 weeks | Scores improved by a mean (SE) 1.00 (1.74) in the AZLI/tobramycin group, they worsened by a mean (SE) ‐2.06 (1.63) in the placebo/TIS group. The difference between the groups was not found to be significant, MD 3.06 (95% CI ‐1.61 to 7.73). | 90 | ⊕⊕⊝⊝ | |||
| Survival Follow‐up NA | Outcome not reported. | NA | ||||
| Antibiotic resistance: mean change from baseline in P aeruginosa sputum density (CFU/g) Follow‐up: 24 weeks | Adjusted mean changes from baseline sputum P aeruginosa density after each course of AZLI/placebo or TIS during the comparative phase were small (0.36 to ‐0.55 log10 CFU/g) and differences between treatment groups were not statistically significant. | ⊕⊕⊝⊝ | ||||
| Adverse events: any adverse event in the comparative phase Follow‐up: 24 weeks | 978 per 1000 | 949 per 1000 | RR 0.97 (0.90 to 1.05) | 88 | ⊕⊕⊝⊝ | A range of adverse events were reported but the only adverse events which were significantly different between the 2 groups were: favouring continuous treatment
favouring intermittent treatment
|
| *The basis for the assumed risk (e.g. the median control group risk across studies) is provided in footnotes. The corresponding risk (and its 95% CI) is based on the assumed risk in the comparison group and the relative effect of the intervention (and its 95% CI). AZLI: inhaled aztreonam lysine; CFQ‐R: cystic fibrosis questionnaire ‐ revised; CFU: colony forming units; CI: confidence interval; FEV1: forced expiratory volume at 1 second; FVC: forced vital capacity; MD: mean difference; PDE: protocol‐defined exacerbation; P aeruginosa : Pseudomonas aeruginosa;RR: risk ratio; SE: standard error; TIS: tobramycin for inhalation solution. | ||||||
| GRADE Working Group grades of evidence | ||||||
| 1. Downgraded once due to risk of bias being unclear across five of the domains around randomisation, allocation concealment, blinding of participants and incomplete outcome data. | ||||||
| Trial | Trial characteristics | Participants | Interventions | Summary of results |
| Duration: 28 days. Design: double‐blind, placebo‐controlled parallel RCT. Location: multicentre ‐ 73 sites in 9 countries (USA, Australia and Europe). Clinical trials identifier: NCT00645788 | Number: estimated enrolment 245, 288 randomised but only 286 received 1 of the 4 treatments. Age: 12 years and older (split children 12 ‐ 17 years and adults 18 years and over). Gender: males or females. Disease status: chronic colonisation with P aeruginosa, clinically stable. | Intervention 1: 32.5 mg ciprofloxacin betaine corresponding to 50 mg ciprofloxacin Pulmonsphere inhalation powder 2x daily. Intervention 2: placebo (50 mg matching placebo powder formulation) 2x daily. Intervention 3: 48.75 mg ciprofloxacin betaine corresponding to 75 mg ciprofloxacin Pulmonsphere inhalation powder 2x daily. Intervention 4: placebo (75 mg matching placebo powder formulation) 2x daily. Interventions 3 and 4 were introduced after amendment 2. | No significant difference in change in FEV1 between ciprofloxacin dry powder inhalation at either dose (P = 0.154). In pooled analyses, FEV1 decline from baseline to treatment end was significantly lower with ciprofloxacin There were positive effects on sputum bacterial load and quality of life which weren't maintained in the 4‐week follow‐up. There were no significant | |
| Duration: 28 days. Design: placebo‐controlled phase IIa parallel RCT (stratified by baseline FEV1 (% predicted) and randomised 2:1 to Arikace™ or placebo). Location: multicentre ‐ 13 centres in Europe. | Number: 66 participants enrolled. Age: 23 adults, 25 adolescents (13 ‐ 18 years) and 18 children (6 ‐ 12 years). Gender: no details. Disease status: chronic P aeruginosa infection; baseline FEV1 (% predicted) 40 ‐ 75% in 43 participants; >75% in 23 participants. | Cohort 1: (n = 32) 280 mg Arikace™ or placebo (hypertonic saline solution (1.5% NaCl)) once daily. Inhaled with PARI eFlow® nebuliser. | Relative change in FEV1 was higher in the 560 mg group at day 28 (P = 0.033) compared to placebo. The adverse event profile was similar among Arikace™ and placebo groups. | |
| Duration: 28 days. Design: placebo‐controlled parallel RCT. Location: multicentre ‐ 17 centres in 8 countries. | Number: 62 randomised (target was 100). Age: 6 to 21 years. Gender: no details. Disease status: diagnosed with CF by at least 1 clinical feature plus sweat test, FEV1 of 25 ‐ 80% predicted. | Intervention 1: TIP (n = 32) 112 mg 2x daily. Intervention 2: placebo (n = 30) 2x daily. | Mean treatment difference in absolute change in FEV1 between TIP ‐ placebo was 4.4 % (P < 0.05). Mean treatment difference in relative change in FEV1 between TIP ‐ placebo was 5.9 % (P < 0.0.184). TIP significantly reduced sputum density. | |
| Duration: 28 days. Design: double‐blind, placebo‐controlled parallel RCT (3 arms). Location: multicentre ‐ 51 centres across USA and Europe. | Number: 151 randomised. Age: mean age 29 years. Gender: 85 males, 66 females. Disease status: diagnosed CF, chronic P aeruginosa airways infection, FEV1 between 25 ‐ 85% predicted, and 3 courses of inhaled antibiotics over the past 12 months. | Intervention 1: (n = 38) MP‐376 120 mg daily. Intervention 2: (n = 37) MP‐376 240 mg daily. Intervention 3: (n = 39) MP‐376 240 mg 2x daily. Intervention 4: (n = 37) placebo. Delivered by a customized investigational PARI eFlow nebulizer. | All doses of MP‐376 resulted in reduced sputum density at day 28 (240 mg twice a day showed a 0.96 log difference compared with placebo P = 0.001) There was a dose‐dependent increase in FEV1 for MP‐376. There was a difference of 8.7 % in FEV1 between MP‐376 240 mg twice a day and placebo (P = 0.003). There was a significant reduction in the need for other anti‐pseudomonal antibiotics compared to placebo. | |
| Duration: 28 days. Design: double‐blind, placebo‐controlled parallel RCT. Early termination due to poor recruitment. | Number: 21 randomised (planned 98). Age: 6 months ‐ 6 years. Gender: 11 males, 10 females. Disease status: positive P aeruginosa culture. | Intervention 1: (n = 8) tobramycin 300 mg 2x daily. Intervention 2: (n = 13) placebo 2x daily. | There was a significant difference between treatment groups and placebo in the reduction in P aeruginosa density (no P aeruginosa was detected at day 28 in 8 out of 8 active group patients compared to 1 out of 13 placebo patients). There were no significant differences between treatment groups for clinical indices or adverse events. | |
| Duration: 28 days (with 28‐day follow‐up). Design: placebo‐controlled parallel phase 2 RCT (stratified by baseline FEV1 (% predicted) and randomised 2:1 to Arikace™ or placebo). Location: multicentre ‐ 18 centres across USA. | Number: 46 randomised. Age: mean (SD) Arikace™ 70 mg: 33.1 (9.7) years. Arikace™ 140 mg: 35.4 (6.0) years. Placebo 70 mg and 140 mg: 24.4 (6.3) years Arikace™ 560 mg: 31.5 (14.5) years. Placebo 560 mg: 26.3 (6.7) years. Gender: 27 males, 19 females. Disease status: Cohorts 1 and 2: baseline FEV1 % predicted 40 ‐ 75% n = 16 and > 75% n = 5. Cohort 3: baseline FEV1 % predicted 40 ‐ 75% n = 19 and > 75% n = 6. More details on lung function and BMI in supplementary papers | Arikace™ or placebo (hypertonic saline (1.5% NaCl). Cohort 1: (n = 14) 70 mg Arikace™ or placebo 1x daily. Cohort 2: (n = 12) 40 mg Arikace™ or placebo 1x daily. Cohort 3: (n = 22) 560 mg Arikace™ or placebo 1x daily. Inhaled using eFlow nebulizer system (PARI Pharma GmbH). Follow‐up for 28 days after trial finish. Review of interim data in combination with data from similar European trial led to addition of Cohort 3 for a further 28 days with follow‐up of 56 days after trial finish. | Arikace™ was well tolerated at doses of 70 mg, 140 mg and 560 mg. | |
| Duration: 28 days. Design: open‐label parallel RCT (stratified by age and centre). | Number: 126 randomised, 11 withdrew before treatment, 115 treated. Age: range 7 ‐ 50 years. Gender: males 45% of total. Disease status: criteria for diagnosis abnormal sweat electrolytes, gene mutation. | Intervention 1: tobramycin 300 mg in 5 mL 2x daily, delivered by Pari LC plus nebuliser with CR50 compressor. Intervention 2: colistin 1MU in 3 mL in saline 2x daily, delivered by Ventstream nebuliser with CR50 compressor. | Tobramycin significantly improved lung function (mean improvement in FEV1 % predicted from baseline to week 4 was 6.7 % P = 0.006). The mean change in FEV1 % predicted was not significant in the colistin group (0.37 %). Both antibiotic regimes produced a significant decrease in sputum density, there was no development of highly resistant strains and the safety profile for both antibiotics was good. | |
| Duration: total of 24 weeks, 3 cycles each of 28 days on treatment followed by 28 days off treatment (only cycle 1 was double‐blind and randomised, cycles 2 and 3 were open‐label extension phases in which all participants received the same treatment). Design: double‐blind, placebo‐controlled parallel RCT. Location; multicentre ‐ 38 centres in Europe, Latin America and USA. Clinical trials identifier: NCT00125346. Known as the EVOLVE Trial. Trial terminated after showing a statistically significant benefit of TIP. | Number: 102 randomised, 95 received intended treatment, unclear in which group 7 withdrawals were from. Age: mean (SD): TIP 13.4 (4.42) years; placebo 13.2 (3.91) years. Gender: 42 males, 53 females. Disease status: baseline lung function (FEV1 % predicted) (mean (SD)): TIP 54.7 (18.89)%; placebo 58.5 (20.03)%. | Intervention 1: (n = 46) TIP 112 mg 2x daily. Intervention 2: (n = 49) placebo 2x daily. Cycle 1 (28 days on and 28 days off treatment or placebo). Cycles 2 and 3: open‐label cycles of TIP for all participants. | TIP significantly improved FEV1 % predicted from baseline to day 28 (difference 13.3, 95% CI 5.31 to 21.28 P = 0.0016). TIP reduced sputum P aeruginosa density, respiratory related hospitalisation and anti‐pseudomonal antibiotic use. The most common adverse event was cough but the frequency was higher in the placebo group (26.5 %) versus TIP (13.0%). No evidence of ototoxicity or nephrotoxicity. | |
| Duration: 4 weeks followed by a 4‐week run‐out phase. Design: double‐blind, placebo‐controlled parallel RCT. Location: multicentre ‐ 13 sites in 4 countries. | Number: 59 participants. Age: range 6 ‐ 30 years. Gender: 32 males, 27 females. Disease status: participants diagnosed with CF and P aeruginosa. | Intervention 1: tobramycin 300 mg (Bramitob®) 2x daily. Intervention 2: placebo 2x daily. Active drug and placebo both delivered by Pari LC Plus nebuliser and Pari TurboBoy compressor. | There was a significant increase in FEV1 from baseline in the tobramycin group but not in the placebo group (absolute difference 13.3% P = 0.003). Similar improvements were also seen for FVC in the tobramycin group. Adverse events were lower in the in the tobramycin group. Microbiological outcomes were significantly improved. | |
| Duration: 28 days. Design: double‐blind placebo‐controlled parallel RCT. Location: multicentre ‐ 2 centres in Germany (Jena and Tuebingen). | Number: 9 participants. Age: mean (SD): 22.4 (7.6) years; range 10.6 to 38.7 years. Gender: 6 males, 3 females. Disease status: diagnosed with CF by 2 positive sweat tests or genetic analysis (or both) and with chronic P aeruginosa colonisation. | Intervention 1: 80 mg tobramycin daily. Intervention 2: placebo (isotonic saline). Sinonasal inhalation using PARI Sinus™ compressor with a PARI LC SPRINT STAR™ nebuliser. Drug administered to each nostril for 4 minutes with the other nostril occluded, maximum volume of 1 mL per nostril. | P aeruginosa quantity decreased in 4 out of 6 (67%) participants receiving tobramycin and in none of the placebo group. Sinonasal inhalation was well tolerated. | |
| Duration: single cycle of 28 days on and 28 days off (8 weeks total duration). Design: parallel RCT (non‐inferiority trial). Location: multicentre ‐ 38 centres in Europe. Clinical trials identifier: NCT00885365. Follow‐on 48 week extension of TNS4 only: ClinicalTrials ID: NCT01111383. | Number: 406 individuals screened, 324 participants randomised. Age: mean (SD): TNS4 15.89 (6.25) years; TNS5 15.58 (7.31) years. Gender: no details. Disease status: diagnosed with CF. Chronic P aeruginosa infection and FEV1 ≥ 40% and ≤ 80% predicted. | Intervention 1: (n = 156) TNS4 (Bramitob®) 300 mg/4 mL 2x daily. Intervention 2: (n = 168) TNS5 (TOBI®) 300 mg/5 mL 2x daily. Both interventions delivered via PARI Boy N® compressor and the PARI LC Plus® nebuliser. Other standard therapies allowed. | TNS4 showed similar short‐term clinical benefits to TNS5. Adverse event reporting was similar between the 2 treatment groups. | |
| Duration: 4 weeks. Design: double‐blind, placebo‐controlled parallel RCT. Location: multicentre ‐ 56 centres in USA. | Number: 246 participants randomised; 173 completed 28‐day treatment phase; and 90 completed open‐label follow‐up for 56 days. Age: 7 to 65 years. Gender: 121 males. Disease status: documented diagnosis of CF and P aeruginosa, 3 or more courses of tobramycin in previous year, FEV1 between 25 and 75% predicted. | Intervention 1: aztreonam 75 mg for 4 weeks, 2x or 3xdaily. Intervention 2: placebo (5 mg lactose in 1mL 0.17% NaCl) for 4 weeks, 2x or 3x daily. | AZLI treatment increased the median time to need for additional anti‐pseudomonal antibiotics by 21 days compared to placebo (AZLI 92 days; placebo 71 days P = 0.007). AZLI improved mean CFQ‐R respiratory scores (P = 0.02) and sputum density (P = 0.006. Adverse events were reported in both groups but were consistent with CF lung disease. | |
| Duration: 28 days. Design: double‐blind, placebo‐controlled parallel RCT. Location: single centre in USA. | Number: 32 people with CF (31 completed). Age: mean (SD) and range ‐ TSI group 11.81 (7.46) years, 6.0 to 34.7 years; placebo group 15.86 (7.25) years, 7.4 to 28.8 years. Gender: 12 males, 20 females ‐ TSI group 6 males and 10 females, placebo group 6 males and 10 females. Disease status: CF diagnosis by sweat test or genotype testing. Colonised with P aeruginosa. Lung function FEV1 % predicted mean (SD) and range: TSI group 95.73 (17.21)%, 55.0% to 134.1%; placebo group 83.71 (21.07)%, 45.0% to 108.73%. | Intervention 1: (n = 16) TSI 5 mL (solution of 300 mg tobramycin and 11.25 mg sodium chloride in sterile water) 2x daily. Intervention 2: (n = 16) placebo (solution of 1.25 quinine sulphate in normal saline) 2x daily. Interventions both administered using PARI LC Plus™ jet nebuliser and PulmoAide compressor. | % predicted FEV1 increased slightly for both groups by mean (SD) 1.29 (3.33) for TSI and 1.17 (1.4) for placebo. | |
| Duration: 3x 28‐day periods (only results of first 28‐day parallel group comparison suitable for analysis). Design: double‐blind placebo‐controlled 3‐period cross‐over RCT. | Number: 71 participants. Age: mean (SD): 17.7 (1.25) years and 16.6 (1.24) years in 2 groups. Gender: 37 males, 34 females. Disease status: CF diagnosed by sweat test. Sputum culture of P aeruginosa susceptible to tobramycin. Mean baseline FEV1 55% (SE 3.7) and 60% (SE 3.2) predicted in 2 treatment arms. | Intervention 1: tobramycin 600 mg 3x daily for 28 days, then cross‐over for 2 further 28‐day periods. Intervention 2: placebo (0.5 normal saline) 3x daily for 28 days, then cross‐over for 2 further 28‐day periods. Delivered by Ultrasonic (Ultraneb 100/99) nebuliser with 30 mL solution and 200 inhalations. | In the first 28‐day period there was an increase in % predicted FEV1 compared to placebo (P < 0.001) and FVC (P = 0.014). There was a decrease in the density of P aeruginosa in sputum (P < 0.001). | |
| Duration: 28 days. Design: double‐blind, placebo‐controlled parallel Phase III RCT. Location: multicentre: 53 centres in USA, Canada, Australia and New Zealand. Clinical trials identifier: NCT00112359. Known as AIR‐CF1 Trial. | Number: 164 participants. Age: mean (range)): AZLI 27.4 (7 – 54) years; placebo 31.7 (11 – 74) years. Gender: 93 males, 71 females. Disease status: stable condition. P aeruginosa in sputum or throat swab. No use of anti‐pseudomonal antibiotics in previous 14 days. Baseline lung function (FEV1 % predicted) (mean (SD)): AZLI 54.4 (13.4)%; placebo 54.8 (14.0)%. | Intervention 1: AZLI 75 mg 3x daily. Intervention 2: placebo 3x daily. Doses administered at least 4 hours apart using PARI eFlow™ Electronic Nebuliser after pre‐treatment with bronchodilator. Concommitant standard CF therapies allowed except anti‐pseudomonal antibiotics, azithromycin or hypertonic saline. | AZLI improved FEV1 % predicted (P < 0.001), CFQ‐R respiratory score (P < 0.001) and sputum P aeruginosa density (P < 0.001) compared to placebo. Adverse events were comparable between groups with the exception of productive cough. This outcome was reduced by half in AZLI‐treated participants. | |
| Duration: 20 weeks in total (8 weeks intervention 1, followed by 4 week washout, followed by 8 weeks intervention 2). Design: cross‐over. Location: multicentre in Germany. | Number: 35 stated as randomised in first abstract, but 29 randomised and 24/29 as having completed in second abstract. Age: 6 years and over, mean (SD) age 19.8 (6.3) years, range 8 ‐ 35 years. Disease status: chronically infected with P aeruginosa. | Intervention 1: continuous TIS 300 mg/d 1x daily. Intervention 2: continuous TIS 300 mg/d 2x daily. | Mean FEV1 was not markedly different between treatment periods or from baseline. No audiological or nephrotoxic side effects were noted. Once or twice daily dose was shown to be safe and tolerable. | |
| Duration: 3 months in total, but only 4 weeks taking each intervention (4 weeks intervention 1, 4 weeks washout period, 4 weeks intervention 2). Design: Cross‐over. Location: multicentre in Poland. | Number: 58 randomised, 54 in ITT population Age: 4 years and older. Mean (SD) age 15.4 (6.81) years, range 7 to 36 years. Gender: 25 males, 33 females. Disease status: mean (SD) FEV1 % predicted: VANTOBRA group 63.8 (17.1)%, range 30.0% to 82.8%; TIS group 64.2 (17.7)%, range 28.0% to 83.9%. | Intervention 1 (n = 28): T100 also known as VANTOBRA (170 mg tobramycin in 1.7 mL solution) via drug‐specific eFlow nebuliser Tolero with an eBase controller 2x daily. Intervention 2 (n = 30): TOBI (300 mg tobramycin in 5 mL solution) via PARI LC Plus nebuliser with PARI BOY SX compressor 2x daily. | Treatment with both products were comparable in terms of clinical efficacy (reduction of P aeruginosa density and improvement in lung function. Safety profiles were also comparable. | |
| Duration: 28 days. Design: placebo‐controlled parallel RCT. Location: multicentre ‐ 33 sites in the USA. | Number: 119 participants randomised. Age: mean (SD)): FTI 80/20mg 35 (10.9) years; FTI 160/40mg 31 (10.2) years; placebo 31 (8.8) years. Gender: 68 males, 51 females. Disease status: lung function (FEV1 % predicted) (mean (SD)): FTI 80/20mg 50 (13.4)%; FTI 160/40mg 21 (51)%; placebo 48 (13.6)%. | Intervention 1: (n = 38) FTI 80/20 mg 2x daily. Intervention 2: (n = 41) FTI 160/40 mg 2x daily. Intervention 3: (n = 40) placebo 2x daily. | Improvements in mean FEV1 % predicted achieved in the AZLI run‐in period were maintained in the FTI group compared with placebo (P = 0.002). The treatment effect on P aeruginosa sputum density significantly favoured FTI compared to placebo. Respiratory symptoms were less common in the FTI group. | |
| Duration: 28 days. Design: placebo‐controlled parallel RCT. Location: multicentre ‐ 40 centres in USA, Canada and Australia. | Number: 160 people randomised, 157 received treatment. Age: mean (SD): AZLI 19.5 (9.1) years; placebo 18.9 (9.1) years. Gender: 90 males, 70 females. Disease status: FEV1 % predicted: AZLI 95.5 (12.7)%; placebo 94.7 (12.9)%. | Intervention 1: (n = 76; 75 analysed, 1 discontinued trial) AZLI (75 mg aztreonam, 52.5 mg lysine monohydrate diluted in 0.17% saline (1 mL)) 3x daily. Intervention 2: (n = 81) placebo (5 mg lactose, 7.3 mg NaCl diluted in 0.17% saline (1 mL)) 3x daily. Both interventions self‐administered with the investigational eFlow® electronic nebulizer (PARI GmbH, Starnberg, Germany). | Treatment effect at 28 days for relative FEV1 % predicted was 2.7 % (P = 0.021 favouring AZLI). Treatment effect for CFQ‐R respiratory symptom score at day 28 was modest at 1.8 points (95% CI ‐2.8 to 6.4 P = 0.443). Sputum density was improved in the AZLI group (P = 0.016). | |
| AZLI: aztreonam lysine for inhalation | ||||
| Outcome or subgroup title | No. of studies | No. of participants | Statistical method | Effect size |
| 1 Mean absolute FEV1 (% predicted) Show forest plot | 2 | Mean Difference (IV, Fixed, 95% CI) | Subtotals only | |
| 1.1 At 3 months | 1 | 29 | Mean Difference (IV, Fixed, 95% CI) | ‐2.0 [‐22.41, 18.41] |
| 1.2 Over 3 months and up to 12 months | 1 | 245 | Mean Difference (IV, Fixed, 95% CI) | 3.10 [‐2.35, 8.55] |
| 2 Mean change in FEV1 (% predicted) Show forest plot | 1 | Mean Difference (IV, Fixed, 95% CI) | Subtotals only | |
| 2.1 At 3 months | 1 | 29 | Mean Difference (IV, Fixed, 95% CI) | 6.0 [‐1.07, 13.07] |
| 3 Mean change in % predicted FEV1 Show forest plot | 1 | Mean Difference (Fixed, 95% CI) | Subtotals only | |
| 3.1 Over 3 months and up to 12 months | 1 | Mean Difference (Fixed, 95% CI) | 6.38 [2.94, 9.82] | |
| 4 Rate of change of FEV1 (% predicted per year) Show forest plot | 1 | Mean Difference (IV, Fixed, 95% CI) | Subtotals only | |
| 4.1 Over 24 months and up to 36 months | 1 | 27 | Mean Difference (IV, Fixed, 95% CI) | 7.8 [3.29, 12.31] |
| 5 Mean absolute FVC (% predicted) at end of treatment Show forest plot | 1 | Mean Difference (IV, Fixed, 95% CI) | Subtotals only | |
| 5.1 At 1 to 3 months | 1 | 29 | Mean Difference (IV, Fixed, 95% CI) | 8.0 [‐12.18, 28.18] |
| 6 Mean change in FVC (% predicted) Show forest plot | 2 | Mean Difference (IV, Fixed, 95% CI) | Subtotals only | |
| 6.1 At 1 to 3 months | 1 | 29 | Mean Difference (IV, Fixed, 95% CI) | 11.0 [1.94, 20.06] |
| 6.2 Over 3 months and up to 12 months | 1 | 245 | Mean Difference (IV, Fixed, 95% CI) | 4.60 [1.01, 8.19] |
| 7 Rate of change of FVC (% predicted per year) Show forest plot | 1 | Mean Difference (IV, Fixed, 95% CI) | Subtotals only | |
| 7.1 Over 24 months and up to 36 months | 1 | 27 | Mean Difference (IV, Fixed, 95% CI) | 5.40 [0.86, 9.94] |
| 8 Frequency of one or more hospital admissions Show forest plot | 4 | Risk Ratio (M‐H, Random, 95% CI) | Subtotals only | |
| 8.1 Over 3 months and up to 12 months | 3 | 946 | Risk Ratio (M‐H, Random, 95% CI) | 0.66 [0.47, 0.93] |
| 8.2 Over 12 months and up to 24 months | 1 | 181 | Risk Ratio (M‐H, Random, 95% CI) | 0.59 [0.34, 1.05] |
| 8.3 Over 24 months and up to 36 months | 1 | 27 | Risk Ratio (M‐H, Random, 95% CI) | 0.8 [0.39, 1.65] |
| 9 Hospital admissions, mean number of days in hospital Show forest plot | 1 | Mean Difference (IV, Fixed, 95% CI) | Subtotals only | |
| 9.1 Over 24 months and up to 36 months | 1 | 27 | Mean Difference (IV, Fixed, 95% CI) | ‐3.20 [‐9.04, 2.64] |
| 10 Frequency of one or more courses of intravenous antibiotics Show forest plot | 3 | Risk Ratio (M‐H, Fixed, 95% CI) | Subtotals only | |
| 10.1 Over 3 months and up to 12 months | 2 | 765 | Risk Ratio (M‐H, Fixed, 95% CI) | 0.77 [0.67, 0.88] |
| 10.2 Over 12 months and up to 24 months | 1 | 175 | Risk Ratio (M‐H, Fixed, 95% CI) | 0.62 [0.35, 1.08] |
| 11 Pulmonary exacerbations Show forest plot | 1 | Risk Ratio (M‐H, Fixed, 95% CI) | Subtotals only | |
| 11.1 Over 3 months and up to 12 months | 1 | 245 | Risk Ratio (M‐H, Fixed, 95% CI) | 0.78 [0.59, 1.03] |
| 12 Lost school or working days Show forest plot | 1 | Mean Difference (IV, Fixed, 95% CI) | Subtotals only | |
| 12.1 Over 3 months and up to 12 months | 1 | 245 | Mean Difference (IV, Fixed, 95% CI) | ‐5.3 [‐8.59, ‐2.01] |
| 13 Deaths Show forest plot | 3 | Risk Ratio (M‐H, Fixed, 95% CI) | Subtotals only | |
| 13.1 Over 3 months and up to 12 months | 2 | 767 | Risk Ratio (M‐H, Fixed, 95% CI) | 0.17 [0.03, 1.09] |
| 13.2 Over 24 months and up to 36 months | 1 | 27 | Risk Ratio (M‐H, Fixed, 95% CI) | 0.27 [0.01, 6.11] |
| 14 Frequency of tobramycin‐resistant P. aeruginosa at end of study Show forest plot | 3 | Risk Ratio (M‐H, Random, 95% CI) | Subtotals only | |
| 14.1 Over 3 months and up to 12 months | 2 | 672 | Risk Ratio (M‐H, Random, 95% CI) | 1.95 [0.86, 4.42] |
| 14.2 Over 24 months and up to 36 months | 1 | 26 | Risk Ratio (M‐H, Random, 95% CI) | 7.80 [0.46, 131.62] |
| 15 Frequency of new isolates of drug resistant organisms (at end of study) Show forest plot | 2 | Risk Ratio (M‐H, Fixed, 95% CI) | Subtotals only | |
| 15.1 Burkholderia cepacia | 2 | 536 | Risk Ratio (M‐H, Fixed, 95% CI) | 0.26 [0.03, 1.99] |
| 15.2 Stenotrophomonas maltophilia | 1 | 520 | Risk Ratio (M‐H, Fixed, 95% CI) | 3.05 [0.32, 29.10] |
| 15.3 Alcaligenes xylosoxidans | 1 | 520 | Risk Ratio (M‐H, Fixed, 95% CI) | 1.02 [0.06, 16.15] |
| 15.4 Aspergillus species | 1 | 389 | Risk Ratio (M‐H, Fixed, 95% CI) | 2.12 [1.29, 3.46] |
| 16 Number experiencing adverse event (at end of study) Show forest plot | 4 | Risk Ratio (M‐H, Random, 95% CI) | Subtotals only | |
| 16.1 Auditory impairment | 4 | 540 | Risk Ratio (M‐H, Random, 95% CI) | 0.0 [0.0, 0.0] |
| 16.2 Tinnitus | 1 | 520 | Risk Ratio (M‐H, Random, 95% CI) | 17.26 [1.00, 297.54] |
| 16.3 Voice alteration | 2 | 701 | Risk Ratio (M‐H, Random, 95% CI) | 2.66 [1.14, 6.25] |
| 16.4 Pneumothorax | 1 | 520 | Risk Ratio (M‐H, Random, 95% CI) | 0.25 [0.03, 2.26] |
| 16.5 Hemoptysis | 1 | 520 | Risk Ratio (M‐H, Random, 95% CI) | 0.87 [0.66, 1.13] |
| Outcome or subgroup title | No. of studies | No. of participants | Statistical method | Effect size |
| 1 Number of pulmonary exacerbations Show forest plot | 1 | Risk Ratio (M‐H, Fixed, 95% CI) | Totals not selected | |
| 1.1 Over 3 months and up to 12 months | 1 | Risk Ratio (M‐H, Fixed, 95% CI) | 0.0 [0.0, 0.0] | |
| 2 Time to first pulmonary exacerbation Show forest plot | 1 | Mean Difference (IV, Fixed, 95% CI) | Totals not selected | |
| 2.1 Over 3 months and up to 12 months | 1 | Mean Difference (IV, Fixed, 95% CI) | 0.0 [0.0, 0.0] | |
| 3 Deaths Show forest plot | 1 | Risk Ratio (M‐H, Fixed, 95% CI) | Totals not selected | |
| 3.1 Over 3 months and up to 12 months | 1 | Risk Ratio (M‐H, Fixed, 95% CI) | 0.0 [0.0, 0.0] | |
| 4 Adverse events (at end of study) Show forest plot | 1 | Risk Ratio (M‐H, Fixed, 95% CI) | Subtotals only | |
| 4.1 Total adverse events | 1 | 379 | Risk Ratio (M‐H, Fixed, 95% CI) | 1.06 [0.99, 1.12] |
| 4.2 Treatment‐related adverse events | 1 | 379 | Risk Ratio (M‐H, Fixed, 95% CI) | 1.76 [1.50, 2.08] |
| 4.3 Mild adverse events | 1 | 379 | Risk Ratio (M‐H, Fixed, 95% CI) | 1.00 [0.92, 1.09] |
| 4.4 Moderate adverse events | 1 | 379 | Risk Ratio (M‐H, Fixed, 95% CI) | 1.32 [1.11, 1.57] |
| 4.5 Severe adverse events | 1 | 379 | Risk Ratio (M‐H, Fixed, 95% CI) | 3.83 [2.15, 6.83] |
| Outcome or subgroup title | No. of studies | No. of participants | Statistical method | Effect size |
| 1 FEV1 % predicted Show forest plot | 1 | Mean Difference (Fixed, 95% CI) | Totals not selected | |
| 1.1 At 1 to 3 months | 1 | Mean Difference (Fixed, 95% CI) | 0.0 [0.0, 0.0] | |
| 2 FVC Show forest plot | 1 | Mean Difference (Fixed, 95% CI) | Totals not selected | |
| 2.1 At 1 to 3 months | 1 | Mean Difference (Fixed, 95% CI) | 0.0 [0.0, 0.0] | |
| Outcome or subgroup title | No. of studies | No. of participants | Statistical method | Effect size |
| 1 FEV1 (% predicted) relative change Show forest plot | 1 | Mean Difference (Fixed, 95% CI) | Totals not selected | |
| 1.1 Over 3 months and up to 12 months | 1 | Mean Difference (Fixed, 95% CI) | 0.0 [0.0, 0.0] | |
| 2 Hospitalisations Show forest plot | 1 | Risk Ratio (M‐H, Fixed, 95% CI) | Totals not selected | |
| 2.1 Over 3 months and up to 12 months | 1 | Risk Ratio (M‐H, Fixed, 95% CI) | 0.0 [0.0, 0.0] | |
| 3 Pulmonary exacerbations Show forest plot | 1 | Risk Ratio (M‐H, Fixed, 95% CI) | Totals not selected | |
| 3.1 Over 3 months and up to 12 months | 1 | Risk Ratio (M‐H, Fixed, 95% CI) | 0.0 [0.0, 0.0] | |
| 4 Deaths Show forest plot | 1 | Risk Ratio (M‐H, Fixed, 95% CI) | Totals not selected | |
| 5 Adverse events (at end of study) Show forest plot | 1 | Risk Ratio (M‐H, Fixed, 95% CI) | Totals not selected | |
| 5.1 Any adverse event | 1 | Risk Ratio (M‐H, Fixed, 95% CI) | 0.0 [0.0, 0.0] | |
| 5.2 Bronchospasm | 1 | Risk Ratio (M‐H, Fixed, 95% CI) | 0.0 [0.0, 0.0] | |
| 5.3 Cough | 1 | Risk Ratio (M‐H, Fixed, 95% CI) | 0.0 [0.0, 0.0] | |
| 5.4 Productive cough | 1 | Risk Ratio (M‐H, Fixed, 95% CI) | 0.0 [0.0, 0.0] | |
| 5.5 Dyspnoea | 1 | Risk Ratio (M‐H, Fixed, 95% CI) | 0.0 [0.0, 0.0] | |
| 5.6 Pyrexia | 1 | Risk Ratio (M‐H, Fixed, 95% CI) | 0.0 [0.0, 0.0] | |
| 5.7 Oropharyngeal pain | 1 | Risk Ratio (M‐H, Fixed, 95% CI) | 0.0 [0.0, 0.0] | |
| 5.8 Dysphonia (hoarseness) | 1 | Risk Ratio (M‐H, Fixed, 95% CI) | 0.0 [0.0, 0.0] | |
| 5.9 Haemoptysis | 1 | Risk Ratio (M‐H, Fixed, 95% CI) | 0.0 [0.0, 0.0] | |
| 5.10 Headache | 1 | Risk Ratio (M‐H, Fixed, 95% CI) | 0.0 [0.0, 0.0] | |
| 5.11 Nasal congestion | 1 | Risk Ratio (M‐H, Fixed, 95% CI) | 0.0 [0.0, 0.0] | |
| 5.12 Nausea | 1 | Risk Ratio (M‐H, Fixed, 95% CI) | 0.0 [0.0, 0.0] | |
| 5.13 Rales | 1 | Risk Ratio (M‐H, Fixed, 95% CI) | 0.0 [0.0, 0.0] | |
| 5.14 Rhinorrhea | 1 | Risk Ratio (M‐H, Fixed, 95% CI) | 0.0 [0.0, 0.0] | |
| 5.15 Pulmonary function test decreased | 1 | Risk Ratio (M‐H, Fixed, 95% CI) | 0.0 [0.0, 0.0] | |
| 5.16 Upper respiratory tract infection | 1 | Risk Ratio (M‐H, Fixed, 95% CI) | 0.0 [0.0, 0.0] | |
| 5.17 Wheezing | 1 | Risk Ratio (M‐H, Fixed, 95% CI) | 0.0 [0.0, 0.0] | |
| 5.18 Chest discomfort | 1 | Risk Ratio (M‐H, Fixed, 95% CI) | 0.0 [0.0, 0.0] | |
| 5.19 Fatigue | 1 | Risk Ratio (M‐H, Fixed, 95% CI) | 0.0 [0.0, 0.0] | |
| 5.20 Vomiting | 1 | Risk Ratio (M‐H, Fixed, 95% CI) | 0.0 [0.0, 0.0] | |
| 5.21 Sinusitis | 1 | Risk Ratio (M‐H, Fixed, 95% CI) | 0.0 [0.0, 0.0] | |
| 5.22 Pulmonary congestion | 1 | Risk Ratio (M‐H, Fixed, 95% CI) | 0.0 [0.0, 0.0] | |
| Outcome or subgroup title | No. of studies | No. of participants | Statistical method | Effect size |
| 1 FEV1 % predicted ‐ mean relative change from baseline Show forest plot | 1 | Mean Difference (Fixed, 95% CI) | Totals not selected | |
| 1.1 At Week 24 (average across 3 cycles) | 1 | Mean Difference (Fixed, 95% CI) | 0.0 [0.0, 0.0] | |
| 2 FEV1 % predicted ‐ mean actual change from baseline Show forest plot | 1 | Mean Difference (IV, Fixed, 95% CI) | Totals not selected | |
| 2.1 At Week 24 (averaged across 3 cycles) | 1 | Mean Difference (IV, Fixed, 95% CI) | 0.0 [0.0, 0.0] | |
| 3 Need for additional antibiotics Show forest plot | 1 | Risk Ratio (M‐H, Fixed, 95% CI) | Totals not selected | |
| 3.1 At Week 24 | 1 | Risk Ratio (M‐H, Fixed, 95% CI) | 0.0 [0.0, 0.0] | |
| 4 Number of days of additional antibiotics Show forest plot | 1 | Mean Difference (IV, Fixed, 95% CI) | Totals not selected | |
| 4.1 At Week 24 | 1 | Mean Difference (IV, Fixed, 95% CI) | 0.0 [0.0, 0.0] | |
| 5 Weight (relative change from baseline) Show forest plot | 1 | Mean Difference (IV, Fixed, 95% CI) | Totals not selected | |
| 5.1 At Week 24 | 1 | Mean Difference (IV, Fixed, 95% CI) | 0.0 [0.0, 0.0] | |
| 6 Quality of Life ‐ CFQR respiratory symptom scale Show forest plot | 1 | Mean Difference (IV, Fixed, 95% CI) | Totals not selected | |
| 6.1 At Week 24 (average across 3 cycles) | 1 | Mean Difference (IV, Fixed, 95% CI) | 0.0 [0.0, 0.0] | |
| 7 TSQM ‐ effectiveness Show forest plot | 1 | Mean Difference (IV, Fixed, 95% CI) | Totals not selected | |
| 7.1 At week 24 (average across 3 cycles) | 1 | Mean Difference (IV, Fixed, 95% CI) | 0.0 [0.0, 0.0] | |
| 8 TSQM ‐ global satisfaction Show forest plot | 1 | Mean Difference (IV, Fixed, 95% CI) | Totals not selected | |
| 8.1 At Week 24 | 1 | Mean Difference (IV, Fixed, 95% CI) | 0.0 [0.0, 0.0] | |
| 9 TSQM ‐ side effects Show forest plot | 1 | Mean Difference (IV, Fixed, 95% CI) | Totals not selected | |
| 9.1 At Week 24 | 1 | Mean Difference (IV, Fixed, 95% CI) | 0.0 [0.0, 0.0] | |
| 10 TSQM ‐ convenience Show forest plot | 1 | Mean Difference (IV, Fixed, 95% CI) | Totals not selected | |
| 10.1 At Week 24 | 1 | Mean Difference (IV, Fixed, 95% CI) | 0.0 [0.0, 0.0] | |
| 11 Log10Pseudomonas aeruginosa CFU/g sputum Show forest plot | 1 | Mean Difference (IV, Fixed, 95% CI) | Totals not selected | |
| 11.1 At Week 24 (average across 3 cycles) | 1 | Mean Difference (IV, Fixed, 95% CI) | 0.0 [0.0, 0.0] | |
| 12 Adverse events (at end of study) Show forest plot | 1 | Risk Ratio (M‐H, Fixed, 95% CI) | Subtotals only | |
| 12.1 Treatment‐related adverse events | 1 | 268 | Risk Ratio (M‐H, Fixed, 95% CI) | 1.77 [1.03, 3.04] |
| 12.2 Serious adverse events | 1 | 268 | Risk Ratio (M‐H, Fixed, 95% CI) | 1.94 [0.98, 3.84] |
| 12.3 Cough | 1 | 268 | Risk Ratio (M‐H, Fixed, 95% CI) | 0.90 [0.78, 1.03] |
| 12.4 Productive cough | 1 | 268 | Risk Ratio (M‐H, Fixed, 95% CI) | 0.86 [0.69, 1.07] |
| 12.5 Pyrexia | 1 | 268 | Risk Ratio (M‐H, Fixed, 95% CI) | 1.04 [0.73, 1.49] |
| 12.6 Oropharyngeal pain | 1 | 268 | Risk Ratio (M‐H, Fixed, 95% CI) | 0.94 [0.64, 1.40] |
| 12.7 Dyspnoea | 1 | 268 | Risk Ratio (M‐H, Fixed, 95% CI) | 0.86 [0.57, 1.30] |
| 12.8 Haemoptysis | 1 | 268 | Risk Ratio (M‐H, Fixed, 95% CI) | 1.43 [0.87, 2.36] |
| 12.9 Rales | 1 | 268 | Risk Ratio (M‐H, Fixed, 95% CI) | 0.83 [0.54, 1.27] |
| 12.10 Headache | 1 | 268 | Risk Ratio (M‐H, Fixed, 95% CI) | 1.04 [0.65, 1.66] |
| 12.11 Nasal congestion | 1 | 268 | Risk Ratio (M‐H, Fixed, 95% CI) | 1.08 [0.68, 1.74] |
| 12.12 Rhinorrhea | 1 | 268 | Risk Ratio (M‐H, Fixed, 95% CI) | 0.74 [0.46, 1.17] |
| 12.13 Exercise tolerance decreased | 1 | 268 | Risk Ratio (M‐H, Fixed, 95% CI) | 0.90 [0.55, 1.46] |
| 12.14 Fatigue | 1 | 268 | Risk Ratio (M‐H, Fixed, 95% CI) | 0.93 [0.56, 1.55] |
| 12.15 Decreased appetite | 1 | 268 | Risk Ratio (M‐H, Fixed, 95% CI) | 0.97 [0.54, 1.75] |
| 12.16 Abdominal pain | 1 | 268 | Risk Ratio (M‐H, Fixed, 95% CI) | 2.18 [0.98, 4.85] |
| 12.17 Respiratory tract congestion | 1 | 268 | Risk Ratio (M‐H, Fixed, 95% CI) | 0.82 [0.44, 1.52] |
| 12.18 Wheezing | 1 | 268 | Risk Ratio (M‐H, Fixed, 95% CI) | 0.78 [0.42, 1.43] |
| 12.19 Chest discomfort | 1 | 268 | Risk Ratio (M‐H, Fixed, 95% CI) | 1.05 [0.51, 2.14] |
| 12.20 Nausea | 1 | 268 | Risk Ratio (M‐H, Fixed, 95% CI) | 1.36 [0.63, 2.95] |
| 12.21 Vomiting | 1 | 268 | Risk Ratio (M‐H, Fixed, 95% CI) | 0.97 [0.48, 1.96] |
| 12.22 Pulmonary function decreased | 1 | 268 | Risk Ratio (M‐H, Fixed, 95% CI) | 0.63 [0.31, 1.29] |
| 12.23 Breath sounds abnormal | 1 | 268 | Risk Ratio (M‐H, Fixed, 95% CI) | 0.52 [0.23, 1.18] |
| Outcome or subgroup title | No. of studies | No. of participants | Statistical method | Effect size |
| 1 Absolute change in FEV1 % predicted Show forest plot | 1 | Mean Difference (IV, Fixed, 95% CI) | Totals not selected | |
| 1.1 At three months | 1 | Mean Difference (IV, Fixed, 95% CI) | 0.0 [0.0, 0.0] | |
| 1.2 Over 3 months and up to 12 months | 1 | Mean Difference (IV, Fixed, 95% CI) | 0.0 [0.0, 0.0] | |
| 2 Relative change in FEV1 % predicted Show forest plot | 1 | Mean Difference (IV, Fixed, 95% CI) | Totals not selected | |
| 2.1 At three months | 1 | Mean Difference (IV, Fixed, 95% CI) | 0.0 [0.0, 0.0] | |
| 2.2 Over 3 months and up to 12 months | 1 | Mean Difference (IV, Fixed, 95% CI) | 0.0 [0.0, 0.0] | |
| 3 Absolute change in FVC % predicted Show forest plot | 1 | Mean Difference (IV, Fixed, 95% CI) | Totals not selected | |
| 3.1 At three months | 1 | Mean Difference (IV, Fixed, 95% CI) | 0.0 [0.0, 0.0] | |
| 3.2 Over 3 months and up to 12 months | 1 | Mean Difference (IV, Fixed, 95% CI) | 0.0 [0.0, 0.0] | |
| 4 Relative change in FVC % predicted Show forest plot | 1 | Mean Difference (IV, Fixed, 95% CI) | Totals not selected | |
| 4.1 At three months | 1 | Mean Difference (IV, Fixed, 95% CI) | 0.0 [0.0, 0.0] | |
| 4.2 Over 3 months and up to 12 months | 1 | Mean Difference (IV, Fixed, 95% CI) | 0.0 [0.0, 0.0] | |
| 5 Hospitalisations due to respiratory exacerbations Show forest plot | 1 | Risk Ratio (M‐H, Fixed, 95% CI) | Totals not selected | |
| 5.1 Over 3 months and up to 12 months | 1 | Risk Ratio (M‐H, Fixed, 95% CI) | 0.0 [0.0, 0.0] | |
| 6 Weight decrease Show forest plot | 1 | Risk Ratio (M‐H, Fixed, 95% CI) | Totals not selected | |
| 6.1 Over 3 months and up to 12 months | 1 | Risk Ratio (M‐H, Fixed, 95% CI) | 0.0 [0.0, 0.0] | |
| 7 Change in P aeruginosa sputum density (log10 CFU/g) Show forest plot | 1 | Mean Difference (IV, Fixed, 95% CI) | Totals not selected | |
| 7.1 Over 3 months and up to 12 months | 1 | Mean Difference (IV, Fixed, 95% CI) | 0.0 [0.0, 0.0] | |
| 8 Adverse events (at end of study) Show forest plot | 1 | Risk Ratio (M‐H, Fixed, 95% CI) | Totals not selected | |
| 8.1 Cough | 1 | Risk Ratio (M‐H, Fixed, 95% CI) | 0.0 [0.0, 0.0] | |
| 8.2 Increased sputum | 1 | Risk Ratio (M‐H, Fixed, 95% CI) | 0.0 [0.0, 0.0] | |
| 8.3 Respiratory tract congestion | 1 | Risk Ratio (M‐H, Fixed, 95% CI) | 0.0 [0.0, 0.0] | |
| 8.4 Increased viscosity of bronchial secretions | 1 | Risk Ratio (M‐H, Fixed, 95% CI) | 0.0 [0.0, 0.0] | |
| 8.5 Paranasal sinus hypersecretion | 1 | Risk Ratio (M‐H, Fixed, 95% CI) | 0.0 [0.0, 0.0] | |
| 8.6 Haemoptysis | 1 | Risk Ratio (M‐H, Fixed, 95% CI) | 0.0 [0.0, 0.0] | |
| 8.7 Discoloured sputum | 1 | Risk Ratio (M‐H, Fixed, 95% CI) | 0.0 [0.0, 0.0] | |
| 8.8 Exertional dyspnoea | 1 | Risk Ratio (M‐H, Fixed, 95% CI) | 0.0 [0.0, 0.0] | |
| 8.9 Rales | 1 | Risk Ratio (M‐H, Fixed, 95% CI) | 0.0 [0.0, 0.0] | |
| 8.10 Dyspnoea | 1 | Risk Ratio (M‐H, Fixed, 95% CI) | 0.0 [0.0, 0.0] | |
| 8.11 Oropharyngeal pain | 1 | Risk Ratio (M‐H, Fixed, 95% CI) | 0.0 [0.0, 0.0] | |
| 8.12 Epistaxis | 1 | Risk Ratio (M‐H, Fixed, 95% CI) | 0.0 [0.0, 0.0] | |
| 8.13 Disease progression | 1 | Risk Ratio (M‐H, Fixed, 95% CI) | 0.0 [0.0, 0.0] | |
| 8.14 Fatigue | 1 | Risk Ratio (M‐H, Fixed, 95% CI) | 0.0 [0.0, 0.0] | |
| 8.15 Decreased exercise tolerance | 1 | Risk Ratio (M‐H, Fixed, 95% CI) | 0.0 [0.0, 0.0] | |
| 8.16 Pyrexia | 1 | Risk Ratio (M‐H, Fixed, 95% CI) | 0.0 [0.0, 0.0] | |
| 8.17 Malaise | 1 | Risk Ratio (M‐H, Fixed, 95% CI) | 0.0 [0.0, 0.0] | |
| 8.18 Increase in blood glucose | 1 | Risk Ratio (M‐H, Fixed, 95% CI) | 0.0 [0.0, 0.0] | |
| 8.19 Dysgeusia | 1 | Risk Ratio (M‐H, Fixed, 95% CI) | 0.0 [0.0, 0.0] | |
| 8.20 Sinus headache | 1 | Risk Ratio (M‐H, Fixed, 95% CI) | 0.0 [0.0, 0.0] | |
| 8.21 Headache | 1 | Risk Ratio (M‐H, Fixed, 95% CI) | 0.0 [0.0, 0.0] | |
| 8.22 Nasopharyngitis | 1 | Risk Ratio (M‐H, Fixed, 95% CI) | 0.0 [0.0, 0.0] | |
| 8.23 Sinusitis | 1 | Risk Ratio (M‐H, Fixed, 95% CI) | 0.0 [0.0, 0.0] | |
| 8.24 Upper respiratory tract infection | 1 | Risk Ratio (M‐H, Fixed, 95% CI) | 0.0 [0.0, 0.0] | |
| 8.25 Abdominal pain | 1 | Risk Ratio (M‐H, Fixed, 95% CI) | 0.0 [0.0, 0.0] | |
| 8.26 Nausea | 1 | Risk Ratio (M‐H, Fixed, 95% CI) | 0.0 [0.0, 0.0] | |
| 8.27 Arthralgia | 1 | Risk Ratio (M‐H, Fixed, 95% CI) | 0.0 [0.0, 0.0] | |
| 8.28 Decreased appetite | 1 | Risk Ratio (M‐H, Fixed, 95% CI) | 0.0 [0.0, 0.0] | |
| 8.29 Rash | 1 | Risk Ratio (M‐H, Fixed, 95% CI) | 0.0 [0.0, 0.0] | |
| Outcome or subgroup title | No. of studies | No. of participants | Statistical method | Effect size |
| 1 Mean change from baseline ‐ FEV1 % predicted Show forest plot | 1 | Mean Difference (Fixed, 95% CI) | Subtotals only | |
| 1.1 Over 3 months and up to 12 months (values from end of 3 cycles averaged) | 1 | Mean Difference (Fixed, 95% CI) | 1.33 [‐0.51, 3.17] | |
| 2 Rate of hospitalisation per participant year Show forest plot | 1 | 90 | Risk Ratio (M‐H, Fixed, 95% CI) | 0.62 [0.35, 1.11] |
| 2.1 Over 3 months and up to 12 months | 1 | 90 | Risk Ratio (M‐H, Fixed, 95% CI) | 0.62 [0.35, 1.11] |
| 3 Need for additional antibiotics for an exacerbation Show forest plot | 1 | 90 | Risk Ratio (M‐H, Fixed, 95% CI) | 0.88 [0.59, 1.32] |
| 3.1 Over 3 months and up to 12 months | 1 | 90 | Risk Ratio (M‐H, Fixed, 95% CI) | 0.88 [0.59, 1.32] |
| 4 Rate of protocol defined pulmonary exacerbations per participant year Show forest plot | 1 | 90 | Risk Ratio (M‐H, Fixed, 95% CI) | 0.71 [0.43, 1.18] |
| 4.1 Over 3 months and up to 12 months | 1 | 90 | Risk Ratio (M‐H, Fixed, 95% CI) | 0.71 [0.43, 1.18] |
| 5 Quality of life ‐ CFQ‐R respiratory symptom score Show forest plot | 1 | Mean Difference (Fixed, 95% CI) | 3.06 [‐1.61, 7.73] | |
| 5.1 Over 3 months and up to 12 months | 1 | Mean Difference (Fixed, 95% CI) | 3.06 [‐1.61, 7.73] | |
| 6 Incidence of other respiratory pathogens (at end of study) Show forest plot | 1 | Risk Ratio (M‐H, Fixed, 95% CI) | Subtotals only | |
| 6.1 P aeruginosa | 1 | 87 | Risk Ratio (M‐H, Fixed, 95% CI) | 1.00 [0.94, 1.06] |
| 6.2 Achromobacter species | 1 | 87 | Risk Ratio (M‐H, Fixed, 95% CI) | 1.29 [0.42, 3.90] |
| 6.3 Stenotrophomonas maltophilia | 1 | 87 | Risk Ratio (M‐H, Fixed, 95% CI) | 0.88 [0.40, 1.90] |
| 6.4 Aspergillus spp. | 1 | 87 | Risk Ratio (M‐H, Fixed, 95% CI) | 0.65 [0.35, 1.22] |
| 6.5 MRSA | 1 | 87 | Risk Ratio (M‐H, Fixed, 95% CI) | 0.65 [0.35, 1.22] |
| 6.6 Burkholderia spp. | 1 | 87 | Risk Ratio (M‐H, Fixed, 95% CI) | 3.21 [0.13, 76.67] |
| 6.7 MSSA | 1 | 76 | Risk Ratio (M‐H, Fixed, 95% CI) | 0.68 [0.35, 1.33] |
| 7 Adverse events (at end of study) Show forest plot | 1 | Risk Ratio (M‐H, Fixed, 95% CI) | Subtotals only | |
| 7.1 Any comparative phase adverse event | 1 | 88 | Risk Ratio (M‐H, Fixed, 95% CI) | 0.97 [0.90, 1.05] |
| 7.2 Adverse events grade 1‐2 severity | 1 | 88 | Risk Ratio (M‐H, Fixed, 95% CI) | 1.10 [0.23, 5.13] |
| 7.3 Adverse events grade 3‐4 severity | 1 | 88 | Risk Ratio (M‐H, Fixed, 95% CI) | 1.02 [0.54, 1.91] |
| 7.4 Serious adverse events | 1 | 88 | Risk Ratio (M‐H, Fixed, 95% CI) | 0.96 [0.64, 1.44] |
| 8 Treatment‐emergent adverse events (at end of study) Show forest plot | 1 | Risk Ratio (M‐H, Fixed, 95% CI) | Subtotals only | |
| 8.1 Cough | 1 | 88 | Risk Ratio (M‐H, Fixed, 95% CI) | 1.06 [0.83, 1.36] |
| 8.2 Sputum increased | 1 | 88 | Risk Ratio (M‐H, Fixed, 95% CI) | 0.71 [0.49, 1.03] |
| 8.3 Dyspnoea | 1 | 88 | Risk Ratio (M‐H, Fixed, 95% CI) | 0.59 [0.35, 1.01] |
| 8.4 Fatigue | 1 | 88 | Risk Ratio (M‐H, Fixed, 95% CI) | 0.71 [0.38, 1.33] |
| 8.5 Haemoptysis | 1 | 88 | Risk Ratio (M‐H, Fixed, 95% CI) | 1.10 [0.53, 2.26] |
| 8.6 Nasal congestion | 1 | 88 | Risk Ratio (M‐H, Fixed, 95% CI) | 3.01 [1.04, 8.74] |
| 8.7 Pulmonary function test decreased | 1 | 88 | Risk Ratio (M‐H, Fixed, 95% CI) | 1.20 [0.57, 2.54] |
| 8.8 Respiratory tract congestion | 1 | 88 | Risk Ratio (M‐H, Fixed, 95% CI) | 1.10 [0.53, 2.26] |
| 8.9 Infective pulmonary exacerbation of CF | 1 | 88 | Risk Ratio (M‐H, Fixed, 95% CI) | 2.19 [0.82, 5.89] |
| 8.10 Lung disorder | 1 | 88 | Risk Ratio (M‐H, Fixed, 95% CI) | 0.76 [0.36, 1.59] |
| 8.11 Wheezing | 1 | 88 | Risk Ratio (M‐H, Fixed, 95% CI) | 1.10 [0.48, 2.50] |
| 8.12 Chest discomfort | 1 | 88 | Risk Ratio (M‐H, Fixed, 95% CI) | 0.67 [0.31, 1.46] |
| 8.13 Pyrexia | 1 | 88 | Risk Ratio (M‐H, Fixed, 95% CI) | 0.67 [0.31, 1.46] |
| 8.14 Headache | 1 | 88 | Risk Ratio (M‐H, Fixed, 95% CI) | 0.96 [0.38, 2.41] |
| 8.15 Diarrhoea | 1 | 88 | Risk Ratio (M‐H, Fixed, 95% CI) | 1.31 [0.43, 3.99] |
| 8.16 Nausea | 1 | 88 | Risk Ratio (M‐H, Fixed, 95% CI) | 0.66 [0.26, 1.65] |
| 8.17 Oropharyngeal pain | 1 | 88 | Risk Ratio (M‐H, Fixed, 95% CI) | 1.31 [0.43, 3.99] |
| 8.18 Decreased Appetite | 1 | 88 | Risk Ratio (M‐H, Fixed, 95% CI) | 0.34 [0.14, 0.85] |
| 8.19 Dyspnoea exertional | 1 | 88 | Risk Ratio (M‐H, Fixed, 95% CI) | 2.74 [0.56, 13.37] |
| 8.20 Rhinorrhoea | 1 | 88 | Risk Ratio (M‐H, Fixed, 95% CI) | 0.68 [0.24, 1.93] |
| 8.21 Sputum discoloured | 1 | 88 | Risk Ratio (M‐H, Fixed, 95% CI) | 1.83 [0.46, 7.18] |
| 8.22 Vomiting | 1 | 88 | Risk Ratio (M‐H, Fixed, 95% CI) | 0.61 [0.22, 1.67] |
| 8.23 Chest pain | 1 | 88 | Risk Ratio (M‐H, Fixed, 95% CI) | 0.63 [0.20, 1.99] |
| 8.24 Weight decreased | 1 | 88 | Risk Ratio (M‐H, Fixed, 95% CI) | 0.88 [0.25, 3.05] |
| 8.25 Chills | 1 | 88 | Risk Ratio (M‐H, Fixed, 95% CI) | 0.66 [0.17, 2.58] |
| 8.26 Exercise tolerance decreased | 1 | 88 | Risk Ratio (M‐H, Fixed, 95% CI) | 0.27 [0.08, 0.90] |
| 8.27 Sinus congestion | 1 | 88 | Risk Ratio (M‐H, Fixed, 95% CI) | 0.47 [0.13, 1.70] |