| 1 Overall mortality (all patients, to end of follow‐up) Show forest plot | 5 | 1503 | Odds Ratio (M‐H, Fixed, 95% CI) | 1.06 [0.83, 1.35] |
|
| 2 Overall mortality (stratified by risk, to end of follow‐up) Show forest plot | 5 | 1503 | Odds Ratio (M‐H, Fixed, 95% CI) | 1.06 [0.83, 1.36] |
|
| 2.1 High risk | 1 | 140 | Odds Ratio (M‐H, Fixed, 95% CI) | 2.0 [1.02, 3.92] |
| 2.2 Non‐high risk | 1 | 1078 | Odds Ratio (M‐H, Fixed, 95% CI) | 0.86 [0.64, 1.14] |
| 2.3 Unclear risk status | 4 | 285 | Odds Ratio (M‐H, Fixed, 95% CI) | 2.34 [0.98, 5.57] |
| 3 30 Day Mortality in Non‐High Risk Patients Show forest plot | 1 | | Odds Ratio (M‐H, Fixed, 95% CI) | Totals not selected |
|
| 4 90‐Day Mortality (all patients) Show forest plot | 4 | 1415 | Odds Ratio (M‐H, Fixed, 95% CI) | 6.57 [3.34, 12.95] |
|
| 5 90‐Day Mortality (stratified by risk) Show forest plot | 4 | 1415 | Odds Ratio (M‐H, Fixed, 95% CI) | 6.24 [3.24, 12.02] |
|
| 5.1 High risk | 1 | 140 | Odds Ratio (M‐H, Fixed, 95% CI) | 57.24 [3.38, 968.54] |
| 5.2 Non‐high risk | 1 | 1078 | Odds Ratio (M‐H, Fixed, 95% CI) | 3.65 [1.65, 8.09] |
| 5.3 Unclear risk status | 3 | 197 | Odds Ratio (M‐H, Fixed, 95% CI) | 7.08 [1.54, 32.58] |
| 6 Change in SGRQ (six months) Show forest plot | 2 | | SGRQ (Fixed, 95% CI) | Subtotals only |
|
| 6.1 Symptoms | 1 | | SGRQ (Fixed, 95% CI) | ‐11.7 [‐20.15, ‐3.25] |
| 6.2 Activity | 1 | | SGRQ (Fixed, 95% CI) | ‐16.8 [‐23.10, ‐10.50] |
| 6.3 Impacts | 1 | | SGRQ (Fixed, 95% CI) | ‐13.1 [‐19.20, ‐7.00] |
| 6.4 Total | 2 | | SGRQ (Fixed, 95% CI) | ‐13.49 [‐15.13, ‐11.84] |
| 7 Change in SGRQ (12 months) Show forest plot | 2 | | SGRQ units (Fixed, 95% CI) | Subtotals only |
|
| 7.1 Symptoms | 1 | | SGRQ units (Fixed, 95% CI) | ‐8.8 [‐17.57, ‐0.03] |
| 7.2 Activity | 1 | | SGRQ units (Fixed, 95% CI) | ‐17.1 [‐22.65, ‐11.55] |
| 7.3 Impacts | 1 | | SGRQ units (Fixed, 95% CI) | ‐14.6 [‐20.05, ‐9.15] |
| 7.4 Total | 2 | | SGRQ units (Fixed, 95% CI) | ‐13.78 [‐15.75, ‐11.80] |
| 8 Change in SGRQ (24 months) Show forest plot | 1 | | Mean Difference (IV, Fixed, 95% CI) | Totals not selected |
|
| 8.1 Symptoms | 0 | | Mean Difference (IV, Fixed, 95% CI) | 0.0 [0.0, 0.0] |
| 8.2 Activity | 0 | | Mean Difference (IV, Fixed, 95% CI) | 0.0 [0.0, 0.0] |
| 8.3 Impacts | 0 | | Mean Difference (IV, Fixed, 95% CI) | 0.0 [0.0, 0.0] |
| 8.4 Total | 1 | | Mean Difference (IV, Fixed, 95% CI) | 0.0 [0.0, 0.0] |
| 9 Mean change in CRDQ domains (12 months) Show forest plot | 1 | | CRDQ units (Fixed, 95% CI) | Totals not selected |
|
| 9.1 Dypnoea | 1 | | CRDQ units (Fixed, 95% CI) | 0.0 [0.0, 0.0] |
| 9.2 Fatigue | 1 | | CRDQ units (Fixed, 95% CI) | 0.0 [0.0, 0.0] |
| 9.3 Mastery | 1 | | CRDQ units (Fixed, 95% CI) | 0.0 [0.0, 0.0] |
| 9.4 Emotion | 1 | | CRDQ units (Fixed, 95% CI) | 0.0 [0.0, 0.0] |
| 10 Mean change in CRDQ domains (24 months) Show forest plot | 1 | | CRDQ units (Fixed, 95% CI) | Totals not selected |
|
| 10.1 Dypnoea | 1 | | CRDQ units (Fixed, 95% CI) | 0.0 [0.0, 0.0] |
| 10.2 Fatigue | 1 | | CRDQ units (Fixed, 95% CI) | 0.0 [0.0, 0.0] |
| 10.3 Mastery | 1 | | CRDQ units (Fixed, 95% CI) | 0.0 [0.0, 0.0] |
| 10.4 Emotion | 1 | | CRDQ units (Fixed, 95% CI) | 0.0 [0.0, 0.0] |
| 11 Change in SF‐36 (six months) Show forest plot | 1 | | SF‐346 units (Fixed, 95% CI) | Totals not selected |
|
| 11.1 Physical functioning | 1 | | SF‐346 units (Fixed, 95% CI) | 0.0 [0.0, 0.0] |
| 11.2 Role physical | 1 | | SF‐346 units (Fixed, 95% CI) | 0.0 [0.0, 0.0] |
| 11.3 Bodily pain | 1 | | SF‐346 units (Fixed, 95% CI) | 0.0 [0.0, 0.0] |
| 11.4 General health | 1 | | SF‐346 units (Fixed, 95% CI) | 0.0 [0.0, 0.0] |
| 11.5 Vitality | 1 | | SF‐346 units (Fixed, 95% CI) | 0.0 [0.0, 0.0] |
| 11.6 Social functioning | 1 | | SF‐346 units (Fixed, 95% CI) | 0.0 [0.0, 0.0] |
| 11.7 Role emotional | 1 | | SF‐346 units (Fixed, 95% CI) | 0.0 [0.0, 0.0] |
| 11.8 Mental health | 1 | | SF‐346 units (Fixed, 95% CI) | 0.0 [0.0, 0.0] |
| 12 Change in SF‐36 (12 months) Show forest plot | 1 | | SF‐36 units (Fixed, 95% CI) | Totals not selected |
|
| 12.1 Physical functioning | 1 | | SF‐36 units (Fixed, 95% CI) | 0.0 [0.0, 0.0] |
| 12.2 Role physical | 1 | | SF‐36 units (Fixed, 95% CI) | 0.0 [0.0, 0.0] |
| 12.3 Bodily pain | 1 | | SF‐36 units (Fixed, 95% CI) | 0.0 [0.0, 0.0] |
| 12.4 General health | 1 | | SF‐36 units (Fixed, 95% CI) | 0.0 [0.0, 0.0] |
| 12.5 Vitality | 1 | | SF‐36 units (Fixed, 95% CI) | 0.0 [0.0, 0.0] |
| 12.6 Social functioning | 1 | | SF‐36 units (Fixed, 95% CI) | 0.0 [0.0, 0.0] |
| 12.7 Role emotional | 1 | | SF‐36 units (Fixed, 95% CI) | 0.0 [0.0, 0.0] |
| 12.8 Mental health | 1 | | SF‐36 units (Fixed, 95% CI) | 0.0 [0.0, 0.0] |
| 13 Improvement in health‐related quality of life (SGRQ) Show forest plot | 1 | | Odds Ratio (M‐H, Fixed, 95% CI) | Totals not selected |
|
| 13.1 Six months | 1 | | Odds Ratio (M‐H, Fixed, 95% CI) | 0.0 [0.0, 0.0] |
| 13.2 12 months | 1 | | Odds Ratio (M‐H, Fixed, 95% CI) | 0.0 [0.0, 0.0] |
| 13.3 24 months | 1 | | Odds Ratio (M‐H, Fixed, 95% CI) | 0.0 [0.0, 0.0] |
| 14 No change/deterioration in health‐related quality of life (SGRQ) Show forest plot | 1 | | Odds Ratio (M‐H, Fixed, 95% CI) | Totals not selected |
|
| 14.1 Six months | 1 | | Odds Ratio (M‐H, Fixed, 95% CI) | 0.0 [0.0, 0.0] |
| 14.2 12 months | 1 | | Odds Ratio (M‐H, Fixed, 95% CI) | 0.0 [0.0, 0.0] |
| 14.3 24 months | 1 | | Odds Ratio (M‐H, Fixed, 95% CI) | 0.0 [0.0, 0.0] |
| 15 Improvement in exercise capacity Show forest plot | 1 | | Odds Ratio (M‐H, Fixed, 95% CI) | Totals not selected |
|
| 15.1 Six months | 1 | | Odds Ratio (M‐H, Fixed, 95% CI) | 0.0 [0.0, 0.0] |
| 15.2 12 months | 1 | | Odds Ratio (M‐H, Fixed, 95% CI) | 0.0 [0.0, 0.0] |
| 15.3 24 months | 1 | | Odds Ratio (M‐H, Fixed, 95% CI) | 0.0 [0.0, 0.0] |
| 16 No change/deterioration in exercise capacity Show forest plot | 1 | | Odds Ratio (M‐H, Fixed, 95% CI) | Totals not selected |
|
| 16.1 Six months | 1 | | Odds Ratio (M‐H, Fixed, 95% CI) | 0.0 [0.0, 0.0] |
| 16.2 12 months | 1 | | Odds Ratio (M‐H, Fixed, 95% CI) | 0.0 [0.0, 0.0] |
| 16.3 24 months | 1 | | Odds Ratio (M‐H, Fixed, 95% CI) | 0.0 [0.0, 0.0] |
| 17 Six minute walk distance (metres) Show forest plot | 3 | | Mean Difference (IV, Fixed, 95% CI) | Subtotals only |
|
| 17.1 at 3 months | 2 | 80 | Mean Difference (IV, Fixed, 95% CI) | 20.85 [‐9.36, 51.07] |
| 17.2 at 6 months | 1 | 81 | Mean Difference (IV, Fixed, 95% CI) | 55.0 [9.58, 100.42] |
| 17.3 at 12 months | 0 | 0 | Mean Difference (IV, Fixed, 95% CI) | 0.0 [0.0, 0.0] |
| 18 Change in six minute walk distance (metres) Show forest plot | 1 | | Mean Difference (IV, Fixed, 95% CI) | Totals not selected |
|
| 18.1 at 3 months | 0 | | Mean Difference (IV, Fixed, 95% CI) | 0.0 [0.0, 0.0] |
| 18.2 at 6 months | 1 | | Mean Difference (IV, Fixed, 95% CI) | 0.0 [0.0, 0.0] |
| 18.3 at 12 months | 1 | | Mean Difference (IV, Fixed, 95% CI) | 0.0 [0.0, 0.0] |
| 18.4 at 24 months | 1 | | Mean Difference (IV, Fixed, 95% CI) | 0.0 [0.0, 0.0] |
| 19 FEV1 (L) Show forest plot | 5 | | Mean Difference (IV, Fixed, 95% CI) | Subtotals only |
|
| 19.1 at 3 months | 3 | 122 | Mean Difference (IV, Fixed, 95% CI) | 0.23 [0.08, 0.37] |
| 19.2 at 6 months | 4 | 248 | Mean Difference (IV, Fixed, 95% CI) | 0.28 [0.20, 0.35] |
| 19.3 at 12 months | 0 | 0 | Mean Difference (IV, Fixed, 95% CI) | 0.0 [0.0, 0.0] |
| 20 Improvement in FEV1 % predicted Show forest plot | 1 | | Odds Ratio (M‐H, Fixed, 95% CI) | Totals not selected |
|
| 20.1 Six months | 1 | | Odds Ratio (M‐H, Fixed, 95% CI) | 0.0 [0.0, 0.0] |
| 20.2 12 months | 1 | | Odds Ratio (M‐H, Fixed, 95% CI) | 0.0 [0.0, 0.0] |
| 20.3 24 months | 1 | | Odds Ratio (M‐H, Fixed, 95% CI) | 0.0 [0.0, 0.0] |
| 21 No change/deterioration in FEV1 % predicted Show forest plot | 1 | | Odds Ratio (M‐H, Fixed, 95% CI) | Totals not selected |
|
| 21.1 Six months | 1 | | Odds Ratio (M‐H, Fixed, 95% CI) | 0.0 [0.0, 0.0] |
| 21.2 12 months | 1 | | Odds Ratio (M‐H, Fixed, 95% CI) | 0.0 [0.0, 0.0] |
| 21.3 24 months | 1 | | Odds Ratio (M‐H, Fixed, 95% CI) | 0.0 [0.0, 0.0] |
| 22 Change in FEV1 (% predicted) Show forest plot | 1 | | Mean Difference (IV, Fixed, 95% CI) | Totals not selected |
|
| 22.1 at 3 months | 0 | | Mean Difference (IV, Fixed, 95% CI) | 0.0 [0.0, 0.0] |
| 22.2 at 6 months | 1 | | Mean Difference (IV, Fixed, 95% CI) | 0.0 [0.0, 0.0] |
| 22.3 at 12 months | 1 | | Mean Difference (IV, Fixed, 95% CI) | 0.0 [0.0, 0.0] |
| 22.4 at 24 months | 1 | | Mean Difference (IV, Fixed, 95% CI) | 0.0 [0.0, 0.0] |
| 23 Total lung capacity (% of predicted) Show forest plot | 3 | 122 | Mean Difference (IV, Fixed, 95% CI) | ‐21.70 [‐30.97, ‐12.43] |
|
| 23.1 at 3 months | 3 | 122 | Mean Difference (IV, Fixed, 95% CI) | ‐21.70 [‐30.97, ‐12.43] |
| 23.2 at 6 months | 0 | 0 | Mean Difference (IV, Fixed, 95% CI) | 0.0 [0.0, 0.0] |
| 23.3 at 12 months | 0 | 0 | Mean Difference (IV, Fixed, 95% CI) | 0.0 [0.0, 0.0] |
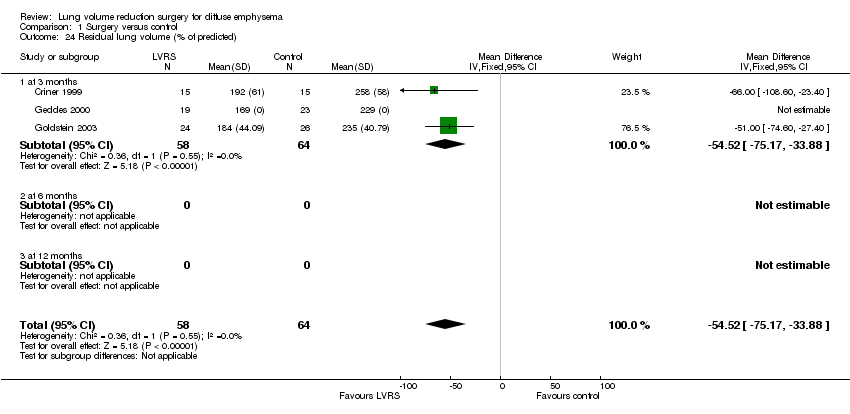
| 24 Residual lung volume (% of predicted) Show forest plot | 3 | 122 | Mean Difference (IV, Fixed, 95% CI) | ‐54.52 [‐75.17, ‐33.88] |
|
| 24.1 at 3 months | 3 | 122 | Mean Difference (IV, Fixed, 95% CI) | ‐54.52 [‐75.17, ‐33.88] |
| 24.2 at 6 months | 0 | 0 | Mean Difference (IV, Fixed, 95% CI) | 0.0 [0.0, 0.0] |
| 24.3 at 12 months | 0 | 0 | Mean Difference (IV, Fixed, 95% CI) | 0.0 [0.0, 0.0] |
| 25 Mean direct medical costs and total healthcare‐related costs according to time after randomisation (USD 000s) Show forest plot | 1 | | Mean Difference (IV, Fixed, 95% CI) | Totals not selected |
|
| 25.1 Direct Medical Costs 0‐12 Months after randomisation (USD 000s) | 1 | | Mean Difference (IV, Fixed, 95% CI) | 0.0 [0.0, 0.0] |
| 25.2 Total Costs 0‐12 months after randomisation (USD 000s) | 1 | | Mean Difference (IV, Fixed, 95% CI) | 0.0 [0.0, 0.0] |
| 25.3 Direct medical costs 13‐24 months after randomisation (USD 000s) | 1 | | Mean Difference (IV, Fixed, 95% CI) | 0.0 [0.0, 0.0] |
| 25.4 Total costs 13‐24 months after randomisation (USD 000s) | 1 | | Mean Difference (IV, Fixed, 95% CI) | 0.0 [0.0, 0.0] |
| 25.5 Direct medical costs 25‐36 months after randomisation (USD 000s) | 1 | | Mean Difference (IV, Fixed, 95% CI) | 0.0 [0.0, 0.0] |
| 25.6 Total costs 25‐36 months after randomisation (USD 000s) | 1 | | Mean Difference (IV, Fixed, 95% CI) | 0.0 [0.0, 0.0] |
| 26 Mean direct medical costs and total healthcare‐related costs at three years (USD 000s) Show forest plot | 1 | | Mean Difference (IV, Fixed, 95% CI) | Totals not selected |
|
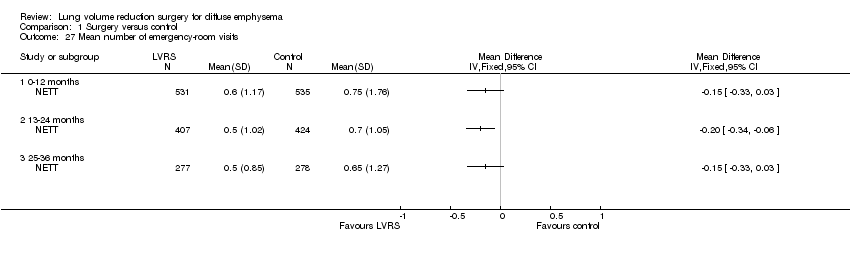
| 27 Mean number of emergency‐room visits Show forest plot | 1 | | Mean Difference (IV, Fixed, 95% CI) | Totals not selected |
|
| 27.1 0‐12 months | 1 | | Mean Difference (IV, Fixed, 95% CI) | 0.0 [0.0, 0.0] |
| 27.2 13‐24 months | 1 | | Mean Difference (IV, Fixed, 95% CI) | 0.0 [0.0, 0.0] |
| 27.3 25‐36 months | 1 | | Mean Difference (IV, Fixed, 95% CI) | 0.0 [0.0, 0.0] |