Longchain polyunsaturated fatty acid supplementation in infants born at term
Abstract
Background
The n‐3 and n‐6 fatty acids linolenic acid and linoleic acid are precursors of the n‐3 and n‐6 long chain fatty acids (LCPUFA). Infant formula has historically only contained the precursor fatty acids. Over the last few years, some manufacturers have added LCPUFA to formulae and marketed them as providing an advantage for the development of term infants.
Objectives
To assess whether supplementation of formula with LCPUFA is safe and of benefit to term infants.
Search methods
We searched the Cochrane Central Register of Controlled Trials (The Cochrane Library, April, 2011), MEDLINE (1966 to April 2011), EMBASE (1980 to April 2011), CINAHL (December 1982 to April 2011) and abstracts of the Society for Pediatric Research (1980 to 2010). No language restrictions were applied.
Selection criteria
Randomised and quasi randomised trials comparing LCPUFA supplemented vs. non‐supplemented formula milk and with clinical endpoints were reviewed.
Data collection and analysis
Methodological quality of studies was assessed using the guidelines of Cochrane neonatal review group. Data were sought regarding effects on visual acuity, neurodevelopmental outcomes and physical growth. When appropriate, meta‐analysis was conducted to provide a pooled estimate of effect.
Main results
Twenty‐five randomised studies were identified; fifteen were included (n = 1889) and ten excluded.
Visual acuity was assessed by nine studies. Visual evoked potential was used in six studies, two used Teller cards and one used both. Four studies reported beneficial effects while the remaining five did not.
Neurodevelopmental outcome was measured by eleven studies. Bayley scales of infant development (BSID) was used in nine studies; only two showed beneficial effects. Meta‐analysis did not show significant benefits of supplementation. One study followed the infants up to nine years of age and did not find benefit of supplementation. One study reported better novelty preference measured by Fagan Infant test at nine months. Another study reported better problem solving at 10 months. One study used Brunet and Lezine test to assess the developmental quotient and did not find beneficial effects.
Physical growth was measured by thirteen studies; none found beneficial or harmful effects of supplementation. Meta‐analysis found that supplemented group may have marginally lower weight at one year of age.
Authors' conclusions
Majority of the RCTS have not shown beneficial effects of LCPUFA supplementation on the neurodevelopmental outcomes of term infants. The beneficial effects on visual acuity have not been consistently demonstrated. Routine supplementation of term infant milk formula with LCPUFA can not be recommended.
PICO
Plain language summary
Longchain polyunsaturated fatty acid supplementation in infants born at term
It has been suggested that low levels of long chain polyunsaturated fatty acids (LCPUFA) found in formula milk may contribute to lower IQ levels and vision skills in term infants. Some milk formulas with added LCPUFA are commercially available. This review found that feeding term infants with milk formula enriched with LCPUFA had no proven benefit regarding vision, cognition or physical growth.
Authors' conclusions
Background
Evidence to suggest that breast fed infants have a long‐term IQ advantage over those who have been fed infant formula has been evident in the literature for many years (Rogers 1978; Morrow‐Tlucak 1988; Lucas 1992; Temboury 1994; Anderson 1999; Kramer 2008;Isaacs 2010Oddy 2011). Although most of these studies do not relate their findings to fatty acid supply, some reports suggest that the low levels of LCPUFA, such as DHA, found in formula‐fed infants may contribute to the lower IQ scores reported in formula‐fed infants (Rogers 1978; Neuringer 1986; Bjerve 1992).
Description of the condition
Dietary fat in infancy is fundamental for the provision of energy, fat soluble vitamins and essential fatty acids. Interest has recently focused on the importance of long chain polyunsaturated fatty acids (LCPUFA) such as docosahexaenoic acid (DHA) and arachidonic acid (AA) in infant nutrition. These fatty acids are found in high proportions in the structural lipids of cell membranes, particularly those of the central nervous system and retina (Fleith 2005). Their accretion primarily occurs during the last trimester of pregnancy and the first year of life (Clandinin 1980).
Description of the intervention
LCPUFA are supplied during pregnancy via placental transfer and through breast milk after birth. Standard infant formulae contain only the precursor essential fatty acids (EFA), alpha‐linolenic acid (ALA, the omega 3 precursor) and linoleic acid (LA, the omega 6 precursor) from which formula‐fed infants must synthesise their own DHA and AA, respectively. The absence of LCPUFA in formula may be further exacerbated by inhibition of incorporation of endogenously produced LCPUFA by the high concentrations of LA in some formulae.
How the intervention might work
Biochemical studies in both term and preterm infants indicate that infants fed formula unsupplemented with LCPUFA have significantly less DHA and AA in their erythrocytes relative to those fed breast milk (Clark 1992). Studies have also demonstrated that infants fed formula milk have lower levels of LCPUFA in the cerebral cortex compared to breast fed infants (Farquharson 1995) suggesting that infant formulae containing only LA and ALA may not be effective in meeting the full EFA requirements of infants.
Why it is important to do this review
In a non‐randomised, observational study, term infants fed breast milk had better VEP acuities and higher DHA levels than those receiving formula and visual function was found to correlate with DHA status (Makrides 1993). Over the last few years, some manufacturers have added LCPUFA to formulas for term infants. These formulas are frequently marketed as providing an advantage to infant development. The cost of supplemented formulas is generally higher than the unsupplemented formulas. A systematic review of both randomised and non‐randomised controlled trials in term infants concluded that use of term formula supplemented with DHA can improve the visual acuity at two and probably at four months of age (SanGiovanni 2000). Another review of both animal and human studies (McCann 2005) concluded that animals with experimentally induced severe DHA deficiency benefit from DHA supplementation in their diets, but results of human studies on cognitive outcomes are inconclusive. The meta‐analysis by Makrides et al (Makrides 2005) as well as the previous versions of the Cochrane review (Simmer 2001; Simmer 2008) found neither benefit or harm on physical growth of term infants supplemented with either DHA alone or DHA and AA.
The purpose of this review was to update the existing evidence on the role of supplementation of LCPUFA to formula fed term infants.
Objectives
To assess whether supplementation of formula with LCPUFA is safe and of benefit to term infants. The main areas of interest were the effects of LCPUFA supplementation on visual function, neurodevelopment and physical growth.
Methods
Criteria for considering studies for this review
Types of studies
Only randomised and quasi‐randomised clinical trials were eligible for inclusion. A trial was defined as quasi‐random if the method used to allocate study infants to the study milk formula groups was either not statistically random or was not clearly stated.
Types of participants
Healthy infants ≥ 37 weeks gestation at birth.
Types of interventions
Milk formula enriched with DHA plus AA or DHA alone compared to standard milk formula. LCPUFA supplements could be from any source including fish oil, egg triglycerides or fungal oils.
To be eligible for inclusion, the trial should have met all of the following criteria:
-
study formula was commenced within two weeks after birth;
-
study formula was the only source of milk from the time of randomisation until at least 8 weeks of age;
-
a minimum of three months follow‐up data on clinical outcomes of interest was available.
The following trials were not eligible for inclusion:
-
trials which used breast milk in addition to study formula during the first 8 weeks of life;
-
trials reporting on only biochemical outcomes.
Types of outcome measures
Visual acuity: measured using either using Tellers cards or visual evoked potentials.
Neurodevelopmental outcomes: General Quotient, Intelligent Quotient and other measures of cognitive functions.
Physical growth: weight, length and head circumference.
Biochemical outcomes have not been reported in this review.
Search methods for identification of studies
We used the standard search strategy of the Cochrane Neonatal Review Group was used. This included electronic searches of the MEDLINE (1966 to April 2011), Cochrane Central Register of Controlled Trials (CENTRAL, The Cochrane Library, April 2011, EMBASE (1980 to April 2011) and CINAHL (1982 to April 2011). We also searched abstracts of Paediatric Academic Societies meetings published in Pediatric Research (1995 to 2010). We searched PubMed and EMBASE for relevant articles using the following MeSH terms or text words: Fatty acids, Unsaturated OR Arachidonic Acid OR Docosahexanoic acid OR Fatty acids, Omega‐3 OR fatty acids Omega‐6 OR fatty acids, essential AND Infant, Newborn OR Neonate AND clinical trial OR Randomized Controlled Trial. We also reviewed reference lists of published narrative and systematic reviews. We did not apply any language restrictions. Two review authors (SR and SP) independently searched various databases to identify the trials eligible for inclusion. We contacted the authors of studies to clarify reported data or provide additional data including details of methodology. We sent them a standardised table and asked them to provide missing data not included in their article.
We also searched clinical trials registries for ongoing or recently completed trials (clinicaltrials.gov; controlled‐trials.com; and who.int/ictrp).
Data collection and analysis
Data regarding clinical outcomes were excerpted from the trial reports by one review author (SR) and checked by the second review author (SP). We analysed data according to the standards of the Cochrane Neonatal Review Group.
Selection of studies
All randomised and quasi‐randomised controlled trials fulfilling the selection criteria. SR and SP screened the title and abstracts of all the identified studies and obtained full articles for all potentially relevant trials. SR and SP assessed independently the full text of these reports to assess their eligibility for inclusion in the review. We resolved any disagreement by discussion among all the three review authors and consensus.
Data extraction and management
SR and SP separately extracted, assessed and coded all data for each study using a form that was designed specifically for this review. We resolved any disagreement by discussion with KS. SR contacted the trial authors to clarify methodology and to obtain additional information. For each study, final data was entered into RevMan by SR and then checked by SP as well as KS. We resolved any disagreement by discussion and consensus.
Assessment of risk of bias in the included studies:
The methodological quality of the studies were assessed by two reviewers (SR and SP). We resolved any disagreement by discussion among all the three authors and consensus. The information was entered into the Risk of Bias table using the following criteria:
1. Was there adequate sequence generation (checking for possible selection bias): The method used to generate the allocation sequence in each included study was described as: low risk (adequate) (any truly random process e.g. random number table, computer random number generator); high risk (inadequate) (any non‐random process e.g. odd or even date of birth, hospital or clinic record number); unclear risk.
2. Was there adequate allocation concealment (checking for possible selection bias): The method used to conceal the allocation sequence in each included study was described as: low risk (adequate) (e.g. telephone or central randomisation, consecutively numbered sealed opaque envelopes); high risk (inadequate) (open random allocation, unsealed or non‐opaque envelopes, alternation, date of birth); unclear risk.
3. Was there adequate blinding (checking for possible performance bias): The methods used to blind the personnel from the knowledge of which intervention the participants received. Was knowledge of the allocated intervention adequately prevented during the study? At the time of outcome assessment? Catagorised as low risk, high risk, unclear risk.
4. Were incomplete outcome data addressed (checking for possible attrition bias through withdrawals, dropouts, protocol deviations): If attrition and exclusion were reported, the numbers included in the analysis at each stage (compared with the total randomised participants), reasons for attrition or exclusion where reported, and whether missing data were balanced across the groups or were related to outcomes were reported. We assessed the methods as low risk (< 20% missing data); high risk (≥ 20% missing data); unclear risk.
5. Was there selective reporting bias: The possibility of selective outcome reporting bias was investigated. We assessed the methods as low risk (where it was clear that all of the study's prespecified outcomes were been reported); high risk (where not all the study's pre‐specified outcomes were been reported; one or more reported primary outcomes were not pre‐specified; outcomes of interest were reported incompletely and so could not be used; study failed to include results of a key outcome that would have been expected to have been reported); unclear risk.
6. Was there any other sources of potential bias: Any important concerns such we had about other potential sources of bias (for example, whether there was a potential source of bias related to the specific study design or whether the trial was stopped early due to some data‐dependent process) were described. We assessed whether each study was free of other problems that could put it at risk of bias as low risk; high risk; unclear risk.
Measures of treatment effect
We used the standard methods of the Cochrane Neonatal Review Group. For continuous data, we used the mean difference (MD) and its 95% confidence interval (CI). There were no categorical outcome data in the review.
Assessment of heterogeneity
We examined the heterogeneity between trial results by inspecting the forest plots and quantified the impact of heterogeneity in the meta‐analysis using a measure of the degree of inconsistency in the studies' results (I2 statistic).
Data synthesis
Since the patient population and the intervention were almost similar all the studies, it was considered appropriate to pool the data. Some studies randomised infants into three groups: DHA alone, DHA plus AA and control formula. The outcome data from each of these studies was entered in the RevMan as if they were two separate studies i.e.., DHA plus AA versus control and DHA versus control group. However, while doing the meta‐analysis, the data of DHA plus AA versus control and DHA versus control were not pooled because the control group infants were the same for both DHA alone and DHA plus AA group of infants. Meta analysis was done using RevMan 5 using the fixed effect model.
Subgroup analysis
Planned subgroup analysis was done based on the type of LCPUFA supplementation (DHA alone and DHA plus AA).
Results
Description of studies
Twenty‐five studies were identified as potentially eligible of which fifteen were included and ten excluded. Search of the clinical trials registries did not reveal any ongoing or recently completed trials. Details of the patients and methods are summarised in the table 'Characteristics of Included Studies'. All the trials enrolled infants ≥37 weeks of gestation at birth. The source of LCPUFA was egg yolk phospholipids in Milan 1995; Adelaide 1996; Memphis 1996; Portland 1997; England 1999. It was derived from fish oil and evening primrose oil in Adelaide 1995. Dallas 1998; Dallas 2005; Dallas 2010 and Wales 2000 used single cell oils as the source of LCPUFA. Netherlands 2005 used LCPUFA derived from egg yolk, tuna oil and single cell oil produced by soil fungus, Mortierella alpina. Scotland 1998 used LCPUFA derived from egg lipids, milk fat and vegetable oils. Portland 2001 fish and fungus oil in one group and egg yolk triglyceride derived LCPUFA in the other group of their study infants. France 2000 used LCPUFA derived from fish oil. The source of LCPUFA in China 2004 was not clear.
The trial formula in all the studies was commenced within the first two weeks of life. The duration of use of the study formula varied among the studies. It was two months in Netherlands 2005, three months in Wales 2000 , four months in Milan 1995; Dallas 1998; Scotland 1998; France 2000, six months in England 1999, China 2004; , seven months in Adelaide 1995 and one year in Adelaide 1996; Memphis 1996; Portland 1997; Dallas 2005; Dallas 2010 and Portland 2001.
Adelaide 1995 and France 2000 compared DHA enriched versus normal term formula. Adelaide 1996; Portland 1997; Dallas 1998 randomised infants into three groups: DHA alone, DHA plus AA and control formula. All other studies compared formula enriched with DHA plus AA versus the control formula.
Portland 2001 examined the effect of two different sources of LCPUFA (egg yolk triglyceride and fish/fungus oil) versus control formula and reported the outcome the data separately. Since the aim of our review was to compare LCPUFA (irrespective of the source) versus standard formula, the authors were asked to provide combined outcome data for both sources of LCPUFA infants. The authors kindly obliged and provided the combined outcome data. Dallas 2010 studied different concentrations of DHA (0.32%, 0.64%, 0.96%) versus control formula. For this review, we chose 0.32% DHA group as the intervention arm because this level is similar to other included studies.
Dallas 2010 provided additional information from their study for this updated review. For the previous version (Simmer 2008) of this review Adelaide 1995; Milan 1995; Adelaide 1996; Portland 1997; Scotland 1998; France 2000; Wales 2000; Portland 2001; China 2004; Dallas 2005 and Netherlands 2005 had provided additional information; the authors of England 1999 and Memphis 1996 were not contacted because all of the required information was available from the published literature; Hungary 1995 and Munich 1996 had acknowledged the request but did not provide necessary information.
Sample size and power calculation were described in Adelaide 1995; Milan 1995; Adelaide 1996; Memphis 1996; Dallas 1998; Scotland 1998; England 1999; Portland 2001; Dallas 2005; Netherlands 2005 and Dallas 2010. It was not clear in Portland 1997; France 2000; Wales 2000 and China 2004.
Ten studies were excluded. Scandinavia 1996 was excluded because the supplements were not commenced until 3‐4 weeks of age. Dallas 2002 was excluded because infants were randomised to receive the study formula at six weeks of age. Houston 2002 was excluded because they compared milk formulae with different amounts of alpha linolenic acid levels. Hungary 1995 and Munich 1996 were excluded because the methodology was not clear and the required data on outcome of interest was not available. The authors acknowledged our letter but did not provide the required information. Kansas 1999 was excluded because the authors of the trial expressed concerns about the possibility of significant methodological issues in their study. Agostoni 2009 was excluded because DHA/placebo supplementation was in the breast fed babies. Gibson 2009 was excluded because the study milk formula was supplemented with probiotic (Bifidobacterium Lactis) in addition to LC‐PUFA whereas the control formula had neither. Field 2008 and Field 2010 were excluded because it did not assess the clinical outcomes of interest; it assessed the laboratory markers of immune function.
Risk of bias in included studies
Adelaide 1995; Milan 1995; Adelaide 1996; Memphis 1996; Portland 1997; Dallas 1998; Scotland 1998; England 1999; France 2000; Wales 2000; Portland 2001; Dallas 2005; Netherlands 2005 and Dallas 2010 were considered to be of having moderate to low risk of bias. The follow‐up rates ranged from 60 to 90% in different studies for various outcomes. Follow‐up rate in China 2004 was very low with only 33% of the study infants being followed at six months for the primary outcome. The details of methodology are given in the table "Characteristics of included trials" and the "Risk of Bias Table."
Effects of interventions
Visual acuity ‐ assessment methods:
Visual acuity is a measure of the smallest element that can be resolved and can be assessed in infants by using gratings which consist of black and white stripes or checkerboard patterns. Grating acuity can be measured by using behavioural or visual evoked potential (VEP) methods. Each pairing of a black and white stripe is referred to as a cycle and the spatial frequency of a grating is defined by the number of cycles per degree of viewing angle. As grating spatial frequency increases, the stripes become finer and are more difficult to discriminate, eventually appearing as an even grey to the observer. Grating acuity is the highest spatial frequency where the stripes can be resolved.
The VEP is the electrical activity of the brain that is generated in response to a reversing contrast checkerboard or grating. The VEP is recorded from an electrode placed over the occipital pole and is classified as being transient, steady state or sweep. A transient VEP is elicited by a checkerboard reversing between 1 to 3 times/second while a steady‐state VEP is elicited by a checkerboard reversing between 6 to 20 times/second. For a sweep VEP, black and white striped grating is used. The amplitude of the VEP increases linearly with spatial frequency near the visual acuity threshold. Linear regression is used to fit a straight line through the linear portion of the VEP amplitude versus spatial frequency curve and visual acuity is determined from the intercept of the regression line with the spatial frequency axis. VEP are reported as log MAR (minimum angle of resolution) which corresponds to the smallest black and white check pattern which the infant can discriminate from a grey background (smaller the value, the better the acuity), or as cycles/degree(larger the value, better the acuity).
Behavioural methods for assessing visual acuity rely on the strong preference shown by infants for patterned stimuli over non‐patterned stimuli. Both the acuity card procedure (ACP) and the forced preferential looking (FPL) procedure have been used in conjunction with the Teller acuity cards for measuring the development of visual acuity in infants. The FPL procedure tests binocular grating acuity; the tester views the infant through a peephole, without knowledge of the spatial‐frequency gratings on the cards, and makes a forced‐choice judgement about which card the infant prefers. Individual acuities are converted to cycles/degree and SD are in octaves which are determined by dividing one log SD by 0.3.
LCPUFA SUPPLEMENTED VS. CONTROL FORMULA (COMPARISON 1)
Visual acuity
Visual acuity at four months of age: Steady state VEP, logMAR (Outcome 1.1)
Studies using DHA plus AA: Adelaide 1996 reported on this outcome. They did not find statistically significant differences between LCPUFA and control groups( 0.74 ± 0.09 vs. 0.73 ± 0.12 respectively).
Studies using DHA alone: Adelaide 1995 and Adelaide 1996 reported this outcome. Adelaide 1995 reported statistically significant differences between the LCPUFA and control groups. Infants in the LCPUFA group had better visual acuity at four months than the controls. Adelaide 1996 did not show statistically significant differences. Pooled meta‐analysis of the two trials did not show statistically significant differences between LCPUFA and controls (MD ‐0.03, 95% CI ‐0.10 to 0.03).
Visual acuity at four months of age using sweep VEP (logMAR) (Outcome 1.2)
Studies using both DHA and AA: Dallas 1998, Dallas 2005 and Dallas 2010 reported this outcome. All three studies showed statistically significant differences between LCPUFA and control groups. Infants in the LCPUFA group had better visual acuity than the control group. Pooled meta‐analysis of all the three studies also showed statistically significant benefit of LCPUFA on visual acuity (MD ‐0.08, 95% CI ‐0.10 to ‐0.05).
Studies using DHA alone: Dallas 1998 reported this outcome. They showed statistically significant benefit on visual acuity for infants in the LCPUFA group compared to controls (0.46 ± 0.08 vs. 0.54 ± 0.13).
Visual acuity at four months of age using Sweep VEP, cycles/degree (Outcome 1.3)
Studies using DHA plus AA: Portland 1997 reported on this outcome. They did not find statistically significant differences between LCPUFA and control groups (6.61 ± 1.21 vs. 7.08 ± 1.35).
Studies using DHA alone: Portland 1997 reported on this outcome. The values were given in graphs. They did not find statistically significant differences between the LCPUFA and control groups.
Visual acuity at four months of age using Teller cards (cycles/degree) (Outcome 1.4)
Studies using DHA plus AA: Memphis 1996;Portland 1997 and Portland 2001 reported on this outcome. None of the three studies showed statistically significant differences between LCPUFA and control groups. Pooled meta‐analysis of Memphis 1996; Portland 1997 and Portland 2001 showed no statistically significant difference between the LCPUFA and control group (MD ‐0.11, 95% CI ‐0.24 to 0.02).
Studies using DHA alone: Portland 1997 reported on this outcome. They did not find statistically significant differences between LCPUFA and control groups. The results were given in graphs.
Visual acuity at six months of age using Sweep VEP (cycles/degree) (Outcome 1.5)
Studies using DHA and AA: Portland 1997 reported this outcome. They did not find statistically significant differences between LCPUFA and control groups(13.18 ± 1.38 vs. 13.49 ± 1.35).
Studies using DHA alone: Portland 1997 reported this outcome. They did not find statistically significant differences between LCPUFA and control groups. The results were given as graphs.
Visual acuity at six months of age using Teller cards (cycles/degree) (Outcome 1.6)
Studies using DHA plus AA: Memphis 1996; Portland 1997 and Portland 2001 reported this outcome. None of the studies reported statistically significant differences between LCPUFA and control groups. Pooled meta‐analysis of the data from Memphis 1996; Portland 1997 and Portland 2001 also did not show statistically significant differences between LCPUFA and control groups (MD 0.02, 95% CI ‐0.11 to 0.15).
Studies using DHA alone: Portland 1997 reported this outcome. They did not find statistically significant differences between LCPUFA and control groups. The results were given as graphs.
Visual acuity at 7 ‐ 8 months of age using Steady state VEP (logMAR) (Outcome 1.7)
Studies using DHA plus AA: Adelaide 1996 reported on this outcome. They did not show statistically significant differences between LCPUFA and control groups (0.39 ± 0.17 vs. 0.39 ± 0.19).
Studies using DHA alone: Adelaide 1995 and Adelaide 1996 reported this outcome. Adelaide 1995 reported statistically significant benefit of LCPUFA supplementation on visual acuity. Adelaide 1996 did not show statistically significant differences between LCPUFA and controls. Pooled meta analyses of both the studies did not show statistically significant differences between LCPUFA and control groups (MD ‐0.02, 95% CI ‐0.14 to 0.10).
Visual acuity at 12 months of age using sweep VEP (logMAR) (Outcome 1.8)
Studies using DHA plus AA: Dallas 1998, Dallas 2005 and Dallas 2010 reported this outcome. All three studies showed statistically significant differences between LCPUFA and control groups. Infants in the LCPUFA group had better visual acuity than controls. Pooled meta‐analysis of all three studies also showed statistically significant differences between LCPUFA and control group (MD ‐0.15, 95% CI ‐0.17 to ‐0.13).
Studies using DHA alone: Dallas 1998 reported on this outcome. They found statistically significant benefit on visual acuity in the LCPUFA group compared to control group(0.19 ± 0.12 vs. 0.33 ± 0.10).
Visual acuity at 12 months of age using Sweep VEP (cycles/degree) (Outcome 1.9)
Studies using DHA and AA: Portland 1997 reported this outcome. They did not find statistically significant differences between LCPUFA and control groups (15.48 ± 1.32 v 15.48 ± 1.32).
Studies using DHA alone: Portland 1997 reported this outcome. They did not find statistically significant differences between LCPUFA and control groups. The results were given in graphs.
Visual acuity at twelve months of age using Teller cards (cycles/degree) (Outcome 1.10)
Studies using DHA plus AA: Memphis 1996; Portland 1997 and Portland 2001 reported this outcome. None of the studies reported statistically significant differences between LCPUFA and control groups. Pooled meta‐analysis of the data from Memphis 1996; Portland 1997 and Portland 2001 also did not show statistically significant differences between LCPUFA and control groups (MD ‐0.01, 95% CI ‐0.12 to 0.11).
Studies using DHA alone: Portland 1997 reported this outcome. They did not find statistically significant differences between LCPUFA and control groups. The results were given in graphs.
Visual acuity at three years of age using Teller cards (cycles/degree) (Outcome 1.11)
Studies using DHA plus AA: Portland 1997 reported on this outcome. They did not find statistically significant differences between LCPUFA and control groups (28.2 ± 0.6 vs. 30.3 ± 0.7; p value: 0.74).
Studies using DHA alone: Portland 1997 reported on this outcome. They did not find statistically significant differences between LCPUFA and control groups (27.5 ± 0.6 vs. 30.3 ± 0.7;p value: 0.74)).
Neurodevelopmental outcomes
Bayley scales of infant development
Neurodevelopmental outcomes were assessed at various ages using Bayley's scales of infant development by Adelaide 1995; Adelaide 1996; Portland 1997; Dallas 1998; England 1999; Portland 2001; China 2004; Netherlands 2005 and Dallas 2010.
Bayley assessment at 3 months, MDI (Outcome 1.12)
Studies using DHA plus AA: China 2004reported on this outcome. They did not find any statistically significant differences in the MDI scores between the LCPUFA and control groups (107.88 ± 7.91 vs. 105.4 ± 9.2 respectively).
Studies using DHA alone: None
Bayley assessment at 3 months, PDI (Outcome 1.13)
Studies using DHA plus AA: China 2004 reported this outcome. They did not find any statistically significant differences in the PDI scores between the LCPUFA and control groups (110.06 ± 6.17 vs. 106.4 ± 6.37 respectively).
Studies using DHA alone: None
Bayley assessment at 6 months, MDI (Outcome 1.14)
Studies using DHA plus AA: China 2004 and Portland 2001 reported this outcome. Both showed no statistically significant difference in the MDI scores between LCPUFA and control groups. Pooled meta‐analysis of the data from these two studies also did not show statistically significant difference in the MDI scores between LCPUFA and control groups (MD ‐0.59, 95% CI ‐2.26 to 1.07).
Studies using DHA alone: None
Bayley assessment at 6 months, PDI (Outcome 1.15): Figure 15
Studies using DHA plus AA: China 2004 and Portland 2001 reported this outcome. Both of them showed no statistically significant difference in the PDI scores between LCPUFA and control groups. Pooled meta‐analysis of the data from these two studies also did not show any statistically significant difference in the PDI scores between LCPUFA and control groups (MD 0.23, 95% CI ‐2.47 to 2.94).
Studies using DHA alone: None
Bayley assessment at one year, MDI (Outcome 1.16)
Studies using DHA plus AA: Adelaide 1996, Portland 1997 and Portland 2001 reported this outcome. No studies showed statistically significant differences in the MDI scores between LCPUFA and control groups. Pooled analysis of the three trials did not reveal statistically significant differences in the MDI scores between LCPUFA and control groups (MD ‐0.95, 95% CI ‐3.38 to 1.49).
Studies using DHA alone: Adelaide 1995; Adelaide 1996; Portland 1997 reported this outcome. No studies showed statistically significant differences in MDI scores between LCPUFA and control group. Pooled meta‐analysis of the data from all these three trials also did not find statistically significant differences in MDI scores between LCPUFA and control groups (MD ‐0.27, 95% CI ‐4.36 to 3.83).
Bayley assessment at one year, PDI (Outcome 1.17)
Studies using DHA plus AA: Adelaide 1996; Portland 1997 and Portland 2001 reported this outcome. No studies showed statistically significant differences in PDI scores between LCPUFA and control groups. Pooled meta‐analysis of the three trials did not reveal statistically significant differences in PDI scores between LCPUFA and control groups (MD ‐2.48, 95% CI ‐5.83 to 0.86).
Studies using DHA alone: Adelaide 1995; Adelaide 1996 and Portland 1997 reported this outcome. No studies reported statistically significant differences in PDI scores between LCPUFA and control group. Pooled meta‐analysis of the data from all these three trials also did not find statistically significant differences in PDI scores between LCPUFA and control groups for (MD ‐1.70, 95% CI ‐6.62 to 3.22).
Bayley assessment at 18 months, MDI (Outcome 1.18)
Studies using DHA plus AA: Dallas 1998;England 1999 and Netherlands 2005 reported this outcome. Dallas 2010 reported this outcome only for the participants from the Dallas centre. There was no information for the study participants from the Kansas centre. Dallas 1998 and Dallas 2010 showed statistically significant improvement in MDI scores at 18 months in the LCPUFA supplemented group. England 1999 and Netherlands 2005 did not show any statistically significant differences in MDI scores at 18 months. A pooled meta‐analysis of the data from all the four trials did not find statistically significant differences in MDI scores between LCPUFA and control groups (MD 0.06, 95% CI ‐2.01 to 2.14).
Studies using DHA alone: None
Bayley assessment at 18 months, PDI (Outcome 1.19)
Studies using DHA plus AA: Dallas 1998; England 1999 and Netherlands 2005 reported this outcome. Dallas 2010 reported this outcome only for the participants from the Dallas centre. There was no information for the study participants from the Kansas centre. No studies showed statistically significant differences in PDI scales between LCPUFA and control groups. Pooled meta‐analysis of the data from all the three trials did not find statistically significant differences in PDI scores between LCPUFA and control groups (MD 0.69, 95% CI ‐0.78 to 2.16).
Studies using DHA alone: None
Bayley assessment at 2 years, MDI (Outcome 1.20)
Studies using DHA plus AA: Adelaide 1996 reported this outcome. They did not find statistically significant differences in MDI scores between LCPUFA and control groups (102.00 ± 23.00 vs. 104.00 ± 13.00).
Studies using DHA alone: Adelaide 1996 reported on this outcome. They did not find statistically significant differences in MDI scores between LCPUFA and control groups (108 ± 16 vs. 104 ± 13).
Bayley assessment at 2 years, PDI (Outcome 1.21)
Studies using DHA plus AA: Adelaide 1996 reported this outcome and did not find statistically significant differences in PDI scores between LCPUFA and control groups (96.00 ± 21.00 vs. 97.00 ± 15.00).
Studies using DHA alone: Adelaide 1996 reported on this outcome and did not find statistically significant differences in PDI scores between LCPUFA and control groups (104.00 ± 17.00 vs. 97.00 ± 15.00).
Other tests of cognitive function
England 1999 assessed development using Knobloch, Passamanik and Sherrards Development Screening Inventory at 9 months. They did not find statistically significant differences between LCPUFA and control infants (103.8 ± 8.3 vs. 104.4 ± 8.7 in LCPUFA v control group respectively).
Milan 1995 assessed the developmental quotient (DQ) using Brunet and Lezine developmental test. They reported higher DQ at four months of age for the LCPUFA infants compared to controls. However, repeat assessments at 12 and 24 months using the same assessment demonstrated no difference in DQ between the LCPUFA and control groups.
DQ at 4 months: 105.3 ± 9.4 vs. 96.5 ± 10.9 in LCPUFA versus control group respectively; p value:0.009
DQ at 12 months: 101.5 ± 9.2 vs. 101.2 ± 8.0 in LCPUFA versus control group respectively; p value:0.4
DQ at 24 months: 101 ± 10.3 vs. 99.1 ± 7.1 in LCPUFA versus control group respectively .p value: 0.89
Portland 1997 assessed the IQ of the study infants at 3.25 years of age using Standford‐Binet scales. They did not find statistically significant differences in the IQ scores between DHA, DHA plus AA and control groups (DHA and AA: 101 ± 13; DHA: 99 ± 12 and Control: 103 ± 15; ANNOVA p value: 0.14).
The Portland 2001 used the Fagan Infant Test of Development which measures novelty preference based on the observation that after habituation to a familiar stimulus has occurred, a preference will be shown for a different (novel) stimulus if both the familiar and novel stimuli are presented together. A novelty preference score is derived for the average percent of total time spent viewing the novel stimuli on ten discrete paired comparison tests. Infants with average scores of > 57% are said to have a significant novelty preference i.e. the time spent looking at the novel stimuli compared with the familiar stimuli is greater than by chance alone. Novelty preference has been interpreted as an early measure of information processing capacity (Fagan 1970; Fagan 1983). The Portland 2001 did not find any statistically significant differences between the LCPUFA and control groups in novelty preference (57.8 ± 6.7 vs. 57.1 ± 5.3 respectively).
Scotland 1998 assessed infant cognitive behaviour at 10 months of age using problem solving assessment. They found a statistically significant benefit of LCPUFA supplementation. Infants who received LCPUFA supplemented formula had significantly more intentional solutions than infants who received the control formula (Median 2.0 v 0, p value: 0.021). Intention scores were also higher in the LCPUFA group [14.0 (11.8, 17.1) vs. 11.5 (10.0, 13.3), p = 0.035].
Dallas 2010 assessed Behaviour Rating Scale (BRS) which evaluated relevant aspects of behaviour during test taking such as emotional regulation, quality of movement and orientation/engagement and found no significant diet group differences.
Netherlands 2005 assessed the outcomes at school age (nine years) and found no significant differences in the Neurological Optimality Score and the minor neurological dysfunction (MND) between the supplemented and un supplemented groups.
Physical growth:
Weight at four months (Outcome 1.22)
Studies using DHA plus AA: Adelaide 1996; Portland 1997 and Portland 2001 reported this outcome. Portland 2001 reported the outcomes as figures. Portland 1997 reported the outcomes as Z scores. No studies found statistically significant differences between LCPUFA and control groups. Meta‐analysis was not possible because only Adelaide 1996 provided the data as mean and standard deviations.
Studies using DHA alone: Adelaide 1996; France 2000 and Portland 1997 reported this outcome. Portland 1997 reported this outcome as z scores. None of the studies reported statistically significant differences between LCPUFA and control groups. Meta‐analysis of Adelaide 1996 and France 2000 studies did not reveal statistically significant differences between the LCPUFA and control groups (MD ‐0.03, 95% CI ‐0.33 to 0.27).
Length at four months (Outcome 1.23)
Studies using DHA plus AA: Adelaide 1996; Portland 1997 and Portland 2001 reported this outcome. Portland 2001 reported the outcomes in graphs. Portland 1997 reported the outcomes as Z scores. None of the studies reported statistically significant differences between LCPUFA and control groups. Meta‐analysis was not possible because only Adelaide 1996 provided the data as mean and standard deviations.
Studies using DHA alone: Adelaide 1996; France 2000 and Portland 1997 reported this outcome. Portland 1997 reported this outcome as z scores. Meta‐analysis of the pooled data from Adelaide 1996 and France 2000 did not reveal statistically significant differences between LCPUFA and control groups (MD 0.03, 95% CI ‐1.00 to 1.06).
Head circumference at four months (Outcome 1.24)
Studies using DHA plus AA: Adelaide 1996; Portland 1997 and Portland 2001 reported this outcome. Portland 2001 reported the outcomes as figures. Portland 1997 reported the outcomes as z scores. None of the studies reported statistically significant differences between LCPUFA and control groups. Meta‐analysis was not possible because only Adelaide 1996 provided the data as mean and standard deviations.
Studies using DHA alone: Adelaide 1996; Portland 1997 and France 2000 reported this outcome. Portland 1997 reported this outcome as z scores. Meta‐analysis of the pooled data from Adelaide 1996 and France 2000 did not reveal statistically significant differences between LCPUFA and control groups(MD ‐0.01, 95% CI ‐0.53 to 0.51).
Weight at six months (kg) (Outcome 1.25)
Studies using DHA plus AA: Portland 1997; Dallas 1998; England 1999; Portland 2001; China 2004; Netherlands 2005 and Wales 2000 reported this outcome. Dallas 1998 and Portland 1997 reported the outcomes as z scores. China 2004 reported the outcomes as rate of growth per week. None of the studies reported statistically significant differences between LCPUFA and control groups. Data from England 1999; Portland 2001; Netherlands 2005 and Wales 2000 was available in a format for meta‐analysis. The pooled meta‐analysis of these three studies also did not show statistically significant difference between LCPUFA and control groups (MD 0.01, 95% CI ‐0.11 to 0.13).
Studies using DHA alone: None
Length at six months (cm) (Outcome 1.26)
Studies using DHA plus AA: Portland 1997; Dallas 1998; England 1999; Wales 2000; Portland 2001; China 2004 and Netherlands 2005 reported this outcome. Dallas 1998 and Portland 1997 reported the outcomes as z scores. China 2004 reported the outcomes as rate of growth. None of the studies reported statistically significant differences between LCPUFA and control groups. Data from England 1999; Wales 2000; Portland 2001 and Netherlands 2005 was available in a format for meta‐analysis. The pooled meta‐analysis of these three studies did not show statistically significant difference between LCPUFA and control groups (MD ‐0.13, 95% CI ‐0.47 to 0.21).
Studies using DHA alone: None
Head circumference at six months (cm) (Outcome 1.27)
Studies using DHA plus AA: China 2004; Dallas 1998; England 1999; Netherlands 2005; Portland 1997; Portland 2001 and Wales 2000 reported this outcome. Dallas 1998 and Portland 1997 reported the outcomes as z scores. China 2004 reported the outcomes as rate of growth. None of the studies reported statistically significant differences between LCPUFA and control groups. Data from England 1999; Netherlands 2005; Portland 2001 and Wales 2000 was available in a format for meta‐analysis. The pooled meta‐analysis of these three studies did not show statistically significant difference between LCPUFA and control groups (MD ‐0.06, 95% CI ‐0.25 to 0.13).
Studies using DHA alone: None
Weight at one year (kg) (Outcome 1.28)
Studies using DHA plus AA: Milan 1995; Adelaide 1996; Portland 1997; Dallas 1998; Wales 2000; Portland 2001; Dallas 2005 and Netherlands 2005 reported this outcome. Dallas 1998 reported data in graphs. None of the studies reported statistically significant differences between LCPUFA and control groups. Pooled meta‐analysis of the data from Milan 1995; Adelaide 1996; Wales 2000; Portland 2001 and Netherlands 2005 did not show any statistically significant differences between LCPUFA and control groups (MD ‐0.11; 95% CI ‐0.28 to 0.05).
Studies using DHA alone: Adelaide 1995; Adelaide 1996 and Portland 1997 reported this outcome. None of the studies found statistically significant differences between LCPUFA and control groups. Pooled meta‐analysis from Adelaide 1995 and Adelaide 1996 did not show statistically significant differences between LCPUFA and control groups (MD ‐0.43, 95% CI ‐0.96 to 0.09).
Weight at one year (z scores) (Outcome 1.29)
Studies using DHA plus AA: Milan 1995; Portland 1997; Dallas 1998; Dallas 2005 and Dallas 2010 reported this outcome. Dallas 1998 reported data in graphs. None of the studies reported statistically significant differences between LCPUFA and control groups. However, pooled meta‐analysis of the z scores from Milan 1995; Portland 1997; Portland 2001; Dallas 2005 and Dallas 2010 showed statistically significant lower weight in the LCPUFA group compared to the control group (MD ‐0.23, 95% CI ‐0.4 to ‐0.06).
Studies using DHA alone: Portland 1997 reported this outcome. They did not find statistically significant differences between LCPUFA and control groups.
Length at one year (cm) (Outcome 1.30)
Studies using DHA plus AA: Milan 1995; Adelaide 1996; Wales 2000; Portland 2001 and Netherlands 2005 reported this outcome. None of the individual studies find statistically significant differences between LCPUFA and control groups. Pooled meta‐analysis of the data from Milan 1995; Adelaide 1996; Portland 2001; Netherlands 2005 and Wales 2000 did not show any statistically significant differences between LCPUFA and control groups (MD ‐0.15, 95% CI ‐0.57, 0.28).
Studies using DHA alone: Adelaide 1995 and Adelaide 1996 reported this outcome. None of the individual studies reported statistically significant differences between LCPUFA and control groups. Pooled meta‐analysis of the data from Adelaide 1995 and Adelaide 1996 did not find statistically significant differences between LCPUFA and control groups (MD ‐0.95, 95% CI ‐2.05 to 0.15).
Length at one year (z scores) (Outcome 1.31)
Milan 1995; Portland 1997; Dallas 1998; Portland 2001; Dallas 2005 and Dallas 2010 reported these outcomes. Dallas 1998 reported data in figures. None of the individual studies find statistically significant differences between LCPUFA and control groups. Pooled meta‐analysis of the z scores from Milan 1995; Portland 1997; Portland 2001; Dallas 2005 and also did not find statistically significant differences between LCPUFA and control groups (MD ‐0.04, 95% CI ‐0.19 to 0.11).
Studies using DHA alone: Portland 1997 reported this outcome and did not find statistically significant differences between LCPUFA and control groups (0.09 ± 0.98 vs. ‐0.01 ± 1.15).
Head circumference at one year (cm) (Outcome 1.32)
Studies using DHA plus AA: Adelaide 1996; Portland 2001; Wales 2000 and Netherlands 2005 reported this outcome. None of the individual studies reported statistically significant differences between LCPUFA and control groups. Pooled meta‐analysis of data from Adelaide 1996; Wales 2000; Portland 2001 and Netherlands 2005 did not show any statistically significant differences between LCPUFA and control groups (MD ‐0.13, 95% CI ‐0.36 to 0.11).
Studies using DHA alone: Adelaide 1995; Adelaide 1996 reported this outcome. None of the individual studies reported statistically significant differences between LCPUFA and control groups. Pooled meta‐analysis of the data from Adelaide 1995 and Adelaide 1996 did not show statistically significant differences between LCPUFA and controls (MD ‐0.22, 95% CI ‐0.80 to 0.37).
Head circumference at one year (z scores) (Outcome 1.33)
Studies using DHA plus AA: Portland 1997; Dallas 1998; Portland 2001; Dallas 2005 and Dallas 2010 reported outcome. Dallas 1998 reported the data in figures. None of the studies reported statistically significant differences between LCPUFA and control groups. Pooled meta‐analysis z scores from Portland 1997; Portland 2001; Dallas 2005 and Dallas 2010 also did not find statistically significant differences between LCPUFA and control groups (MD ‐0.13; 95% CI ‐0.32 to 0.05).
Studies using DHA alone: Portland 1997 reported this outcome and did not find statistically significant differences between LCPUFA and control groups (0.25 ± 0.92 vs. 0.18 ± 1.01)
Weight at 18 months (kg) (Outcome 1.34)
Studies using DHA plus AA:England 1999 and Netherlands 2005 reported this outcome. They did not find statistically significant differences between the two groups. Pooled meta‐analysis of both the trials also did not find statistically significant differences between LCPUFA and control groups (MD ‐0.04, 95% CI ‐0.25 to 0.17).
Studies using DHA alone: None
Length at 18 months (cm) (Outcome 1.35)
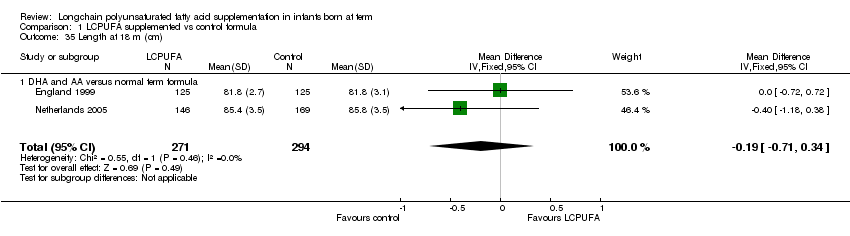
Studies using DHA plus AA: England 1999 and Netherlands 2005 reported this outcome. They did not find statistically significant differences between the two groups. Pooled meta‐analysis of both the trials also did not find statistically significant differences between LCPUFA and control groups (MD ‐0.19, 95% CI ‐0.71 to 0.34).
Studies using DHA alone: None
Head circumference at 18 months (cm) (Outcome 1.36)
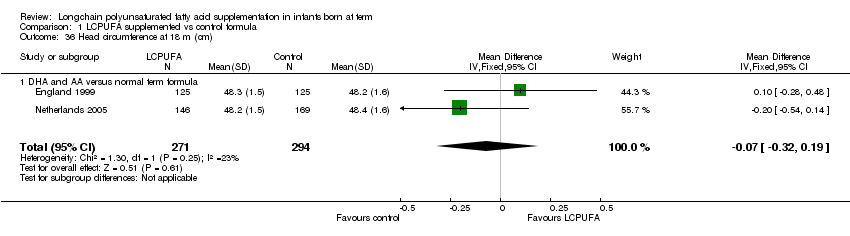
Studies using DHA plus AA: England 1999 and Netherlands 2005 reported this outcome. They did not find statistically significant differences between the two groups. Pooled meta‐analysis of both the trials also did not find statistically significant differences between LCPUFA and control groups (MD ‐0.07, 95% CI ‐0.32 to 0.19).
Studies using DHA alone: None
Weight at two years (kg) (Outcome 1.37)
Studies using DHA plus AA: Adelaide 1996 reported this outcome and did not find any statistically significant differences between LCPUFA and control formula (12.78 ± 1.53 vs. 13.54 ± 1.40)
Studies using DHA alone: Adelaide 1996 reported this outcome and did not find statistically significant differences between LCPUFA and control groups (12.75 ± 1.47 vs. 13.54 ± 1.39).
Length at two years (cm) (Outcome 1.38)
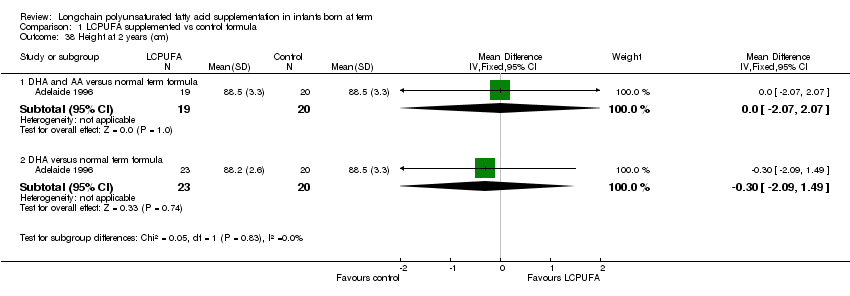
Studies using DHA plus AA: Adelaide 1996 reported this outcome and did not find any statistically significant differences between LCPUFA and control formula.
Studies using DHA alone: Adelaide 1996 reported this outcome. They did not find statistically significant differences between LCPUFA and control groups.
Head circumference at two years (cm) (Outcome 1.39)
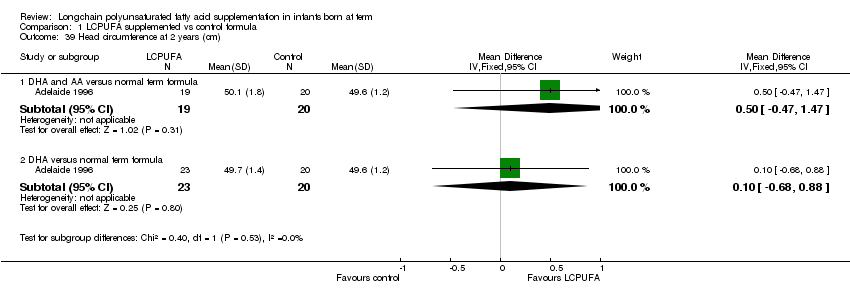
Studies using DHA plus AA: Adelaide 1996 reported this outcome and did not find any statistically significant differences between LCPUFA and control formula.
Studies using DHA alone: Adelaide 1996 reported this outcome and did not find statistically significant differences between LCPUFA and control groups.
Physical growth at three years
Studies using DHA plus AA: Portland 1997 described the outcomes separately for boys and girls at 3.25 years of age. They did not find statistically significant differences between LCPUFA and control groups in both sexes for length, weight and head circumference at 3.25 years of age.
Studies using DHA alone: Portland 1997 described the outcomes separately for boys and girls at 3.25 years of age. They did not find statistically significant differences between LCPUFA and control groups in both sexes for length, weight and head circumference at 3.25 years of age.
Discussion
Data from 1889 term infants from 15 randomised controlled trials have been reported in this review. There was significant variation among studies regarding the type, concentration and duration of supplementation of LCPUFA. Variation was also noted in the outcomes assessed and methods used for assessing the outcomes. In different studies, the visual acuity was measured at 1.5, four, six, nine, twelve months and three years; visual acuity was tested using sweep VEP, steady state VEP and teller cards; and the neurodevelopmental outcomes were assessed at three, four, six, twelve months, eighteen months, two years, three years and 9 years. In the majority of studies, neurodevelopmental outcome was assessed using Bailey's scores. Physical growth was assessed at four, six, twelve months, two years and three years in different studies. Some studies used the standard physical measurements like weight (kg), length (cm) and head circumference (cm). Some studies described z scores for physical measurements.
Data from these randomised clinical trials do not demonstrate a clear or consistent benefit of supplementing formula with LCPUFA on visual acuity, neurodevelopmental outcomes and physical growth in term infants.
Adelaide 1995; Dallas 1998; Dallas 2005 and Dallas 2010 demonstrated beneficial effects of LCPUFA supplementation on visual acuity. These beneficial effects have not been replicated in other good quality RCTs such as Adelaide 1996; Memphis 1996; Portland 1997 and Portland 2001.
Dallas 1998 and Dallas 2010 showed benefits of LCPUFA supplementation on MDI scores at 18 months. Scotland 1998 have demonstrated that LCPUFA supplementation resulted in better problem solving skills at 10 months of age. These beneficial effects on neurodevelopmental outcomes have not been replicated in other RCTs such as Adelaide 1995; Milan 1995; Adelaide 1996; Portland 1997; England 1999; Portland 2001; China 2004 and Netherlands 2005. Two other independent meta analyses also did not find any beneficial effect of LCPUFA supplementation on neurodevelopmental outcomes in term infants (Makrides 2010; Beyerlein 2010). In addition, follow up data from the Netherlands 2005 trial showed no effect of LCPUFA supplementation on the neurological function at 9 years of age.
Various theories have been suggested as reasons for such inconsistent results. Lauritzen 2001 proposed that higher dose of DHA may be necessary to achieve beneficial effects. Uauy 2003 has proposed both higher dose as well as longer duration of LCPUFA supplementation to achieve better outcomes. However studies which used LCPUFA supplementation until one year of age (Adelaide 1996; Memphis 1996; Portland 1997 and Portland 2001) failed to demonstrate beneficial effects of LCPUFA supplementation. Dallas 2010 which found beneficial effect of supplementation (0.32% DHA and 0.64% ARA), also reported that higher doses of DHA (0.64%, 0.96%) did not confer any additional benefits on visual acuity.
In a recent review Meldrum et al (Meldrum 2011) suggested that sample size, genetic polymorphisms, gender, source of supplement, dose, timing of supplementation, duration of supplementation, compliance with treatment and the selection of the test for assessment of neurodevelopmental outcomes may be the factors responsible for the inconsistent results.
The Dallas group that used LCUPFA derived from single cell microalgae (Crypthecodinium cohnii: DHA) and fungi (Mortierella alpina: AA), at a DHA concentration of at least 0.32% for one year has shown consistently beneficial effects. Future RCTs may need to consider this approach.
None of the studies showed beneficial effects of LCPUFA supplementation on weight, length and head circumference until three years of age. The results were same irrespective of the type, concentration and duration of LCPUFA supplementation. Even thought the pooled meta analysis showed a trend towards marginally lower weight and head circumference at one year of age in the LCPUFA supplemented group, the differences were small and unlikely to be of clinical significance. A meta‐analysis of the individual patient data (Rosenfeld 2009) which included 624 infants from two full term RCTs (England 1999; Netherlands 2005) and 439 infants from two preterm trials also found lack of any effect of LCPUFA supplementation on children's physical growth at 18 months of age.

Comparison 1 LCPUFA supplemented vs control formula, Outcome 1 VEP acuity at 4 m (log MAR, steady state).

Comparison 1 LCPUFA supplemented vs control formula, Outcome 2 Sweep VEP acuity at 4m of age (logMAR).
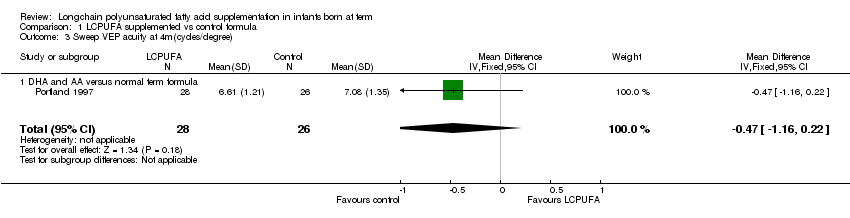
Comparison 1 LCPUFA supplemented vs control formula, Outcome 3 Sweep VEP acuity at 4m(cycles/degree).
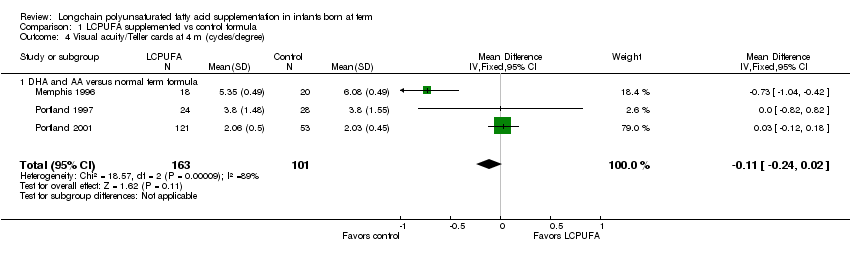
Comparison 1 LCPUFA supplemented vs control formula, Outcome 4 Visual acuity/Teller cards at 4 m (cycles/degree).

Comparison 1 LCPUFA supplemented vs control formula, Outcome 5 Sweep VEP acuity at 6m(cycles/degree).

Comparison 1 LCPUFA supplemented vs control formula, Outcome 6 Visual acuity/Teller cards at 6 m (cycles/degree).

Comparison 1 LCPUFA supplemented vs control formula, Outcome 7 VEP acuity at 7‐8 m (log MAR, steady state).

Comparison 1 LCPUFA supplemented vs control formula, Outcome 8 sweep VEP acuity at 12 months (LogMAR).

Comparison 1 LCPUFA supplemented vs control formula, Outcome 9 Sweep VEP acuity at 12m(cycles/degree).

Comparison 1 LCPUFA supplemented vs control formula, Outcome 10 Visual acuity/Teller cards at 12 m (cycles/degree).

Comparison 1 LCPUFA supplemented vs control formula, Outcome 11 Visual acuity at 3 years (Teller acuity cards; cy/deg).
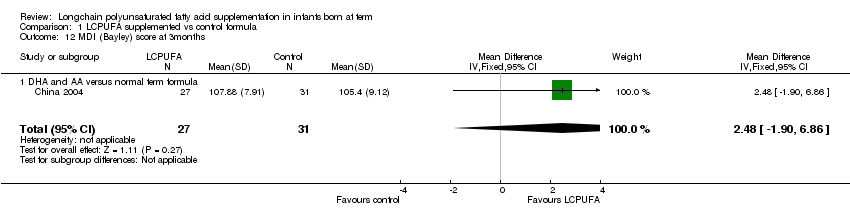
Comparison 1 LCPUFA supplemented vs control formula, Outcome 12 MDI (Bayley) score at 3months.

Comparison 1 LCPUFA supplemented vs control formula, Outcome 13 PDI (Bayley) score at 3months.

Comparison 1 LCPUFA supplemented vs control formula, Outcome 14 MDI (Bayley) score at 6months.
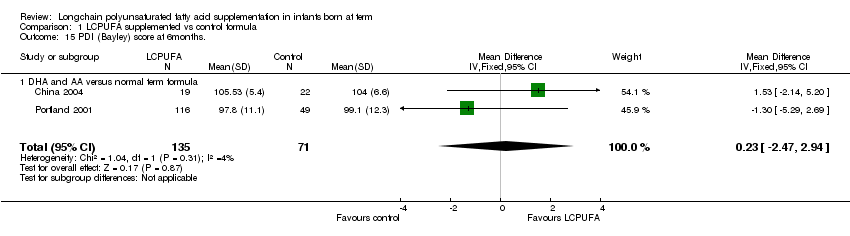
Comparison 1 LCPUFA supplemented vs control formula, Outcome 15 PDI (Bayley) score at 6months..

Comparison 1 LCPUFA supplemented vs control formula, Outcome 16 MDI (Bayley score) at 1 year.
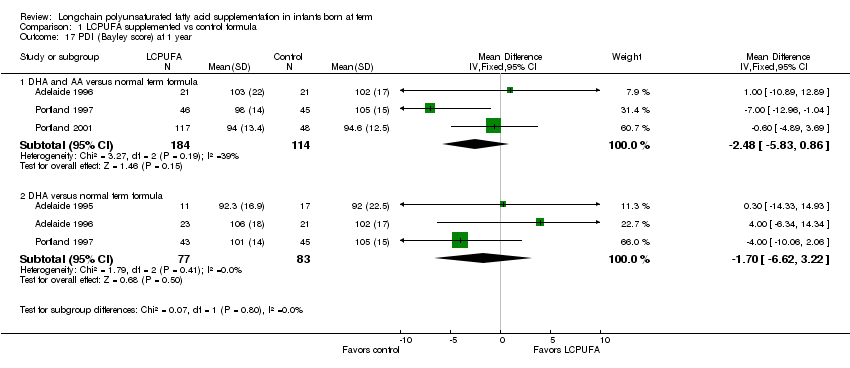
Comparison 1 LCPUFA supplemented vs control formula, Outcome 17 PDI (Bayley score) at 1 year.

Comparison 1 LCPUFA supplemented vs control formula, Outcome 18 MDI (Bayley score) at 18 m.

Comparison 1 LCPUFA supplemented vs control formula, Outcome 19 PDI (Bayley score) at 18 m.

Comparison 1 LCPUFA supplemented vs control formula, Outcome 20 MDI (Bayley score) at 2 years.

Comparison 1 LCPUFA supplemented vs control formula, Outcome 21 PDI (Bayley score) at 2 years.
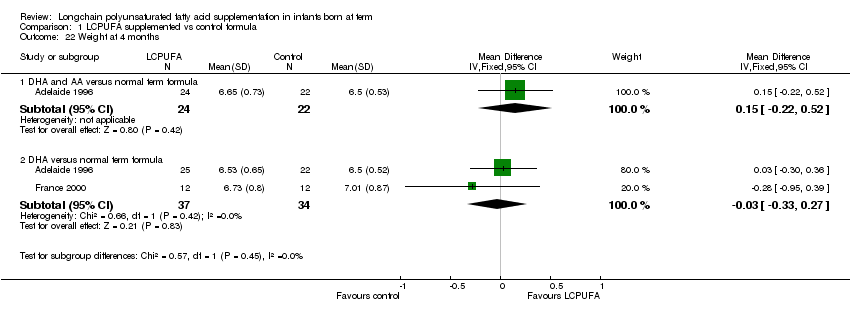
Comparison 1 LCPUFA supplemented vs control formula, Outcome 22 Weight at 4 months.

Comparison 1 LCPUFA supplemented vs control formula, Outcome 23 Length at 4 months.

Comparison 1 LCPUFA supplemented vs control formula, Outcome 24 Head circumference at 4 months.
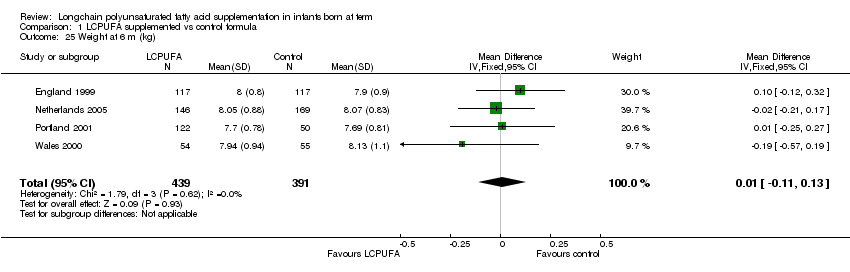
Comparison 1 LCPUFA supplemented vs control formula, Outcome 25 Weight at 6 m (kg).
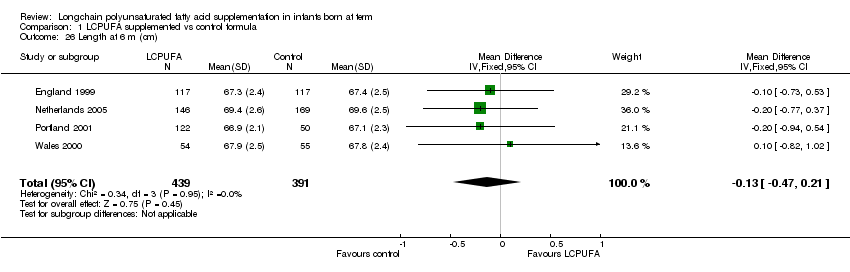
Comparison 1 LCPUFA supplemented vs control formula, Outcome 26 Length at 6 m (cm).
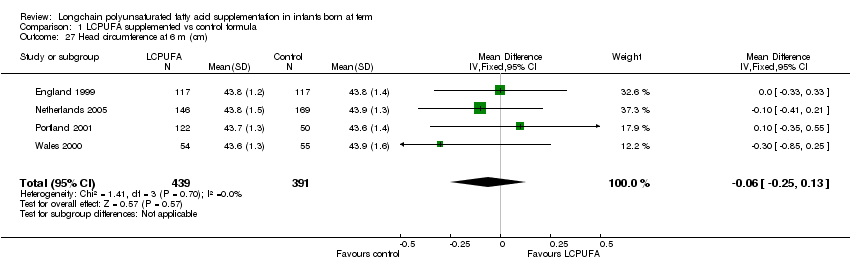
Comparison 1 LCPUFA supplemented vs control formula, Outcome 27 Head circumference at 6 m (cm).

Comparison 1 LCPUFA supplemented vs control formula, Outcome 28 Weight at 12 m (kg).
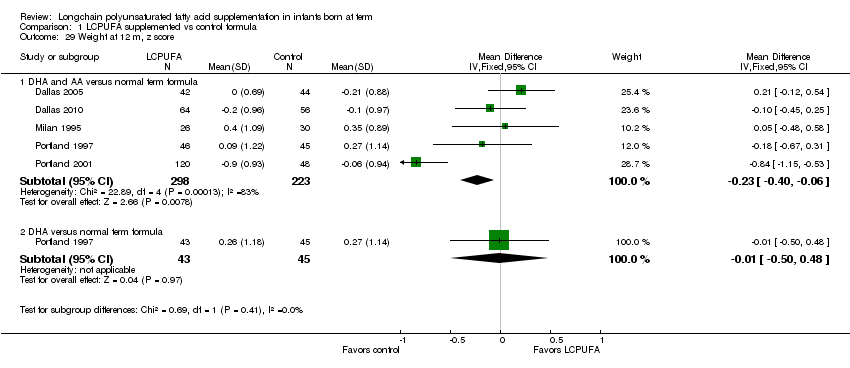
Comparison 1 LCPUFA supplemented vs control formula, Outcome 29 Weight at 12 m, z score.
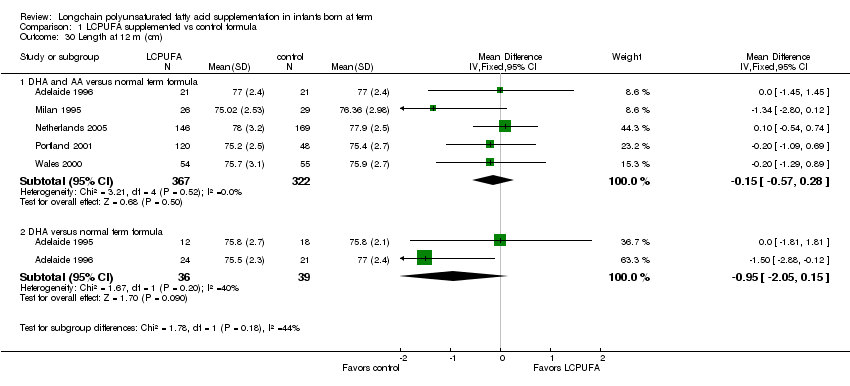
Comparison 1 LCPUFA supplemented vs control formula, Outcome 30 Length at 12 m (cm).

Comparison 1 LCPUFA supplemented vs control formula, Outcome 31 Length at 12 m, z score.
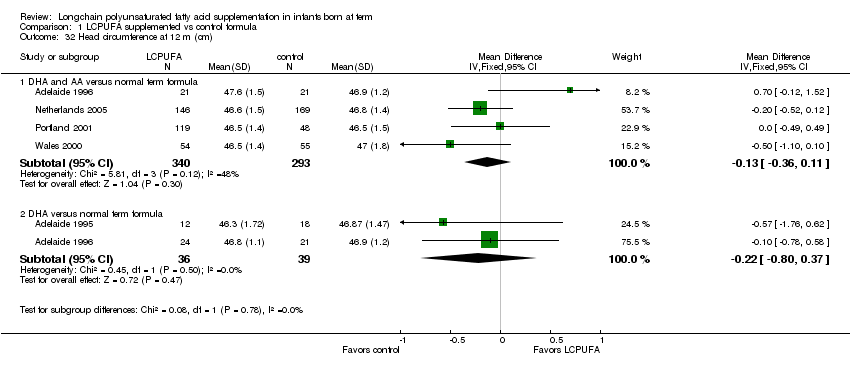
Comparison 1 LCPUFA supplemented vs control formula, Outcome 32 Head circumference at 12 m (cm).

Comparison 1 LCPUFA supplemented vs control formula, Outcome 33 Head circumference at 12 m, z score.

Comparison 1 LCPUFA supplemented vs control formula, Outcome 34 Weight at 18 m (kg).
Comparison 1 LCPUFA supplemented vs control formula, Outcome 35 Length at 18 m (cm).
Comparison 1 LCPUFA supplemented vs control formula, Outcome 36 Head circumference at 18 m (cm).

Comparison 1 LCPUFA supplemented vs control formula, Outcome 37 Weight at 2 years (kg).
Comparison 1 LCPUFA supplemented vs control formula, Outcome 38 Height at 2 years (cm).
Comparison 1 LCPUFA supplemented vs control formula, Outcome 39 Head circumference at 2 years (cm).
| Outcome or subgroup title | No. of studies | No. of participants | Statistical method | Effect size |
| 1 VEP acuity at 4 m (log MAR, steady state) Show forest plot | 2 | Mean Difference (IV, Fixed, 95% CI) | Subtotals only | |
| 1.1 DHA and AA versus normal term formula | 1 | 30 | Mean Difference (IV, Fixed, 95% CI) | 0.01 [‐0.07, 0.09] |
| 1.2 DHA versus normal term formula | 2 | 60 | Mean Difference (IV, Fixed, 95% CI) | ‐0.03 [‐0.10, 0.03] |
| 2 Sweep VEP acuity at 4m of age (logMAR) Show forest plot | 3 | Mean Difference (IV, Fixed, 95% CI) | Subtotals only | |
| 2.1 DHA and AA versus normal term formula | 3 | 266 | Mean Difference (IV, Fixed, 95% CI) | ‐0.08 [‐0.10, ‐0.05] |
| 2.2 DHA versus normal term formula | 1 | 41 | Mean Difference (IV, Fixed, 95% CI) | ‐0.08 [‐0.15, ‐0.01] |
| 3 Sweep VEP acuity at 4m(cycles/degree) Show forest plot | 1 | 54 | Mean Difference (IV, Fixed, 95% CI) | ‐0.47 [‐1.16, 0.22] |
| 3.1 DHA and AA versus normal term formula | 1 | 54 | Mean Difference (IV, Fixed, 95% CI) | ‐0.47 [‐1.16, 0.22] |
| 4 Visual acuity/Teller cards at 4 m (cycles/degree) Show forest plot | 3 | 264 | Mean Difference (IV, Fixed, 95% CI) | ‐0.11 [‐0.24, 0.02] |
| 4.1 DHA and AA versus normal term formula | 3 | 264 | Mean Difference (IV, Fixed, 95% CI) | ‐0.11 [‐0.24, 0.02] |
| 5 Sweep VEP acuity at 6m(cycles/degree) Show forest plot | 1 | 53 | Mean Difference (IV, Fixed, 95% CI) | ‐0.31 [‐1.04, 0.42] |
| 5.1 DHA and AA versus normal term formula | 1 | 53 | Mean Difference (IV, Fixed, 95% CI) | ‐0.31 [‐1.04, 0.42] |
| 6 Visual acuity/Teller cards at 6 m (cycles/degree) Show forest plot | 3 | Mean Difference (IV, Fixed, 95% CI) | Subtotals only | |
| 6.1 DHA and AA versus normal term formula | 3 | 256 | Mean Difference (IV, Fixed, 95% CI) | 0.02 [‐0.11, 0.15] |
| 7 VEP acuity at 7‐8 m (log MAR, steady state) Show forest plot | 2 | Mean Difference (IV, Fixed, 95% CI) | Subtotals only | |
| 7.1 DHA and AA versus normal term formula | 1 | 30 | Mean Difference (IV, Fixed, 95% CI) | 0.0 [‐0.13, 0.13] |
| 7.2 DHA versus normal term formula | 2 | 52 | Mean Difference (IV, Fixed, 95% CI) | ‐0.02 [‐0.14, 0.10] |
| 8 sweep VEP acuity at 12 months (LogMAR) Show forest plot | 3 | Mean Difference (IV, Fixed, 95% CI) | Subtotals only | |
| 8.1 DHA and AA versus normal term formula | 3 | 244 | Mean Difference (IV, Fixed, 95% CI) | ‐0.15 [‐0.17, ‐0.13] |
| 8.2 DHA versus normal term formula | 1 | 40 | Mean Difference (IV, Fixed, 95% CI) | ‐0.14 [‐0.21, ‐0.07] |
| 9 Sweep VEP acuity at 12m(cycles/degree) Show forest plot | 1 | 53 | Mean Difference (IV, Fixed, 95% CI) | 0.0 [‐0.71, 0.71] |
| 9.1 DHA and AA versus normal term formula | 1 | 53 | Mean Difference (IV, Fixed, 95% CI) | 0.0 [‐0.71, 0.71] |
| 10 Visual acuity/Teller cards at 12 m (cycles/degree) Show forest plot | 3 | 256 | Mean Difference (IV, Fixed, 95% CI) | ‐0.01 [‐0.12, 0.11] |
| 10.1 DHA and AA versus normal term formula | 3 | 256 | Mean Difference (IV, Fixed, 95% CI) | ‐0.01 [‐0.12, 0.11] |
| 11 Visual acuity at 3 years (Teller acuity cards; cy/deg) Show forest plot | 1 | Mean Difference (IV, Fixed, 95% CI) | Subtotals only | |
| 11.1 DHA and AA versus normal term formula | 1 | 68 | Mean Difference (IV, Fixed, 95% CI) | ‐2.10 [‐2.41, ‐1.79] |
| 11.2 DHA versus normal term formula | 1 | 68 | Mean Difference (IV, Fixed, 95% CI) | ‐2.80 [‐3.11, ‐2.49] |
| 12 MDI (Bayley) score at 3months Show forest plot | 1 | 58 | Mean Difference (IV, Fixed, 95% CI) | 2.48 [‐1.90, 6.86] |
| 12.1 DHA and AA versus normal term formula | 1 | 58 | Mean Difference (IV, Fixed, 95% CI) | 2.48 [‐1.90, 6.86] |
| 13 PDI (Bayley) score at 3months Show forest plot | 1 | 58 | Mean Difference (IV, Fixed, 95% CI) | 3.66 [0.43, 6.89] |
| 13.1 DHA and AA versus normal term formula | 1 | 58 | Mean Difference (IV, Fixed, 95% CI) | 3.66 [0.43, 6.89] |
| 14 MDI (Bayley) score at 6months Show forest plot | 2 | 207 | Mean Difference (IV, Fixed, 95% CI) | ‐0.59 [‐2.26, 1.07] |
| 14.1 DHA and AA versus normal term formula | 2 | 207 | Mean Difference (IV, Fixed, 95% CI) | ‐0.59 [‐2.26, 1.07] |
| 15 PDI (Bayley) score at 6months. Show forest plot | 2 | 206 | Mean Difference (IV, Fixed, 95% CI) | 0.23 [‐2.47, 2.94] |
| 15.1 DHA and AA versus normal term formula | 2 | 206 | Mean Difference (IV, Fixed, 95% CI) | 0.23 [‐2.47, 2.94] |
| 16 MDI (Bayley score) at 1 year Show forest plot | 4 | Mean Difference (IV, Fixed, 95% CI) | Subtotals only | |
| 16.1 DHA and AA versus normal term formula | 3 | 298 | Mean Difference (IV, Fixed, 95% CI) | ‐0.95 [‐3.38, 1.49] |
| 16.2 DHA versus normal term formula | 3 | 160 | Mean Difference (IV, Fixed, 95% CI) | ‐0.27 [‐4.36, 3.83] |
| 17 PDI (Bayley score) at 1 year Show forest plot | 4 | Mean Difference (IV, Fixed, 95% CI) | Subtotals only | |
| 17.1 DHA and AA versus normal term formula | 3 | 298 | Mean Difference (IV, Fixed, 95% CI) | ‐2.48 [‐5.83, 0.86] |
| 17.2 DHA versus normal term formula | 3 | 160 | Mean Difference (IV, Fixed, 95% CI) | ‐1.70 [‐6.62, 3.22] |
| 18 MDI (Bayley score) at 18 m Show forest plot | 4 | 661 | Mean Difference (IV, Fixed, 95% CI) | 0.06 [‐2.01, 2.14] |
| 18.1 DHA and AA versus normal term formula | 4 | 661 | Mean Difference (IV, Fixed, 95% CI) | 0.06 [‐2.01, 2.14] |
| 19 PDI (Bayley score) at 18 m Show forest plot | 4 | 661 | Mean Difference (IV, Fixed, 95% CI) | 0.69 [‐0.78, 2.16] |
| 19.1 DHA and AA versus normal term formula | 4 | 661 | Mean Difference (IV, Fixed, 95% CI) | 0.69 [‐0.78, 2.16] |
| 20 MDI (Bayley score) at 2 years Show forest plot | 1 | Mean Difference (IV, Fixed, 95% CI) | Subtotals only | |
| 20.1 DHA and AA versus normal term formula | 1 | 38 | Mean Difference (IV, Fixed, 95% CI) | ‐2.0 [‐13.88, 9.88] |
| 20.2 DHA versus normal term formula | 1 | 41 | Mean Difference (IV, Fixed, 95% CI) | 4.0 [‐4.88, 12.88] |
| 21 PDI (Bayley score) at 2 years Show forest plot | 1 | Mean Difference (IV, Fixed, 95% CI) | Subtotals only | |
| 21.1 DHA and AA versus normal term formula | 1 | 37 | Mean Difference (IV, Fixed, 95% CI) | ‐1.0 [‐12.71, 10.71] |
| 21.2 DHA versus normal term formula | 1 | 37 | Mean Difference (IV, Fixed, 95% CI) | 7.00 [‐3.32, 17.32] |
| 22 Weight at 4 months Show forest plot | 2 | Mean Difference (IV, Fixed, 95% CI) | Subtotals only | |
| 22.1 DHA and AA versus normal term formula | 1 | 46 | Mean Difference (IV, Fixed, 95% CI) | 0.15 [‐0.22, 0.52] |
| 22.2 DHA versus normal term formula | 2 | 71 | Mean Difference (IV, Fixed, 95% CI) | ‐0.03 [‐0.33, 0.27] |
| 23 Length at 4 months Show forest plot | 2 | Mean Difference (IV, Fixed, 95% CI) | Subtotals only | |
| 23.1 DHA and AA versus normal term formula | 1 | 46 | Mean Difference (IV, Fixed, 95% CI) | 0.0 [‐1.45, 1.45] |
| 23.2 DHA versus normal term formula | 2 | 71 | Mean Difference (IV, Fixed, 95% CI) | 0.03 [1.00, 1.06] |
| 24 Head circumference at 4 months Show forest plot | 2 | Mean Difference (IV, Fixed, 95% CI) | Subtotals only | |
| 24.1 DHA and AA versus normal term formula | 1 | 46 | Mean Difference (IV, Fixed, 95% CI) | 0.5 [‐0.26, 1.26] |
| 24.2 DHA versus normal term formula | 2 | 71 | Mean Difference (IV, Fixed, 95% CI) | ‐0.01 [‐0.53, 0.51] |
| 25 Weight at 6 m (kg) Show forest plot | 4 | 830 | Mean Difference (IV, Fixed, 95% CI) | 0.01 [‐0.11, 0.13] |
| 26 Length at 6 m (cm) Show forest plot | 4 | 830 | Mean Difference (IV, Fixed, 95% CI) | ‐0.13 [‐0.47, 0.21] |
| 27 Head circumference at 6 m (cm) Show forest plot | 4 | 830 | Mean Difference (IV, Fixed, 95% CI) | ‐0.06 [‐0.25, 0.13] |
| 28 Weight at 12 m (kg) Show forest plot | 6 | Mean Difference (IV, Fixed, 95% CI) | Subtotals only | |
| 28.1 DHA and AA versus normal term infant | 5 | 689 | Mean Difference (IV, Fixed, 95% CI) | ‐0.11 [‐0.28, 0.05] |
| 28.2 DHA versus normal term formula | 2 | 75 | Mean Difference (IV, Fixed, 95% CI) | ‐0.43 [‐0.96, 0.09] |
| 29 Weight at 12 m, z score Show forest plot | 5 | Mean Difference (IV, Fixed, 95% CI) | Subtotals only | |
| 29.1 DHA and AA versus normal term formula | 5 | 521 | Mean Difference (IV, Fixed, 95% CI) | ‐0.23 [‐0.40, ‐0.06] |
| 29.2 DHA versus normal term formula | 1 | 88 | Mean Difference (IV, Fixed, 95% CI) | ‐0.01 [‐0.50, 0.48] |
| 30 Length at 12 m (cm) Show forest plot | 6 | Mean Difference (IV, Fixed, 95% CI) | Subtotals only | |
| 30.1 DHA and AA versus normal term formula | 5 | 689 | Mean Difference (IV, Fixed, 95% CI) | ‐0.15 [‐0.57, 0.28] |
| 30.2 DHA versus normal term formula | 2 | 75 | Mean Difference (IV, Fixed, 95% CI) | ‐0.95 [‐2.05, 0.15] |
| 31 Length at 12 m, z score Show forest plot | 5 | Mean Difference (IV, Fixed, 95% CI) | Subtotals only | |
| 31.1 DHA and AA versus normal term formula | 5 | 521 | Mean Difference (IV, Fixed, 95% CI) | ‐0.04 [‐0.19, 0.11] |
| 31.2 DHA versus normal term formula | 1 | 88 | Mean Difference (IV, Fixed, 95% CI) | 0.10 [‐0.35, 0.55] |
| 32 Head circumference at 12 m (cm) Show forest plot | 5 | Mean Difference (IV, Fixed, 95% CI) | Subtotals only | |
| 32.1 DHA and AA versus normal term formula | 4 | 633 | Mean Difference (IV, Fixed, 95% CI) | ‐0.13 [‐0.36, 0.11] |
| 32.2 DHA versus normal term formula | 2 | 75 | Mean Difference (IV, Fixed, 95% CI) | ‐0.22 [‐0.80, 0.37] |
| 33 Head circumference at 12 m, z score Show forest plot | 4 | Mean Difference (IV, Fixed, 95% CI) | Subtotals only | |
| 33.1 DHA and AA versus normal term formula | 4 | 464 | Mean Difference (IV, Fixed, 95% CI) | ‐0.13 [‐0.32, 0.05] |
| 33.2 DHA versus normal term formula | 1 | 88 | Mean Difference (IV, Fixed, 95% CI) | 0.07 [‐0.33, 0.47] |
| 34 Weight at 18 m (kg) Show forest plot | 2 | 563 | Mean Difference (IV, Fixed, 95% CI) | ‐0.04 [‐0.25, 0.17] |
| 34.1 DHA and AA versus normal term formula | 2 | 563 | Mean Difference (IV, Fixed, 95% CI) | ‐0.04 [‐0.25, 0.17] |
| 35 Length at 18 m (cm) Show forest plot | 2 | 565 | Mean Difference (IV, Fixed, 95% CI) | ‐0.19 [‐0.71, 0.34] |
| 35.1 DHA and AA versus normal term formula | 2 | 565 | Mean Difference (IV, Fixed, 95% CI) | ‐0.19 [‐0.71, 0.34] |
| 36 Head circumference at 18 m (cm) Show forest plot | 2 | 565 | Mean Difference (IV, Fixed, 95% CI) | ‐0.07 [‐0.32, 0.19] |
| 36.1 DHA and AA versus normal term formula | 2 | 565 | Mean Difference (IV, Fixed, 95% CI) | ‐0.07 [‐0.32, 0.19] |
| 37 Weight at 2 years (kg) Show forest plot | 1 | Mean Difference (IV, Fixed, 95% CI) | Subtotals only | |
| 37.1 DHA and AA versus normal term formula | 1 | 39 | Mean Difference (IV, Fixed, 95% CI) | ‐0.76 [‐1.68, 0.16] |
| 37.2 DHA versus normal term formula | 1 | 43 | Mean Difference (IV, Fixed, 95% CI) | ‐0.79 [‐1.65, 0.07] |
| 38 Height at 2 years (cm) Show forest plot | 1 | Mean Difference (IV, Fixed, 95% CI) | Subtotals only | |
| 38.1 DHA and AA versus normal term formula | 1 | 39 | Mean Difference (IV, Fixed, 95% CI) | 0.0 [‐2.07, 2.07] |
| 38.2 DHA versus normal term formula | 1 | 43 | Mean Difference (IV, Fixed, 95% CI) | ‐0.30 [‐2.09, 1.49] |
| 39 Head circumference at 2 years (cm) Show forest plot | 1 | Mean Difference (IV, Fixed, 95% CI) | Subtotals only | |
| 39.1 DHA and AA versus normal term formula | 1 | 39 | Mean Difference (IV, Fixed, 95% CI) | 0.5 [‐0.47, 1.47] |
| 39.2 DHA versus normal term formula | 1 | 43 | Mean Difference (IV, Fixed, 95% CI) | 0.10 [‐0.68, 0.88] |