Pelvimetry for fetal cephalic presentations at or near term for deciding on mode of delivery
Abstract
Background
Pelvimetry assesses the size of a woman's pelvis aiming to predict whether she will be able to give birth vaginally or not. This can be done by clinical examination, or by conventional X‐rays, computerised tomography (CT) scanning, or magnetic resonance imaging (MRI).
Objectives
To assess the effects of pelvimetry (performed antenatally or intrapartum) on the method of birth, on perinatal mortality and morbidity, and on maternal morbidity. This review concentrates exclusively on women whose fetuses have a cephalic presentation.
Search methods
We searched Cochrane Pregnancy and Childbirth Group's Trials Register (31 January 2017) and reference lists of retrieved studies.
Selection criteria
Randomised controlled trials (including quasi‐randomised) assessing the use of pelvimetry versus no pelvimetry or assessing different types of pelvimetry in women with a cephalic presentation at or near term were included. Cluster trials were eligible for inclusion, but none were identified.
Data collection and analysis
Two review authors independently assessed trials for inclusion and risk of bias, extracted data and checked them for accuracy. We assessed the quality of the evidence using the GRADE approach.
Main results
Five trials with a total of 1159 women were included. All used X‐ray pelvimetry to assess the pelvis. X‐ray pelvimetry versus no pelvimetry or clinical pelvimetry is the only comparison included in this review due to the lack of trials identified that examined other types of radiological pelvimetry or that compared clinical pelvimetry versus no pelvimetry.
The included trials were generally at high risk of bias. There is an overall high risk of performance bias due to lack of blinding of women and staff. Two studies were also at high risk of selection bias. We used GRADEpro software to grade evidence for our selected outcomes; for caesarean section we rated the evidence low quality and all the other outcomes (perinatal mortality, wound sepsis, blood transfusion, scar dehiscence and admission to special care baby unit) as very low quality. Downgrading was due to risk of bias relating to lack of allocation concealment and blinding, and imprecision of effect estimates.
Women undergoing X‐ray pelvimetry were more likely to have a caesarean section (risk ratio (RR) 1.34, 95% confidence interval (CI) 1.19 to 1.52; 1159 women; 5 studies; low‐quality evidence). There were no clear differences between groups for perinatal outcomes: perinatal mortality (RR 0.53, 95% CI 0.19 to 1.45; 1159 infants; 5 studies; very low‐quality evidence), perinatal asphyxia (RR 0.66, 95% CI 0.39 to 1.10; 305 infants; 1 study), and admission to special care baby unit (RR 0.20, 95% CI 0.01 to 4.13; 288 infants; 1 study; very low‐quality evidence). Other outcomes assessed were wound sepsis (RR 0.83, 95% CI 0.26 to 2.67; 288 women; 1 study; very low‐quality evidence), blood transfusion (RR 1.00, 95% CI 0.39 to 2.59; 288 women; 1 study; very low‐quality evidence), and scar dehiscence (RR 0.59, 95% CI 0.14 to 2.46; 390 women; 2 studies; very low‐quality evidence). Again, no clear differences were found for these outcomes between the women who received X‐ray pelvimetry and those who did not. Apgar score less than seven at five minutes was not reported in any study.
Authors' conclusions
X‐ray pelvimetry versus no pelvimetry or clinical pelvimetry is the only comparison included in this review due to the lack of trials identified that used other types or pelvimetry (other radiological examination or clinical pelvimetry versus no pelvimetry). There is not enough evidence to support the use of X‐ray pelvimetry for deciding on mode of delivery in women whose fetuses have a cephalic presentation. Women who undergo an X‐ray pelvimetry may be more likely to have a caesarean section.
Further research should be directed towards defining whether there are specific clinical situations in which pelvimetry can be shown to be of value. Newer methods of pelvimetry (CT, MRI) should be subjected to randomised trials to assess their value. Further trials of X‐ray pelvimetry in cephalic presentations would be of value if large enough to assess the effect on perinatal mortality.
PICO
Plain language summary
Pelvimetry for fetal cephalic presentations at or near term for deciding on mode of delivery
What is the issue?
Does the use of pelvimetry to assess the size of the woman's pelvis improve outcomes for baby and mother? Pelvimetry might identify babies whose heads are too big for their mother's pelvis. In this case, an elective caesarean section might improve the outcome. Forms of pelvimetry include radiological pelvimetry (X‐ray, computerised tomography (CT) scan or magnetic resonance imaging (MRI)) and clinical examination of the woman. We planned to include all studies comparing the use of clinical or radiological (X‐ray, CT or MRI) pelvimetry versus no pelvimetry, or different types of pelvimetry.
Why is this important?
Sometimes, normal labour does not progress because the baby's head is too big, or the pelvis of the mother is too small, for the baby to pass through. This is called "cephalo‐pelvic disproportion" or "obstructed labour" which may lead to an emergency caesarean section with possible risks for both mother and baby. A pregnant mother or her caregiver might be worried that disproportion could occur and for this reason, pelvimetry can be performed either before or during labour. It can be undertaken by clinical examination, X‐ray, CT‐scan or MRI. Pelvimetry measures the diameters of the pelvis and the baby's head. However, doing a pelvimetry also has implications: clinical examination might be very uncomfortable for the mother, X‐ray and CT‐scanning might be harmful for the baby and MRI is very expensive. All of these techniques have to be performed meticulously by experienced and skilled people to have any real value.
If we could diagnose the disproportion accurately before birth using pelvimetry, we might reduce the need for an emergency caesarean section and plan an elective procedure, with better outcomes for the baby and less complications for the mother.
What evidence did we find?
We searched for evidence on 30th November 2016 and identified five trials with a total of 1159 pregnant women. All five trials used X‐ray pelvimetry in comparison to no X‐ray pelvimetry.
The women who received X‐ray pelvimetry were more likely to have a caesarean section (low‐quality evidence). Whether a woman had pelvimetry or not, we found no difference in the numbers of babies that died (very low‐quality evidence), who did not have enough oxygen during labour, or were admitted to special care baby units (very low‐quality evidence). For the women, no differences were found between numbers of women with wound sepsis, those who received a blood transfusion, or those whose caesarean section scar began to break down (all very low‐quality evidence). Apgar score less than seven at five minutes was not reported in any study.
What does this mean?
There is too little evidence (the majority of which is low quality) to show whether measuring the size of the woman's pelvis (pelvimetry) is beneficial and safe when the baby is in a head‐down position. The number of women having a caesarean section increased if women had X‐ray pelvimetry but there was insufficient good‐quality evidence to show if pelvimetry improves outcomes for the baby. More research is needed.
Authors' conclusions
Summary of findings
| X‐ray pelvimetry compared to no X‐ray pelvimetry in fetal cephalic presentations at or near term | ||||||
| Patient or population: pregnant women at or near term with fetal cephalic presentations | ||||||
| Outcomes | Anticipated absolute effects* (95% CI) | Relative effect | № of participants | Quality of the evidence | Comments | |
|---|---|---|---|---|---|---|
| Risk with no pelvimetry in cephalic presentations | Risk with X‐ray pelvimetry | |||||
| Caesarean section | Study population | RR 1.34 | 1159 | ⊕⊕⊝⊝ | One study Crichton 1962 reported caesarean section and symphysiotomy together | |
| 388 per 1000 | 520 per 1000 | |||||
| Perinatal mortality | Study population | RR 0.53 | 1159 | ⊕⊝⊝⊝ | ||
| 17 per 1000 | 9 per 1000 | |||||
| Wound sepsis | Study population | RR 0.83 | 288 | ⊕⊝⊝⊝ | ||
| 42 per 1000 | 35 per 1000 | |||||
| Blood transfusion | Study population | RR 1.00 | 288 | ⊕⊝⊝⊝ | ||
| 56 per 1000 | 56 per 1000 | |||||
| Scar dehiscence | Study population | RR 0.59 | 390 | ⊕⊝⊝⊝ | ||
| 26 per 1000 | 15 per 1000 | |||||
| Admission to special care baby units | Study population | RR 0.20 | 288 | ⊕⊝⊝⊝ | ||
| 14 per 1000 | 3 per 1000 | |||||
| Apgar score < 7 at 5 minutes | Study population | ‐ | (0 studies) | ‐ | No data reported for this outcome | |
| see comment | see comment | |||||
| *The risk in the intervention group (and its 95% confidence interval) is based on the assumed risk in the comparison group and the relative effect of the intervention (and its 95% CI). | ||||||
| GRADE Working Group grades of evidence | ||||||
| 1 Most studies contributing data had design limitations. Two studies had serious design limitations (high risk of bias for sequence generation and allocation concealment) one of which contributed 37.4% of weight (‐2). 2 Most studies contributing data had design limitations. (‐1) 3 Wide confidence interval crossing the line of no effect, small sample size, few events and lack of precision. (‐2) 4 One study contributing data with serious design limitations. (‐2) 5 Very wide confidence intervals crossing the line of no effect, small sample size and few events. (‐2) 6 Study contributing 79.7% total weight has serious design limitations. (‐2) | ||||||
Background
Description of the condition
Cephalo‐pelvic disproportion (CPD) is one of the leading indications for an emergency caesarean section. CPD occurs when there is a mismatch between the fetal head and the maternal pelvis (when the fetal head is too big for the pelvis), resulting in obstructed labour.
Emergency caesarean sections have been shown to have an increased risk of maternal and neonatal morbidity and mortality (van Ham 1997). Women undergoing an emergency caesarean section are at an increased risk for intra‐ and postoperative complications such as haemorrhage (tearing of the uterine incision into the parametrium or cervix, hysterotomy extension), infection (wound sepsis, endometritis), deep vein thrombosis and prolonged hospitalisation. Risks for the neonate include respiratory problems and trauma.
Women with a previous caesarean scar are known to be at risk for uterine rupture, stillbirth and placenta praevia in subsequent pregnancies. Performing a repeat caesarean section also increases the risk of bowel or bladder injury and haemorrhage and women who have had a previous caesarean section can be offered a trial of labour (vaginal birth after caesarean section (VBAC)) to reduce the intra‐ and postoperative complications of a caesarean section. However, the low but life‐threatening risk (for both mother and fetus) of a uterine rupture during labour has to be taken into consideration and explained to the woman (Dodd 2013).
Description of the intervention
Assessment of the size of a woman's pelvis (pelvimetry) can be achieved by clinical examination (where the bony pelvis is digitally examined to identify prominent structures that may cause obstructed labour), or by conventional X‐rays (usually a lateral and anterior‐posterior view used to physically measure the sizes of the pelvic inlet, midpelvis and pelvic outlet, Morgan 1992), computerised tomography (CT) scanning (measuring the pelvis in the lateral, anterior‐posterior and axial views, Morris 1993), or magnetic resonance imaging (MRI, measuring of a midline sagittal, and oblique coronal views of the pelvis, Sporri 2002).
How the intervention might work
The aim of pelvimetry (whichever method is used) in women whose fetuses have a cephalic presentation, is to detect the presence of cephalo‐pelvic disproportion and therefore the need for caesarean section. Pelvimetry may influence clinical care since clinicians who feel that vaginal birth would be impossible, would offer the woman an elective caesarean section, thereby reducing the need of an emergency caesarean section. The criteria for determining an adequate or small pelvis have been from descriptive studies and senior opinions (Mengert 1948).
Why it is important to do this review
These techniques are not without risks, the greatest of all being a false positive result and unnecessary caesarean section. Clinical pelvimetry is very uncomfortable for the woman, X‐rays and CT scanning expose the fetus to radiation (the latter slightly less so), and MRI is very expensive. All of these techniques have to be performed meticulously by experienced and skilled people in order to have any value at all.
Objectives
To assess the effects of pelvimetry (performed antenatally, or intrapartum) on the method of birth, on perinatal mortality and morbidity, and on maternal morbidity. This review concentrates exclusively on women whose fetuses have a cephalic presentation.
Methods
Criteria for considering studies for this review
Types of studies
We included all randomised controlled trials (including quasi‐randomised) comparing pelvimetry in cephalic presentations versus no pelvimetry or comparing different types of pelvimetry. We would have included cluster trials if they had been identified during the search. Cross‐over studies were not eligible for this review.
If an abstract was of interest, we would have contacted the authors for further information about their trial.
Types of participants
Pregnant women with a singleton, cephalic presentation fetus who have or have not had a previous caesarean section. Studies that recruited women before, or during labour were included as well as women for spontaneous labour, induction of labour, or trial of scar after previous caesarean section (otherwise known as vaginal birth after caesarean or VBAC).
Types of interventions
The main intervention of interest is pelvimetry as a predictor of cephalo‐pelvic disproportion. Control groups could include women who did not have pelvimetry or who had different types of pelvimetry.
We planned to include studies comparing different methods of clinical or radiological pelvimetry such as X‐rays, computerised tomography (CT) scanning or magnetic resonance imaging (MRI). We reported women who have had one previous caesarean section and women who have had no previous section, or are nulliparous, in separate clinical subgroups.
Types of outcome measures
Primary outcomes
-
Caesarean section
-
Perinatal mortality
Secondary outcomes
Maternal outcomes
-
Puerperal pyrexia
-
Wound sepsis
-
Blood transfusion
-
Scar dehiscence
Perinatal outcomes
-
Perinatal asphyxia
-
Admission to special care baby units
-
Apgar score less than seven at five minutes
Search methods for identification of studies
The following methods section of this review is based on a standard template used by Cochrane Pregnancy and Childbirth.
Electronic searches
We searched Cochrane Pregnancy and Childbirth’s Trials Register by contacting their Information Specialist (31 January 2017).
The Register is a database containing over 22,000 reports of controlled trials in the field of pregnancy and childbirth. For full search methods used to populate Pregnancy and Childbirth’s Trials Register including the detailed search strategies for CENTRAL, MEDLINE, Embase and CINAHL; the list of handsearched journals and conference proceedings, and the list of journals reviewed via the current awareness service, please follow this link to the editorial information about the Cochrane Pregnancy and Childbirth in the Cochrane Library and select the ‘ Specialized Register ’ section from the options on the left side of the screen.
Briefly, Cochrane Pregnancy and Childbirth’s Trials Register is maintained by their Information Specialist and contains trials identified from:
-
monthly searches of the Cochrane Central Register of Controlled Trials (CENTRAL);
-
weekly searches of MEDLINE (Ovid);
-
weekly searches of Embase (Ovid);
-
monthly searches of CINAHL (EBSCO);
-
handsearches of 30 journals and the proceedings of major conferences;
-
weekly current awareness alerts for a further 44 journals plus monthly BioMed Central email alerts.
Search results are screened by two people and the full text of all relevant trial reports identified through the searching activities described above is reviewed. Based on the intervention described, each trial report is assigned a number that corresponds to a specific Pregnancy and Childbirth review topic (or topics), and is then added to the Register. The Information Specialist searches the Register for each review using this topic number rather than keywords. This results in a more specific search set which has been fully accounted for in the relevant review sections (Included studies; Excluded studies).
Searching other resources
We searched the reference lists of retrieved studies.
We did not apply any language or date restrictions.
Data collection and analysis
For methods used in the previous version of this review, seePattinson 1997.
For this update, the following methods were used for assessing the two reports that were identified as a result of the updated search.
The following methods section of this review is based on a standard template used by Cochrane Pregnancy and Childbirth Group.
Selection of studies
Two review authors independently assessed for inclusion all the potential studies identified as a result of the search strategy. We resolved any disagreement through discussion or, if required, we consulted the third review author.
Data extraction and management
We designed a form to extract data. For eligible studies, two review authors extracted the data using the agreed form. We resolved discrepancies through discussion or, if required, we consulted the third review author. Data were entered into Review Manager software (RevMan 2014) and checked for accuracy.
When information regarding any of the above was unclear, we planned to contact authors of the original reports to provide further details.
Assessment of risk of bias in included studies
Two review authors independently assessed risk of bias for each study using the criteria outlined in the Cochrane Handbook for Systematic Reviews of Interventions (Higgins 2011). Any disagreement was resolved by discussion or by involving a third assessor.
(1) Random sequence generation (checking for possible selection bias)
We described for each included study the method used to generate the allocation sequence in sufficient detail to allow an assessment of whether it should produce comparable groups.
We assessed the method as:
-
low risk of bias (any truly random process, e.g. random number table; computer random number generator);
-
high risk of bias (any non‐random process, e.g. odd or even date of birth; hospital or clinic record number);
-
unclear risk of bias.
(2) Allocation concealment (checking for possible selection bias)
We described for each included study the method used to conceal allocation to interventions prior to assignment and assessed whether intervention allocation could have been foreseen in advance of, or during recruitment, or changed after assignment.
We assessed the methods as:
-
low risk of bias (e.g. telephone or central randomisation; consecutively numbered sealed opaque envelopes);
-
high risk of bias (open random allocation; unsealed or non‐opaque envelopes, alternation; date of birth);
-
unclear risk of bias.
(3.1) Blinding of participants and personnel (checking for possible performance bias)
We described for each included study the methods used, if any, to blind study participants and personnel from knowledge of which intervention a participant received. We considered that studies were at low risk of bias if they were blinded, or if we judged that the lack of blinding unlikely to affect results. We assessed blinding separately for different outcomes or classes of outcomes.
We assessed the methods as:
-
low, high or unclear risk of bias for participants;
-
low, high or unclear risk of bias for personnel.
(3.2) Blinding of outcome assessment (checking for possible detection bias)
We described for each included study the methods used, if any, to blind outcome assessors from knowledge of which intervention a participant received. We assessed blinding separately for different outcomes or classes of outcomes.
We assessed methods used to blind outcome assessment as:
-
low, high or unclear risk of bias.
(4) Incomplete outcome data (checking for possible attrition bias due to the amount, nature and handling of incomplete outcome data)
We described for each included study, and for each outcome or class of outcomes, the completeness of data including attrition and exclusions from the analysis. We stated whether attrition and exclusions were reported and the numbers included in the analysis at each stage (compared with the total randomised participants), reasons for attrition or exclusion where reported, and whether missing data were balanced across groups or were related to outcomes. Where sufficient information was reported, or could be supplied by the trial authors, we planned to re‐include missing data in the analyses which we undertook.
We assessed methods as:
-
low risk of bias (e.g. no missing outcome data; missing outcome data balanced across groups);
-
high risk of bias (e.g. numbers or reasons for missing data imbalanced across groups; ‘as treated’ analysis done with substantial departure of intervention received from that assigned at randomisation);
-
unclear risk of bias.
(5) Selective reporting (checking for reporting bias)
We described for each included study how we investigated the possibility of selective outcome reporting bias and what we found.
We assessed the methods as:
-
low risk of bias (where it is clear that all of the study’s pre‐specified outcomes and all expected outcomes of interest to the review have been reported);
-
high risk of bias (where not all the study’s pre‐specified outcomes have been reported; one or more reported primary outcomes were not pre‐specified; outcomes of interest are reported incompletely and so cannot be used; study fails to include results of a key outcome that would have been expected to have been reported);
-
unclear risk of bias.
(6) Other bias (checking for bias due to problems not covered by (1) to (5) above)
We described for each included study any important concerns we had about other possible sources of bias.
(7) Overall risk of bias
We made explicit judgements about whether studies were at high risk of bias, according to the criteria given in the Handbook (Higgins 2011). With reference to (1) to (6) above, we planned to assess the likely magnitude and direction of the bias and whether we considered it is likely to impact on the findings. In future updates, we will explore the impact of the level of bias through undertaking sensitivity analyses ‐ seeSensitivity analysis.
Assessment of the quality of the evidence using the GRADE approach
For this update the quality of the evidence was assessed using the GRADE approach as outlined in the GRADE handbook in order to assess the quality of the body of evidence relating to the following outcomes for the main comparison ‐ X‐ray pelvimetry versus no pelvimetry or clinical pelvimetry in cephalic presentations.
-
Caesarean section
-
Perinatal mortality
-
Wound sepsis
-
Blood transfusion
-
Scar dehiscence
-
Admission to special care baby units
-
Apgar score less than seven at five minutes
We used the GRADEpro Guideline Development Tool to import data from Review Manager 5.3 (RevMan 2014) in order to create a 'Summary of findings’ table. A summary of the intervention effect and a measure of quality for each of the above outcomes was produced using the GRADE approach. The GRADE approach uses five considerations (study limitations, consistency of effect, imprecision, indirectness and publication bias) to assess the quality of the body of evidence for each outcome. The evidence can be downgraded from 'high quality' by one level for serious (or by two levels for very serious) limitations, depending on assessments for risk of bias, indirectness of evidence, serious inconsistency, imprecision of effect estimates or potential publication bias.
Measures of treatment effect
Dichotomous data
For dichotomous data, we presented results as summary risk ratio with 95% confidence intervals.
Continuous data
We did not include any continuous outcomes, however, if we do include them in future updates, we will use the mean difference if outcomes are measured in the same way between trials. We will use the standardised mean difference to combine trials that measure the same outcome, but use different methods.
Unit of analysis issues
Cluster‐randomised trials
We did not identify any cluster‐randomised trials to include in the analyses. However, in future updates of the review, if we identify suitable cluster‐randomised trials, we will adjust their sample sizes or standard errors using the methods described in the Handbook Section 16.3.4 or 16.3.6 using an estimate of the intracluster correlation co‐efficient (ICC) derived from the trial (if possible), from a similar trial or from a study of a similar population. If we use ICCs from other sources, we will report this and conduct sensitivity analyses to investigate the effect of variation in the ICC. If we identify both cluster‐randomised trials and individually‐randomised trials, we plan to synthesise the relevant information. We will consider it reasonable to combine the results from both if there is little heterogeneity between the study designs and the interaction between the effect of intervention and the choice of randomisation unit is considered to be unlikely.
We will also acknowledge heterogeneity in the randomisation unit and perform a sensitivity or subgroup analysis to investigate the effects of the randomisation unit.
Cross‐over trials
Cross‐over trials were not eligible for this review.
Other unit of analysis issues
Multiple pregnancies
Women with multiple pregnancies were not included in this review. If included in future updates, we will use cluster‐trial methods as described above to adjust the data. Babies from multiple pregnancies may be more likely to develop the same outcomes (non‐independence), so counting each as a separate data point may overestimate the sample size and make confidence intervals too narrow. We will regard each woman as a randomised cluster and use cluster‐trial methods to adjust outcomes for the baby.
Trials with more than two arms
If we had identified trials with more than two arms we would have pooled results using the methods set out in the Handbook (Higgins 2011) to avoid double‐counting.
Dealing with missing data
For included studies, levels of attrition were noted. In future updates, if more eligible studies are included, the impact of including studies with high levels of missing data in the overall assessment of treatment effect will be explored by using sensitivity analysis.
For all outcomes, analyses were carried out, as far as possible, on an intention‐to‐treat basis, i.e. we attempted to include all participants randomised to each group in the analyses. The denominator for each outcome in each trial was the number randomised minus any participants whose outcomes were known to be missing.
Assessment of heterogeneity
We assessed statistical heterogeneity in each meta‐analysis using the Tau², I² and Chi² statistics. We regarded heterogeneity as substantial if an I² was greater than 30% and either a Tau² was greater than zero, or there was a low P value (less than 0.10) in the Chi² test for heterogeneity. If we had identified substantial heterogeneity (above 30%), we would have explored it.
Assessment of reporting biases
In future updates, if there are 10 or more studies in the meta‐analysis, we will investigate reporting biases (such as publication bias) using funnel plots. We will assess funnel plot asymmetry visually. If asymmetry is suggested by a visual assessment, we will perform exploratory analyses to investigate it.
Data synthesis
We carried out statistical analysis using the Review Manager software (RevMan 2014). We used fixed‐effect meta‐analysis for combining data where it was reasonable to assume that studies were estimating the same underlying treatment effect: i.e. where trials were examining the same intervention, and the trials’ populations and methods were judged sufficiently similar.
In future updates, if there is clinical heterogeneity sufficient to expect that the underlying treatment effects differed between trials, or if substantial statistical heterogeneity is detected, we will use random‐effects meta‐analysis to produce an overall summary, if an average treatment effect across trials is considered clinically meaningful. The random‐effects summary will be treated as the average range of possible treatment effects and we will discuss the clinical implications of treatment effects differing between trials. If the average treatment effect is not clinically meaningful, we will not combine trials. If we use random‐effects analyses, the results will be presented as the average treatment effect with 95% confidence intervals, and the estimates of Tau² and I².
Subgroup analysis and investigation of heterogeneity
We did not use subgroup analyses to investigate substantial heterogeneity. We carried out a clinical subgroup analyses on an issue of particular interest: women with no previous caesarean section versus women with previous caesarean section. This analysis was carried out for each review outcome. We assessed subgroup differences by interaction tests available within RevMan (RevMan 2014). We reported the results of subgroup analyses quoting the Chi² statistic and P value, and the interaction test I² value.
Sensitivity analysis
We carried out sensitivity analyses to explore the effect of trial quality assessed by concealment of allocation with studies at high risk of allocation bias being excluded from the analyses in order to assess whether this makes any difference to the overall result. In future updates, if any trial is judged to be of poor quality due to being at high risk of bias for allocation concealment, high attrition rates, or both, we will also exclude these from the analysis.
Results
Description of studies
Please see Characteristics of included studies and Characteristics of excluded studies for further details.
Results of the search
For this update, we assessed two reports of one trial ( Gaitan 2009) from a search of Cochrane Pregnancy and Childbirth's Trials Register (January 2017). In total, five trials are now included (Crichton 1962; Gaitan 2009; Parsons 1985; Richards 1985; Thubisi 1993) and one is excluded (Farrell 2002). See: Figure 1.
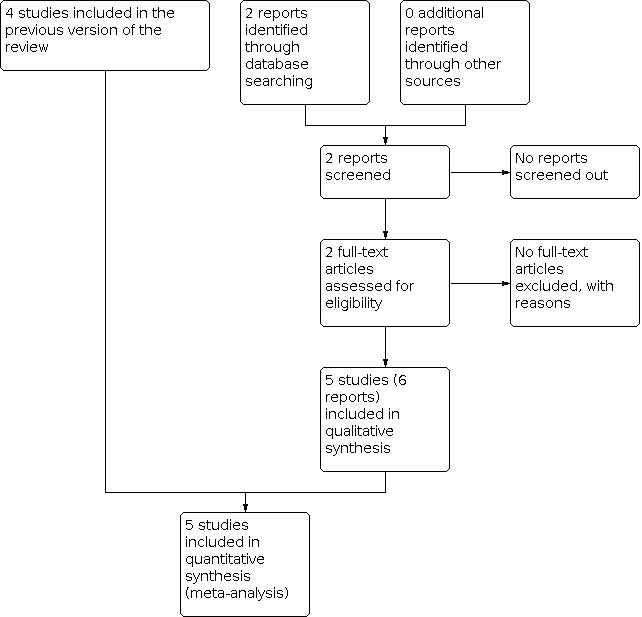
Study flow diagram.
Included studies
Five trials with a total of 1159 women were included.
Study design
All included trials were two‐armed randomised controlled trials, using individual randomisation. Sample sizes were small and ranged from 102 (Richards 1985) to 305 women (Crichton 1962).
Setting
Trials were conducted in hospitals in South Africa (Crichton 1962; Richards 1985; Thubisi 1993), USA (Parsons 1985) and Spain (Gaitan 2009).
Participants
Gaitan 2009 and Parsons 1985 only included nulliparous women in their trials, Crichton 1962 did not specify the parity of the women included, and Richards 1985 and Thubisi 1993 only included women with one previous lower segment caesarean section.
Gaitan 2009 and Parsons 1985 only randomised women who were being induced or augmented with oxytocin. Crichton 1962 randomised women when they were in labour and their doctor requested a pelvimetry. Both Richards 1985 and Thubisi 1993 performed pelvimetry at 36 weeks' gestation so women were randomised during pregnancy.
Interventions and comparisons
All of the trials included in the review examined X‐ray pelvimetry. We did not identify any trials comparing clinical pelvimetry with no pelvimetry, or examining other types of radiological pelvimetry.
Crichton 1962 included 305 women in labour whose attending doctors requested pelvimetry. Women were randomised to receive X‐ray pelvimetry or no pelvimetry during labour. No fetal heart rate monitoring was performed.
Parsons 1985 recruited 200 primigravid women who required induction of labour or augmentation of labour with oxytocin. All women received a clinical pelvimetry. Women were subsequently randomised by hospital number to either receive or not receive an X‐ray pelvimetry. Continuous fetal heart rate monitoring was done.
Richards 1985 included 102 women with one previous caesarean section (classical uterine incision being excluded). Women were randomised into two groups: the first group received an X‐ray pelvimetry at 36 weeks' gestation. If the pelvic inlet was less than 10.5 cm in the antero‐posterior diameter or less than 11.5 cm in the transverse diameter, an elective caesarean section was performed. The other women and the control group underwent a trial of scar, and had X‐ray pelvimetry postpartum as a comparison.
Thubisi 1993 randomised 288 women with one previous transverse lower segment caesarean section. The intervention group received an X‐ray pelvimetry at 36 weeks' gestation. A sagittal inlet of less than 11 cm, sagittal outlet of less than 10 cm, transverse inlet less than 11.5 cm, and transverse outlet (bispinous) less than 9 cm was an indication for caesarean section. The other women in the intervention group and the control group awaited a trial of scar.
Gaitan 2009 included 264 women. Women were randomised into two groups to either receive or not receive an X‐ray pelvimetry.
Outcomes
Crichton 1962: outcomes were caesarean section/symphysiotomy, perinatal mortality, asphyxia and maternal survival.
Parsons 1985: outcomes assessed were length of labour, length of rupture of membranes, length of oxytocin administration, type of birth, Apgar scores and birthweight.
Richards 1985: outcomes measured were mode of birth, pelvimetry measurements, birthweight and average stay in hospital.
Thubisi 1993: outcomes measured were caesarean section, perinatal mortality, birthweight, scar dehiscence, puerperal pyrexia, wound sepsis and blood transfusion.
Gaitan 2009: outcomes measured were time from induction to birth of baby, method of birth, use of instruments during birth, any adverse effects and perinatal mortality.
Funding
Funding sources were not disclosed by any of the trialists.
Excluded studies
One trial was excluded: Farrell 2002; there were too few women recruited, study protocol was not adhered to, and the trial was stopped prior to completion due to inadequate randomisation.
Risk of bias in included studies
Please see Figure 2 and Figure 3 for a summary of 'Risk of bias' assessments.

'Risk of bias' summary: review authors' judgements about each risk of bias item for each included study.

'Risk of bias' graph: review authors' judgements about each risk of bias item presented as percentages across all included studies.
Allocation
In all studies selection bias cannot be excluded, although Richards 1985 and Thubisi 1993 randomised a more homogeneous group of women as they were not in labour at the time of randomisation.
Both Crichton 1962 and Richards 1985 risk of selection bias was assessed as being 'unclear' due to not enough information being provided in the papers. Parsons 1985 and Thubisi 1993 were assessed as high risk as Parsons 1985 allocated women by hospital number, and Thubisi 1993 'randomly' assigned women at the first antenatal visit to one of two consultant teams, allocated by admitting clerks who had no medical training and knowledge of how they would be managed. Gaitan 2009 used a random number table to allocate women into groups but allocation concealment is not mentioned adequately.
Crichton 1962 relied on the attending clinician to request a pelvimetry and Parsons 1985 included a group of women requiring augmentation of labour, indicating that labour was already not progressing as expected.
Blinding
None of the trials blinded participants, care givers or outcome assessors. For this type of outcome, blinded would be very difficult.
Incomplete outcome data
Thubisi 1993 randomised 306 women but only followed up 288. This loss to follow‐up is relatively low but loss of two women in the pelvimetry group related to outcomes of the study (women opted for caesarean section). For this reason, Thubisi 1993 was assessed as being at unclear risk of attrition bias. Richards 1985 was also assessed as unclear due to missing totals in the results tables of the study.
All remaining trials were assessed to be at low risk of attrition bias as data were reported for all women who were randomised.
Selective reporting
Protocols were not available for any of the included studies. Crichton 1962, Parsons 1985, Richards 1985 and Thubisi 1993 did not pre‐specify outcomes in the methods text. Gaitan 2009 does not report all outcomes, however in is unclear if this is due to translation issues. All trials were assessed to be at unclear risk of reporting bias.
Other potential sources of bias
All the trials were assessed to be at unclear risk of other bias except for Parsons 1985 and Thubisi 1993 who were assessed to be at low risk of bias as the baseline characteristics of both groups were similar and there was no other evidence of bias. Crichton 1962 and Richards 1985 did not report any baseline characteristics, and Gaitan 2009 had some unclear discrepancy between totals in tables and in text though it was unclear if this were due to translation issues.
Effects of interventions
X‐ray pelvimetry versus no X‐ray pelvimetry
Primary outcomes
Caesarean section
All five trials assessed the rate of caesarean section as an outcome, including a total of 1159 women. Crichton 1962 reported caesarean section and symphysiotomy results combined, therefore data for both caesarean section and symphysiotomy are included in this analysis. No other study reported symphysiotomy.
Women who had X‐ray pelvimetry had a higher rate of caesarean section than those women who had no X‐ray pelvimetry. The risk ratio (RR) for caesarean section is 1.34 (95% confidence interval (CI) 1.19 to 1.52; 1159 women; 5 trials; low‐quality evidence) Analysis 1.1 when compared to women who did not get an X‐ray pelvimetry. Quality of evidence as assessed using GRADE is low.
Subgroup interaction tests suggest no clear differences in effects for women with previous versus women with no previous caesarean section (Test for subgroup differences: Chi² = 1.52, df = 1 (P = 0.22), I² = 34.1%). The two trials that only included women with a previous section (Richards 1985; Thubisi 1993), performed elective caesarean sections on the women whose pelvic inlets did not satisfy pre‐specified requirements following antenatal X‐ray pelvimetry; all those who did satisfy requirements were left to go into spontaneous labour. A higher caesarean rate might therefore be expected. In future updates of this review it will be useful to analyse data for rates of elective and emergency caesarean sections separately.
Perinatal mortality
All five trials assessed the perinatal mortality as an outcome, including a total of 1159 women. There is no clear difference in perinatal mortality between women who did and women who did not receive an X‐ray pelvimetry (RR 0.53, 95% CI 0.19 to 1.45; 1159 infants; 5 trials; verylow‐quality evidence) Analysis 1.2. Quality of evidence as assessed using GRADE is very low.
Secondary outcomes
Puerperal pyrexia
One trial including 288 women who all had a previous caesarean (Thubisi 1993) assessed the incidence of puerperal pyrexia as an outcome after caesarean in both groups (women who did receive an X‐ray pelvimetry compared to women who did not). Little difference was found: RR 0.80 (95% CI 0.22 to 2.92; 288 women; 1 trial) Analysis 1.3.
Wound sepsis
One trial including 288 women (Thubisi 1993) assessed the incidence of wound sepsis as an outcome after caesarean in both groups (women who did receive an X‐ray pelvimetry compared to women who did not). Little difference was found: RR 0.83 (95% CI 0.26 to 2.67; 288 women; 1 trial; verylow‐quality evidence) Analysis 1.4. Quality of evidence as assessed using GRADE is very low.
Blood transfusion
One trial including 288 women (Thubisi 1993) assessed the need for blood transfusion as an outcome in both groups (women who did receive an X‐ray pelvimetry compared to women who did not). No difference was found: RR 1.00 (95% CI 0.39 to 2.59; 288 women; 1 trial; very low‐quality evidence) Analysis 1.5. Quality of evidence as assessed using GRADE is very low.
Scar dehiscence
Two trials including 390 women (Richards 1985; Thubisi 1993) assessed the incidence of scar dehiscence as an outcome in women who had one previous transverse uterine segment caesarean section and underwent trial of scar. Little difference was found: RR 0.59 (95% CI 0.14 to 2.46; 390 women; 2 trials; very low‐quality evidence) Analysis 1.6. Quality of evidence as assessed using GRADE is very low.
Perinatal asphyxia
One trial including 305 infants (Crichton 1962) assessed incidence of perinatal asphyxia. Little difference was found: RR 0.66 (95% CI 0.39 to 1.10; 305 infants; 1 trial) Analysis 1.7.
Admission to special care baby unit
One trial including 288 infants (Thubisi 1993) assessed the need for admission to a special care baby unit. Little difference was found: RR 0.20 (95% CI 0.01 to 4.13; 288 infants; 1 trial; very low‐quality evidence) Analysis 1.8. Quality of evidence as assessed using GRADE is very low.
Apgar score less than seven at five minutes
No trials assessed the Apgar score less than seven at five minutes as an outcome.
Women without previous caesarean section
Three trials included women with no previous caesarean section (Crichton 1962; Gaitan 2009; Parsons 1985) with a total number of 769 women. There is a higher caesarean section rate (and symphysiotomy rate in Crichton 1962) in the X‐ray pelvimetry group (RR 1.24, 95% CI 1.02 to 1.52; 769 women; 3 trials). There is no difference in perinatal mortality (RR 0.64, 95% CI 0.21 to 1.90; 769 women; 3 trials). There was a slight decrease in perinatal asphyxia and perinatal mortality in Crichton 1962, but this decrease in perinatal mortality was not observed in Parsons 1985 or Gaitan 2009. Neither trial reported perinatal asphyxia. The decrease seen in Crichton 1962 could be due to chance or lack in fetal monitoring. None of these trials reported puerperal pyrexia, wound sepsis, blood transfusion, or admission to special care baby unit. Scar dehiscence was not relevant to these women.
Women with previous caesarean section
Two trials included women who had a previous transverse lower segment caesarean section (Richards 1985; Thubisi 1993), with a total number of 390 women. There was an overall increase in the caesarean section rate in both studies in the X‐ray pelvimetry groups (RR 1.45, 95% CI 1.26 to 1.67; 390 women; 2 trials). There was a slight decrease in perinatal mortality, which could have occurred by chance, in Richards 1985, but this was not observed in Thubisi 1993 where there were no perinatal deaths in either group (RR 0.19, 95% CI 0.01 to 3.91; 390 women; 2 trials). There were similar rates of scar dehiscence in the intervention and control groups (RR 0.59, 95% CI 0.14 to 2.46; 390 women; 2 trials). Thubisi 1993 reported a slight increase in admissions to special care baby units in the control group, but again these could have occurred by chance. Richards 1985 did not report this outcome. Only Thubisi 1993 reported puerperal pyrexia, wound sepsis and blood transfusion and did not find any difference between the groups.
Sensitivity analysis
We carried out sensitivity analysis for lack of allocation concealment. Parsons 1985 and Thubisi 1993 were assessed to be at high risk of selection bias and were removed from Analysis 1.1: Caesarean section/symphysiotomy and Analysis 1.2: Perinatal mortality. There were not sufficient data to remove these trials from the other outcomes and maintain a meaningful analysis.
For the outcome caesarean section/symphysiotomy, removing the trial data widened the CIs and lessened the effect slightly (RR 1.25, 95% CI 1.04 to 1.49), but the data still showed that women who had pelvimetry were more likely to have a caesarean section. Regarding the women without a previous caesarean section, removing Parsons 1985 meant that the CIs crossed the line of no effect (RR 1.19, 95% CI 0.96 to 1.47).
There were no perinatal deaths in either Parsons 1985 or Thubisi 1993, so removing the data from the meta‐analysis made no difference to the overall relative risk.
X‐ray pelvimetry versus no pelvimetry or clinical pelvimetry is the only comparison included in this review due to the lack of trials identified that used other types of pelvimetry (other radiological examination).
Discussion
Summary of main results
Five trials with a total of 1159 women were included. All used X‐ray pelvimetry to assess the pelvis. X‐ray pelvimetry versus no pelvimetry or clinical pelvimetry is the only comparison included in this review due to the lack of trials identified that used other types or pelvimetry.
Women who received an X‐ray pelvimetry, had a higher risk having a caesarean section, without a decrease in perinatal mortality. The control groups tended to a slightly raised perinatal mortality, but this could be due to chance. The numbers studied were insufficient to assess perinatal mortality adequately. No clear differences were found between groups for puerperal pyrexia, wound sepsis, blood transfusion, scar dehiscence, perinatal asphyxia or admission to special care baby unit. No trial reported Apgar score less than seven at five minutes.
Parsons 1985 explains the increased perinatal mortality and asphyxia in Crichton 1962 by the lack of electronic fetal monitoring available to the women in Crichton's trial. The two deaths in the study of Richards 1985 occurred in utero before the onset of labour.
Some of the outcomes in this review, relating to women with a previous caesarean, are difficult to interpret because they are mediated by another outcome, for example, wound sepsis and blood transfusion are only relevant to those women who have a caesarean section.
Overall completeness and applicability of evidence
The trials are compatible with respect to the common measures of outcome. The small number of trials included in this review address the research question and do not support the use of X‐ray pelvimetry, though they are of low quality, and there are no trials to assess the use of computed tomography (CT) or magnetic resonance imaging (MRI) pelvimetry. The paucity of trials assessing the effectiveness of all methods of pelvimetry, for both women with and without a previous caesarean, limits the applicability of this review. The majority of the few trials available are over 20 years old. This perhaps reflects how little pelvimetry is used by clinicians in current practice.
The trials were also conducted in a small number of countries (South Africa, Spain, and the USA) and therefore the findings may not be applicable to low‐income settings.
Quality of the evidence
All trial designs regarding treatment allocation were of poor quality, assessed as high or unclear risk of bias. None of the trials blinded participants, staff or outcome assessors. The trials were not well‐reported so it was difficult to assess the other 'Risk of bias' domains. The two trials in women with previous caesarean sections were performed at the same institution a few years apart. We have found that overall, the findings are at a moderate to high risk of bias. Please see Figure 2 for a summary of the risk of bias.
We used GRADEpro software to grade evidence for our selected outcomes; for caesarean section we rated the evidence low quality and all the other outcomes, perinatal mortality, wound sepsis, blood transfusion, scar dehiscence and admission to special care baby unit as very low quality. Downgrading was due to risk of bias relating to lack of allocation concealment and blinding, and imprecision of effect estimates. Please see summary of findings Table 1.
Potential biases in the review process
We took steps to reduce bias as we are aware of the potential to introduce bias throughout the process of writing the review. Two review authors assessed each study for possible inclusion, assessed the quality of the trials and extracted data independently. We recognise that assessing the quality of the trials can be subjective and that different people assessing risk of bias may have come up with different judgements.
Agreements and disagreements with other studies or reviews
The results of this review agree with another non‐Cochrane systematic review that looked at clinical interventions, including X‐ray pelvimetry, which increased vaginal birth after caesarean section (VBAC) (Catling‐Paull 2011). Catling‐Paull 2011 found that X‐ray pelvimetry was a poor predictor of birth outcome, and that women who received pelvimetry were less likely to attempt a vaginal birth. Subsequently, the caesarean section rate was higher in the groups where women had pelvimetry.

Study flow diagram.

'Risk of bias' summary: review authors' judgements about each risk of bias item for each included study.

'Risk of bias' graph: review authors' judgements about each risk of bias item presented as percentages across all included studies.

Comparison 1: X‐ray pelvimetry versus no X‐ray pelvimetry, Outcome 1: Caesarean section

Comparison 1: X‐ray pelvimetry versus no X‐ray pelvimetry, Outcome 2: Perinatal mortality

Comparison 1: X‐ray pelvimetry versus no X‐ray pelvimetry, Outcome 3: Puerperal pyrexia

Comparison 1: X‐ray pelvimetry versus no X‐ray pelvimetry, Outcome 4: Wound sepsis

Comparison 1: X‐ray pelvimetry versus no X‐ray pelvimetry, Outcome 5: Blood transfusion

Comparison 1: X‐ray pelvimetry versus no X‐ray pelvimetry, Outcome 6: Scar dehiscence

Comparison 1: X‐ray pelvimetry versus no X‐ray pelvimetry, Outcome 7: Perinatal asphyxia

Comparison 1: X‐ray pelvimetry versus no X‐ray pelvimetry, Outcome 8: Admission to special care baby units
| X‐ray pelvimetry compared to no X‐ray pelvimetry in fetal cephalic presentations at or near term | ||||||
| Patient or population: pregnant women at or near term with fetal cephalic presentations | ||||||
| Outcomes | Anticipated absolute effects* (95% CI) | Relative effect | № of participants | Quality of the evidence | Comments | |
|---|---|---|---|---|---|---|
| Risk with no pelvimetry in cephalic presentations | Risk with X‐ray pelvimetry | |||||
| Caesarean section | Study population | RR 1.34 | 1159 | ⊕⊕⊝⊝ | One study Crichton 1962 reported caesarean section and symphysiotomy together | |
| 388 per 1000 | 520 per 1000 | |||||
| Perinatal mortality | Study population | RR 0.53 | 1159 | ⊕⊝⊝⊝ | ||
| 17 per 1000 | 9 per 1000 | |||||
| Wound sepsis | Study population | RR 0.83 | 288 | ⊕⊝⊝⊝ | ||
| 42 per 1000 | 35 per 1000 | |||||
| Blood transfusion | Study population | RR 1.00 | 288 | ⊕⊝⊝⊝ | ||
| 56 per 1000 | 56 per 1000 | |||||
| Scar dehiscence | Study population | RR 0.59 | 390 | ⊕⊝⊝⊝ | ||
| 26 per 1000 | 15 per 1000 | |||||
| Admission to special care baby units | Study population | RR 0.20 | 288 | ⊕⊝⊝⊝ | ||
| 14 per 1000 | 3 per 1000 | |||||
| Apgar score < 7 at 5 minutes | Study population | ‐ | (0 studies) | ‐ | No data reported for this outcome | |
| see comment | see comment | |||||
| *The risk in the intervention group (and its 95% confidence interval) is based on the assumed risk in the comparison group and the relative effect of the intervention (and its 95% CI). | ||||||
| GRADE Working Group grades of evidence | ||||||
| 1 Most studies contributing data had design limitations. Two studies had serious design limitations (high risk of bias for sequence generation and allocation concealment) one of which contributed 37.4% of weight (‐2). 2 Most studies contributing data had design limitations. (‐1) 3 Wide confidence interval crossing the line of no effect, small sample size, few events and lack of precision. (‐2) 4 One study contributing data with serious design limitations. (‐2) 5 Very wide confidence intervals crossing the line of no effect, small sample size and few events. (‐2) 6 Study contributing 79.7% total weight has serious design limitations. (‐2) | ||||||
| Outcome or subgroup title | No. of studies | No. of participants | Statistical method | Effect size |
| 1.1 Caesarean section Show forest plot | 5 | 1159 | Risk Ratio (M‐H, Fixed, 95% CI) | 1.34 [1.19, 1.52] |
| 1.1.1 No previous caesarean section | 3 | 769 | Risk Ratio (M‐H, Fixed, 95% CI) | 1.24 [1.02, 1.52] |
| 1.1.2 Previous caesarean section | 2 | 390 | Risk Ratio (M‐H, Fixed, 95% CI) | 1.45 [1.26, 1.67] |
| 1.2 Perinatal mortality Show forest plot | 5 | 1159 | Risk Ratio (M‐H, Fixed, 95% CI) | 0.53 [0.19, 1.45] |
| 1.2.1 No previous caesarean section | 3 | 769 | Risk Ratio (M‐H, Fixed, 95% CI) | 0.64 [0.21, 1.90] |
| 1.2.2 Previous caesarean section | 2 | 390 | Risk Ratio (M‐H, Fixed, 95% CI) | 0.19 [0.01, 3.91] |
| 1.3 Puerperal pyrexia Show forest plot | 1 | 288 | Risk Ratio (M‐H, Fixed, 95% CI) | 0.80 [0.22, 2.92] |
| 1.3.1 No previous caesarean section | 0 | 0 | Risk Ratio (M‐H, Fixed, 95% CI) | Not estimable |
| 1.3.2 Previous caesarean section | 1 | 288 | Risk Ratio (M‐H, Fixed, 95% CI) | 0.80 [0.22, 2.92] |
| 1.4 Wound sepsis Show forest plot | 1 | 288 | Risk Ratio (M‐H, Fixed, 95% CI) | 0.83 [0.26, 2.67] |
| 1.4.1 No previous caesarean section | 0 | 0 | Risk Ratio (M‐H, Fixed, 95% CI) | Not estimable |
| 1.4.2 Previous caesarean section | 1 | 288 | Risk Ratio (M‐H, Fixed, 95% CI) | 0.83 [0.26, 2.67] |
| 1.5 Blood transfusion Show forest plot | 1 | 288 | Risk Ratio (M‐H, Fixed, 95% CI) | 1.00 [0.39, 2.59] |
| 1.5.1 No previous caesarean section | 0 | 0 | Risk Ratio (M‐H, Fixed, 95% CI) | Not estimable |
| 1.5.2 Previous caesarean section | 1 | 288 | Risk Ratio (M‐H, Fixed, 95% CI) | 1.00 [0.39, 2.59] |
| 1.6 Scar dehiscence Show forest plot | 2 | 390 | Risk Ratio (M‐H, Fixed, 95% CI) | 0.59 [0.14, 2.46] |
| 1.7 Perinatal asphyxia Show forest plot | 1 | 305 | Risk Ratio (M‐H, Fixed, 95% CI) | 0.66 [0.39, 1.10] |
| 1.8 Admission to special care baby units Show forest plot | 1 | 288 | Risk Ratio (M‐H, Fixed, 95% CI) | 0.20 [0.01, 4.13] |
| 1.8.1 No previous caesarean section | 0 | 0 | Risk Ratio (M‐H, Fixed, 95% CI) | Not estimable |
| 1.8.2 Previous caesarean section | 1 | 288 | Risk Ratio (M‐H, Fixed, 95% CI) | 0.20 [0.01, 4.13] |