過多月経に対するホルモン配合避妊薬
Abstract
Background
Menorrhagia or heavy menstrual bleeding (HMB) is an excessive blood loss that impairs a woman's quality of life, either physical, emotional, social or material. It is benign and not associated with pregnancy or any other gynaecological or systemic disease. Medical treatments used to reduce excessive menstrual blood loss (MBL) include prostaglandin synthetase inhibitors, antifibrinolytics, oral contraceptive pills, and other hormones. The combined oral contraceptive pill (COCP) is claimed to have a variety of beneficial effects, inducing a regular shedding of a thinner endometrium and inhibiting ovulation, thus having the effect of both treating HMB and providing contraception. More recently, a contraceptive vaginal ring (CVR) has been trialled to investigate whether this treatment can provide similar benefits to COCP while lessening hormonal systemic exposure. This review is an update of a review which originally focused on COCP alone. The scope of the review has been widened to consider other types of delivery of combined hormonal contraceptives for reduction of MBL.
Objectives
To determine the efficacy of combined hormonal contraceptives (pills, vaginal ring or patch) compared with other medical therapies, placebo, or no therapy in the treatment of HMB. A secondary objective was to compare the COCP with the CVR.
Search methods
We searched the Gynecology and Fertility Group trials register, MEDLINE, Embase, CENTRAL, CINAHL and PsycINFO (search dates: Oct 1996, May 2002, June 2004, April 2006, June 2009, July 2017 and September 2018) for all randomised controlled trials (RCTs) of COCP and CVR for the treatment of HMB. We also searched trial registers and the reference lists of retrieved studies for additional trials.
Selection criteria
We included randomised controlled trials (RCTs) of the use of COCP or CVR compared with no treatment, placebo, or other medical therapies for women with HMB and regular menstrual cycles.
Data collection and analysis
All assessments of trial quality and data extraction were performed unblinded by at least two review authors. Our primary review outcomes were treatment success, menstrual bleeding (assessed objectively, semi‐objectively or subjectively), and participant satisfaction with treatment. Secondary outcomes were adverse events, quality of life, and haemoglobin level.
Main results
We identified eight RCTs involving 805 participants. Two trials comparing COCP with placebo were considered to be moderate quality and the remaining studies were low to very low quality, mainly because of serious risk of bias from lack of blinding and concerns over precision.
COCP versus placebo
COCP, with a step‐down oestrogen and step‐up progestogen regimen, improved response to treatment (return to menstrual 'normality') (OR 22.12, 95% CI 4.40 to 111.12; 2 trials; 363 participants; I2 = 50%; moderate‐quality evidence), and lowered MBL (OR 5.15, 95% CI 3.16 to 8.40; 2 trials; 339 participants; I2 = 0%; moderate‐quality evidence) when compared to placebo. The results suggested that, if the chance of 'successful' treatment was 3% in women taking placebo, then COCP increased this chance from 12% to 77% in women with unacceptable HMB. Minor adverse events, in particular breast pain, were more common with COCP. No study in this comparison reported semi‐objectively assessed MBL or participant satisfaction with treatment.
COCP versus other medical treatments
Non‐steroidal anti‐inflammatory drugs (NSAIDs)
There was insufficient evidence to determine whether the COCP reduced MBL when compared to NSAIDs (mefenamic acid and naproxen). No study in this comparison reported semi‐objectively assessed MBL, subjectively assessed MBL, participant satisfaction with treatment or adverse events.
Levonorgestrel‐releasing intrauterine system (LNG IUS)
The LNG IUS was more effective than COCP in reducing MBL (OR 0.21, 95% CI 0.09 to 0.48; 2 trials; 151 participants; I2 = 0%; low‐quality evidence) but it was not clear whether satisfaction with treatment or adverse effects varied according to which treatment was used. No study in this comparison reported semi‐objectively assessed MBL or subjectively assessed MBL.
Contraceptive vaginal ring (CVR) versus other medical treatments
COCP
COCP was compared with CVR in two trials. There were discrepancies between some of the findings and there was no evidence of a benefit for one treatment compared to the other for response to treatment, MBL or participant satisfaction with treatment. There was a greater likelihood of nausea with COCP. No study in this comparison reported objectively assessed MBL or subjectively assessed MBL.
Progestogens
CVR was compared to long course progestogens in one trial. It is possible that CVR increased the odds of satisfaction; but we are uncertain whether CVR improved MBL. The evidence was based on small numbers of participants and was very low quality, so definitive conclusions could not be reached. No study in this comparison reported objectively assessed MBL, subjectively assessed MBL, or adverse events.
Authors' conclusions
Moderate‐quality evidence suggests that the combined oral contraceptive pill over six months reduces HMB in women with unacceptable HMB from 12% to 77% (compared to 3% in women taking placebo). When compared with other medical options for HMB, COCP was less effective than the LNG IUS. Limited evidence suggested that COCP and CVR had similar effects. There was insufficient evidence to determine comparative efficacy of combined hormonal contraceptives with NSAIDs, or long course progestogens.
PICO
一般語訳
過多月経に対するホルモン配合避妊薬
レビューの論点
コクランの婦人科学・生殖グループが、過多月経に対するホルモン配合避妊薬(訳注:本邦で経口避妊薬(OC)、エストロゲン・プロゲスチン配合薬(EP)、ピルと呼ばれる薬剤)の効果を、無治療またはプラセボ(偽の治療)または他の内科的治療と比較してレビューした。
背景
過多月経は貧血(赤血球が少なすぎる状態)やQOL(生活の質)・ウェルビーイングの障害の原因となりうる。このため閉経前の女性は、月経の治療のためにかかりつけ医や婦人科専門医を受診することがある。ホルモン併用経口避妊薬(OC)は子宮内膜(子宮の内側を覆う、月経の際に出血する部分)を薄くして月経をコントロールできる。他の避妊法(腟リングや皮膚パッチ(訳注・いずれも本邦未承認))もまた同様の機序で経血を減少させる。
研究の特性
ホルモン配合避妊法(ほとんどがピル)と無治療またはプラセボまたは他の内科的治療を比較した、805例からなる8試験を同定した。これらの研究は出血、患者満足度、生活の質、有害事象、ヘモグロビン濃度(赤血球に含まれる、体に酸素を運搬する蛋白質)を評価していた。本エビデンスは2018年9月現在のものである。
主な結果
エストラジオール吉草酸塩とジエノゲストを含むOCがプラセボと比較して過多月経を減少させ生活の質とヘモグロビン濃度を改善させること、しかし軽度の副作用を生じることが2試験で示された。NSAIDsやプロゲストーゲンのような他の治療法と避妊薬を比較した場合のエビデンスは不十分であった。子宮内黄体ホルモン放出システム(LNG‐IUS)はOCよりも過多月経の減少において優れていることが2試験で示された。ホルモン使用腟リングとOCとに異なる効果があるというエビデンスは2試験において認められなかった。ホルモン併用パッチ(経皮パッチ)の効果を評価した研究は見つけられなかった。
エビデンスの質
経口避妊薬とプラセボを比較したエビデンスの質は中等度であったが、他の方法と比較したエビデンスの質は低から非常に低であった。経血を減少させる点においてLNG‐IUSはOCよりも有効であったが、他の治療との比較についてはエビデンスが不十分であった。ホルモン併用避妊法は過多月経を減少させるが、他の方法と比べて絶対的に確実であるとは言えない(LNG‐IUSはより効果が高いように見える)。
Authors' conclusions
Summary of findings
| Combined oral contraceptive pill compared to placebo for heavy menstrual bleeding | ||||||
| Patient or population: heavy menstrual bleeding | ||||||
| Outcomes | Anticipated absolute effects* (95% CI) | Relative effect | № of participants | Certainty of the evidence | Comments | |
| Risk with placebo | Risk with Combined oral contraceptive pill | |||||
| Response to treatment | 29 per 1,000 | 401 per 1,000 | OR 22.12 | 363 | ⊕⊕⊕⊝ | |
| Improvement in MBL (participant assessment) | 424 per 1,000 | 791 per 1,000 | OR 5.15 | 339 | ⊕⊕⊕⊝ | |
| Other primary menstrual bleeding and satisfaction outcomes: | No study reported these outcomes in this comparison | |||||
| Adverse events ‐ Any adverse events (treatment‐emergent) | 354 per 1,000 | 543 per 1,000 | OR 2.17 | 411 | ⊕⊕⊕⊝ | |
| *The risk in the intervention group (and its 95% confidence interval) is based on the assumed risk in the comparison group and the relative effect of the intervention (and its 95% CI). | ||||||
| GRADE Working Group grades of evidence | ||||||
| 1 Risk of bias downgraded because of potential reporting bias (selective reporting of outcomes in publications) and unknown influence of pharmaceutical company involved in authoring the publications | ||||||
| Combined oral contraceptive pill compared to non‐steroidal anti‐inflammatory drugs for heavy menstrual bleeding | ||||||
| Patient or population: heavy menstrual bleeding | ||||||
| Outcomes | Anticipated absolute effects* (95% CI) | Relative effect | № of participants | Certainty of the evidence | Comments | |
| Risk with non‐steroidal anti‐inflammatory drugs | Risk with Combined oral contraceptive pill | |||||
| Menstrual blood loss (end of trial values) | The mean menstrual blood loss (end of trial values) ranged from 58 to 84 mL | MD 2.67 mL lower | ‐ | 32 | ⊕⊝⊝⊝ | Menstrual blood loss measured by the alkaline haematin method but knowledge of treatment may have influenced women's behaviour |
| Other primary menstrual bleeding and satisfaction outcomes: | No study reported these outcomes in this comparison | |||||
| Adverse events | No study reported this outcome in this comparison | |||||
| *The risk in the intervention group (and its 95% confidence interval) is based on the assumed risk in the comparison group and the relative effect of the intervention (and its 95% CI). | ||||||
| GRADE Working Group grades of evidence | ||||||
| 1 Risk of bias downgraded one level because of lack of blinding, unclear allocation concealment and attrition 2 Precision downgraded two levels because of very serious imprecision (small single crossover trial with moderate attrition and very low numbers of participants | ||||||
| Combined oral contraceptive pill compared to levonorgestrel‐releasing intrauterine system for heavy menstrual bleeding | ||||||
| Patient or population: heavy menstrual bleeding | ||||||
| Outcomes | Anticipated absolute effects* (95% CI) | Relative effect | № of participants | Certainty of the evidence | Comments | |
| Risk with levonorgestrel‐releasing intrauterine system | Risk with Combined oral contraceptive pill | |||||
| Treatment success (PBAC < 100 at end of treatment or no requirement for alternative treatment ) | 868 per 1,000 | 581 per 1,000 | OR 0.21 | 151 | ⊕⊕⊝⊝ | Participants were not blinded |
| Satisfaction with treatment | 842 per 1,000 | 607 per 1,000 | OR 0.29 | 37 | ⊕⊝⊝⊝ | Participants were not blinded |
| Other primary menstrual bleeding outcomes: | No study reported these outcomes in this comparison | |||||
| Adverse effects ‐ Any adverse events | 850 per 1,000 | 895 per 1,000 | OR 1.50 | 39 | ⊕⊝⊝⊝ | Individual adverse effects did not differ by group |
| *The risk in the intervention group (and its 95% confidence interval) is based on the assumed risk in the comparison group and the relative effect of the intervention (and its 95% CI). | ||||||
| GRADE Working Group grades of evidence | ||||||
| 1 Risk of bias downgraded two levels because lack of blinding may have had a substantial effect on the measurement of this outcome; also it was unclear whether the involvement of the funder might have influenced the findings 2 Precision downgraded level because effects measured in only one trial | ||||||
| Combined oral contraceptive pill compared to contraceptive vaginal ring for heavy menstrual bleeding | ||||||
| Patient or population: heavy menstrual bleeding | ||||||
| Outcomes | Anticipated absolute effects* (95% CI) | Relative effect | № of participants | Certainty of the evidence | Comments | |
| Risk with contraceptive vaginal ring | Risk with Combined oral contraceptive pill | |||||
| Response to treatment | 680 per 1,000 | 440 per 1,000 | OR 0.37 | 50 | ⊕⊝⊝⊝ | Participants unblinded |
| Menstrual blood loss ‐ At end of treatment (MBL) | The mean menstrual blood loss ‐ At end of treatment ranged from 97 to 112 mL | MD 22.46 mL higher | ‐ | 100 | ⊕⊝⊝⊝ | Suspicions that SD in one of the trials was really a SE. Participants unblinded |
| Menstrual blood loss ‐ After 3 months follow up (MBL) | The mean menstrual blood loss ‐ After 3 months follow up was 120 mL | MD 81 mL higher | ‐ | 50 | ⊕⊝⊝⊝ | Participants unblinded |
| Satisfaction with treatment | 800 per 1,000 | 603 per 1,000 | OR 0.38 | 50 | ⊕⊝⊝⊝ | Participants unblinded |
| Other primary menstrual bleeding outcomes: | No study reported these outcomes in this comparison | |||||
| Adverse events: nausea | 40 per 1,000 | 188 per 1,000 | OR 5.56 | 100 | ⊕⊕⊝⊝ | Nausea was the only adverse event which found differences between groups. There was no evidence of differences for other effects such as: headache, bleeding and other outcomes |
| *The risk in the intervention group (and its 95% confidence interval) is based on the assumed risk in the comparison group and the relative effect of the intervention (and its 95% CI). | ||||||
| GRADE Working Group grades of evidence | ||||||
| 1 Risk of bias downgraded one level because of lack of blinding 2 Precision downgraded one level because results from single trial 3 Inconsistency downgraded one level because of large variation in the measures of variance 4 Precision downgraded one level because of substantially wide confidence interval 5 Precision downgraded one level because data from single trial | ||||||
| Contraceptive vaginal ring compared to progestogens for heavy menstrual bleeding | ||||||
| Patient or population: heavy menstrual bleeding | ||||||
| Outcomes | Anticipated absolute effects* (95% CI) | Relative effect | № of participants | Certainty of the evidence | Comments | |
| Risk with progestogens | Risk with Contraceptive vaginal ring | |||||
| Menstrual blood loss (at end of study) | The mean menstrual blood loss (at end of study) was 92.3 mls | MD 2.1 mls lower | ‐ | 95 | ⊕⊝⊝⊝ | Participants were unblinded and PBAC was used to measure menstrual blood loss |
| Other primary menstrual bleeding outcomes: | No study reported these outcomes in this comparison | |||||
| Satisfaction | 426 per 1,000 | 708 per 1,000 | OR 3.28 | 95 | ⊕⊝⊝⊝ | Participants were unblinded |
| Adverse events | No study reported this outcome in this comparison | |||||
| *The risk in the intervention group (and its 95% confidence interval) is based on the assumed risk in the comparison group and the relative effect of the intervention (and its 95% CI). | ||||||
| GRADE Working Group grades of evidence | ||||||
| 1 Risk of bias downgraded two levels because of lack of blinding and concerns over reporting bias 2 Precision downgraded one level because results based on a single trial | ||||||
Background
Description of the condition
Abnormal uterine bleeding (AUB) may be defined as any variation from the normal menstrual cycle, and includes changes in regularity and frequency of menses, in duration of flow, or in amount of blood loss (SOGC 2013). AUB is a common condition affecting women of reproductive age.
The PALM‐COEIN is a proposed standardised classification system for AUB (Munro 2011). Structural causes that can be diagnosed on imaging and/or biopsy include polyps, adenomyosis, leiomyomata, and malignancy or pre‐malignancy of the uterus. Nonstructural causes allow consideration of underlying medical conditions including coagulopathy, ovulatory dysfunction, endometrial, iatrogenic and not yet specified (Munro 2011). This newly proposed method of distinguishing between types of abnormal bleeding suggests diagnostic evaluations to guide effective treatment.
Heavy menstrual bleeding (HMB) is an excessive blood loss that impairs the woman's quality of life either physical, emotional, social or material. It is benign, and not associated with pregnancy or any other gynaecological or systemic disease (Munro 2011). HMB is the most common presentation of AUB.
In the past, HMB has been defined as blood loss of 80 mL or more per menstrual cycle. Two different approaches to quantify the menstrual blood loss (MBL) are available: haematin alkaline (Hallberg 1966) and the Pictorial Blood Loss Assessment Chart (PBAC) (Higham 1990). Studies measuring the blood loss objectively reported that many women who seek treatment for HMB do not actually have losses greater than average (Fraser 1985; Hallberg 1966; Haynes 1977). Yet their menstrual bleeding can have a significant impact on quality of life and lead to time off work, and fatigue related to iron deficiency anaemia. Moreover, HMB can have a significant burden on healthcare resources. Fortunately, this new definition of HMB is more holistic and requires assessment of the impairment of the women's quality of life independently of the total amount of blood loss (Munro 2011; NICE 2018).
HMB prevalence varies according to method used to quantify the blood loss. Recent studies report that between 20% and 52% of women would present HMB at some point during reproductive years (Fraser 2009; Marsh 2014; NICE 2018).
HMB is a common reason for referral to a gynaecologist. In the USA, approximately 30% of the gynaecological referrals are for HMB, with enormous costs associated with the condition. Costs of treatment are between USD 1 billion and 1.5 billion per year and costs for lost of productivity are estimated between USD 12 billion to 36 billion (Liu 2007; Miller 2015). In England and Wales 30,000 women each year undergo surgical treatment for HMB (RCOG 2014). EUR 250, USD 50)
Description of the intervention
Treatment for HMB can be medical or surgical. Hysterectomy has traditionally been regarded as the 'definitive' treatment, but surgical options such as hysterectomy and the less invasive endometrial ablation are associated with risks and complications. Medical options enable women to retain their fertility.and avoid the risks of surgery. The UK NICE guidelines on HMB recommend the following medical treatments: hormonal (levonorgestrel‐releasing intrauterine system (LNG IUS), combined oral contraceptives, and progestogens), and non‐hormonal (non‐steroidal anti‐inflammatory drugs (NSAIDs) and antifibrinolytics) (NICE 2018). The choice of medication depends upon its appropriateness, likely acceptability to a woman, and whether or not she requires contraception.
Combination contraception methods, in the form of a pill, the vaginal ring, and the transdermal patch, have all been shown to regulate the menstrual cycle in premenopausal women, with the added benefit of reducing MBL (Bjarnadottir 2002; Kaunitz 2009a; Kaunitz 2009b; Stewart 2005).
How the intervention might work
The oestrogen component in combination oestrogen‐progestogen oral contraceptives prevents follicle‐stimulating hormone (FSH) secretion and development of a dominant follicle (egg). It also provides endometrial stability and growth and enhances the impact of progestins. Progestin prevents the luteinising hormone (LH) surge and ovulation, and creates an atrophic (thinner) endometrial lining, which reduces overall blood loss at the time of withdrawal bleeding (Fritz 2012). The combined hormonal vaginal ring also offers contraception and menstrual cycle control, but requires only half the dose of hormones and half the systemic exposure to oestrogen compared to the combined oral contraceptive pill (Roumen 2007).
The combined hormonal transdermal patch releases a daily dose of oestrogen and progestogen through the skin into the bloodstream. It works in the same way as the pill and ring by preventing ovulation. It also thickens cervical mucus, which makes it more difficult for sperm to move through the cervix, and thins the endometrial lining so a fertilised egg is less likely to be able to implant itself.
Why it is important to do this review
A number of medical options are available and are recommended as first‐line therapy in women with HMB, one of which is combined hormonal contraception (NICE 2018). This review is an update (and expansion) of the review, Oral contraceptive pill for heavy menstrual bleeding (Farquhar 2009), which found that there was insufficient evidence to come to any conclusions. This update of the review is necessary to synthesise new evidence on efficacy and safety and also to look at other types of delivery of combined hormonal contraception, such as the transdermal patch and the vaginal ring.
Other Cochrane reviews have investigated the benefits and harms of other medical treatments (Bryant‐Smith 2018; Lethaby 2008; Lethaby 2013; Lethaby 2015), and a Cochrane protocol, Interventions for the treatment of heavy menstrual bleeding has been published (Bofill Rodriguez 2018). For women to make evidence‐based decisions on the options, it is important to clarify the benefits and harms of these therapies.
Objectives
To determine the efficacy of combined hormonal contraceptives (delivered in either oral, ring, or patch forms) compared with other medical therapies, placebo, or no therapy in the treatment of heavy menstrual bleeding (HMB).
Methods
Criteria for considering studies for this review
Types of studies
All randomised controlled comparisons of combined oral contraceptives or other combined hormonal treatment versus other medical therapies, placebo, or no treatment for the treatment of heavy menstrual bleeding (HMB).
Criteria for exclusion of trials:
-
irregular menses and intermenstrual bleeding;
-
pathological causes of HMB;
-
iatrogenic causes of HMB;
-
post‐menopausal bleeding (> 1 year from the last period).
Other points for exclusion will be considered in retrospect so that no potentially relevant trials are missed.
Types of participants
-
Women of reproductive years
-
Regular heavy periods measured either objectively or subjectively assessed at baseline for at least one‐month follow‐up
-
Type of settings: primary care, family planning, or specialist clinic
Types of interventions
Combined hormonal contraceptives (pills, ring, or patch) versus other methods of medical treatment, no treatment or placebo for heavy menstrual bleeding. All types and dosages of combined hormonal contraceptives were considered.
Types of outcome measures
Primary outcomes
The primary outcomes were menstrual bleeding and participant satisfaction.
-
Menstrual blood loss (MBL) was measured in different ways:
-
-
treatment success (defined by authors of the included studies in terms of reduction in MBL);
-
objectively assessed MBL (as measured by the alkaline haematin method in a laboratory);
-
semi‐objectively assessed MBL (as measured by participants using the Pictorial Blood Assessment Chart (PBAC) or similar tool);
-
subjectively assessed MBL (as measured by the participant's assessment of change in blood loss, if recorded on a valid scale).
-
-
Participant satisfaction with treatment:
-
-
Recent trials have focused more on women's experiences of the impact of treatments on their condition, rather than objective quantification of the amount of menstrual blood lost; this change of focus is supported by NICE (NICE 2018).
-
Secondary outcomes
Secondary outcomes were:
-
adverse events;
-
quality of life, measured by validated scales such as Short Form 36 (SF36) and Health Related Quality of Life (HRQoL‐4);
-
haemoglobin (Hb).
Search methods for identification of studies
We searched for all published and unpublished RCTs of combined hormonal contraceptives without language restriction and in consultation with the Gynaecology and Fertility Group (CGF) Information Specialist.
Electronic searches
The CGF Information Specialist searched the following electronic databases for relevant trials:
-
the Cochrane CGF Specialised Register of Controlled Trials, PROCITE platform (searched 6 September 2018), see Appendix 1;
-
the Cochrane Central Register of Controlled Trials; via the Cochrane Register of Studies Online (CRSO Web platform) (searched 6 September 2018), see Appendix 2;
-
MEDLINE (Epub Ahead of Print, In‐Process & Other Non‐Indexed Citations) Ovid (from 1946 to 6 September 2018), see Appendix 3;
-
Embase Ovid (1980 to 6 September 2018), see Appendix 4;
-
PsycINFO Ovid (from 1806 to 6 September 2018), see Appendix 5;
-
CINAHL (Cumulative Index to Nursing and Allied Health Literature (from 1961 to 6 September 2018), see Appendix 6.
The MEDLINE search was combined with the Cochrane highly sensitive search strategy for identifying randomised trials which appears in the Cochrane Handbook of Systematic Reviews of Interventions (chapter 6, 6.4.11) (Higgins 2011). The Embase, PsycINFO and CINAHL searches were combined with trial filters developed by the Scottish Intercollegiate Guidelines Network (SIGN).
One review author (AL) searched other electronic sources of trials.
-
Trial registers for ongoing and registered trials
-
www.clinicaltrials.gov (a service of the US National Institutes of Health);
-
www.who.int/trialsearch/Default.aspx (the World Health Organisation International Trials Registry Platform search portal).
-
-
LILACs and other Spanish, Portuguese language databases (Latin American and Caribbean Health Science Information database (from 1982 to July 2017)).
-
PubMed and Google Scholar (for recent trials not yet indexed in major databases).
Searching other resources
One review author (AL) also handsearched reference lists of relevant trials and systematic reviews retrieved by the search.
Data collection and analysis
Selection of studies
Two review authors (AL, MW) screened the titles and abstracts of all trials from the completed search results and removed those that were clearly irrelevant. All potentially relevant studies were retrieved in full text for further assessment to determine whether they met the inclusion criteria (study design, types of participants, types of interventions) for the review. Studies that were not relevant were excluded and the reasons for their exclusion were documented. Studies were not excluded if they did not measure any of the relevant outcomes of the review, as we considered that they might have been measured, but not reported. If there were any disagreements between the two review authors, a third review author was consulted and we attempted to reach a consensus. The selection process was documented in a PRISMA flow diagram (Figure 1).

Study flow diagram.
Data extraction and management
Two review authors (AL and MW, or MB) independently extracted data from all the eligible studies that were included in the review. We used a standard data extraction form to pilot data extraction from the first three studies and made modifications to the form, where necessary. Extracted data included the following.
-
Year of publication
-
Year of study
-
Country of study
-
Sample size
-
Participation rate
-
Method of recruitment
-
Eligibility criteria
-
Diagnostic criteria
-
Method of randomisation
-
Method of blinding (if any)
-
Number of study arms
-
Types of participants
-
Types of interventions
-
Types of comparators
We collected the following data regarding outcomes:
-
for dichotomous outcomes, event rates, with population of participants as the denominator
-
for continuous outcomes, the mean values, with standard deviation, as the measure of variation. Where the SD was missing, we attempted to contact the authors of the relevant trial or, where author contact or data retrieval were unsuccessful, we planned to impute the value of the SD. Imputation was not necessary.
Where data from a trial had been published more than once, the studies were collated under a single study ID with multiple references. We extracted any data that were additional and not repeated from any of the publications. We contacted study authors for clarification or missing data, as required. Where there was disagreement between the two review authors over data extraction, a third review author was consulted with the aim of achieving consensus.
Assessment of risk of bias in included studies
Two review authors (ALand MW, or MB) independently assessed risk of bias for the included studies using the Cochrane 'Risk of bias' tool (Higgins 2011). The biases considered relevant to this review were: selection bias (random sequence generation; allocation concealment); performance bias (blinding of participants and personnel); detection bias (blinding of outcome assessors); attrition bias (incomplete outcome data); reporting bias (selective reporting); and other forms of bias (such as baseline imbalance, selective reporting of subgroups, or potential influence from funders). Judgements were assigned to each of these domains, as recommended by the Cochrane Handbook for Systematic Reviews of Interventions (Higgins 2011). We graded each 'Risk of bias' domain as 'low', 'unclear' or 'high', We described all judgments fully and presented the conclusions in the 'Risk of bias' table, included in the Characteristics of included studies table. Disagreements over assessments were resolved by discussion.
Measures of treatment effect
For dichotomous data (such as adverse events), we used the number of events in the intervention and control groups of each study to calculate Mantel‐Haenszel odds ratios (ORs), together with 95% confidence intervals (CIs).
For continuous data (such as MBL), we calculated mean differences (MDs) with 95% CIs, only if the data were not clearly skewed. Where the data in the individual studies were analysed using nonparametric tests, or results were presented as medians with ranges (or both), this was suggestive of skewness in the data. Where means and standard deviations or standard errors were presented in individual studies, in order to assess for skewness, we made a rough check using a method suggested in the Cochrane Handbook for Systematic Reviews of Interventions (Higgins 2011). We calculated the difference between the mean and the lowest or highest possible values for the data and divided this by the standard deviation; a ratio less than 2 was considered possible evidence of skew and a ratio less than 1 was considered strong evidence of skew. Studies with strong evidence of skew were not pooled with other studies; instead, their results were reported in narrative format in data tables. For pooled studies with continuous data, MDs were calculated, together with 95% CIs.
In future updates, if different scales are used to measure continuous outcomes, we will use the standardised mean difference (SMD), with 95% CIs, to measure these data; this was not necessary for this update.
Unit of analysis issues
The unit of analysis in all included studies was the individual participant.
Dealing with missing data
Data were analysed on an intention‐to‐treat basis (using data from all randomised participants), as far as possible, and attempts were made to obtain missing data from the authors of each included study (where analyses were generally based only on the participants who remained in the trial on completion of treatment). Where these were unobtainable (e.g. data were not collected on drop outs and no methods were undertaken to estimate the missing data), we analysed only the available data.
Assessment of heterogeneity
We considered whether the clinical and methodological characteristics of the included studies were sufficiently similar for meta‐analysis to provide a meaningful summary. Where meta‐analyses were able to be performed, we checked for heterogeneity by visually inspecting the forest plots for evidence of poor overlap of the 95% CIs. More formally, we used the Chi2 test (with a P value < 0.10 being evidence of significance) and the I2 value. The Cochrane Handbook for Systematic Reviews of Interventions(Higgins 2011) suggested a rough guide for interpretation of I2 values:
-
0% to 40% might not be important;
-
30% to 60% may represent moderate heterogeneity;
-
50% to 90% may represent substantial heterogeneity;
-
75% to 100% was considered substantial heterogeneity.
For this review, where there was an I2 > 50%, we explored possible explanations for the variation in sensitivity analyses (see below). If the variation between estimates could not be adequately explained and where there was an I2 > 75%, we considered whether it was helpful to calculate summary effect measures of the outcomes. If the individual estimates were consistently on one side of the line of no effect in the forest plot, we calculated summary effect measures, but interpreted the findings cautiously. If the individual estimates were not consistent (i.e. distributed on either side of the line of no effect), we did not calculate summary effects, but instead displayed the individual estimates on the forest plot without combining the studies.
Assessment of reporting biases
We aimed to minimise the likelihood of reporting bias by conducting a comprehensive search for eligible studies (with no restriction according to language,or publication status) and by being alert to the duplication of data. In spite of these efforts, it is still possible that some studies might have been missed, so our conclusions should be interpreted with some caution. Had we found 10 or more studies for any of the outcomes, we planned to use a funnel plot to explore the possibility of small‐study effects, but we found insufficient studies to do this.
Data synthesis
Where studies could be combined in meta‐analyses, we used RevMan 5 (Revman 2014) and random‐effects models; otherwise, the results from trials that could not be combined were presented in data tables in a narrative format.
Subgroup analysis and investigation of heterogeneity
Where data were available, we planned to undertake subgroup analyses according to type and dose of contraceptive. There were insufficient trials to undertake subgroup analyses.
Sensitivity analysis
We conducted sensitivity analyses for the primary outcomes to determine whether the conclusions were robust to arbitrary decisions made regarding the eligibility and analysis. These analyses included consideration of whether the review conclusions would have differed if:
-
eligibility was restricted to studies only with low risk of bias;
-
a fixed‐effect model had been used for analysis.
Overall quality of the body of evidence: 'Summary of findings' tables
We generated 'Summary of findings' tables using GRADEPRO software (GRADEpro GDT) to evaluate the overall quality of the body of evidence for all the primary review primary outcomes (treatment success, menstrual bleeding assessed objectively, semi‐objectively or subjectively, and participant satisfaction with treatment) as well as adverse events for the main review comparison (combined oral contraceptive pill compared to placebo). We prepared additional 'Summary of findings' tables for the other important comparisons (combined oral contraceptive pill compared to non‐steroidal anti‐inflammatory drugs (NSAIDS), levonorgestrel‐releasing intrauterine system, contraceptive vaginal ring (CVR), and progestogens). Two review authors (AL, MW) made independent judgments on the overall quality of studies for each of these outcomes, according to the GRADE criteria (study limitations (i.e. risk of bias), consistency of effect, imprecision, indirectness and publication bias). For each GRADE criterion, if there were concerns about quality, the assessment could be downgraded by either one or two levels. Overall quality for each outcome could be categorised as either high, moderate, low or very low, according to these assessments.
Results
Description of studies
Results of the search
Prior to the update of the review, only one small study with 38 participants was included (Fraser 1991). Additional details on the prior searches undertaken were not available at this update.
For the 2018 update, we identified 815 articles from searching electronic databases and seven articles from searching other resources from a search undertaken in 2017. An additional 386 studies were identified from a search undertaken in September 2018. With the removal of duplicates, 1186 articles remained, including the RCT included in prior versions of the review; of these, 1167 articles were excluded during the assessment of titles and abstracts. Nineteen articles were retrieved as full text for more detailed assessment. Eight of these articles were excluded because they did not meet the inclusion criteria for the review and we documented the reasons for their exclusion (see Excluded studies). Two other studies are ongoing and documented in the Ongoing studies section of the review and one published study was documented in the Studies awaiting classification section of the review. Thus, eight studies, with 805 participants, were included in the review. Details of the screening and selection process are found in Figure 1 (PRISMA study flow diagram).
Included studies
Eight studies with 805 participants were included in this update of the review. Studies were generally small with only three studies including more than 100 participants (Fraser 2011; Jensen 2011; Shabaan 2011).
Study design and setting
Of the eight included studies, seven had a parallel group design (Agarwal 2016; Dahiya 2016; Endrikat 2009; Fraser 2011; Hashim 2012; Jensen 2011; Shabaan 2011) and one small trial had a cross‐over design (Fraser 1991). Four were multicentre trials (Endrikat 2009; Fraser 2011; Hashim 2012; Jensen 2011) and four were undertaken in single centres (Agarwal 2016; Dahiya 2016; Fraser 1991; Shabaan 2011).
Participants
The included studies were undertaken in Egypt (one study with two centres and one single‐centre study (Hashim 2012; Shabaan 2011, respectively)), India (two single‐centre studies (Agarwal 2016; Dahiya 2016)), Australia (one single‐centre study (Fraser 1991)), Canada (one study with nine centres (Endrikat 2009)), the USA and Canada (one study with 47 centres (Jensen 2011)), and Australia and Europe (one study with 34 centres (Fraser 2011)). This latter study had centres in the Czech Republic, Finland, Germany, Hungary, the Netherlands, Poland, Sweden, the Ukraine, the UK, and Australia.
Women were generally recruited from outpatient settings and all complained of heavy menstrual bleeding (HMB), which was mostly confirmed at baseline by pictorial chart measurements. Participants were commonly excluded from the trials if there was an indication of pathology, if they were obese, had taken hormone treatment recently, or if they were smokers. Three of the eight studies did not exclude participants if they had small fibroids (Agarwal 2016; Dahiya 2016; Endrikat 2009). Two trials (Fraser 2011; Jensen 2011) also included women with prolonged bleeding; however, most of the women had HMB (91% and 93% in Fraser 2011 and 76% and 86% in Jensen 2011). In these two studies, where possible, outcome data were restricted to the subgroup in the trials that had confirmed HMB.
Participants were required to be in the reproductive age group and some trials excluded women with evidence that they were perimenopausal. All women were over the age of 18 years; mean age varied from 27 to 42 years of age, where reported.
Interventions
Seven of the eight included studies compared combined oral contraceptive pills (COCP) with either placebo (two trials: Fraser 2011; Jensen 2011), mefenamic acid (one trial: Fraser 1991), naproxen (one trial: Fraser 1991), the levonorgestrel‐releasing intrauterine system (LNG IUS) (two trials: Endrikat 2009; Shabaan 2011), or the combined hormonal vaginal ring (two trials: Agarwal 2016; Dahiya 2016). COCP dosage varied: three trials assessed a regimen of ethinyl oestradiol 30 ug/levonorgestrel 150 ug; one trial assessed ultra low‐dose ethinyl oestradiol 20 ug/desogestrel 120 ug, one trial assessed ethinyl oestradiol 20 ug/NETA 1 mg; and the two trials comparing COCP with placebo used a step‐up/step‐down dose of hormones (E2V 3 mg on days one to two; E2V 2 mg + DNG 2 mg on days three to seven; E2V 2 mg + DNG 3 mg on days eight to 24; E2V 1 mg on days 25 to 26; and placebo on days 27 to 28).
The experimental intervention was either taken orally (COCP) or was inserted into the vagina (contraceptive vaginal ring (CVR)). Two trials compared a COCP with a combined hormonal vaginal ring (which was newly inserted each cycle and released ethinyl estradiol (EE) 15 ug and etonorgestrel 120 ug daily per cycle). Doses of the COCP varied slightly; one trial used a dose of EE 20 ug + desogestrel 120 ug; the other used a dose of EE 30 ug + levonorgestrel 150 ug. Hormones were taken for three weeks during the cycle followed by a treatment‐free week. One other trial (Hashim 2012) compared the CVR with norethisterone acetate (NETA). We did not identify any trials that used the combined hormonal patch as the experimental treatment.
The comparators were either placebo (two trials), non‐steroidal anti‐inflammatory drugS (NSAIDs) (mefenamic acid and naproxen) (one trial), danazol (one trial), progestogens (norethisterone acetate) (one trial), or LNG IUS (levonorgestrel‐releasing intrauterine system (two trials). Mefenamic acid was given in a dosage of 500 mg every six to eight hours from the first sign of menses until 24 hours after the usual duration of heavy bleeding, naproxen was given in a dosage of 500 mg at the first onset of menses followed by 250 mg every six to eight hours until 24 hours after the usual duration of heavy bleeding,, and danazol was given in a continuous dosage of 200 mg from day five. Norethisterone acetate was given in a dosage of 5 mg three times daily from days five to 26 of the menstrual cycle. The levonorgestrel‐releasing intrauterine system was inserted into the uterus within seven days of the start of the last menstrual period. The device releases up to 20 ug of LNG every 24 hours.
Outcomes
Primary
Menstrual blood loss (MBL) was measured in a number of different ways. Trials commonly measured MBL at the end of the study, but absolute and percentage reduction from baseline was also measured. Some trials also measured response to treatment. which was defined in similar ways; two trials (Fraser 2011; Jensen 2011) defined response as a composite of the absence of all qualifying conditions: no bleeding episodes that lasted more than seven days; no more than four bleeding episodes overall (in 90 days); no bleeding episodes that were greater than 80 mL; no more than one bleeding episode increase from baseline; no more than 24 days bleeding overall; and no increase from baseline in an individual participant's total number of bleeding days. Two other trials (Agarwal 2016; Endrikat 2009) measured response (or success) of treatment as a PBAC (Pictorial Blood Loss Assessment Chart) score < 100. One trial (Shabaan 2011) measured the 'failure of treatment' (defined as the initiation of an alternative medical treatment or the need for surgery); in this study, data from the reciprocal of this outcome were used as an indication of treatment success. Two trials (Fraser 2011; Jensen 2011) measured participants' assessment (via the Patient's Overall Assessment Scale) of improvement (defined as scoring either 'very much improved', 'much improved' or 'improved') in their MBL. In sum, menstrual bleeding was measured either objectively (by the alkaline haematin method in a laboratory), semi‐objectively (by participants' assessment of the amount of blood lost in a pictorial chart) or subjectively, by participants' assessment of improvement. The two placebo‐controlled trials (Fraser 2011; Jensen 2011) measured MBL both objectively and subjectively.
Satisfaction was included as a primary outcome because, although reduction in the amount of blood is considered important, it is now considered important for interventions to focus on women's own experiences of the impact their condition (and treatment) has on their lives (NICE 2018). Satisfaction was measured in three trials (Agarwal 2016; Endrikat 2009; Hashim 2012). Two of these trials indicated details of the measurement scales; satisfaction was recorded if participants scored 'very satisfied' or 'satisfied' on a four‐level scale questionnaire.
Secondary
Adverse events were measured in all trials except for two (Fraser 1991; (Shabaan 2011). In some of the studies, the authors did not provide any details regarding how these events were collected. In another study (Endrikat 2009), the authors indicated that investigators collected adverse events that were volunteered by participants at each follow‐up period (three, six, nine and 12 months); these events were documented in case reports and assessed for likely relationship with the interventions on a five‐point scale (not related; unlikely related; possibly related; probably related; and definitely related). In two other studies (Fraser 2011; Jensen 2011), adverse events were also spontaneously volunteered rather than directly elicited. They were then coded using an internationally recognised dictionary (MedDRA version 10.0).
Quality of life was measured by three studies (Endrikat 2009; Hashim 2012; Shabaan 2011); the first study used a 'menorrhagia severity score' and the latter two studies used the Health‐Related Quality of Life (HRQoL‐4) questionnaire. The severity score was developed as a condition‐specific questionnaire by Ruta, with converted scores ranging from 0% (least severe) to 100% (most severe). The HRQoL‐4 was a more general questionnaire measuring health‐related perceived physical and mental health over time. It included four questions: "(1) Would you say your health is: excellent, very good, good, fair, or poor?; (2) Now thinking about your physical health, which includes physical illness and injury, for how many days during the past 30 days was your physical health not good; (3) Now thinking about your mental health, which includes stress, depression and problems with emotions, for how many days during the past 30 days was your mental health not good?; (4) During the past 30 days, for about how many days did poor physical or mental health keep you from doing your usual activities, such as self‐care, work, or recreation?"
Haemoglobin was measured by six studies (Agarwal 2016; Endrikat 2009; Fraser 2011; Hashim 2012; Jensen 2011; Shabaan 2011), mostly at the end of the study treatment regimen.
Excluded studies
See Characteristics of excluded studies.
Eight studies were excluded (Creatsas 1998; Davis 2000; Jain 2016; Kriplani 2016; Munro 2006; Sayed 2011; Srivaths 2015; Weisberg 2015), all because the participants did not meet the inclusion criteria. One study investigated bleeding patterns as a result of treatment and the participants were not required to have HMB; two studies assessed the effects of treatment on women with fibroid‐related HMB, one study investigated urgent treatments for acute HMB episodes; and four studies either included participants with only irregular HMB or a mixture of regular and irregular HMB (with results not reported separately).
Risk of bias in included studies
Refer to Figure 2 and Figure 3.

Methodological quality graph: review authors' judgements about each methodological quality item presented as percentages across all included studies.

Methodological quality summary: review authors' judgements about each methodological quality item for each included study.
Allocation
All of the eight trials provided evidence of adequate sequence generation, with randomisation mostly undertaken by computer‐generated lists of random numbers. Most (five out of the eight trials) studies also provided adequate concealment of allocation. Allocation concealment was assessed as 'unclear' in three trials (Agarwal 2016; Fraser 1991; Shabaan 2011) due to lack of reporting.
Blinding
Two trials comparing COCP with placebo (Fraser 2011; Jensen 2011) ensured blinding of participants, investigators and assessors, as the control groups had treatment regimens identical in appearance to the experimental intervention. One other small trial (Fraser 1991) did not have blinding of participants or investigators, but this was unlikely to have caused performance bias, as the outcome was measured in a laboratory setting. For this trial, the assessors may have been influenced by the lack of blinding and this domain was recorded as 'unclear'.
The remaining five trials were all considered to be at high risk of both performance and detection bias for most outcomes (bleeding, satisfaction, response, adverse events, quality of life) as blinding (of participants, investigators and assessors) was not possible, due to the nature of the interventions and in many cases the participants were also the assessors. However, for the assessment of haemoglobin, blinding was not likely to have led to performance bias as the outcome was measured in the laboratory. In these trials, outcome assessment was considered to be at low risk of bias.
Incomplete outcome data
Seven of the eight studies were considered at low risk of attrition bias; either there were no missing data or missing data were minimal and were balanced across groups with clearly specified reasons for attrition. A small trial (Fraser 1991) had substantial withdrawal of over 15% and was considered at high risk of bias.
Selective reporting
Only three of the eight studies were considered at low risk of reporting bias because all prespecified outcomes were reported; in some cases, prior protocols for the studies were checked for changes in reporting. One study (; Fraser 1991) was considered at unclear risk of bias for this domain, as outcomes recorded in the methods sections of the publications were not reported in the results sections. Two trials (Dahiya 2016; Hashim 2012) were considered at high risk of bias, as the authors did not report on a prespecified outcome, acceptability of treatment, or their protocol specified fewer outcomes than were reported in the publication (there was a high risk of data mining). Two other trials (Fraser 2011; Jensen 2011) were considered at unclear risk of bias because more outcome results were reported in the trial register than in the trial publications.
Other potential sources of bias
Three trials had no evidence of other sources of bias; in particular, groups were comparable at baseline (Agarwal 2016; Dahiya 2016; Shabaan 2011). Two studies were considered at unclear risk of other bias; in one small trial (Fraser 1991), it was not possible to check whether groups were comparable at baseline and in the other (Hashim 2012), a pharmaceutical company provided one of the interventions, but not the other. Three studies (Endrikat 2009; Fraser 2011; Jensen 2011) were considered at high risk of other bias, as there was strong evidence of influence from pharmaceutical companies who provided the intervention. In these studies, half or more of the authors were employees of the company providing the intervention and the other authors had financial conflicts of interest.
Effects of interventions
See: Summary of findings for the main comparison Combined oral contraceptive pill compared to placebo for heavy menstrual bleeding; Summary of findings 2 Combined oral contraceptive pill compared to non‐steroidal anti‐inflammatory drugs for heavy menstrual bleeding; Summary of findings 3 Combined oral contraceptive pill compared to levonorgestrel‐releasing intrauterine system for heavy menstrual bleeding; Summary of findings 4 Combined oral contraceptive pill compared to contraceptive vaginal ring for heavy menstrual bleeding; Summary of findings 5 Contraceptive vaginal ring compared to progestogens for heavy menstrual bleeding
Combined oral contraceptive pill (COCP) versus placebo
Two studies (Fraser 2011; Jensen 2011) compared COCP (comprising natural 17B estradiol and dienogest) with placebo. Participants were included in the trials if they had prolonged or heavy menstrual bleeding (HMB) (a majority of participants in both trials had HMB: 91% to 93% and 76% to 86%). Where possible, primary outcome data were reported only for the proportions that had HMB.
Primary outcomes
Response to treatment
(see Analysis 1.1)
COCP was associated with a greater response to treatment when compared with placebo (odds ratio (OR) 22.12, 95% confidence interval (CI) 4.40 to 111.12; 2 studies; 363 participants; I2 = 50%; moderate‐quality evidence). Although heterogeneity was high, both studies independently improved response, as defined by a return to 'menstrual normality' after approximately six months of treatment; see Characteristics of included studies for details.
Menstrual blood loss (MBL) (at end of treatment and change in MBL from baseline to end of treatment)
(see Analysis 1.2 and Analysis 1.3)
The data for these two outcomes in women with HMB (not the total population) were not reported in the publications but included in the trial register; the authors stated that no statistical test was performed. The data for both outcomes in both trials appeared skewed and were reported in tables. Although no statistical testing was performed, COCP was associated with less blood loss after treatment than placebo in both trials. The author confirmed that COCP reduced MBL compared to placebo in the full trial populations of both trials.
Participant assessment of improvement in MBL
(see Analysis 1.4)
COCP was associated with an improvement in MBL (as assessed by participants on a validated scale) compared to placebo (OR 5.15, 95% CI 3.16 to 8.40; 2 studies; 339 participants; I2 = 0%; moderate‐quality evidence).
Secondary outcomes
Adverse events
(see Analysis 1.5)
Adverse events were measured as any 'treatment‐emergent' events. Specific adverse events were also compared between groups. There were more adverse events associated with COCP than placebo (OR 2.17, 95% CI 1.34 to 3.50; 2 studies; 411 participants; I2 = 14%; moderate‐quality evidence). With respect to a wide range of individual adverse events, there was no indication that these differed between groups, except for breast pain where COCP was associated with greater odds compared to placebo (OR 8.05; 95% CI 1.04 to 62.05; 2 studies; 411 participants; I2 = 0%; moderate‐quality evidence).
Haemoglobin
(see Analysis 1.6)
Haemoglobin levels were increased with COCP compared to placebo in both trials (no summary estimates; data in table)
Quality of life
(see Analysis 1.7)
Quality of life was measured by a modified Work Productivity and Activity Impairment Questionnaire. The authors reported that activities in daily living were improved with COCP compared to placebo (no summary estimates; data in table).
Combined oral contraceptive pill (COCP) versus non‐steroidal anti‐inflammatory drugs (NSAIDs)
COCP (ethinyl estradiol 30 ug and levonorgestrel 150 ug) was compared with both naproxen and mefenamic acid in one very small crossover trial (Fraser 1991); we used only first‐phase data (individual participants) which were not published but provided by the authors. The rationale for using first‐phase data was both to reduce the risk of carry‐over between phases influencing the data and also to reduce the risk of differential dropout from the trial. There were only three participants in the COCP group, seven in the naproxen group and 19 in the mefenamic acid group. Data were insufficient to find a difference between groups in MBL after two months of treatment (MD ‐2.67, 95% CI ‐40.08 to 34.74; 1 study; 32 participants; I2 = 0%; very low‐quality evidence) (see Analysis 2.1).
Combined oral contraceptive pill (COCP versus levonorgestrel‐releasing intrauterine system (LNG IUS)
Two studies (Endrikat 2009; Shabaan 2011) compared COCP (either ethinyl estradiol 20 ug plus norethisterone acetate 1 mg or ethinyl estradiol 30 mcg plus levonorgestrel 150 mcg) with the LNG IUS over a period of 12 months.
Primary outcomes
Treatment success
(see Analysis 3.1)
Treatment success was defined by Endrikat 2009 as PBAC (Pictorial Blood Loss Assessment Chart) measurement < 100 at the end of treatment. Shabaan 2011 defined treatment failure as the need for alternative medication or surgery; the inverse of these proportions was thus defined, for the purposes of this review, as treatment 'success'. LNG IUS was associated with more success than COCP (OR 0.21, 95% CI 0.09 to 0.48; 2 studies; 151 participants; I2 = 0%; low‐quality evidence).
Menstrual blood loss (MBL)
(see Analysis 3.2 and Analysis 3.3)
This was measured as absolute change and as percentage change from baseline to end of treatment (data in table format because of skewness). MBL was measured by the PBAC in one trial (Endrikat 2009) and by both PBAC and the alkaline haematin method in the other (Shabaan 2011). Data could not be pooled but both trials independently reported that LNG IUS reduced MBL to a greater extent than COCP.
Satisfaction with treatment
(see Analysis 3.4)
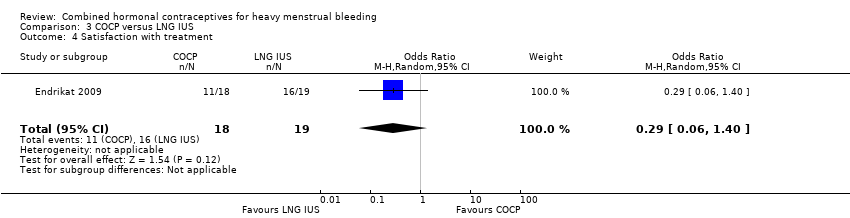
Only one trial measured satisfaction (Endrikat 2009). There was no evidence of a difference in levels of satisfaction between LNG IUS and COCP (OR 0.29, 95% CI 0.06 to 1.40; 1 study; 37 participants; very low‐quality evidence).
Secondary outcomes
Adverse events
(see Analysis 3.5)
Adverse events were measured by only one small trial with 39 participants (Endrikat 2009). There did not appear to be any difference in odds between groups in the rate of total adverse events or individual effects such as dysmenorrhoea, pain, weight change, or intermenstrual bleeding.
Haemoglobin
(see Analysis 3.6 and Analysis 3.7)
Endrikat 2009 measured haemoglobin as the change score between baseline and one year of treatment and found no evidence of a difference between LNG IUS and COCP (data in tables). By contrast, Shabaan 2011 measured haemoglobin levels at the end of the 12‐month trial and reported a higher level in women having LNG IUS compared to those taking the COCP (OR ‐1.30, 95% CI ‐1.71 to ‐0.89; 1 study; 112 participants, low‐quality evidence).
Quality of life
(see Analysis 3.8 and Analysis 3.9 and Analysis 3.10)
Endrikat 2009 measured quality of life by a menorrhagia severity score and found no evidence of a difference between LNG IUS and COCP. By contrast, Shabaan 2011 used the HRQoL‐4 and found no evidence of a difference in the proportions in each group who rated their general health as very good or excellent (OR 0.83, 95% CI 0.35 to 1.95; 1 study; 112 participants; low‐quality evidence). With respect to numbers of days where participants felt physically unwell and had limitations in their activity levels, the COCP group had more compromised days than LNG IUS (physically unwell days: MD 1.00, 95% CI 0.12 to 1.88; 1 study; 112 participants; low‐quality evidence; lost days: MD 5.10, 95% CI 4.25 to 5.95; 1 study; 112 participants; low‐quality evidence). By contrast, with respect to numbers of days where participants felt mentally unwell, the COCP group had fewer compromised days than LNG IUS (mentally unwell days: MD ‐2.30, 95% CI ‐3.23 to ‐1.37; 1 study; 112 participants; low‐quality evidence).
Combined oral contraceptive pill (COCP) versus combined hormonal vaginal ring (CVR)
Two studies (Agarwal 2016; Dahiya 2016) compared COCP (either ultra‐low dose ethinyl estradiol 20 ug plus desogestrel 120 ug, or ethinyl estradiol 30 ug plus levonorgestrel 150 ug) with CVR (ethinyl estradiol 15 ug plus etonorgestrel 120 ug) (marketed as 'Nuvaring'). Both studies treated participants for six months; one study (Agarwal 2016) also compared bleeding scores three months after the conclusion of treatment (nine months).
Primary outcomes
Response to treatment
(see Analysis 4.1)
There was no evidence of a difference in response to treatment (PBAC < 100 after nine months of treatment) between COCP and CVR (OR 0.37, 95% CI 0.12 to 1.17; one trial; 50 participants; very low‐quality evidence).
Menstrual blood loss (MBL)
(see Analysis 4.2 and Analysis 4.3)
Both studies measured MBL by the PBAC system; end of study scores (and end of three months follow‐up for one study) and percentage reduction in MBL from baseline to end of study were measured. There was no evidence of a difference in end of study PBAC scores between groups (MD 22.46, 95% CI ‐34.53 to 79.45; 2 studies; 100 participants, I2 = 65%; very low‐quality evidence). This pooled estimate had substantial heterogeneity and wide confidence intervals. The two studies were assessed to check whether there were differences that might explain the divergent results; participants were mostly similar in both studies but they had much higher baseline MBL scores at baseline in Agarwal 2016 compared to Dahiya 2016. Although the estimate cannot be considered robust, given the heterogeneity between studies, neither trial individually reported a benefit for either treatment. By contrast, three months after ending treatment, participants in the CVR group had lower MBL scores than those in the COCP group (MD 81.0, 95% CI 3.04 to 158.96; one study; 50 participants; very low‐quality evidence).
Discrepant findings were also reported for percentage reduction (from baseline to end of study and baseline to end of 3‐months follow up). Data could not be pooled and results were reported in table format. Agarwal 2016 reported that CVR was associated with a greater percentage reduction than COCP, both at the end of treatment and end of follow up three months later. By contrast, there was no evidence of a difference between groups in MBL percentage reduction in the Dahiya 2016 trial.
Satisfaction with treatment
(see Analysis 4.4)
There was no evidence of different levels of satisfaction with treatment between groups (OR 0.38, 95% CI 0.11 to 1.33; 1 study; 50 participants; very low‐quality evidence).
Secondary outcomes
Adverse events
(see Analysis 4.5)
Individual adverse events were measured mostly by only one study and for most outcomes there was no evidence of a difference between groups except for nausea. The odds of nausea were increased with COCP compared to CVR (OR 5.56, 95% CI 1.27 to 24.39; 2 studies; 100 participants; I2 = 0%; very low‐quality evidence).
Haemoglobin
(see Analysis 4.6)
One.study assessed haemoglobin levels at the end of treatment and after three months follow‐up There was no evidence of a difference in Hb levels between groups (end of treatment: MD ‐2.00, 95% CI ‐0.87 to 0.47; 1 study; 50 participants; moderate‐quality evidence; end of follow up: MD ‐0.40, 95% CI ‐1.18 to 0.38; 1 study; 50 participants; moderate‐quality evidence).
Contraceptive vaginal ring (CVR) versus progestogens
One study (Hashim 2012) compared CVR (Nuvaring: ethinyl estradiol 15 mg plus etonorgestrel 120 ug) with NETA (norethisterone acetate 15 mg daily for days 5 to 26 of cycle).
Primary outcomes
Menstrual blood loss
(see Analysis 5.1 and Analysis 5.2)
There was no evidence of a difference in MBL (either PBAC scores at end of study or percentage reduction (end score: ‐2.10, 95% CI ‐12.35 to 8.15; 1 study; 95 participants; very low‐quality evidence; percentage reduction in MBL: figures not reported)).
Satisfaction
(see Analysis 5.3)
The odds of satisfaction were increased with CVR compared to NETA (OR 3.28, 95% CI 1.40 to 7.67; 1 study; 95 participants; very low‐quality evidence).
Secondary outcomes
Adverse events
(see Analysis 5.4)
There was no evidence of a difference between groups in individual adverse events during treatment, such as nausea, breast tenderness, or breakthrough bleeding.
Haemoglobin
(see Analysis 5.5)
There was no evidence of a difference in Hb levels after treatment between groups (MD ‐0.10, 95% CI ‐0.56 to 0.36; 1 study; 95 participants; very low‐quality evidence).
Quality of life
(see Analysis 5.6 and Analysis 5.7)
The trial used the HRQoL‐4 questionnaire to assess quality of life. There was no evidence of a difference in self‐rated health (very good or excellent) between randomised groups (OR 1.29, 95% CI 0.56 to 3.06; 1 study; 95 participants; very low‐quality evidence). There was also no evidence of a difference in the number of days participants felt physically or mentally unwell (physically unwell: MD ‐0.20, 95% CI ‐0.68 to 0.28; 1 study; 95 participants; very low‐quality evidence;.mentally unwell: MD ‐0.40, 95% CI ‐0.90 to 0.10; 1 study; 95 participants; very low‐quality evidence). However, the odds of lost days with no regular activity were lower with CVR compared to NETA (MD ‐0.90, 95% CI ‐1.42 to ‐0.38; 1 study; 95 participants; very low‐quality evidence).
Discussion
Summary of main results
Combined oral contraceptive pill (COCP) versus placebo
COCP, with a step‐down and step‐up regimen (EV/DNG) improved response to treatment (return to menstrual 'normality'), haemoglobin (Hb) levels, and quality of life (less impairment of activities of daily living), and lowered menstrual blood loss (MBL) when compared to placebo, in two moderately‐sized trials undertaken in a wide range of countries in Europe, and in the USA, Canada and Australia. The quality of the evidence was mostly moderate with adequate blinding, although the possibility that participants may have guessed their allocation to groups cannot be discounted, given the side‐effect profile of oral contraceptives. However, a major limitation of both trials was the involvement of personnel from the pharmaceutical companies providing the experimental treatment in the authorship of the papers. Minor adverse events, in particular breast pain, were more common with the oral contraceptive treatment.
COCP versus other medical treatments
Non‐steroidal anti‐inflammatory drugs (NSAIDs)
There was insufficient evidence to determine whether the COCP improved MBL levels when compared to NSAIDs (mefenamic acid and naproxen).
Levonorgestrel‐releasing intrauterine system (LNG IUS)
The LNG IUS was more effective than COCP in reducing MBL but it was not clear whether satisfaction with treatment, adverse events, Hb levels or quality of life varied according to which treatment was used.
Contraceptive vaginal ring (CVR)
The COCP was compared with the combined hormonal vaginal ring in two trials. There were discrepancies between some of the findings and there was no evidence of a benefit for one treatment compared to the other, except for less nausea with CVR.
Progestogens
The CVR was compared to long course progestogens in one trial. It is possible that CVR increased the odds of satisfaction and days lost from impairment, but the evidence was based on small numbers of participants and was very low quality, so definitive conclusions cannot be reached.
Overall completeness and applicability of evidence
Moderate‐quality evidence clearly supported the use of a particular type of COCP (EV/DNG) compared to placebo in women with heavy menstrual bleeding (HMB) in many different settings, at the expense of increased minor adverse events. EV/DNG was approved by the US Food and Drug Administration (FDA) in 2012 for the treatment of HMB.
However, clinicians are likely to be more interested in how the use of combined hormonal treatment compares to other medical treatments for women with HMB. There was insufficient evidence to determine comparative effects between COCP and NSAIDs (one small study). However, the COCP was found in two studies to be less effective than LNG IUS in reducing MBL overall and reaching menstrual 'normality'. Two studies compared combined hormonal treatments with each other. There did not appear to be a difference in efficacy or safety between mode of delivery (oral pill versus vaginal ring), although the pill was associated with more nausea. In sum, LNG IUS appeared to be more effective than combined hormones, but evidence was either insufficient or mixed with regards to other potential treatments for HMB. Additional well‐designed trials are needed to provide a complete picture of comparative efficacy and safety of combined hormones. Also, it is not clear how different types of contraceptives compare to each other, given the different combinations, dosages, and types of hormones; future trials should attempt to determine the optimum combination for effectiveness.
Quality of the evidence
The quality of the evidence in the comparison of a relatively recently developed COCP (estradiol valerate and dienogest) with placebo was moderate and undertaken in a wide variety of settings, enhancing its applicability. However, there was substantial involvement from the pharmaceutical company providing the active treatment and it is unclear whether this may have influenced the results. Clinicians are likely to be more interested in the efficacy of this active treatment compared to other potential treatments for HMB; with one exception, the evidence for these comparisons is either low or very low in quality, mainly due to lack of blinding (which is likely to influence participant's assessment of their bleeding, satisfaction and adverse events) and imprecision (wide confidence intervals or data based on a single small study). Large well‐designed studies of combined hormones versus other active treatments and comparisons of different types of contraceptives are required in order to reach conclusions on the comparative efficacy of treatments.
Potential biases in the review process
A comprehensive search strategy was used to identify relevant trials, but it is always possible that some studies were missed, The authors made stringent attempts to reduce the likelihood of errors in the review process by duplicating the selection of studies, the assessment of risk of bias and the extraction of relevant data.
Agreements and disagreements with other studies or reviews
Three studies were identified (Bahamondes 2011; Matteson 2013; Uhm 2014) that assessed the role of combined hormones in women with HMB. In addition, the National Institute of Clinical Effectiveness (NICE) has recently (March 2018) updated the evidence for all treatments for the Heavy Menstrual Bleeding Clinical Guideline (NICE 2018)
The Matteson 2013 systematic review included some of the studies from this review and concluded that combined oral contraceptive pills reduced HMB by 35% to 69%. COCP was not as effective as the LNG IUS, a finding supported by this review, There was insufficient information to assess quality of life, satisfaction, or adverse events.
Bahamondes 2011 provided an assessment of the Jensen 2011 trial that was included in this review. He commented on the positive findings for the newly developed EV/DNG oral contraceptive pill, but noted that the trial of six months was relatively short term. He suggested that HMB may be a "chronic condition" with many women suffering from it for many years, so the trial has not been able to assess long‐term efficacy.
The Uhm 2014 systematic review compared the effectiveness of all contraceptives (LNG IUS, progestogens (oral, subcutaneous, depot and implantable) and combined hormonal contraceptives (oral, patch and ring) to treat HMB. They included non randomised studies as well as randomised controlled trials (RCTs). They found that, while all contraceptives were effective, LNG IUS was superior and should be first‐line treatment in women with HMB requiring contraception. In accordance with this review, they did not find sufficient information to determine which COCP was optimal.
The limited findings in this review broadly support the recommendations of the NICE guideline on HMB (NICE 2018). The 2018 update of this guideline suggested that the LNG IUS be considered as an initial treatment for HMB for women with minimal fibroids and no pathology. If the LNG IUS was declined or unsuitable, women could choose between the non‐hormonal treatments of tranexamic acid or NSAIDs or the hormonal treatments of COCPs or long course progestogens. The guideline found no clinically important differences between these second‐line treatments. This review also found no evidence of differences in efficacy between combined hormone treatment and NSAIDs or long course progestogens, but did not include all the trials included in the NICE guideline. The guideline also did not address the option of CVR.
No other relevant studies were identified.

Study flow diagram.

Methodological quality graph: review authors' judgements about each methodological quality item presented as percentages across all included studies.

Methodological quality summary: review authors' judgements about each methodological quality item for each included study.
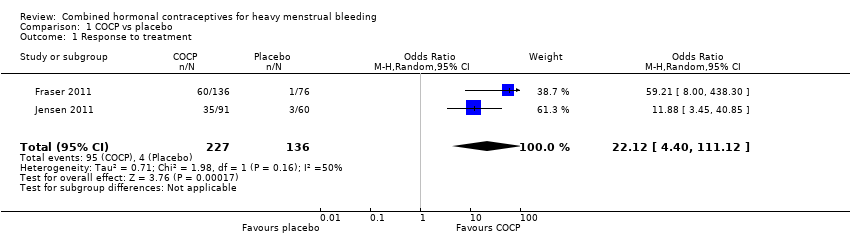
Comparison 1 COCP vs placebo, Outcome 1 Response to treatment.
| Study | Comparison | N | Results | Comment/conclusions |
| Fraser 2011 | E2V/DNG versus placebo | 231 (149 in COCP group and 82 in placebo group overall; 136 and 76, respectively who had confirmed HMB) | Mean (SD) E2V/DNG: 46.7 (72.7) (N = 104) Placebo: 168.6 (112.6) (N = 60) | No statistical test reported |
| Jensen 2011 | E2V/DNG versus placebo | 190 (120 in COCP group and 70 in placebo group overall); 91 and 60, respectively who had confirmed HMB) | Mean (SD) E2V/DNG: 47.5 (58.5) (N = 68) Placebo: 116.9 (77.5) (N = 42) | No statistical test reported |
Comparison 1 COCP vs placebo, Outcome 2 MBL (at the end of treatment).
| Study | Comparison | N | Results | Conclusion/comment |
| Fraser 2011 | E2V/DNG versus placebo | 231 (149 in treatment group and 82 in control group overall); 136 and 76, respectively, for participants with HMB | Mean change (SD) E2V/DNG: ‐480.6 (410.6) (N = 102) Placebo: ‐94.2 (270.2) (N = 59) | No statistical test reported |
| Jensen 2011 | E2V/DNG versus placebo | 190 (120 in treatment group and 70 in control group overall); 91 and 60, respectively, for participants with HMB | Mean change (SD) E2V/DNG: ‐411.9 (308.5) (N = 65) Placebo: ‐152.3 (343.2) (N = 42) | No statistical test reported |
Comparison 1 COCP vs placebo, Outcome 3 Change in MBL from baseline to end of treatment.

Comparison 1 COCP vs placebo, Outcome 4 Improvement in MBL (participant assessment).

Comparison 1 COCP vs placebo, Outcome 5 Adverse events.
| Study | Comparison | N | Results | Conclusion/comment |
| Fraser 2011 | E2V/DNG versus placebo | 231 (149 in treatment group and 82 in control group overall) | Mean (SD) change from baseline E2V/DNG: +0.70 (1.19) (N = 137) Placebo: +0.05 (0.90) (N = 76) | P < 0.0001 (Difference in change between groups: ANOVA with terms for treatment and centre) |
| Jensen 2011 | E2V/DNG versus placebo | 190 (120 in treatment group and 70 in control group overall) | E2V/DNG: +0.57 (1.02) (N = 108) Placebo: | P = 0.004 (Difference in change between groups: ANOVA) |
Comparison 1 COCP vs placebo, Outcome 6 Hemoglobin change from baseline to end of treatment.
| Study | Comparison | N | Results | Conclusion/comments |
| Fraser 2011 | EV2/DNG versus placebo | 231 (149 in treatment group and 82 in control group overall); 136 and 76, respectively, for participants with HMB | Percentage reduction from baseline E2V/DNG: 55.6% Placebo: 30.8% No measure of variation reported | Authors concluded that E2V/DNG improved activities of daily living from baseline to end of treatment to a greater extent than placebo. This outcome was measured by the modified Work Productivity and Activity Impairment Questionnaire (WPAI) ‐ it measured level of impairment on a 10‐point Likert scale. |
| Jensen 2011 | EV2/DNG versus placebo | 135 (99 in treatment group and 36 in control group overall) | Percentage reduction from baseline E2V/DNG: USA: 53% Canada: 56.2% Placebo: USA: 24.8% Canada: 28% | The authors concluded that E2V/DNG had a significant improvement in impairment of activities of daily living, ranging from 37.6% and 39% difference from placebo in USA and Canada, respectively. This outcome was measured by the WPAI‐General Health Questionnaire. |
Comparison 1 COCP vs placebo, Outcome 7 Quality of life (percentage change in activities of daily living).

Comparison 2 COCP versus NSAIDs, Outcome 1 MBL (at end of study).
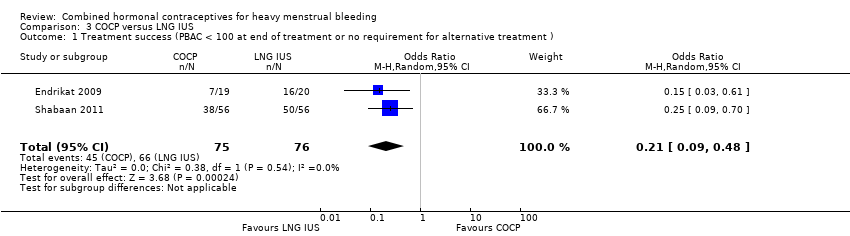
Comparison 3 COCP versus LNG IUS, Outcome 1 Treatment success (PBAC < 100 at end of treatment or no requirement for alternative treatment ).
| Study | Comparison | N | Results | Conclusion/comment |
| Endrikat 2009 | COCP (20 ug ethinyl oestradiol + 1 mg norethindrone acetate) versus LNG IUS | Total: N = 42 FAS (full analysis set): N = 39 (19 in COCP group and 20 in LNG IUS group) | Median change from baseline (IQR) MBL COCP: ‐182 (‐244 to ‐105) LNG IUS: ‐214 (‐308 to ‐102) | P = 0.0024 (LNG IUS compared to COCP) |
| Shabaan 2011 | COCP (30 mcg ethinyl oestradiol + 150 mcg levonorgestrel) versus LNG IUS | Total: N = 112 At 12 months, only N = 64 had alkaline haematin assessment) | Alkaline haematin mean (SD) (change from baseline): COCP: 154.8 (159.7) LNG IUS: 251.7 (136.7) | t test (LNG IUS compared to COCP), P = 0.007 |
Comparison 3 COCP versus LNG IUS, Outcome 2 MBL change from baseline to end of treatment (12 months).
| Study | Comparison | N | Results | Conclusion/comment |
| Endrikat 2009 | COCP (20 ug ethinyl oestradiol + 1 mg norethindrone acetate) versus LNG IUS | Total: N = 42 FAS (full analysis set): N = 39 (19 in COCP group and 20 in LNG IUS group) | Mean percentage change COCP: ‐68% LNG IUS: ‐83% No measure of variation reported | Authors concluded that LNG IUS was associated with a significantly greater percentage change from baseline than COCP (P = 0.0024). Estimate for median difference between the 2 interventions: ‐62 (95% CI ‐89 to ‐18). |
| Shabaan 2011 | COCP (30 mcg ethinyl oestradiol + 150 mcg levonorgestrel) versus LNG IUS | Total: N = 112 At 12 months, only N = 64 had alkaline haematin assessment At 12 months, only N = 64 had PBAC assessment | Mean (SD) percentage change from baseline: Alkaline haematin: COCP: 35.0 (77.0) LNG IUS: 87.4 (11.3) PBAC: COCP: 2.5 (93.2) LNG IUS: 86.6 (17.0) | Alkaline haematin: P = 0.013 PBAC: P < 0.001 |
Comparison 3 COCP versus LNG IUS, Outcome 3 Percentage change in MBL (from baseline to end of study).
Comparison 3 COCP versus LNG IUS, Outcome 4 Satisfaction with treatment.

Comparison 3 COCP versus LNG IUS, Outcome 5 Adverse events.
| Study | Comparison | N | Results | Conclusion/comment |
| Endrikat 2009 | COCP (20 ug ethinyl oestradiol + 1 mg norethindrone acetate) versus LNG IUS | Total: N = 42 FAS (full analysis set): N = 39 (19 in COCP group and 20 in LNG IUS group) | Adjusted (from baseline scores) mean change (%) (no measure of variation reported) COCP: 9.6 LNG IUS: 8.6 | P = 0.7115; the estimate for difference of the means: ‐0.99(95% CI ‐6.4 to 4.5). The authors concluded there was no difference between treatment groups. |
Comparison 3 COCP versus LNG IUS, Outcome 6 Haemoglobin (change score).

Comparison 3 COCP versus LNG IUS, Outcome 7 Haemoglobin (at 12 months).
| Study | Comparison | N | Results | Conclusion/comment |
| Endrikat 2009 | COCP (20 ug ethinyl oestradiol + 1 mg norethindrone acetate) versus LNG IUS | Total: N = 42 FAS (full analysis set): N = 39 (19 in COCP group and 20 in LNG IUS group) | Mean adjusted severity score (%) at end of study COCP: 16.24 LNG IUS: 12.02 No measure of variation reported | Authors concluded that there was no difference between treatment groups (lower values were considered more beneficial) |
Comparison 3 COCP versus LNG IUS, Outcome 8 Quality of life (menorrhagia severity score).
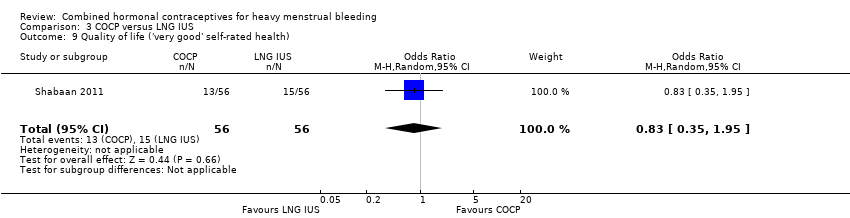
Comparison 3 COCP versus LNG IUS, Outcome 9 Quality of life ('very good' self‐rated health).

Comparison 3 COCP versus LNG IUS, Outcome 10 Quality of life (HRQoL‐4).

Comparison 4 COCP versus CVR, Outcome 1 Response to treatment.

Comparison 4 COCP versus CVR, Outcome 2 MBL (at end of treatment).
| Study | Comparison | N | Results | Conclusion/comment |
| At end of treatment | ||||
| Agarwal 2016 | COCP versus CVR | N = 50 (25 in each group) | Percentage reduction (no measure of variation reported) COCP: 62% CVR: 72% | No statistical test reported |
| Dahiya 2016 | COCP versus CVR | N = 50 (25 in each group) | COCP: 70.02% CVR: 70.73% | No statistical test reported |
| After 3 months follow‐up | ||||
| Agarwal 2016 | COCP versus CVR | N = 50 (25 in each group) | Percentage reduction (no measure of variation reported) COCP: 55.6% CVR: 71.5% | No statistical test reported (only change from baseline per group) |
Comparison 4 COCP versus CVR, Outcome 3 Percentage reduction in MBL (from baseline to end of study).
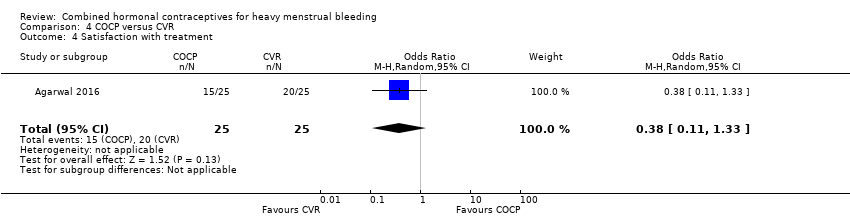
Comparison 4 COCP versus CVR, Outcome 4 Satisfaction with treatment.
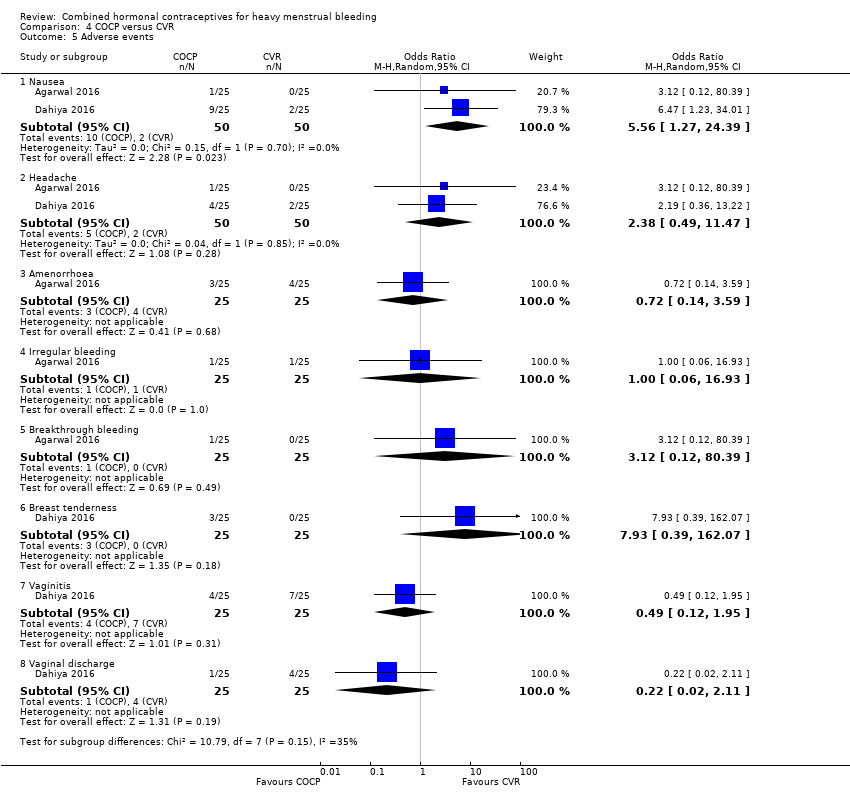
Comparison 4 COCP versus CVR, Outcome 5 Adverse events.
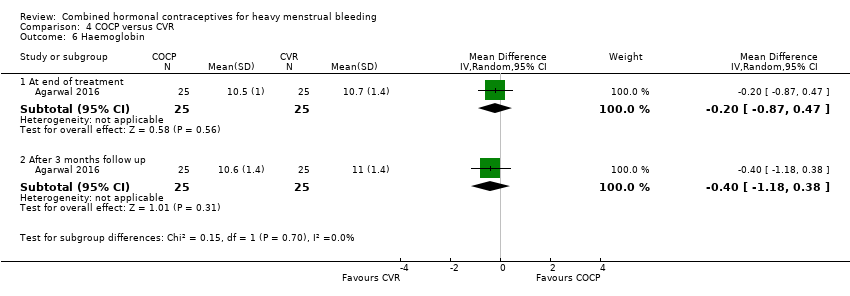
Comparison 4 COCP versus CVR, Outcome 6 Haemoglobin.

Comparison 5 CVR vs progestogens, Outcome 1 MBL (at end of study).
| Study | Comparison | N | Results | Conclusion/comment |
| Hashim 2012 | CVR versus NET | N = 95 (48 in CVR group and 47 in NET group) | Mean (SD) PBAC score reduction (no measure of variation reported) CVR: 68.6 NET: 69.5 | The authors concluded that there were no differences between randomised groups |
Comparison 5 CVR vs progestogens, Outcome 2 Percentage reduction in MBL (at end of study).
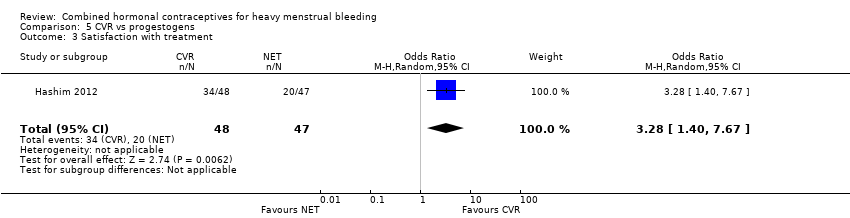
Comparison 5 CVR vs progestogens, Outcome 3 Satisfaction with treatment.

Comparison 5 CVR vs progestogens, Outcome 4 Adverse events.
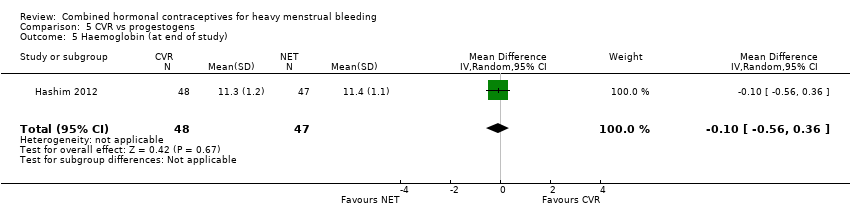
Comparison 5 CVR vs progestogens, Outcome 5 Haemoglobin (at end of study).
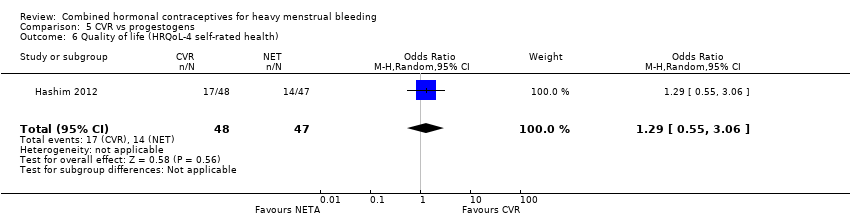
Comparison 5 CVR vs progestogens, Outcome 6 Quality of life (HRQoL‐4 self‐rated health).

Comparison 5 CVR vs progestogens, Outcome 7 Quality of life (HRQoL‐4 impairment or lost days).
| Combined oral contraceptive pill compared to placebo for heavy menstrual bleeding | ||||||
| Patient or population: heavy menstrual bleeding | ||||||
| Outcomes | Anticipated absolute effects* (95% CI) | Relative effect | № of participants | Certainty of the evidence | Comments | |
| Risk with placebo | Risk with Combined oral contraceptive pill | |||||
| Response to treatment | 29 per 1,000 | 401 per 1,000 | OR 22.12 | 363 | ⊕⊕⊕⊝ | |
| Improvement in MBL (participant assessment) | 424 per 1,000 | 791 per 1,000 | OR 5.15 | 339 | ⊕⊕⊕⊝ | |
| Other primary menstrual bleeding and satisfaction outcomes: | No study reported these outcomes in this comparison | |||||
| Adverse events ‐ Any adverse events (treatment‐emergent) | 354 per 1,000 | 543 per 1,000 | OR 2.17 | 411 | ⊕⊕⊕⊝ | |
| *The risk in the intervention group (and its 95% confidence interval) is based on the assumed risk in the comparison group and the relative effect of the intervention (and its 95% CI). | ||||||
| GRADE Working Group grades of evidence | ||||||
| 1 Risk of bias downgraded because of potential reporting bias (selective reporting of outcomes in publications) and unknown influence of pharmaceutical company involved in authoring the publications | ||||||
| Combined oral contraceptive pill compared to non‐steroidal anti‐inflammatory drugs for heavy menstrual bleeding | ||||||
| Patient or population: heavy menstrual bleeding | ||||||
| Outcomes | Anticipated absolute effects* (95% CI) | Relative effect | № of participants | Certainty of the evidence | Comments | |
| Risk with non‐steroidal anti‐inflammatory drugs | Risk with Combined oral contraceptive pill | |||||
| Menstrual blood loss (end of trial values) | The mean menstrual blood loss (end of trial values) ranged from 58 to 84 mL | MD 2.67 mL lower | ‐ | 32 | ⊕⊝⊝⊝ | Menstrual blood loss measured by the alkaline haematin method but knowledge of treatment may have influenced women's behaviour |
| Other primary menstrual bleeding and satisfaction outcomes: | No study reported these outcomes in this comparison | |||||
| Adverse events | No study reported this outcome in this comparison | |||||
| *The risk in the intervention group (and its 95% confidence interval) is based on the assumed risk in the comparison group and the relative effect of the intervention (and its 95% CI). | ||||||
| GRADE Working Group grades of evidence | ||||||
| 1 Risk of bias downgraded one level because of lack of blinding, unclear allocation concealment and attrition 2 Precision downgraded two levels because of very serious imprecision (small single crossover trial with moderate attrition and very low numbers of participants | ||||||
| Combined oral contraceptive pill compared to levonorgestrel‐releasing intrauterine system for heavy menstrual bleeding | ||||||
| Patient or population: heavy menstrual bleeding | ||||||
| Outcomes | Anticipated absolute effects* (95% CI) | Relative effect | № of participants | Certainty of the evidence | Comments | |
| Risk with levonorgestrel‐releasing intrauterine system | Risk with Combined oral contraceptive pill | |||||
| Treatment success (PBAC < 100 at end of treatment or no requirement for alternative treatment ) | 868 per 1,000 | 581 per 1,000 | OR 0.21 | 151 | ⊕⊕⊝⊝ | Participants were not blinded |
| Satisfaction with treatment | 842 per 1,000 | 607 per 1,000 | OR 0.29 | 37 | ⊕⊝⊝⊝ | Participants were not blinded |
| Other primary menstrual bleeding outcomes: | No study reported these outcomes in this comparison | |||||
| Adverse effects ‐ Any adverse events | 850 per 1,000 | 895 per 1,000 | OR 1.50 | 39 | ⊕⊝⊝⊝ | Individual adverse effects did not differ by group |
| *The risk in the intervention group (and its 95% confidence interval) is based on the assumed risk in the comparison group and the relative effect of the intervention (and its 95% CI). | ||||||
| GRADE Working Group grades of evidence | ||||||
| 1 Risk of bias downgraded two levels because lack of blinding may have had a substantial effect on the measurement of this outcome; also it was unclear whether the involvement of the funder might have influenced the findings 2 Precision downgraded level because effects measured in only one trial | ||||||
| Combined oral contraceptive pill compared to contraceptive vaginal ring for heavy menstrual bleeding | ||||||
| Patient or population: heavy menstrual bleeding | ||||||
| Outcomes | Anticipated absolute effects* (95% CI) | Relative effect | № of participants | Certainty of the evidence | Comments | |
| Risk with contraceptive vaginal ring | Risk with Combined oral contraceptive pill | |||||
| Response to treatment | 680 per 1,000 | 440 per 1,000 | OR 0.37 | 50 | ⊕⊝⊝⊝ | Participants unblinded |
| Menstrual blood loss ‐ At end of treatment (MBL) | The mean menstrual blood loss ‐ At end of treatment ranged from 97 to 112 mL | MD 22.46 mL higher | ‐ | 100 | ⊕⊝⊝⊝ | Suspicions that SD in one of the trials was really a SE. Participants unblinded |
| Menstrual blood loss ‐ After 3 months follow up (MBL) | The mean menstrual blood loss ‐ After 3 months follow up was 120 mL | MD 81 mL higher | ‐ | 50 | ⊕⊝⊝⊝ | Participants unblinded |
| Satisfaction with treatment | 800 per 1,000 | 603 per 1,000 | OR 0.38 | 50 | ⊕⊝⊝⊝ | Participants unblinded |
| Other primary menstrual bleeding outcomes: | No study reported these outcomes in this comparison | |||||
| Adverse events: nausea | 40 per 1,000 | 188 per 1,000 | OR 5.56 | 100 | ⊕⊕⊝⊝ | Nausea was the only adverse event which found differences between groups. There was no evidence of differences for other effects such as: headache, bleeding and other outcomes |
| *The risk in the intervention group (and its 95% confidence interval) is based on the assumed risk in the comparison group and the relative effect of the intervention (and its 95% CI). | ||||||
| GRADE Working Group grades of evidence | ||||||
| 1 Risk of bias downgraded one level because of lack of blinding 2 Precision downgraded one level because results from single trial 3 Inconsistency downgraded one level because of large variation in the measures of variance 4 Precision downgraded one level because of substantially wide confidence interval 5 Precision downgraded one level because data from single trial | ||||||
| Contraceptive vaginal ring compared to progestogens for heavy menstrual bleeding | ||||||
| Patient or population: heavy menstrual bleeding | ||||||
| Outcomes | Anticipated absolute effects* (95% CI) | Relative effect | № of participants | Certainty of the evidence | Comments | |
| Risk with progestogens | Risk with Contraceptive vaginal ring | |||||
| Menstrual blood loss (at end of study) | The mean menstrual blood loss (at end of study) was 92.3 mls | MD 2.1 mls lower | ‐ | 95 | ⊕⊝⊝⊝ | Participants were unblinded and PBAC was used to measure menstrual blood loss |
| Other primary menstrual bleeding outcomes: | No study reported these outcomes in this comparison | |||||
| Satisfaction | 426 per 1,000 | 708 per 1,000 | OR 3.28 | 95 | ⊕⊝⊝⊝ | Participants were unblinded |
| Adverse events | No study reported this outcome in this comparison | |||||
| *The risk in the intervention group (and its 95% confidence interval) is based on the assumed risk in the comparison group and the relative effect of the intervention (and its 95% CI). | ||||||
| GRADE Working Group grades of evidence | ||||||
| 1 Risk of bias downgraded two levels because of lack of blinding and concerns over reporting bias 2 Precision downgraded one level because results based on a single trial | ||||||
| Outcome or subgroup title | No. of studies | No. of participants | Statistical method | Effect size |
| 1 Response to treatment Show forest plot | 2 | 363 | Odds Ratio (M‐H, Random, 95% CI) | 22.12 [4.40, 111.12] |
| 2 MBL (at the end of treatment) Show forest plot | Other data | No numeric data | ||
| 3 Change in MBL from baseline to end of treatment Show forest plot | Other data | No numeric data | ||
| 4 Improvement in MBL (participant assessment) Show forest plot | 2 | 339 | Odds Ratio (M‐H, Random, 95% CI) | 5.15 [3.16, 8.40] |
| 5 Adverse events Show forest plot | 2 | Odds Ratio (M‐H, Random, 95% CI) | Subtotals only | |
| 5.1 Any adverse events (treatment‐emergent) | 2 | 411 | Odds Ratio (M‐H, Random, 95% CI) | 2.17 [1.34, 3.50] |
| 5.2 Acne | 2 | 411 | Odds Ratio (M‐H, Random, 95% CI) | 1.87 [0.24, 14.47] |
| 5.3 Anaemia | 2 | 411 | Odds Ratio (M‐H, Random, 95% CI) | 0.43 [0.11, 1.75] |
| 5.4 Anxiety | 1 | 185 | Odds Ratio (M‐H, Random, 95% CI) | 0.18 [0.02, 1.75] |
| 5.5 Arthralgia | 2 | 396 | Odds Ratio (M‐H, Random, 95% CI) | 0.38 [0.02, 6.59] |
| 5.6 Back pain | 2 | 411 | Odds Ratio (M‐H, Random, 95% CI) | 0.47 [0.15, 1.42] |
| 5.7 Breast pain | 2 | 411 | Odds Ratio (M‐H, Random, 95% CI) | 8.05 [1.04, 62.05] |
| 5.8 Breast tenderness | 2 | 411 | Odds Ratio (M‐H, Random, 95% CI) | 1.37 [0.42, 4.52] |
| 5.9 Bronchitis | 2 | 411 | Odds Ratio (M‐H, Random, 95% CI) | 1.27 [0.27, 5.98] |
| 5.10 Cervical dysplasia | 1 | 185 | Odds Ratio (M‐H, Random, 95% CI) | 0.83 [0.13, 5.08] |
| 5.11 Chest pain | 1 | 185 | Odds Ratio (M‐H, Random, 95% CI) | 0.27 [0.02, 3.05] |
| 5.12 Depression | 1 | 185 | Odds Ratio (M‐H, Random, 95% CI) | 1.68 [0.17, 16.49] |
| 5.13 Diarrhoea | 2 | 411 | Odds Ratio (M‐H, Random, 95% CI) | 0.92 [0.22, 3.94] |
| 5.14 Dizziness | 1 | 185 | Odds Ratio (M‐H, Random, 95% CI) | 0.11 [0.01, 2.28] |
| 5.15 Dysmenorrhoea | 2 | 411 | Odds Ratio (M‐H, Random, 95% CI) | 0.97 [0.28, 3.38] |
| 5.16 Dyspepsia | 1 | 185 | Odds Ratio (M‐H, Random, 95% CI) | 4.00 [0.20, 78.55] |
| 5.17 Fatigue | 2 | 411 | Odds Ratio (M‐H, Random, 95% CI) | 1.05 [0.30, 3.70] |
| 5.18 Gastroenteritis | 1 | 185 | Odds Ratio (M‐H, Random, 95% CI) | 4.00 [0.20, 78.55] |
| 5.19 Headache | 2 | 411 | Odds Ratio (M‐H, Random, 95% CI) | 0.56 [0.17, 1.90] |
| 5.20 Hypertension | 2 | 411 | Odds Ratio (M‐H, Random, 95% CI) | 0.89 [0.20, 3.97] |
| 5.21 Hypoesthesia | 1 | 185 | Odds Ratio (M‐H, Random, 95% CI) | 0.27 [0.02, 3.05] |
| 5.22 Influenza | 2 | 411 | Odds Ratio (M‐H, Random, 95% CI) | 2.32 [0.38, 14.20] |
| 5.23 Insomnia | 1 | 185 | Odds Ratio (M‐H, Random, 95% CI) | 0.27 [0.02, 3.05] |
| 5.24 Metrorrhagia | 2 | 411 | Odds Ratio (M‐H, Random, 95% CI) | 5.53 [1.01, 30.20] |
| 5.25 Migraine | 2 | 411 | Odds Ratio (M‐H, Random, 95% CI) | 1.27 [0.27, 5.98] |
| 5.26 Nasopharyngitis | 2 | 411 | Odds Ratio (M‐H, Random, 95% CI) | 1.16 [0.52, 2.56] |
| 5.27 Nausea | 2 | 411 | Odds Ratio (M‐H, Random, 95% CI) | 1.01 [0.34, 3.00] |
| 5.28 Pharyngitis | 1 | 226 | Odds Ratio (M‐H, Random, 95% CI) | 0.13 [0.01, 1.22] |
| 5.29 Sinusitis | 2 | 411 | Odds Ratio (M‐H, Random, 95% CI) | 0.83 [0.11, 6.60] |
| 5.30 Tension headache | 1 | 185 | Odds Ratio (M‐H, Random, 95% CI) | 5.18 [0.27, 97.75] |
| 5.31 Upper respiratory tract infection | 1 | 185 | Odds Ratio (M‐H, Random, 95% CI) | 2.26 [0.25, 20.66] |
| 5.32 Vaginal infection | 1 | 185 | Odds Ratio (M‐H, Random, 95% CI) | 4.00 [0.20, 78.55] |
| 5.33 Vaginitis (bacterial) | 2 | 411 | Odds Ratio (M‐H, Random, 95% CI) | 0.91 [0.27, 3.05] |
| 5.34 Vertigo | 1 | 226 | Odds Ratio (M‐H, Random, 95% CI) | 0.08 [0.00, 1.51] |
| 5.35 Viral infection | 1 | 226 | Odds Ratio (M‐H, Random, 95% CI) | 7.59 [0.42, 136.58] |
| 5.36 Vomiting | 2 | 411 | Odds Ratio (M‐H, Random, 95% CI) | 0.45 [0.14, 1.52] |
| 5.37 Vulvovaginal mycotic infection | 1 | 185 | Odds Ratio (M‐H, Random, 95% CI) | 0.73 [0.16, 3.37] |
| 5.38 Weight increase | 2 | 411 | Odds Ratio (M‐H, Random, 95% CI) | 2.74 [0.33, 22.46] |
| 6 Hemoglobin change from baseline to end of treatment Show forest plot | Other data | No numeric data | ||
| 7 Quality of life (percentage change in activities of daily living) Show forest plot | Other data | No numeric data | ||
| Outcome or subgroup title | No. of studies | No. of participants | Statistical method | Effect size |
| 1 MBL (at end of study) Show forest plot | 1 | 32 | Mean Difference (IV, Random, 95% CI) | ‐2.67 [‐40.08, 34.74] |
| 1.1 Naproxen | 1 | 10 | Mean Difference (IV, Random, 95% CI) | 8.37 [‐41.04, 57.78] |
| 1.2 Mefenamic acid | 1 | 22 | Mean Difference (IV, Random, 95% CI) | ‐17.49 [‐74.74, 39.76] |
| Outcome or subgroup title | No. of studies | No. of participants | Statistical method | Effect size |
| 1 Treatment success (PBAC < 100 at end of treatment or no requirement for alternative treatment ) Show forest plot | 2 | 151 | Odds Ratio (M‐H, Random, 95% CI) | 0.21 [0.09, 0.48] |
| 2 MBL change from baseline to end of treatment (12 months) Show forest plot | Other data | No numeric data | ||
| 3 Percentage change in MBL (from baseline to end of study) Show forest plot | Other data | No numeric data | ||
| 4 Satisfaction with treatment Show forest plot | 1 | 37 | Odds Ratio (M‐H, Random, 95% CI) | 0.29 [0.06, 1.40] |
| 5 Adverse events Show forest plot | 1 | Odds Ratio (M‐H, Random, 95% CI) | Subtotals only | |
| 5.1 Any adverse events | 1 | 39 | Odds Ratio (M‐H, Random, 95% CI) | 1.5 [0.22, 10.14] |
| 5.2 Intermenstrual bleeding | 1 | 39 | Odds Ratio (M‐H, Random, 95% CI) | 0.31 [0.08, 1.15] |
| 5.3 Menstrual disorder | 1 | 39 | Odds Ratio (M‐H, Random, 95% CI) | 0.35 [0.07, 1.62] |
| 5.4 Headache | 1 | 39 | Odds Ratio (M‐H, Random, 95% CI) | 2.02 [0.41, 9.99] |
| 5.5 Influenza type symptoms | 1 | 39 | Odds Ratio (M‐H, Random, 95% CI) | 0.75 [0.14, 3.90] |
| 5.6 Dysmenorrhoea | 1 | 39 | Odds Ratio (M‐H, Random, 95% CI) | 1.06 [0.13, 8.38] |
| 5.7 Pain | 1 | 39 | Odds Ratio (M‐H, Random, 95% CI) | 0.13 [0.01, 2.66] |
| 5.8 Weight increase | 1 | 39 | Odds Ratio (M‐H, Random, 95% CI) | 2.24 [0.19, 26.91] |
| 5.9 Abdominal pain | 1 | 39 | Odds Ratio (M‐H, Random, 95% CI) | 5.86 [0.26, 130.36] |
| 5.10 Cellulitis | 1 | 39 | Odds Ratio (M‐H, Random, 95% CI) | 5.86 [0.26, 130.36] |
| 5.11 Weight decrease | 1 | 39 | Odds Ratio (M‐H, Random, 95% CI) | 5.86 [0.26, 130.36] |
| 6 Haemoglobin (change score) Show forest plot | Other data | No numeric data | ||
| 7 Haemoglobin (at 12 months) Show forest plot | 1 | 112 | Mean Difference (IV, Random, 95% CI) | ‐1.30 [‐1.71, ‐0.89] |
| 8 Quality of life (menorrhagia severity score) Show forest plot | Other data | No numeric data | ||
| 9 Quality of life ('very good' self‐rated health) Show forest plot | 1 | 112 | Odds Ratio (M‐H, Random, 95% CI) | 0.83 [0.35, 1.95] |
| 10 Quality of life (HRQoL‐4) Show forest plot | 1 | Mean Difference (IV, Random, 95% CI) | Subtotals only | |
| 10.1 Number of physically unhealthy days | 1 | 112 | Mean Difference (IV, Random, 95% CI) | 1.0 [0.12, 1.88] |
| 10.2 Number of mentally unhealthy days | 1 | 112 | Mean Difference (IV, Random, 95% CI) | ‐2.3 [‐3.23, ‐1.37] |
| 10.3 Number of lost days (activity limitation) | 1 | 112 | Mean Difference (IV, Random, 95% CI) | 5.1 [4.25, 5.95] |
| Outcome or subgroup title | No. of studies | No. of participants | Statistical method | Effect size |
| 1 Response to treatment Show forest plot | 1 | 50 | Odds Ratio (M‐H, Random, 95% CI) | 0.37 [0.12, 1.17] |
| 2 MBL (at end of treatment) Show forest plot | 2 | Mean Difference (IV, Random, 95% CI) | Subtotals only | |
| 2.1 At end of treatment | 2 | 100 | Mean Difference (IV, Random, 95% CI) | 22.46 [‐34.53, 79.45] |
| 2.2 After 3 months follow up | 1 | 50 | Mean Difference (IV, Random, 95% CI) | 81.0 [3.04, 158.96] |
| 3 Percentage reduction in MBL (from baseline to end of study) Show forest plot | Other data | No numeric data | ||
| 3.1 At end of treatment | Other data | No numeric data | ||
| 3.2 After 3 months follow‐up | Other data | No numeric data | ||
| 4 Satisfaction with treatment Show forest plot | 1 | 50 | Odds Ratio (M‐H, Random, 95% CI) | 0.38 [0.11, 1.33] |
| 5 Adverse events Show forest plot | 2 | Odds Ratio (M‐H, Random, 95% CI) | Subtotals only | |
| 5.1 Nausea | 2 | 100 | Odds Ratio (M‐H, Random, 95% CI) | 5.56 [1.27, 24.39] |
| 5.2 Headache | 2 | 100 | Odds Ratio (M‐H, Random, 95% CI) | 2.38 [0.49, 11.47] |
| 5.3 Amenorrhoea | 1 | 50 | Odds Ratio (M‐H, Random, 95% CI) | 0.72 [0.14, 3.59] |
| 5.4 Irregular bleeding | 1 | 50 | Odds Ratio (M‐H, Random, 95% CI) | 1.0 [0.06, 16.93] |
| 5.5 Breakthrough bleeding | 1 | 50 | Odds Ratio (M‐H, Random, 95% CI) | 3.12 [0.12, 80.39] |
| 5.6 Breast tenderness | 1 | 50 | Odds Ratio (M‐H, Random, 95% CI) | 7.93 [0.39, 162.07] |
| 5.7 Vaginitis | 1 | 50 | Odds Ratio (M‐H, Random, 95% CI) | 0.49 [0.12, 1.95] |
| 5.8 Vaginal discharge | 1 | 50 | Odds Ratio (M‐H, Random, 95% CI) | 0.22 [0.02, 2.11] |
| 6 Haemoglobin Show forest plot | 1 | Mean Difference (IV, Random, 95% CI) | Subtotals only | |
| 6.1 At end of treatment | 1 | 50 | Mean Difference (IV, Random, 95% CI) | ‐0.20 [‐0.87, 0.47] |
| 6.2 After 3 months follow up | 1 | 50 | Mean Difference (IV, Random, 95% CI) | ‐0.40 [‐1.18, 0.38] |
| Outcome or subgroup title | No. of studies | No. of participants | Statistical method | Effect size |
| 1 MBL (at end of study) Show forest plot | 1 | 95 | Mean Difference (IV, Random, 95% CI) | ‐2.10 [‐12.35, 8.15] |
| 2 Percentage reduction in MBL (at end of study) Show forest plot | Other data | No numeric data | ||
| 3 Satisfaction with treatment Show forest plot | 1 | 95 | Odds Ratio (M‐H, Random, 95% CI) | 3.28 [1.40, 7.67] |
| 4 Adverse events Show forest plot | 1 | Odds Ratio (M‐H, Random, 95% CI) | Subtotals only | |
| 4.1 Nausea | 1 | 95 | Odds Ratio (M‐H, Random, 95% CI) | 0.48 [0.04, 5.47] |
| 4.2 Headache | 1 | 95 | Odds Ratio (M‐H, Random, 95% CI) | 1.5 [0.24, 9.41] |
| 4.3 Breast tenderness | 1 | 95 | Odds Ratio (M‐H, Random, 95% CI) | 0.64 [0.10, 4.00] |
| 4.4 Breakthrough bleeding/spotting | 1 | 95 | Odds Ratio (M‐H, Random, 95% CI) | 0.30 [0.06, 1.55] |
| 4.5 Leukorrhea | 1 | 95 | Odds Ratio (M‐H, Random, 95% CI) | 5.35 [0.60, 47.65] |
| 4.6 Vaginal discomfort | 1 | 95 | Odds Ratio (M‐H, Random, 95% CI) | 5.11 [0.24, 109.28] |
| 4.7 Vaginitis | 1 | 95 | Odds Ratio (M‐H, Random, 95% CI) | 4.18 [0.45, 38.89] |
| 5 Haemoglobin (at end of study) Show forest plot | 1 | 95 | Mean Difference (IV, Random, 95% CI) | ‐0.10 [‐0.56, 0.36] |
| 6 Quality of life (HRQoL‐4 self‐rated health) Show forest plot | 1 | 95 | Odds Ratio (M‐H, Random, 95% CI) | 1.29 [0.55, 3.06] |
| 7 Quality of life (HRQoL‐4 impairment or lost days) Show forest plot | 1 | Mean Difference (IV, Random, 95% CI) | Subtotals only | |
| 7.1 Number of days feeling physically unwell | 1 | 95 | Mean Difference (IV, Random, 95% CI) | ‐0.20 [‐0.68, 0.28] |
| 7.2 Number of days feeling mentally unwell | 1 | 95 | Mean Difference (IV, Random, 95% CI) | ‐0.40 [‐0.90, 0.10] |
| 7.3 Number of lost days (with no regular activity) | 1 | 95 | Mean Difference (IV, Random, 95% CI) | ‐0.90 [‐1.42, ‐0.38] |