Inmersión en agua para el trabajo de parto y el parto
Referencias
References to studies included in this review
References to studies excluded from this review
References to ongoing studies
Additional references
References to other published versions of this review
Characteristics of studies
Characteristics of included studies [ordered by study ID]
| Methods | Randomisation by sealed opaque envelopes containing method indicator card Methodological qualities:
| |
| Participants | Study group: n = 54. Control group: n = 56 Inclusion criteria:
| |
| Interventions | Immersion in labour during the first stage of labour Pool described as an oval‐shaped hot tub. Bath temperature not exceeding 37 degrees celsius. No chemicals added Women in both groups received 'personalised' care but it is not clear if this was 1‐to‐1 care or not, although care overseen by obstetricians and all births conducted by house officers (doctors). | |
| Outcomes | Maternal outcomes:
Fetal outcomes:
| |
| Notes | Academic hospital, Brussels, Belgium Dates of trial: not clear Funding: not reported Declaration of interest: not reported | |
| Risk of bias | ||
| Bias | Authors' judgement | Support for judgement |
| Random sequence generation (selection bias) | Unclear risk | No indication of how random sequence was generated |
| Allocation concealment (selection bias) | Low risk | Sealed opaque envelopes containing method indicator card |
| Blinding of participants and personnel (performance bias) | High risk | High risk of bias could have been introduced because women, carers and researcher could not be blind to group allocation after randomisation due to the nature of the intervention |
| Blinding of outcome assessment (detection bias) | Unclear risk | No information provided |
| Incomplete outcome data (attrition bias) | Low risk | Information available on number of participants asked (water ‐57/control ‐56) to number who gave consent (water ‐53/control ‐56) to outcome data ‐ no attrition |
| Selective reporting (reporting bias) | Low risk | All outcome detailed in methods are reported on |
| Other bias | Unclear risk | It is not clear if women had 1‐to‐1 care, which is known to affect outcomes, but is common for water immersion care |
| Methods | Randomised control trial; no information on how randomisation was achieved | |
| Participants | Water group ‐ n = 53; control group ‐ n = 53 Inclusion criteria:
| |
| Interventions | Immersion in water during first and second stage of labour Information given to women in pregnancy, then randomised to experimental or control group in labour. Water group labour and birth in warm water pool, but no description of pool size or care protocol given. Control group conventional care at the hospital, but not detailed | |
| Outcomes | Data provided on baseline characteristics or age, gravida, parity, previous abortion, and prolonged rupture of membranes Data provided on outcomes, *normal birth rate, *duration of labour, *use of oxytocin and *analgesia (not stated what type) Data collected on *episiotomy/perineal trauma, *neonatal weight, *Apgar score, gender and breastfeeding initiation but data not given | |
| Notes | Study undertaken in Iranian hospital affiliated to Iran University of Medical Sciences, between June 2006 and September 2007 Authors contacted twice for further information but no reply Funding: not reported Declaration of interest: not reported | |
| Risk of bias | ||
| Bias | Authors' judgement | Support for judgement |
| Random sequence generation (selection bias) | Unclear risk | No information given on randomisation processes |
| Allocation concealment (selection bias) | Unclear risk | No information given on randomisation processes |
| Blinding of participants and personnel (performance bias) | High risk | High risk of bias could have been introduced because women, carers and researcher could not be blind to group allocation after randomisation due to the nature of the intervention |
| Blinding of outcome assessment (detection bias) | Unclear risk | No information provided |
| Incomplete outcome data (attrition bias) | Unclear risk | No indication of women who withdrew from study, or that data were lost/incomplete |
| Selective reporting (reporting bias) | High risk | Outcomes not detailed on perineal trauma, neonatal weight, Apgar scores, gender and breastfeeding initiation although data collected and described as not significantly different |
| Other bias | Unclear risk | It is surprising that all the women who went to water gave birth in the water. Normally one would expect some who laboured in water to choose to get out for birth, but no evidence of this as number in each group is the same. This calls into question if all who got into the pool are included in study or just those who remained in for birth as well. |
| Methods | Randomisation was computer‐generated, and then recorded on a list (paper copy), where the next allocation was concealed from the research until the next woman had provided consent, was recruited and thus being allocated.
| |
| Participants | Power calculation undertaken Water n = 58 Control n = 56 Full term, nulliparous, live, cephalic presentation, no complications, cervical dilation of 6 cm or less in established labour | |
| Interventions | Immersion in water during first stage of labour Control group received standard care, including cardiotocography on admission, ambulation, amniotomy and oxytocin augmentation if now cervical progress over 3 hours, intermittent auscultation during labour Intervention group as above with immersion in water when cervix had reached 6 cm to 7 cm dilated, for 60 minutes First stage of labour study, all women received 1‐to‐1 care from the researcher Pool was 194 litres, equipped with a heater. Water temperature ranged from 27 to 38 degrees Celsius. | |
| Outcomes | Pain score on 5‐point behavioural scale and numerical pain score from 0 to 10, at 6 cm to 7 cm dilated and again 1 hour later. In addition, the following data were collected: use of augmentation, amniotic liquor conditions, duration of labour, perineal condition, gestational age, Apgar score at 1 and 5 minutes, maternal and water temperature. | |
| Notes | Study done in Sao Paulo, Brazil Dates of trial: not reported Funding: not reported Declaration of interest: not reported | |
| Risk of bias | ||
| Bias | Authors' judgement | Support for judgement |
| Random sequence generation (selection bias) | Low risk | Computer‐generated random list |
| Allocation concealment (selection bias) | High risk | Each allocation on the list was covered with a tab, which was removed by the researcher after consent form signed by next participant. This description suggests the process could be open to tampering. |
| Blinding of participants and personnel (performance bias) | High risk | High risk of bias could have been introduced because women, carers and researcher could not blind to group allocation after randomisation due to the nature of the intervention. |
| Blinding of outcome assessment (detection bias) | Unclear risk | No information provided |
| Incomplete outcome data (attrition bias) | High risk | Flow chart detailed participants from eligibility to completion; no attrition after instigation of allocated care, however not all women received the allocated intervention. |
| Selective reporting (reporting bias) | Low risk | All the data mentioned in the methods, and that would reasonably be expected of this study are reported. |
| Other bias | Unclear risk | All women had 1‐to‐1 care, which is known to affect outcomes, but is common for water immersion care. In this study the care was from the researcher, regardless of group. |
| Methods | Randomisation by sealed opaque, sequentially numbered envelopes that were kept in the admission ward. Prepared in random blocks of 10, stratified for parity.
| |
| Participants | Study group n = 137. Control group n = 137
Exclusion criteria:
| |
| Interventions | Immersion in water during first stage of labour. Women were allocated to a delivery suite with a bath or to a general delivery suite without a bath. The bath group was allowed to use the bath as long as each woman wished, but they had to get out during second stage of labour (first stage only). The bath tub was 120 cm x 160 cm x 54 cm and the maximum water temperature was 37 degrees Celsius. First stage only study women received care from same midwives but no mention of 1‐to‐1 second care or not. | |
| Outcomes | Maternal outcomes: 1. *maternal experience and satisfaction of labour; 2. *use of analgesia/anaesthesia; 3. *augmentation of labour; 4. *presence of meconium‐stained liquor; 5. *duration of labour and birth; 6. *mode of delivery; 7. *trauma to the birth canal requiring suturing; 8. *blood loss ‐ only as percentage of whole; group no event data by group; 9. *postpartum depression; 10. breastfeeding. Fetal outcomes:
Neonatal outcomes:
| |
| Notes | Tertiary referral hospital in Adelaide, Australia. May 1995‐Sept 1998 Funding: not reported Declaration of interest: not reported | |
| Risk of bias | ||
| Bias | Authors' judgement | Support for judgement |
| Random sequence generation (selection bias) | High risk | Random table of numbers, using variable blocks of 10, by a clerk independent of the study. Stratification was by place of birth, hospital or midwifery birth centre. |
| Allocation concealment (selection bias) | Low risk | On recruitment, midwife telephoned an independent clerk for allocation. |
| Blinding of participants and personnel (performance bias) | High risk | High risk of bias could have been introduced because women, carers and researcher could not be blind to group allocation after randomisation due to the nature of the intervention. |
| Blinding of outcome assessment (detection bias) | Unclear risk | No information provided |
| Incomplete outcome data (attrition bias) | High risk | Data analysed on ITT basis. Flow chart reports on participants from eligibility to completion. From randomisation similar numbers (water 58 (42%)/control 53 (39%)) became ineligible or did not use the allocated care option as might be expected in a study of this size which respected women's right to choice care options; however, this is a high percentage. |
| Selective reporting (reporting bias) | Low risk | All the data mentioned in the methods and that would reasonably be expected of this study are reported. |
| Other bias | Unclear risk | No mention of 1‐to‐1 care or not, but no other issue apparent. |
| Methods | Randomisation by sealed opaque, sequentially numbered envelopes containing the code.
| |
| Participants | Group 1: n = 100: the "early bath group". Group 2: n = 100: the "late bath group" Regional referral hospital in the west of Sweden. Inclusion criteria:
| |
| Interventions | Early versus late Immersion in water during first stage of labour Group 1: the "early bath group" had a cervical dilatation of less than 5 cm when immersed in water. Group 2: the "late bath group" had a cervical dilation of 5 cm or more when immersed in water. All women used an oval tub that was 1.5 m long and 40 cm deep. It contained 300 L of waters at a temperature not more than 38 degrees Celsius. No mention of 1‐to‐1 care or not. | |
| Outcomes | Maternal outcomes:
| |
| Notes | Duration of labour not in acceptable format. Early group 9.80 hours and late group 8.48 hours P < 0.004. Regional referral hospital, Sweden Dates of trial: not reported Funding: not reported Declaration of interest: not reported | |
| Risk of bias | ||
| Bias | Authors' judgement | Support for judgement |
| Random sequence generation (selection bias) | Low risk | Computer‐generated |
| Allocation concealment (selection bias) | Low risk | Sealed opaque envelopes containing allocation |
| Blinding of participants and personnel (performance bias) | High risk | High risk of bias could have been introduced because women, carers and researcher could not be blind to group allocation after randomisation due to the nature of the intervention. |
| Blinding of outcome assessment (detection bias) | Unclear risk | No information provided |
| Incomplete outcome data (attrition bias) | High risk | 1 woman in early bath group did not use water, compared to 7 in late bath group; however, this might be expected as a result of different degrees of progression in labour. |
| Selective reporting (reporting bias) | Low risk | All outcomes identified in methods are reported. |
| Other bias | Unclear risk | Percentage of primigravida higher in early group, but likely to be due to chance. No mention of 1‐to‐1 care or not. |
| Methods | Random assignment to water or traditional birth. | |
| Participants | Primiparous, singleton fetus, cephalic presentation, term pregnancy (37‐42 weeks). | |
| Interventions | Immersion in water during first and second stages of labour. 120 women. Traditional delivery group received, enema, shave, artificial rupture of membranes, fetal monitoring and parenteral nutrition, education on breathing and pushing. Water delivery group; enema and shower before 3 cm cervical dilation, vaginal examination to confirm dilation of 4 cm, entered water bath, maintained at 35‐37 degrees Celsius, free to adopt any position in water, fetus monitored every 15 minutes. | |
| Outcomes | Pain intensity on scale 1‐3 Total duration of labour Blood loss in 24 hours Perineal condition Apgar score | |
| Notes | No mention of 1:1 care Medical model of care evident No description of 'bath' size or shape but refers to free movement Undertaken in 1 unit in China Dates of trial: June 2012 ‐ July 2013 Funding: not reported Declaration of interest: the authors declare that there are no conflicts of interest | |
| Risk of bias | ||
| Bias | Authors' judgement | Support for judgement |
| Random sequence generation (selection bias) | Unclear risk | No indication of how randomisation achieved |
| Allocation concealment (selection bias) | Unclear risk | No information about concealment |
| Blinding of participants and personnel (performance bias) | High risk | Not possible |
| Blinding of outcome assessment (detection bias) | Unclear risk | No information provided |
| Incomplete outcome data (attrition bias) | Low risk | All participants accounted for, no attrition |
| Selective reporting (reporting bias) | Unclear risk | Delivery data limited, but all intended outcomes reported on, but no differentiation by stages of labour |
| Other bias | Unclear risk | Medical module of care within study unit. No description of water bath intervention |
| Methods | Participants randomly allocated to water birth or conventional birth groups | |
| Participants | 200 pregnant women,100 allocated to water birth, 100 to conventional (land) birth | |
| Interventions | Immersion in water during second stage of labour Women in water were able to move about freely but pool not described Conventional care conducted on bed, no further information about care provided | |
| Outcomes | Duration of labour; mode of delivery, Apgar at 1and 5 mins. No raw data provided ‐ only P values for outcomes. | |
| Notes | Mean duration of first stage P < 0.344. mean duration of second stage P = 0.372; mean duration of third stage P = 0.523. caesarean section rate significantly higher in land group P = 0.018. Apgar scores were significantly higher for water birth group at 1 min P = 0.026, at 5 mins P < 0.001. No difference found for other variables Omolbanin hospital, Mashhad, Iran Dates of trial: 2008 and 2009 Funding: not reported Declaration of interest: not reported | |
| Risk of bias | ||
| Bias | Authors' judgement | Support for judgement |
| Random sequence generation (selection bias) | Unclear risk | Full paper in Iranian, so data based on English abstracts only, which did not provide this information |
| Allocation concealment (selection bias) | Unclear risk | Full paper in Iranian, so data based on English abstracts only, which did not provide this information |
| Blinding of participants and personnel (performance bias) | High risk | Blinding of participants and carers not possible due to nature of intervention |
| Blinding of outcome assessment (detection bias) | Unclear risk | No information provided |
| Incomplete outcome data (attrition bias) | High risk | Data implies attrition of 17 of 100 in the water group and 12 in the traditional care group but translation did not provide details |
| Selective reporting (reporting bias) | Unclear risk | Full paper in Iranian, so data based on English abstracts only, which did not provide this information |
| Other bias | Unclear risk | Full paper in Iranian, so data based on English abstracts only, which did not provide this information |
| Methods | Randomisation stated but only described as 'by lots'.
| |
| Participants | 33 women, 18 water, 15 control In labour (cervix 4 cm dilated) Low risk ‐ term, 1 fetus, no complications in current or any previous pregnancy/birth | |
| Interventions | Immersion in water during first stage of labour Intervention was use of bath for max of 60 minutes. Bath was thermally insulted, oval, size 150 cm by 110 cm, by 70 cm deep. Volume was 730 litres. Water temperature 37 degree Celsius No pharmacological analgesia available to either control or intervention group during study hour. After use of bath labour care as normal and could access 'usual' pain relief methods, positions. No mention of 1‐to‐1 care or not. | |
| Outcomes | Duration of first and second stage of labour Pain relief used, pain score before and after study period (1 hour), own assessment in postnatal questionnaire on day 2 postpartum Blood loss, perineal trauma, Apgars Maternal pulse, temperature, blood pressure | |
| Notes | Undertaken in Finland ‐ 1 hospital Dates of trial: April 1997 ‐ March 1998 Funding: not reported Declaration of interest: not reported | |
| Risk of bias | ||
| Bias | Authors' judgement | Support for judgement |
| Random sequence generation (selection bias) | Unclear risk | Randomised 'by lots' in translation so very unclear what this means |
| Allocation concealment (selection bias) | Unclear risk | Described as randomised but translation does not indicate how concealed |
| Blinding of participants and personnel (performance bias) | High risk | High risk of bias could have been introduced because women, carers and researcher could not be blind to group allocation after randomisation due to the nature of the intervention |
| Blinding of outcome assessment (detection bias) | Unclear risk | No information provided |
| Incomplete outcome data (attrition bias) | Unclear risk | Not reported |
| Selective reporting (reporting bias) | Unclear risk | Unable to assess this from translation |
| Other bias | Unclear risk | Full translation not available, just extracts as requested on Cochrane Pregnancy and Childbirth Group translation sheet |
| Methods | Randomisation by sealed opaque, sequentially numbered envelopes containing the code. Prepared in random blocks of 10, stratified for parity.
Women were randomised at full dilatation of bearing down efforts. | |
| Participants | Study group: n = 60.
No immersion of water was used during the first stage of labour. | |
| Interventions | Immersion in water during second stage of labour. Study group: allocated to oval bath tub which contained about 220 L of water. Temperature 34‐38 degrees Celsius. Women were allowed to use different postures in the bath. | |
| Outcomes | Maternal outcomes:
Fetal outcomes:
Neonatal outcomes:
| |
| Notes | Done in South Africa. 1999 Funding: not reported Declaration of interest: not reported | |
| Risk of bias | ||
| Bias | Authors' judgement | Support for judgement |
| Random sequence generation (selection bias) | High risk | Blocks of 10, stratified for parity. Blocks of 10 have potential for breaking concealment for at least participant in each block |
| Allocation concealment (selection bias) | Low risk | Sealed opaque, sequentially numbered envelopes containing the code |
| Blinding of participants and personnel (performance bias) | High risk | High risk of bias could have been introduced because women, carers and researcher could not be blind to group allocation after randomisation due to the nature of the intervention |
| Blinding of outcome assessment (detection bias) | Unclear risk | No information provided |
| Incomplete outcome data (attrition bias) | Low risk | Information from approach to women (133) to allocation (60 + 60); all women completed trial but 3 in control group did not complete follow‐up questionnaire |
| Selective reporting (reporting bias) | Low risk | All outcomes identified in methods are reported. Thesis made available with very detailed reporting |
| Other bias | Unclear risk | All women regardless of group had 1‐to‐1 care from researcher |
| Methods | Randomised when regular contractions and eligible.
| |
| Participants | Study group: KH: n = 364.
| |
| Interventions | Immersion in water during first stage of labour. Study group: warm bath; no information on management of care for either group; Control group: shower allowed. Water use in first stage, no mention of 1‐to‐1 second care or not. | |
| Outcomes | Maternal outcomes:
Neonatal outcomes:
Additional outcomes:
| |
| Notes | 3 obstetric units in Sweden ‐ 1992‐1995 Funding: not reported Declaration of interest: not reported | |
| Risk of bias | ||
| Bias | Authors' judgement | Support for judgement |
| Random sequence generation (selection bias) | Unclear risk | Not indicated |
| Allocation concealment (selection bias) | Low risk | Sealed opaque envelopes |
| Blinding of participants and personnel (performance bias) | High risk | High risk of bias could have been introduced because women, carers and researcher could not be blind to group allocation after randomisation due to the nature of the intervention |
| Blinding of outcome assessment (detection bias) | Unclear risk | No information provided |
| Incomplete outcome data (attrition bias) | High risk | From a total of 1279 women, 42 were excluded across both groups and all centres for obstetric reasons |
| Selective reporting (reporting bias) | Low risk | All outcomes mentioned in methods are reported |
| Other bias | Unclear risk | Study was started in 1 unit then after 2 years 2 further obstetric units were involved to achieve the required sample size |
| Methods | Randomisation by consecutively numbered, computer‐generated random allocation in sealed opaque envelopes.
| |
| Participants | Academic hospital, Ontario, Canada.
800 women were randomised, 15 were withdrawn 8 from study group and 7 from control group. Nearly half (46%) of the women in the study group did NOT use the bath but were still considered experimental participants with the ITT. 41 of the women did not meet eligibility criteria but were still included and results were analysed. | |
| Interventions | Immersion in water during first stage of labour. The use of a Parker whirlpool hot tub with jets during labour. Bath temperature between 38‐39 degrees celsius. Mean total time in tub was 54 minutes. No births in tub. No water immersion during labour. Refer to care being provided by assigned nurse, and all had be trained to care for women using immersion, but not clear if this is 1‐to‐1 second care. First stage only. | |
| Outcomes | Maternal outcomes:
Additional outcomes:
| |
| Notes | Data table 1 incorrect. No response from authors Dates of trial: February‐September 1998 Funding: not reported Declaration of interest: not reported | |
| Risk of bias | ||
| Bias | Authors' judgement | Support for judgement |
| Random sequence generation (selection bias) | Low risk | Computer‐generated |
| Allocation concealment (selection bias) | Low risk | Consecutively numbered sealed opaque envelopes |
| Blinding of participants and personnel (performance bias) | High risk | High risk of bias could have been introduced because women, carers and researcher could not be blind to group allocation after randomisation due to the nature of the intervention |
| Blinding of outcome assessment (detection bias) | Unclear risk | No information provided |
| Incomplete outcome data (attrition bias) | High risk | All participants are accounted for, and 15 withdraws were detailed, as were 41 who did not meet criteria but were recruited |
| Selective reporting (reporting bias) | Low risk | All outcomes mentioned in methods are reported, and seem appropriate for the study and topic |
| Other bias | Unclear risk | No information on this |
| Methods | Randomisation by packets containing random computer‐generated codes.
Main outcome not stated. | |
| Participants | Study group: n = 45
| |
| Interventions | Immersion in water during first stage of labour. Study group: the use of a hot tub with air jets and with a moulded seat during labour. Bath temperature between 32‐41 degrees Celsius. First stage of labour | |
| Outcomes | Maternal outcomes:
Fetal outcomes:
Additional outcomes:
| |
| Notes | Academic hospital, Houston, Texas, USA. December 1990 to December 1991 Funding: not reported Declaration of interest: not reported | |
| Risk of bias | ||
| Bias | Authors' judgement | Support for judgement |
| Random sequence generation (selection bias) | Low risk | Computer‐generated code |
| Allocation concealment (selection bias) | High risk | Midwife know the allocation at the time of recruitment, and risk of bias acknowledged but women apparently would not be recruited if they did not know which allocation they had |
| Blinding of participants and personnel (performance bias) | High risk | High risk of bias could have been introduced because women, carers and researcher could not be blind to group allocation after randomisation due to the nature of the intervention |
| Blinding of outcome assessment (detection bias) | Unclear risk | No information provided |
| Incomplete outcome data (attrition bias) | Low risk | All participants are accounted for throughout study with no withdrawals |
| Selective reporting (reporting bias) | Low risk | All outcomes mentioned in method are reported, and seem appropriate for the study and topic |
| Other bias | Unclear risk | There were significantly more primigravid women in water group, which could affect outcomes, and is a confounding variable |
| Methods | Randomisation into sequentially numbered sealed opaque envelopes containing the code. Prepared in variable random blocks stratified for parity.
| |
| Participants | Study group: n = 59
Exclusion criteria
| |
| Interventions | Immersion in water during first stage of labour. Study group: labour in water; water temperature 34‐38 degrees Celsius; analgesia as required; exit for second stage; not out of the water for more than 30 minutes. First stage study | |
| Outcomes | Outcomes reported: Maternal outcomes:
Fetal outcomes:
Additional outcomes:
| |
| Notes | Academic hospital, South Africa Dates of trial: not reported Funding: not reported Declaration of interest: not reported | |
| Risk of bias | ||
| Bias | Authors' judgement | Support for judgement |
| Random sequence generation (selection bias) | High risk | Random list compiled in different block size of 6 and 8 but not clear how this was achieved or by whom |
| Allocation concealment (selection bias) | Low risk | Sequentially‐numbered sealed opaque envelopes containing the allocation |
| Blinding of participants and personnel (performance bias) | High risk | High risk of bias could have been introduced because women, carers and researcher could not be blind to group allocation after randomisation due to the nature of the intervention |
| Blinding of outcome assessment (detection bias) | Unclear risk | No information provided |
| Incomplete outcome data (attrition bias) | Low risk | All participants are accounted for throughout study with no withdrawals |
| Selective reporting (reporting bias) | Low risk | All outcomes mentioned in method are reports, and seem appropriate for the study and topic |
| Other bias | Unclear risk | Researcher recruited and cared for all women and provided 1‐to‐1 care |
| Methods | Clinical trial with women equally divided into 2 groups. Information available understood to be random allocation. | |
| Participants | Women 16‐28 years of age gravida 1 or 2 gestational age 38‐42 week | |
| Interventions | Immersion in water during first and second stage of labour (100 women) Control group described as 'normal delivery' Active management of labour was undertaken, with use of oxytocin use for ineffective contractions or lack of cervical progress in 2 hours. Promethazine available analgesia with no indication if this resulted in exit from the pool, as the use of this drug would exclude water use in many locations. No indication of 1:1 care. | |
| Outcomes | Duration of first stage of labour Duration of second stage of labour pain score percentage who used analgesia percentage who received oxytocin percentage who had episiotomy percentage who had normal birth percentage who had Apgar score lower than 8 percentage of Woman's satisfied with mode of delivery | |
| Notes | Conducted in Asalian Gynaecological hospital in Iran. The full name of the lead author paper that was initially labelled as by author Akbari 2008 ‐ is Soheila Akbari Torkamani and has be renamed according. This is 1 trial with 2 publications. Dates of trial: February 2006 to February 2007 Funding: not reported Declaration of interest: not reported | |
| Risk of bias | ||
| Bias | Authors' judgement | Support for judgement |
| Random sequence generation (selection bias) | Unclear risk | No information provided |
| Allocation concealment (selection bias) | Unclear risk | No information provided |
| Blinding of participants and personnel (performance bias) | High risk | High risk of bias because women and carers could not be blind to group allocation after randomisation due to the nature of the intervention |
| Blinding of outcome assessment (detection bias) | Unclear risk | No information provided |
| Incomplete outcome data (attrition bias) | High risk | No attrition data provided,however most of outcome data are provided as percentages (see above) and on trying to convert this data to numbers it is evident that data are missing, appears to have different data missing for different outcomes and therefore could not be converted to numbers for analysis |
| Selective reporting (reporting bias) | High risk | Women who required a caesarean section after apparently consenting and entering the trial were excluded indicating analysis was not by ITT. There are no data on the number of such women in each group |
| Other bias | Unclear risk | No information on type of pool used |
| Methods | Randomisation schedule provided by National Perinatal Epidemiology Unit, Oxford. A person unconnected to study prepared by consecutively numbered, computer‐generated random allocation in sealed opaque envelopes.
| |
| Participants | 2 groups in RCT part of study. Water n = 40 Land n = 20 (2:1 ratio as about local experience was 50% of women choose not to use water). Women recruited through community midwife, posters in clinics, and media promotions and interested women contacted researcher or gave permission to own midwife to pass on information. Aged 18‐50 Low risk | |
| Interventions | Immersion in water during first and second stages of labour. Results do not distinguish which of the women allocated to pool, did not use pool (16 of 40 women), used pool for first stage only (13 of 40 women), used pool in second stage but not for birth (1 woman), or gave birth in the pool (10 women) (no subgroup analysis). Data entered into both 'immersion in water versus no immersion during first stage of labour ' AND 'immersion in water versus no immersion during second stage of labour' DATA and ANALYSIS section. Waterbirth pool ‐ dimensions/volume not described, temperature described as recorded but data not provided. No mention of 1‐to‐1 care or not. | |
| Outcomes | ITT analysis done. Maternal: age, social history, pulse, temperature, maternal satisfaction on scale of 0‐6 immediately post birth and in 6 week postal questionnaire. Labour: length of first, second stages; analgesia used; augmentation; mode of birth. Fetus/neonate: cord arterial and venous gases, Apgar score at 1, 5 and 10 mins, time to first respiration, rectal temperature at birth, ear swabs, method of feeding, date and time of first feed, admission to neonatal unit (plus any interventions needed) infection, any mortality/morbidity. Water; duration in water, water temperature, microbiological analysis at end of labour/use. | |
| Notes | Non‐randomised, preference arm data not included although additional 20 participants in this part of study. 16 (40%) of water women did not use water. UK study. Dates of trial: not reported Funding: partly funded by Getting Started in Research Grant from Northampton General Hospital NHS Trust. Declaration of interest: not reported | |
| Risk of bias | ||
| Bias | Authors' judgement | Support for judgement |
| Random sequence generation (selection bias) | Low risk | Computer‐generated independent of study |
| Allocation concealment (selection bias) | Low risk | Consecutively numbered in sealed opaque envelopes |
| Blinding of participants and personnel (performance bias) | High risk | High risk of bias could have been introduced because women, carers and researcher could not be blind to group allocation after randomisation due to the nature of the intervention |
| Blinding of outcome assessment (detection bias) | Unclear risk | No information provided |
| Incomplete outcome data (attrition bias) | High risk | All participants are accounted for throughout study with no withdrawals, however many did not receive the allocated intervention |
| Selective reporting (reporting bias) | Low risk | All outcomes mentioned in method are reported, and seem appropriate for the study and topic |
| Other bias | Unclear risk | 40% or water group did not use water, which is consistent with choice and other papers on this topic |
*: prespecified outcomes
CS: caesarean section
FHR: fetal heart rate
ITT: intention‐to‐treat
KH: Karlskrona Hospital
LH: Lund hospital
NICU: neonatal intensive care unit
OH: Osterund Hospital
OP: Occipito posterior
VBAC: vaginal birth after caesarean section
Characteristics of excluded studies [ordered by study ID]
| Study | Reason for exclusion |
| Unpublished data from 1990 available only. Intervention was whirlpool bath and was inadequate to confirm immersion of the pregnant abdomen was possible. We contacted the author for further information, but nothing was provided. | |
| The intervention was not consistent with immersion of the pregnancy abdomen, as women were in a limited depth of water; were asked to adopt semi‐recumbent positions on a partially inflated air raft with attached head pillow (authors description) for 1 hour, and had cannulation to facilitate repeat blood samples. All of which limits mobility and is not consistent with water immersion in labour. | |
| Cases drawn from existing records, not randomised design. | |
| The intervention was inappropriate as the study was to compare the effect of the essential oil of ginger compared to essential oil of lemon grass rather than water immersion. | |
| Women had all been diagnosed as having dystocia in the first stage of labour (less than 1 cm/hr progress after established labour), and therefore at increased risk of complications and this does not meet participant inclusion criteria. | |
| Women had all been diagnosed as having dystocia in the first stage of labour (less than 1 cm/hr progress after established labour), and therefore at increased risk of complications and this does not meet participant inclusion criteria. | |
| The intervention is hot water spray, or shower, and not immersion in water and hence is not the intervention of this review. | |
| Antenatal women standing in water versus antenatal women sat in water with legs elevated and peripheral oedema assessed. Not immersion and not labour or birth. | |
| The participants are antenatal women, not in labour or during birth. | |
| The intervention is warm water shower, and not immersion in water and hence is not the intervention of this review as the physiological impact of a shower is considered to be different to immersion. | |
| The Intervention does not meet the inclusion criteria for this review, as 3 interventions were compared (1) ISWs, (2) transcutaneous electrical nerve stimulation and (3) standard care that included back massage, and all has access to a whirlpool bath and liberal mobilisation, and therefore is not specifically about water immersion. | |
| The intervention is inappropriate being a 20‐minute shower, not immersion in water during first stage of labour. | |
| Inadequate description of the pool to confirm immersion. The only outcome provided is cervical dilation between 2 time points, which is a subjective measurement by the caregiver, of a non linear outcome. No data were provided on length of labour, which is outcome used within this review. No other outcome was provided, despite direct request for non published data to authors. | |
| The design description indicated this as a cohort study not a randomised trial. |
ISW: intracutaneous sterile water injection
Characteristics of ongoing studies [ordered by study ID]
| Trial name or title | Effect of water immersion during the first stage of labour on pain and the outcome of labour of primipara women attending to Khaleej‐e‐ fars hospital in Bandar Abbas |
| Methods | Clinical trial with 2 arms |
| Participants | Nulliparous women; age 35‐18 years; height over 150 cm; BMI 18.5‐24.9; singleton pregnancy; gestational age 37‐40; participation in preparation for childbirth classes; vertex presentation; alive fetus; not having risk factors (abnormal vital signs of mother‐ of mother underlying disease‐ prolonged rupture of membrane‐ vaginal bleeding, oligo‐ or polyhydramnios‐ placenta previa‐ placental abruption‐ meconium‐stained‐ intrauterine growth restriction‐ fetal macrosomia‐ abnormal fetus‐ history of infertility); regular uterine contractions; 4 cm cervical dilatation; Normal NST |
| Interventions | Immersion during the active phase of first stage of labour in a tub full of water at the appropriate temperature, for all of the first stage of labour |
| Outcomes | Labour pian intensity, duration of first stage of labour, duration of second stage of labour, perineal status, newborn Apgar score |
| Starting date | November 2015 |
| Contact information | Fatemeh Dabiri, Shahid Beheshti University of Medical Sciences |
| Notes | No outcome data published or provided at time of this review |
BMI: body mass index
NST: non‐stress test
Data and analyses
| Outcome or subgroup title | No. of studies | No. of participants | Statistical method | Effect size |
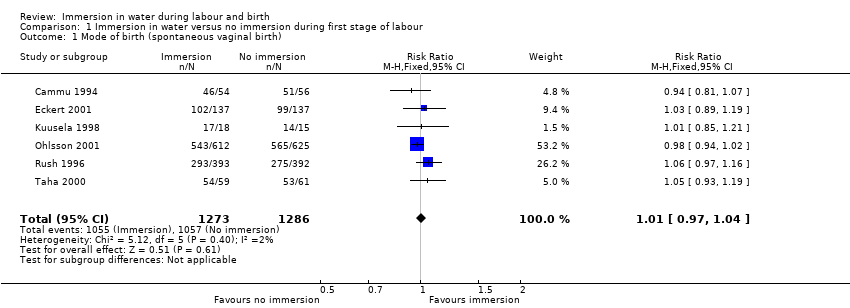
| 1 Mode of birth (spontaneous vaginal birth) Show forest plot | 6 | 2559 | Risk Ratio (M‐H, Fixed, 95% CI) | 1.01 [0.97, 1.04] |
| Analysis 1.1  Comparison 1 Immersion in water versus no immersion during first stage of labour, Outcome 1 Mode of birth (spontaneous vaginal birth). | ||||
| 2 Mode of birth (instrumental vaginal births) Show forest plot | 6 | 2559 | Risk Ratio (M‐H, Fixed, 95% CI) | 0.86 [0.70, 1.05] |
| Analysis 1.2  Comparison 1 Immersion in water versus no immersion during first stage of labour, Outcome 2 Mode of birth (instrumental vaginal births). | ||||
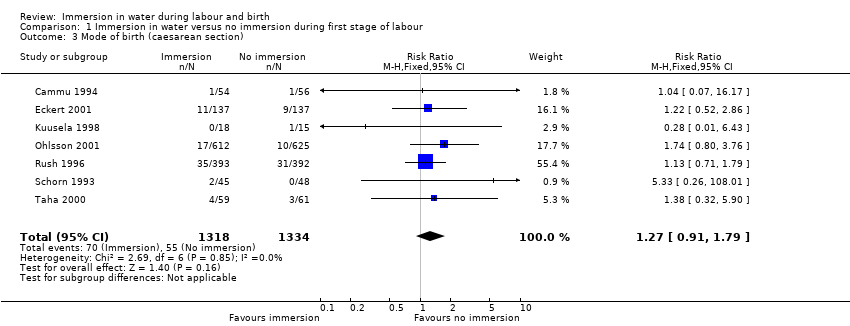
| 3 Mode of birth (caesarean section) Show forest plot | 7 | 2652 | Risk Ratio (M‐H, Fixed, 95% CI) | 1.27 [0.91, 1.79] |
| Analysis 1.3  Comparison 1 Immersion in water versus no immersion during first stage of labour, Outcome 3 Mode of birth (caesarean section). | ||||
| 4 Use of analgesia (regional) Show forest plot | 5 | 2439 | Risk Ratio (M‐H, Fixed, 95% CI) | 0.91 [0.83, 0.99] |
| Analysis 1.4 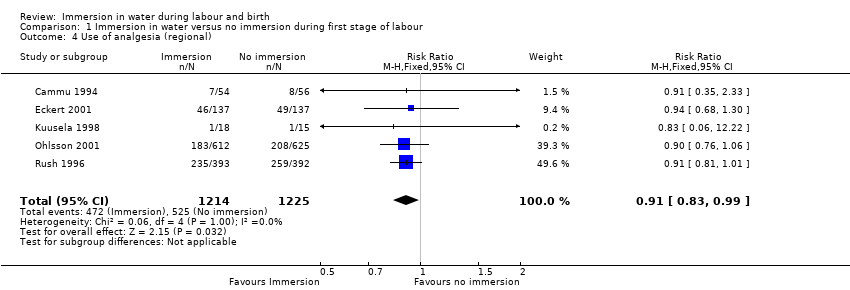 Comparison 1 Immersion in water versus no immersion during first stage of labour, Outcome 4 Use of analgesia (regional). | ||||
| 5 Perineal trauma (third‐ or fourth‐degree tears) Show forest plot | 4 | 2341 | Risk Ratio (M‐H, Fixed, 95% CI) | 1.36 [0.85, 2.18] |
| Analysis 1.5 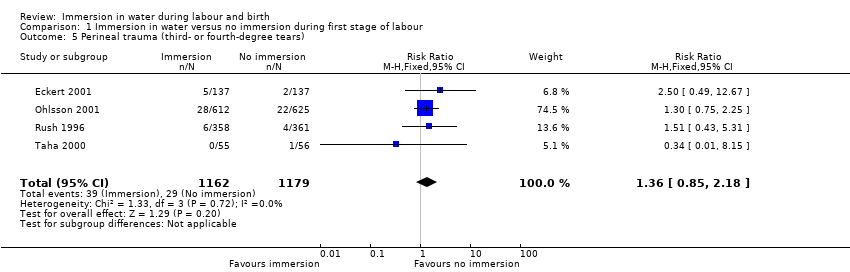 Comparison 1 Immersion in water versus no immersion during first stage of labour, Outcome 5 Perineal trauma (third‐ or fourth‐degree tears). | ||||
| 6 Admission to neonatal intensive care unit Show forest plot | 2 | 1511 | Risk Ratio (M‐H, Random, 95% CI) | 1.30 [0.42, 3.97] |
| Analysis 1.6 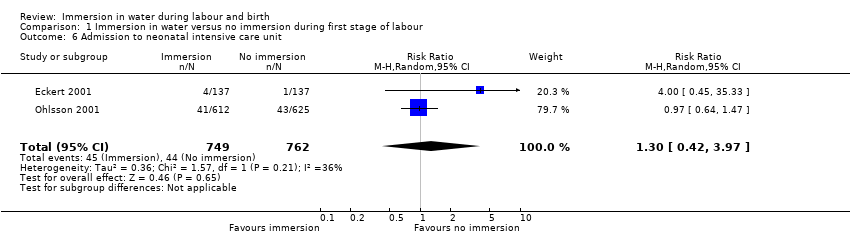 Comparison 1 Immersion in water versus no immersion during first stage of labour, Outcome 6 Admission to neonatal intensive care unit. | ||||
| 7 Neonatal infection Show forest plot | 5 | 1295 | Risk Ratio (M‐H, Fixed, 95% CI) | 2.00 [0.50, 7.94] |
| Analysis 1.7 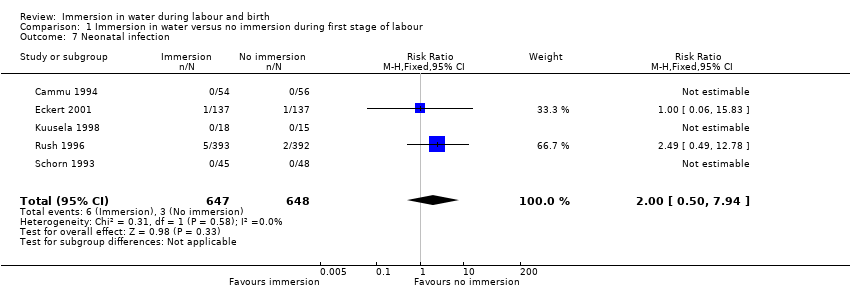 Comparison 1 Immersion in water versus no immersion during first stage of labour, Outcome 7 Neonatal infection. | ||||
| 8 Neonate temperature Show forest plot | 1 | Risk Ratio (M‐H, Fixed, 95% CI) | Subtotals only | |
| Analysis 1.8 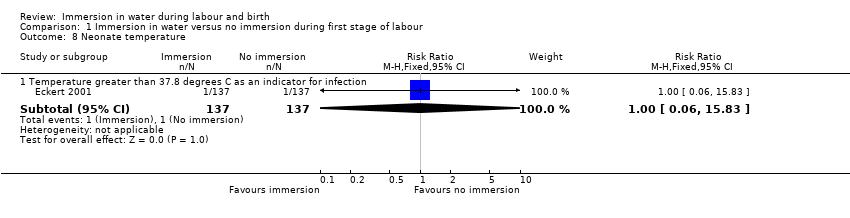 Comparison 1 Immersion in water versus no immersion during first stage of labour, Outcome 8 Neonate temperature. | ||||
| 8.1 Temperature greater than 37.8 degrees C as an indicator for infection | 1 | 274 | Risk Ratio (M‐H, Fixed, 95% CI) | 1.0 [0.06, 15.83] |
| 9 Estimated blood loss (mL) Show forest plot | 2 | 153 | Mean Difference (IV, Fixed, 95% CI) | ‐14.33 [‐63.03, 34.37] |
| Analysis 1.9  Comparison 1 Immersion in water versus no immersion during first stage of labour, Outcome 9 Estimated blood loss (mL). | ||||
| 10 Postpartum haemorrhage Show forest plot | 1 | 274 | Risk Ratio (M‐H, Fixed, 95% CI) | 1.58 [0.80, 3.13] |
| Analysis 1.10  Comparison 1 Immersion in water versus no immersion during first stage of labour, Outcome 10 Postpartum haemorrhage. | ||||
| 11 Use of analgesia (pharmacological ‐ pethidine/narcotic) Show forest plot | 3 | 1180 | Risk Ratio (M‐H, Random, 95% CI) | 1.08 [0.59, 1.96] |
| Analysis 1.11 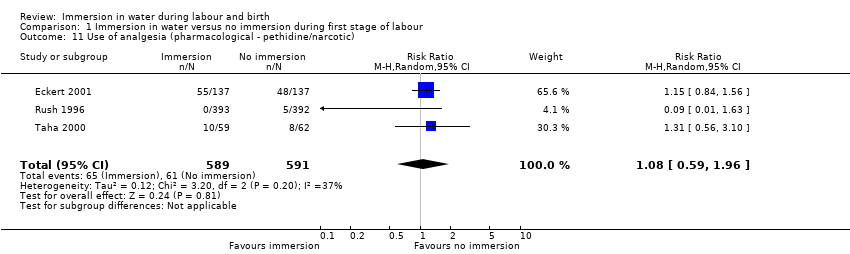 Comparison 1 Immersion in water versus no immersion during first stage of labour, Outcome 11 Use of analgesia (pharmacological ‐ pethidine/narcotic). | ||||
| 12 Use of any analgesia Show forest plot | 3 | 487 | Risk Ratio (M‐H, Fixed, 95% CI) | 0.99 [0.88, 1.12] |
| Analysis 1.12 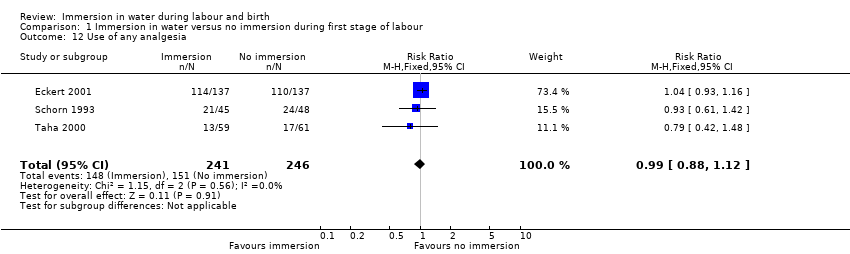 Comparison 1 Immersion in water versus no immersion during first stage of labour, Outcome 12 Use of any analgesia. | ||||
| 13 Use of analgesia (pharmacological ‐ any) Show forest plot | 2 | 394 | Risk Ratio (M‐H, Fixed, 95% CI) | 1.05 [0.80, 1.39] |
| Analysis 1.13 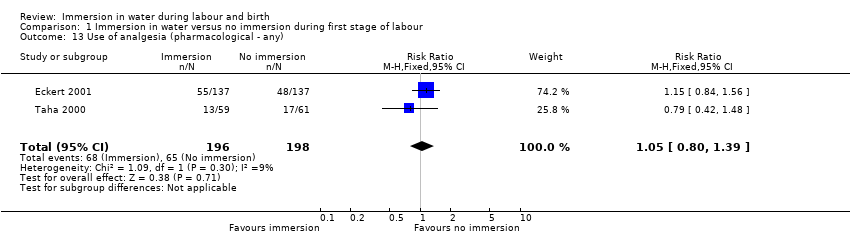 Comparison 1 Immersion in water versus no immersion during first stage of labour, Outcome 13 Use of analgesia (pharmacological ‐ any). | ||||
| 14 Maternal infection during labour/postnatal period (perineal, systemic, uterine or increase in temperature) Show forest plot | 5 | 1295 | Risk Ratio (M‐H, Fixed, 95% CI) | 0.99 [0.50, 1.96] |
| Analysis 1.14  Comparison 1 Immersion in water versus no immersion during first stage of labour, Outcome 14 Maternal infection during labour/postnatal period (perineal, systemic, uterine or increase in temperature). | ||||
| 15 Artificial rupture of membranes Show forest plot | 3 | 926 | Risk Ratio (M‐H, Fixed, 95% CI) | 1.02 [0.90, 1.16] |
| Analysis 1.15  Comparison 1 Immersion in water versus no immersion during first stage of labour, Outcome 15 Artificial rupture of membranes. | ||||
| 16 Use of oxytocin for augmentation of labour Show forest plot | 4 | 1019 | Risk Ratio (M‐H, Fixed, 95% CI) | 0.91 [0.72, 1.15] |
| Analysis 1.16  Comparison 1 Immersion in water versus no immersion during first stage of labour, Outcome 16 Use of oxytocin for augmentation of labour. | ||||
| 17 Use of non‐pharmacological analgesia (transcutaneous nerve stimulation (TENS) Show forest plot | 1 | 785 | Risk Ratio (M‐H, Fixed, 95% CI) | 1.25 [0.34, 4.61] |
| Analysis 1.17  Comparison 1 Immersion in water versus no immersion during first stage of labour, Outcome 17 Use of non‐pharmacological analgesia (transcutaneous nerve stimulation (TENS). | ||||
| 18 Duration of first stage (minutes) Show forest plot | 5 | 1295 | Mean Difference (IV, Fixed, 95% CI) | ‐11.53 [‐45.42, 22.36] |
| Analysis 1.18 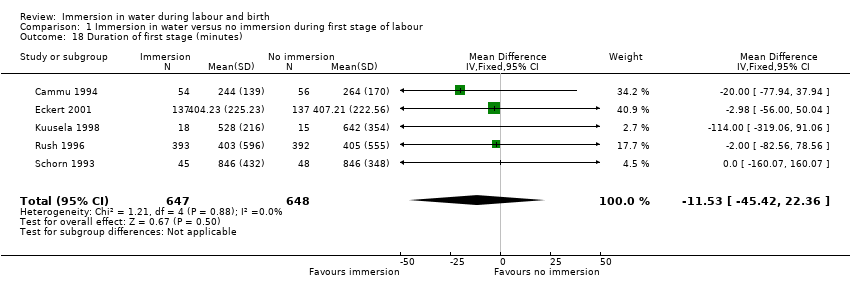 Comparison 1 Immersion in water versus no immersion during first stage of labour, Outcome 18 Duration of first stage (minutes). | ||||
| 19 Duration of second stage (minutes) Show forest plot | 6 | 1403 | Mean Difference (IV, Random, 95% CI) | 1.12 [‐5.23, 7.48] |
| Analysis 1.19  Comparison 1 Immersion in water versus no immersion during first stage of labour, Outcome 19 Duration of second stage (minutes). | ||||
| 20 Duration of third stage (minutes) Show forest plot | 2 | 1059 | Mean Difference (IV, Fixed, 95% CI) | 0.25 [‐1.10, 1.60] |
| Analysis 1.20  Comparison 1 Immersion in water versus no immersion during first stage of labour, Outcome 20 Duration of third stage (minutes). | ||||
| 21 Duration of total labour (all three stages minutes) Show forest plot | 1 | 120 | Mean Difference (IV, Fixed, 95% CI) | ‐27.5 [‐133.05, 78.05] |
| Analysis 1.21 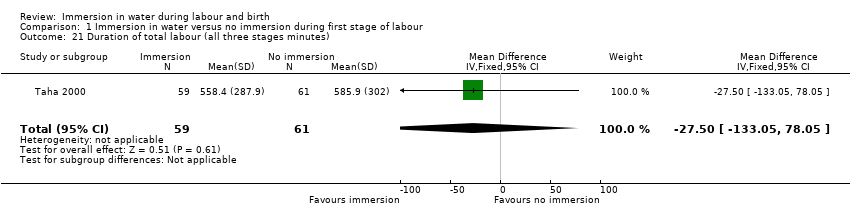 Comparison 1 Immersion in water versus no immersion during first stage of labour, Outcome 21 Duration of total labour (all three stages minutes). | ||||
| 22 Perineal trauma (intact) Show forest plot | 4 | 1277 | Risk Ratio (M‐H, Fixed, 95% CI) | 1.17 [1.01, 1.37] |
| Analysis 1.22  Comparison 1 Immersion in water versus no immersion during first stage of labour, Outcome 22 Perineal trauma (intact). | ||||
| 23 Perineal trauma (second‐degree tears) Show forest plot | 4 | 1212 | Risk Ratio (M‐H, Fixed, 95% CI) | 0.94 [0.74, 1.20] |
| Analysis 1.23 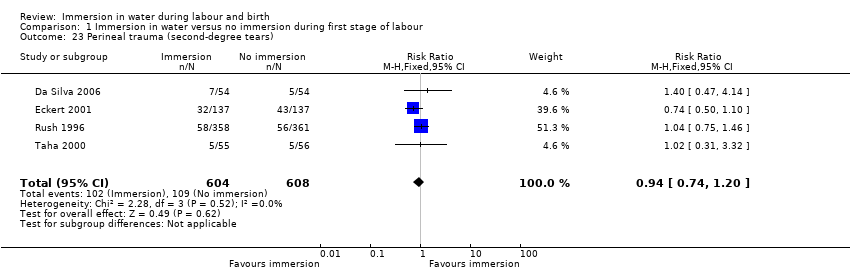 Comparison 1 Immersion in water versus no immersion during first stage of labour, Outcome 23 Perineal trauma (second‐degree tears). | ||||
| 24 Perineal trauma (episiotomy) Show forest plot | 4 | 1212 | Risk Ratio (M‐H, Fixed, 95% CI) | 0.94 [0.80, 1.09] |
| Analysis 1.24 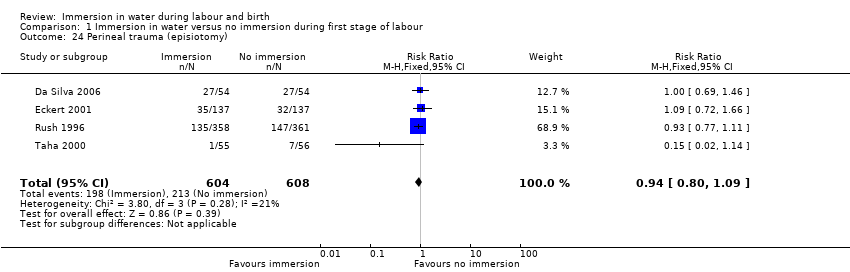 Comparison 1 Immersion in water versus no immersion during first stage of labour, Outcome 24 Perineal trauma (episiotomy). | ||||
| 25 Self reports pain score on visual analogue scale of 0‐10 Show forest plot | 2 | Mean Difference (IV, Random, 95% CI) | Subtotals only | |
| Analysis 1.25  Comparison 1 Immersion in water versus no immersion during first stage of labour, Outcome 25 Self reports pain score on visual analogue scale of 0‐10. | ||||
| 25.1 Pain score at start of assessment period (time zero) | 2 | 141 | Mean Difference (IV, Random, 95% CI) | 0.15 [‐0.79, 1.08] |
| 25.2 Pain score up to 60 minutes later | 2 | 141 | Mean Difference (IV, Random, 95% CI) | ‐0.81 [‐1.34, ‐0.28] |
| 26 Pain intensity (experience of moderate to severe pain) Show forest plot | 1 | Risk Ratio (M‐H, Fixed, 95% CI) | Subtotals only | |
| Analysis 1.26  Comparison 1 Immersion in water versus no immersion during first stage of labour, Outcome 26 Pain intensity (experience of moderate to severe pain). | ||||
| 26.1 Ordinal description as moderate to severe, 30 mins after randomisation | 1 | 120 | Risk Ratio (M‐H, Fixed, 95% CI) | 0.75 [0.62, 0.91] |
| 26.2 VAS scale 8 to 10, 30 mins after randomisation | 1 | 120 | Risk Ratio (M‐H, Fixed, 95% CI) | 0.72 [0.58, 0.90] |
| 26.3 Ordinal scale pain faces 4 to 5, 30 mins after randomisation | 1 | 120 | Risk Ratio (M‐H, Fixed, 95% CI) | 0.67 [0.51, 0.90] |
| 26.4 Ordinal description as moderate to severe, 1 hr after randomisation | 1 | 117 | Risk Ratio (M‐H, Fixed, 95% CI) | 0.76 [0.63, 0.91] |
| 26.5 VAS scale 8 to 10, 1 hr after randomisation | 1 | 117 | Risk Ratio (M‐H, Fixed, 95% CI) | 1.21 [0.69, 2.11] |
| 26.6 Ordinal scale pain faces 4 to 5, 1 hr after randomisation | 1 | 117 | Risk Ratio (M‐H, Fixed, 95% CI) | 0.68 [0.53, 0.86] |
| 26.7 Ordinal description as moderate to severe, 2 hrs after randomisation | 1 | 57 | Risk Ratio (M‐H, Fixed, 95% CI) | 0.76 [0.59, 0.98] |
| 26.8 VAS scale 8 to 10, 2 hrs after randomisation | 1 | 57 | Risk Ratio (M‐H, Fixed, 95% CI) | 0.83 [0.66, 1.05] |
| 26.9 Ordinal scale pain faces 4 to 5, 2 hrs after randomisation | 1 | 57 | Risk Ratio (M‐H, Fixed, 95% CI) | 0.72 [0.52, 0.98] |
| 26.10 Ordinal description as moderate to severe, 3 hrs after randomisation | 1 | 32 | Risk Ratio (M‐H, Fixed, 95% CI) | 0.52 [0.23, 1.16] |
| 26.11 VAS scale 8 to 10, 3 hrs after randomisation | 1 | 32 | Risk Ratio (M‐H, Fixed, 95% CI) | 0.69 [0.39, 1.23] |
| 26.12 Ordinal scale pain faces 4 to 5, 3 hrs after randomisation | 1 | 32 | Risk Ratio (M‐H, Fixed, 95% CI) | 0.57 [0.25, 1.27] |
| 26.13 Ordinal description as moderate to severe, 24 hrs after randomisation | 1 | 119 | Risk Ratio (M‐H, Fixed, 95% CI) | 0.64 [0.50, 0.82] |
| 26.14 VAS scale 8 to 10, 24 hrs after randomisation | 1 | 119 | Risk Ratio (M‐H, Fixed, 95% CI) | 0.62 [0.49, 0.80] |
| 26.15 Ordinal scale pain faces 4 to 5, 24 hrs after randomisation | 1 | 119 | Risk Ratio (M‐H, Fixed, 95% CI) | 0.69 [0.54, 0.87] |
| 27 Systolic blood pressure Show forest plot | 1 | 120 | Mean Difference (IV, Fixed, 95% CI) | ‐7.20 [‐13.12, ‐1.28] |
| Analysis 1.27  Comparison 1 Immersion in water versus no immersion during first stage of labour, Outcome 27 Systolic blood pressure. | ||||
| 28 Diastolic blood pressure Show forest plot | 1 | 120 | Mean Difference (IV, Fixed, 95% CI) | ‐10.20 [‐13.70, ‐6.70] |
| Analysis 1.28 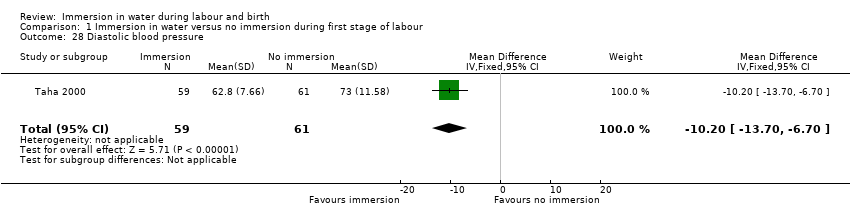 Comparison 1 Immersion in water versus no immersion during first stage of labour, Outcome 28 Diastolic blood pressure. | ||||
| 29 Mean arterial blood pressure Show forest plot | 1 | 120 | Mean Difference (IV, Fixed, 95% CI) | ‐10.5 [‐14.68, ‐6.32] |
| Analysis 1.29  Comparison 1 Immersion in water versus no immersion during first stage of labour, Outcome 29 Mean arterial blood pressure. | ||||
| 30 Preference for care in subsequent labour (Does not wish to use bath with next labour/birth) Show forest plot | 1 | 119 | Risk Ratio (M‐H, Fixed, 95% CI) | 0.38 [0.14, 0.98] |
| Analysis 1.30 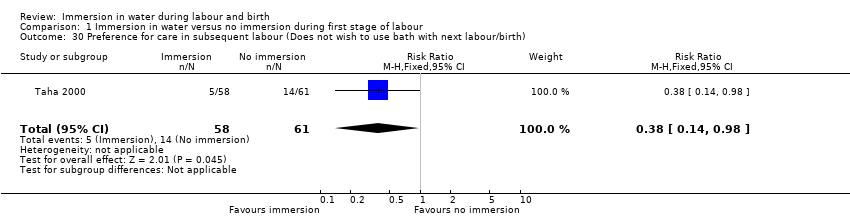 Comparison 1 Immersion in water versus no immersion during first stage of labour, Outcome 30 Preference for care in subsequent labour (Does not wish to use bath with next labour/birth). | ||||
| 31 Postpartum depression (EPDS more than 11) Show forest plot | 2 | 370 | Risk Ratio (M‐H, Fixed, 95% CI) | 1.38 [0.85, 2.24] |
| Analysis 1.31  Comparison 1 Immersion in water versus no immersion during first stage of labour, Outcome 31 Postpartum depression (EPDS more than 11). | ||||
| 32 Abnormal fetal heart rate patterns Show forest plot | 3 | 487 | Risk Ratio (M‐H, Random, 95% CI) | 0.75 [0.34, 1.67] |
| Analysis 1.32 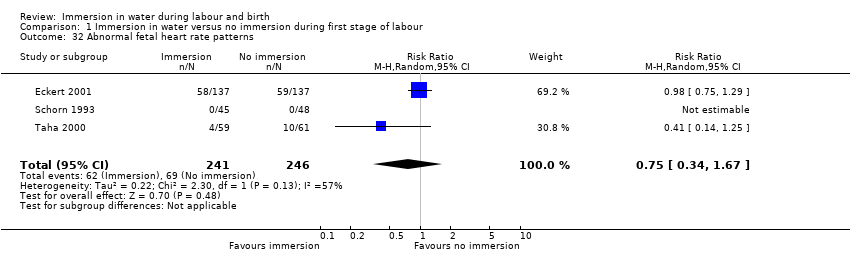 Comparison 1 Immersion in water versus no immersion during first stage of labour, Outcome 32 Abnormal fetal heart rate patterns. | ||||
| 33 Presence of meconium‐stained liquor Show forest plot | 4 | 1200 | Risk Ratio (M‐H, Random, 95% CI) | 0.92 [0.64, 1.33] |
| Analysis 1.33  Comparison 1 Immersion in water versus no immersion during first stage of labour, Outcome 33 Presence of meconium‐stained liquor. | ||||
| 34 Apgar score less than seven at five minutes Show forest plot | 5 | 1834 | Risk Ratio (M‐H, Fixed, 95% CI) | 1.58 [0.63, 3.93] |
| Analysis 1.34  Comparison 1 Immersion in water versus no immersion during first stage of labour, Outcome 34 Apgar score less than seven at five minutes. | ||||
| 35 Apgar score at five minutes Show forest plot | 2 | 893 | Mean Difference (IV, Fixed, 95% CI) | ‐0.03 [‐0.11, 0.06] |
| Analysis 1.35  Comparison 1 Immersion in water versus no immersion during first stage of labour, Outcome 35 Apgar score at five minutes. | ||||
| 36 Umbilical artery pH less than 7.20 Show forest plot | 1 | 110 | Risk Ratio (M‐H, Fixed, 95% CI) | 5.18 [0.25, 105.51] |
| Analysis 1.36 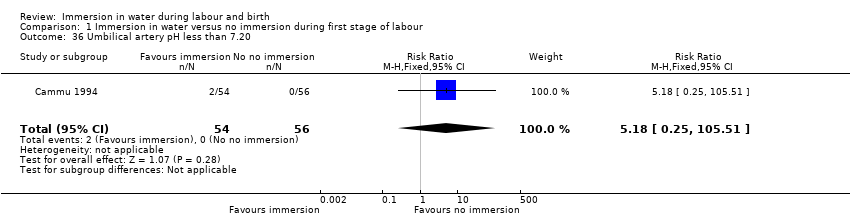 Comparison 1 Immersion in water versus no immersion during first stage of labour, Outcome 36 Umbilical artery pH less than 7.20. | ||||
| 37 Breastfeeding ‐ not breastfeeding after six weeks post birth Show forest plot | 2 | 363 | Risk Ratio (M‐H, Fixed, 95% CI) | 1.17 [0.64, 2.15] |
| Analysis 1.37 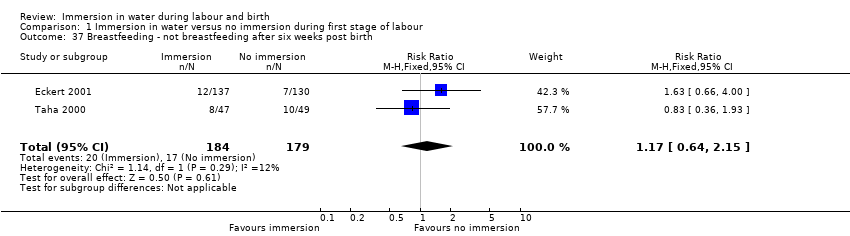 Comparison 1 Immersion in water versus no immersion during first stage of labour, Outcome 37 Breastfeeding ‐ not breastfeeding after six weeks post birth. | ||||
| Outcome or subgroup title | No. of studies | No. of participants | Statistical method | Effect size |
| 1 Mode of birth (spontaneous vaginal birth) Show forest plot | 1 | 120 | Risk Ratio (M‐H, Fixed, 95% CI) | 1.02 [0.96, 1.08] |
| Analysis 2.1  Comparison 2 Immersion in water versus no immersion during second stage of labour, Outcome 1 Mode of birth (spontaneous vaginal birth). | ||||
| 2 Mode of birth (instrumental vaginal births) Show forest plot | 1 | 120 | Risk Ratio (M‐H, Fixed, 95% CI) | 1.0 [0.06, 15.62] |
| Analysis 2.2  Comparison 2 Immersion in water versus no immersion during second stage of labour, Outcome 2 Mode of birth (instrumental vaginal births). | ||||
| 3 Mode of birth (caesarean section) Show forest plot | 1 | 120 | Risk Ratio (M‐H, Fixed, 95% CI) | 0.33 [0.01, 8.02] |
| Analysis 2.3  Comparison 2 Immersion in water versus no immersion during second stage of labour, Outcome 3 Mode of birth (caesarean section). | ||||
| 4 Perinatal deaths Show forest plot | 1 | 120 | Risk Ratio (M‐H, Fixed, 95% CI) | 3.0 [0.12, 72.20] |
| Analysis 2.4  Comparison 2 Immersion in water versus no immersion during second stage of labour, Outcome 4 Perinatal deaths. | ||||
| 5 Admission to neonatal intensive care unit Show forest plot | 2 | 291 | Risk Ratio (M‐H, Fixed, 95% CI) | 0.78 [0.38, 1.59] |
| Analysis 2.5  Comparison 2 Immersion in water versus no immersion during second stage of labour, Outcome 5 Admission to neonatal intensive care unit. | ||||
| 6 Neonate temperature Show forest plot | 1 | Risk Ratio (M‐H, Fixed, 95% CI) | Subtotals only | |
| Analysis 2.6  Comparison 2 Immersion in water versus no immersion during second stage of labour, Outcome 6 Neonate temperature. | ||||
| 6.1 Temperature less than 36.2 degrees C at birth | 1 | 109 | Risk Ratio (M‐H, Fixed, 95% CI) | 0.98 [0.30, 3.20] |
| 6.2 Temperature greater than 37.5 degrees C at birth | 1 | 109 | Risk Ratio (M‐H, Fixed, 95% CI) | 2.62 [0.73, 9.35] |
| 7 Fever reported in first week Show forest plot | 1 | 171 | Risk Ratio (M‐H, Fixed, 95% CI) | 0.53 [0.10, 2.82] |
| Analysis 2.7  Comparison 2 Immersion in water versus no immersion during second stage of labour, Outcome 7 Fever reported in first week. | ||||
| 8 Postpartum haemorrhage more than 500 mL Show forest plot | 1 | 120 | Risk Ratio (M‐H, Fixed, 95% CI) | 0.14 [0.01, 2.71] |
| Analysis 2.8  Comparison 2 Immersion in water versus no immersion during second stage of labour, Outcome 8 Postpartum haemorrhage more than 500 mL. | ||||
| 9 Duration of second stage (minutes) Show forest plot | 2 | 291 | Mean Difference (IV, Fixed, 95% CI) | ‐1.83 [‐8.18, 4.52] |
| Analysis 2.9  Comparison 2 Immersion in water versus no immersion during second stage of labour, Outcome 9 Duration of second stage (minutes). | ||||
| 10 Perineal trauma (episiotomy) Show forest plot | 1 | 119 | Risk Ratio (M‐H, Fixed, 95% CI) | 0.74 [0.17, 3.15] |
| Analysis 2.10 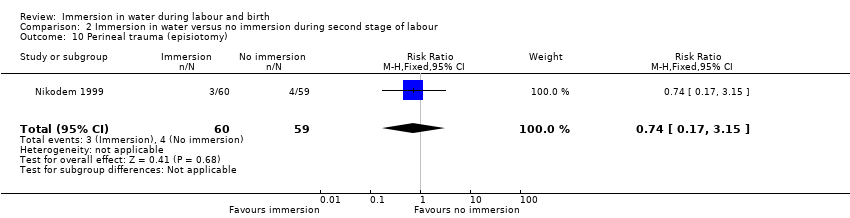 Comparison 2 Immersion in water versus no immersion during second stage of labour, Outcome 10 Perineal trauma (episiotomy). | ||||
| 11 Perineal trauma (second degree tear) Show forest plot | 1 | 119 | Risk Ratio (M‐H, Fixed, 95% CI) | 1.16 [0.57, 2.38] |
| Analysis 2.11  Comparison 2 Immersion in water versus no immersion during second stage of labour, Outcome 11 Perineal trauma (second degree tear). | ||||
| 12 Experience of moderate to severe pain Show forest plot | 1 | 117 | Risk Ratio (M‐H, Fixed, 95% CI) | 1.06 [0.73, 1.53] |
| Analysis 2.12  Comparison 2 Immersion in water versus no immersion during second stage of labour, Outcome 12 Experience of moderate to severe pain. | ||||
| 12.1 Ordinal description as moderate to severe | 1 | 117 | Risk Ratio (M‐H, Fixed, 95% CI) | 1.06 [0.73, 1.53] |
| 13 Preference for care in subsequent labour (Does not wish to use bath next birth) Show forest plot | 1 | 117 | Risk Ratio (M‐H, Fixed, 95% CI) | 0.57 [0.22, 1.47] |
| Analysis 2.13  Comparison 2 Immersion in water versus no immersion during second stage of labour, Outcome 13 Preference for care in subsequent labour (Does not wish to use bath next birth). | ||||
| 14 Satisfied with labour Show forest plot | 1 | 117 | Risk Ratio (M‐H, Fixed, 95% CI) | 0.24 [0.07, 0.80] |
| Analysis 2.14  Comparison 2 Immersion in water versus no immersion during second stage of labour, Outcome 14 Satisfied with labour. | ||||
| 14.1 Little or not satisfied with coping experience | 1 | 117 | Risk Ratio (M‐H, Fixed, 95% CI) | 0.24 [0.07, 0.80] |
| 15 Presence of meconium‐stained liquor Show forest plot | 1 | 120 | Risk Ratio (M‐H, Fixed, 95% CI) | 1.4 [0.47, 4.17] |
| Analysis 2.15  Comparison 2 Immersion in water versus no immersion during second stage of labour, Outcome 15 Presence of meconium‐stained liquor. | ||||
| 16 Apgar score less than seven (five minutes) Show forest plot | 1 | 119 | Risk Ratio (M‐H, Fixed, 95% CI) | 4.92 [0.24, 100.31] |
| Analysis 2.16  Comparison 2 Immersion in water versus no immersion during second stage of labour, Outcome 16 Apgar score less than seven (five minutes). | ||||
| 17 Mean Apgar at five minutes Show forest plot | 1 | 171 | Mean Difference (IV, Fixed, 95% CI) | ‐0.10 [‐0.22, 0.02] |
| Analysis 2.17  Comparison 2 Immersion in water versus no immersion during second stage of labour, Outcome 17 Mean Apgar at five minutes. | ||||
| 18 Umbilical artery pH less than 7.20 Show forest plot | 1 | 116 | Risk Ratio (M‐H, Fixed, 95% CI) | 0.89 [0.45, 1.75] |
| Analysis 2.18  Comparison 2 Immersion in water versus no immersion during second stage of labour, Outcome 18 Umbilical artery pH less than 7.20. | ||||
| Outcome or subgroup title | No. of studies | No. of participants | Statistical method | Effect size |
| 1 Mode of birth (spontaneous vaginal birth) Show forest plot | 9 | 2845 | Risk Ratio (M‐H, Random, 95% CI) | 1.03 [0.99, 1.09] |
| Analysis 3.1  Comparison 3 Immersion in water versus no immersion during any stage of labour, Outcome 1 Mode of birth (spontaneous vaginal birth). | ||||
| 2 Mode of birth (instrumental vaginal births) Show forest plot | 8 | 2739 | Risk Ratio (M‐H, Fixed, 95% CI) | 0.86 [0.70, 1.04] |
| Analysis 3.2  Comparison 3 Immersion in water versus no immersion during any stage of labour, Outcome 2 Mode of birth (instrumental vaginal births). | ||||
| 3 Mode of birth (caesarean section) Show forest plot | 9 | 2832 | Risk Ratio (M‐H, Fixed, 95% CI) | 1.19 [0.86, 1.65] |
| Analysis 3.3 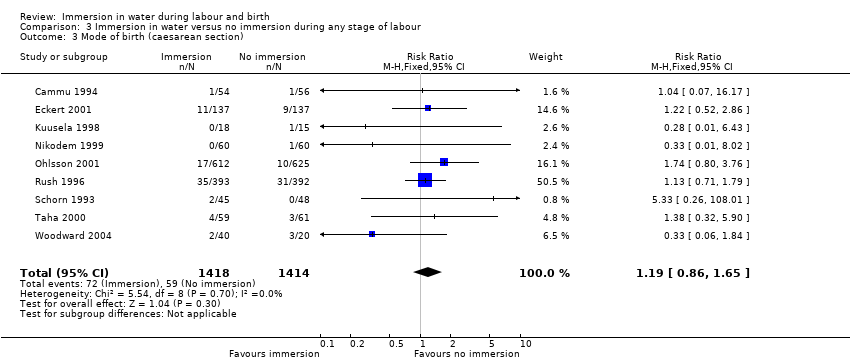 Comparison 3 Immersion in water versus no immersion during any stage of labour, Outcome 3 Mode of birth (caesarean section). | ||||
| 4 Use of analgesia (regional) Show forest plot | 6 | 2499 | Risk Ratio (M‐H, Fixed, 95% CI) | 0.90 [0.82, 0.98] |
| Analysis 3.4 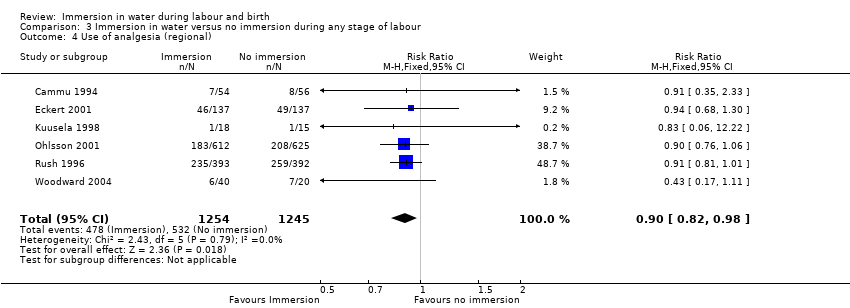 Comparison 3 Immersion in water versus no immersion during any stage of labour, Outcome 4 Use of analgesia (regional). | ||||
| 5 Perineal trauma (third‐ or fourth‐degree tears) Show forest plot | 5 | 2401 | Risk Ratio (M‐H, Fixed, 95% CI) | 1.37 [0.86, 2.17] |
| Analysis 3.5  Comparison 3 Immersion in water versus no immersion during any stage of labour, Outcome 5 Perineal trauma (third‐ or fourth‐degree tears). | ||||
| 6 Perinatal deaths Show forest plot | 1 | 120 | Risk Ratio (M‐H, Fixed, 95% CI) | 3.0 [0.12, 72.20] |
| Analysis 3.6 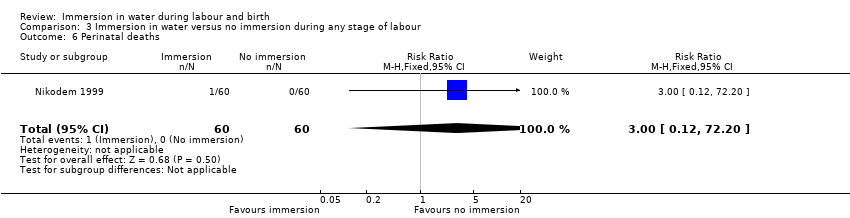 Comparison 3 Immersion in water versus no immersion during any stage of labour, Outcome 6 Perinatal deaths. | ||||
| 7 Admission to neonatal intensive care unit Show forest plot | 5 | 1862 | Risk Ratio (M‐H, Fixed, 95% CI) | 0.99 [0.70, 1.39] |
| Analysis 3.7  Comparison 3 Immersion in water versus no immersion during any stage of labour, Outcome 7 Admission to neonatal intensive care unit. | ||||
| 8 Neonatal infection Show forest plot | 5 | 1295 | Risk Ratio (M‐H, Fixed, 95% CI) | 2.00 [0.50, 7.94] |
| Analysis 3.8  Comparison 3 Immersion in water versus no immersion during any stage of labour, Outcome 8 Neonatal infection. | ||||
| 9 Neonate temperature Show forest plot | 2 | Risk Ratio (M‐H, Fixed, 95% CI) | Subtotals only | |
| Analysis 3.9  Comparison 3 Immersion in water versus no immersion during any stage of labour, Outcome 9 Neonate temperature. | ||||
| 9.1 Temperature greater than 37.8 degrees C as an indicator for infection | 1 | 274 | Risk Ratio (M‐H, Fixed, 95% CI) | 1.0 [0.06, 15.83] |
| 9.2 Temperature less than 36.2 degrees C at birth | 1 | 109 | Risk Ratio (M‐H, Fixed, 95% CI) | 0.98 [0.30, 3.20] |
| 9.3 Temperature greater than 37.5 degrees C at birth | 1 | 109 | Risk Ratio (M‐H, Fixed, 95% CI) | 2.62 [0.73, 9.35] |
| 10 Fever reported in first week Show forest plot | 1 | 171 | Risk Ratio (M‐H, Fixed, 95% CI) | 0.53 [0.10, 2.82] |
| Analysis 3.10  Comparison 3 Immersion in water versus no immersion during any stage of labour, Outcome 10 Fever reported in first week. | ||||
| 11 Antibiotics given to neonate Show forest plot | 1 | 60 | Risk Ratio (M‐H, Fixed, 95% CI) | 1.5 [0.17, 13.52] |
| Analysis 3.11  Comparison 3 Immersion in water versus no immersion during any stage of labour, Outcome 11 Antibiotics given to neonate. | ||||
| 12 Estimated blood loss (mL) Show forest plot | 3 | 273 | Mean Difference (IV, Fixed, 95% CI) | ‐6.28 [‐13.67, 1.11] |
| Analysis 3.12  Comparison 3 Immersion in water versus no immersion during any stage of labour, Outcome 12 Estimated blood loss (mL). | ||||
| 13 Postpartum haemorrhage Show forest plot | 2 | 394 | Risk Ratio (M‐H, Random, 95% CI) | 0.73 [0.08, 6.90] |
| Analysis 3.13  Comparison 3 Immersion in water versus no immersion during any stage of labour, Outcome 13 Postpartum haemorrhage. | ||||
| 14 Use of analgesia (pharmacological ‐ pethidine/narcotic) Show forest plot | 4 | 1240 | Risk Ratio (M‐H, Random, 95% CI) | 0.85 [0.46, 1.56] |
| Analysis 3.14  Comparison 3 Immersion in water versus no immersion during any stage of labour, Outcome 14 Use of analgesia (pharmacological ‐ pethidine/narcotic). | ||||
| 15 Use of analgesia (pharmacological ‐ any) Show forest plot | 2 | 394 | Risk Ratio (M‐H, Fixed, 95% CI) | 1.05 [0.80, 1.39] |
| Analysis 3.15  Comparison 3 Immersion in water versus no immersion during any stage of labour, Outcome 15 Use of analgesia (pharmacological ‐ any). | ||||
| 16 Use of any analgesia Show forest plot | 5 | 653 | Risk Ratio (M‐H, Random, 95% CI) | 0.72 [0.46, 1.12] |
| Analysis 3.16  Comparison 3 Immersion in water versus no immersion during any stage of labour, Outcome 16 Use of any analgesia. | ||||
| 17 Maternal infection during labour/postnatal period (perineal, systemic, uterine or increase in temperature) Show forest plot | 5 | 1295 | Risk Ratio (M‐H, Fixed, 95% CI) | 0.99 [0.50, 1.96] |
| Analysis 3.17  Comparison 3 Immersion in water versus no immersion during any stage of labour, Outcome 17 Maternal infection during labour/postnatal period (perineal, systemic, uterine or increase in temperature). | ||||
| 18 Artificial rupture of membranes Show forest plot | 3 | 926 | Risk Ratio (M‐H, Fixed, 95% CI) | 1.02 [0.90, 1.16] |
| Analysis 3.18  Comparison 3 Immersion in water versus no immersion during any stage of labour, Outcome 18 Artificial rupture of membranes. | ||||
| 19 Use of oxytocin for augmentation of labour Show forest plot | 5 | 1125 | Risk Ratio (M‐H, Random, 95% CI) | 0.64 [0.32, 1.28] |
| Analysis 3.19 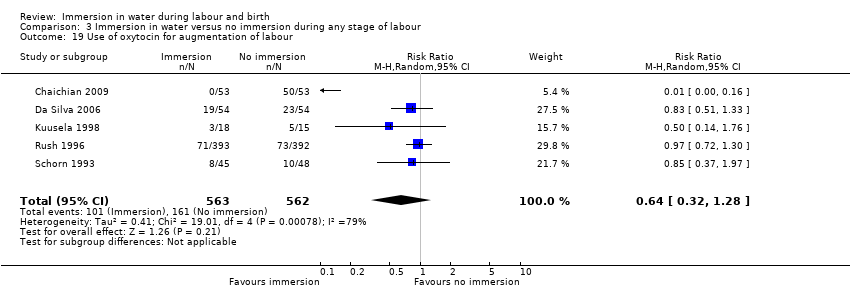 Comparison 3 Immersion in water versus no immersion during any stage of labour, Outcome 19 Use of oxytocin for augmentation of labour. | ||||
| 20 Use of non‐pharmacological analgesia (transcutaneous nerve stimulation (TENS)) Show forest plot | 2 | 845 | Risk Ratio (M‐H, Fixed, 95% CI) | 1.05 [0.37, 2.94] |
| Analysis 3.20  Comparison 3 Immersion in water versus no immersion during any stage of labour, Outcome 20 Use of non‐pharmacological analgesia (transcutaneous nerve stimulation (TENS)). | ||||
| 21 Duration of first stage (minutes) Show forest plot | 8 | 1561 | Mean Difference (IV, Random, 95% CI) | ‐42.21 [‐80.93, ‐3.49] |
| Analysis 3.21  Comparison 3 Immersion in water versus no immersion during any stage of labour, Outcome 21 Duration of first stage (minutes). | ||||
| 22 Duration of second stage (minutes) Show forest plot | 11 | 1960 | Mean Difference (IV, Random, 95% CI) | ‐2.85 [‐8.85, 3.16] |
| Analysis 3.22  Comparison 3 Immersion in water versus no immersion during any stage of labour, Outcome 22 Duration of second stage (minutes). | ||||
| 23 Duration of third stage (minutes) Show forest plot | 3 | 1165 | Mean Difference (IV, Random, 95% CI) | ‐0.52 [‐1.84, 0.79] |
| Analysis 3.23  Comparison 3 Immersion in water versus no immersion during any stage of labour, Outcome 23 Duration of third stage (minutes). | ||||
| 24 Duration of total labour (all three stages) Show forest plot | 2 | 240 | Mean Difference (IV, Fixed, 95% CI) | ‐40.83 [‐87.09, 5.43] |
| Analysis 3.24  Comparison 3 Immersion in water versus no immersion during any stage of labour, Outcome 24 Duration of total labour (all three stages). | ||||
| 25 Perineal trauma (none‐ intact) Show forest plot | 5 | 1337 | Risk Ratio (M‐H, Fixed, 95% CI) | 1.16 [0.99, 1.35] |
| Analysis 3.25  Comparison 3 Immersion in water versus no immersion during any stage of labour, Outcome 25 Perineal trauma (none‐ intact). | ||||
| 26 Perineal trauma (first‐ and second‐degree tears) Show forest plot | 7 | Risk Ratio (M‐H, Fixed, 95% CI) | Subtotals only | |
| Analysis 3.26  Comparison 3 Immersion in water versus no immersion during any stage of labour, Outcome 26 Perineal trauma (first‐ and second‐degree tears). | ||||
| 26.1 Second‐degree tear | 7 | 1525 | Risk Ratio (M‐H, Fixed, 95% CI) | 0.89 [0.71, 1.10] |
| 27 Perineal trauma (episiotomy) Show forest plot | 7 | 1511 | Risk Ratio (M‐H, Random, 95% CI) | 0.88 [0.67, 1.17] |
| Analysis 3.27  Comparison 3 Immersion in water versus no immersion during any stage of labour, Outcome 27 Perineal trauma (episiotomy). | ||||
| 28 Self reports pain score on visual analogue scale of 0‐10 Show forest plot | 3 | Mean Difference (IV, Random, 95% CI) | Subtotals only | |
| Analysis 3.28 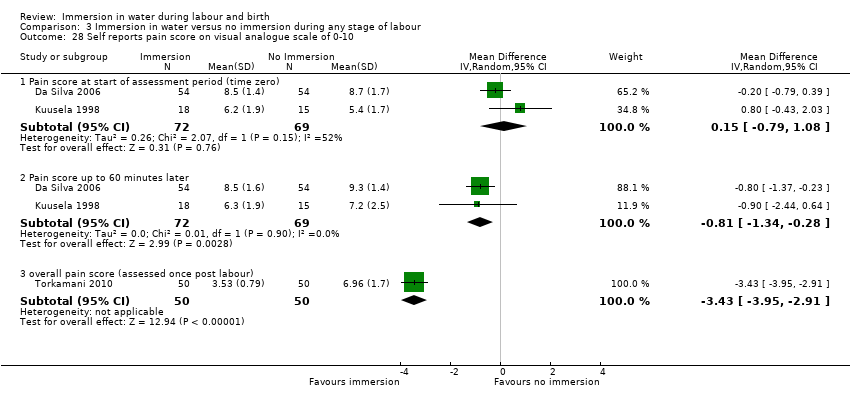 Comparison 3 Immersion in water versus no immersion during any stage of labour, Outcome 28 Self reports pain score on visual analogue scale of 0‐10. | ||||
| 28.1 Pain score at start of assessment period (time zero) | 2 | 141 | Mean Difference (IV, Random, 95% CI) | 0.15 [‐0.79, 1.08] |
| 28.2 Pain score up to 60 minutes later | 2 | 141 | Mean Difference (IV, Random, 95% CI) | ‐0.81 [‐1.34, ‐0.28] |
| 28.3 overall pain score (assessed once post labour) | 1 | 100 | Mean Difference (IV, Random, 95% CI) | ‐3.43 [‐3.95, ‐2.91] |
| 29 Pain intensity (experience of moderate to severe pain) Show forest plot | 2 | Risk Ratio (M‐H, Fixed, 95% CI) | Subtotals only | |
| Analysis 3.29  Comparison 3 Immersion in water versus no immersion during any stage of labour, Outcome 29 Pain intensity (experience of moderate to severe pain). | ||||
| 29.1 Ordinal description as moderate to severe, 30 mins after randomisation | 1 | 120 | Risk Ratio (M‐H, Fixed, 95% CI) | 0.75 [0.62, 0.91] |
| 29.2 VAS scale 8 to 10, 30 mins after randomisation | 1 | 120 | Risk Ratio (M‐H, Fixed, 95% CI) | 0.72 [0.58, 0.90] |
| 29.3 Ordinal scale pain faces 4 to 5, 30 mins after randomisation | 1 | 120 | Risk Ratio (M‐H, Fixed, 95% CI) | 0.67 [0.51, 0.90] |
| 29.4 Ordinal description as moderate to severe, 1 hr after randomisation | 1 | 117 | Risk Ratio (M‐H, Fixed, 95% CI) | 0.76 [0.63, 0.91] |
| 29.5 VAS scale 8 to 10, 1 hr after randomisation | 1 | 117 | Risk Ratio (M‐H, Fixed, 95% CI) | 1.21 [0.69, 2.11] |
| 29.6 Ordinal scale pain faces 4 to 5, 1 hr after randomisation | 1 | 117 | Risk Ratio (M‐H, Fixed, 95% CI) | 0.68 [0.53, 0.86] |
| 29.7 Ordinal description as moderate to severe, 2 hrs after randomisation | 1 | 57 | Risk Ratio (M‐H, Fixed, 95% CI) | 0.76 [0.59, 0.98] |
| 29.8 VAS scale 8 to 10, 2 hrs after randomisation | 1 | 57 | Risk Ratio (M‐H, Fixed, 95% CI) | 0.83 [0.66, 1.05] |
| 29.9 Ordinal scale pain faces 4 to 5, 2 hrs after randomisation | 1 | 57 | Risk Ratio (M‐H, Fixed, 95% CI) | 0.72 [0.52, 0.98] |
| 29.10 Ordinal description as moderate to severe, 3 hrs after randomisation | 1 | 32 | Risk Ratio (M‐H, Fixed, 95% CI) | 0.52 [0.23, 1.16] |
| 29.11 VAS scale 8 to 10, 3 hrs after randomisation | 1 | 32 | Risk Ratio (M‐H, Fixed, 95% CI) | 0.69 [0.39, 1.23] |
| 29.12 Ordinal scale pain faces 4 to 5, 3 hrs after randomisation | 1 | 32 | Risk Ratio (M‐H, Fixed, 95% CI) | 0.57 [0.25, 1.27] |
| 29.13 Ordinal description as moderate to severe, 24 hrs after randomisation | 1 | 119 | Risk Ratio (M‐H, Fixed, 95% CI) | 0.64 [0.50, 0.82] |
| 29.14 VAS scale 8 to 10, 24 hrs after randomisation | 1 | 119 | Risk Ratio (M‐H, Fixed, 95% CI) | 0.62 [0.49, 0.80] |
| 29.15 Ordinal scale pain faces 4 to 5, 24 hrs after randomisation | 1 | 119 | Risk Ratio (M‐H, Fixed, 95% CI) | 0.69 [0.54, 0.87] |
| 29.16 Ordinal description as moderate to severe | 1 | 117 | Risk Ratio (M‐H, Fixed, 95% CI) | 1.06 [0.73, 1.53] |
| 30 Maternal temperature Show forest plot | 1 | 60 | Mean Difference (IV, Fixed, 95% CI) | 0.20 [‐0.18, 0.58] |
| Analysis 3.30  Comparison 3 Immersion in water versus no immersion during any stage of labour, Outcome 30 Maternal temperature. | ||||
| 31 Systolic blood pressure Show forest plot | 1 | 120 | Mean Difference (IV, Fixed, 95% CI) | ‐7.20 [‐13.12, ‐1.28] |
| Analysis 3.31  Comparison 3 Immersion in water versus no immersion during any stage of labour, Outcome 31 Systolic blood pressure. | ||||
| 32 Diastolic blood pressure Show forest plot | 1 | 120 | Mean Difference (IV, Fixed, 95% CI) | ‐10.20 [‐13.70, ‐6.70] |
| Analysis 3.32  Comparison 3 Immersion in water versus no immersion during any stage of labour, Outcome 32 Diastolic blood pressure. | ||||
| 33 Mean arterial blood pressure Show forest plot | 1 | 120 | Mean Difference (IV, Fixed, 95% CI) | ‐10.5 [‐14.68, ‐6.32] |
| Analysis 3.33 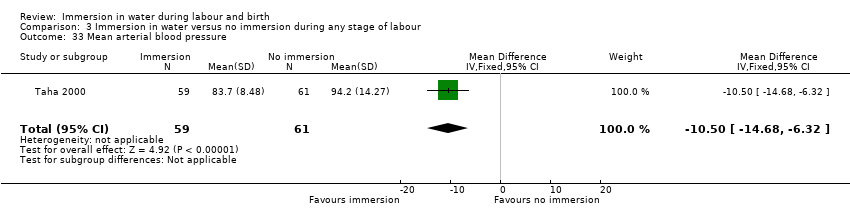 Comparison 3 Immersion in water versus no immersion during any stage of labour, Outcome 33 Mean arterial blood pressure. | ||||
| 34 Preference for care in subsequent labour (Does not wish to use bath with next labour/birth) Show forest plot | 2 | 236 | Risk Ratio (M‐H, Fixed, 95% CI) | 0.46 [0.24, 0.90] |
| Analysis 3.34  Comparison 3 Immersion in water versus no immersion during any stage of labour, Outcome 34 Preference for care in subsequent labour (Does not wish to use bath with next labour/birth). | ||||
| 35 Satisfied with labour Show forest plot | 1 | 117 | Risk Ratio (M‐H, Fixed, 95% CI) | 0.24 [0.07, 0.80] |
| Analysis 3.35 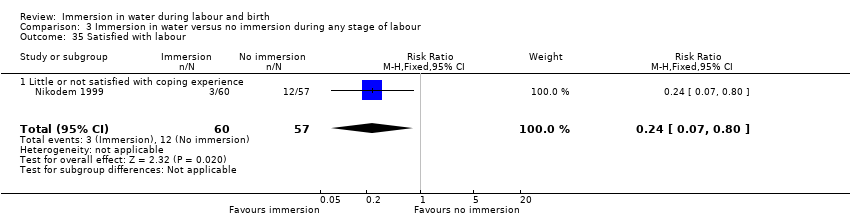 Comparison 3 Immersion in water versus no immersion during any stage of labour, Outcome 35 Satisfied with labour. | ||||
| 35.1 Little or not satisfied with coping experience | 1 | 117 | Risk Ratio (M‐H, Fixed, 95% CI) | 0.24 [0.07, 0.80] |
| 36 Satisfied with labour on scale Show forest plot | 1 | 60 | Mean Difference (IV, Fixed, 95% CI) | 0.03 [‐0.64, 0.70] |
| Analysis 3.36  Comparison 3 Immersion in water versus no immersion during any stage of labour, Outcome 36 Satisfied with labour on scale. | ||||
| 37 Postpartum depression (EPDS more than 11) Show forest plot | 2 | 370 | Risk Ratio (M‐H, Fixed, 95% CI) | 1.38 [0.85, 2.24] |
| Analysis 3.37 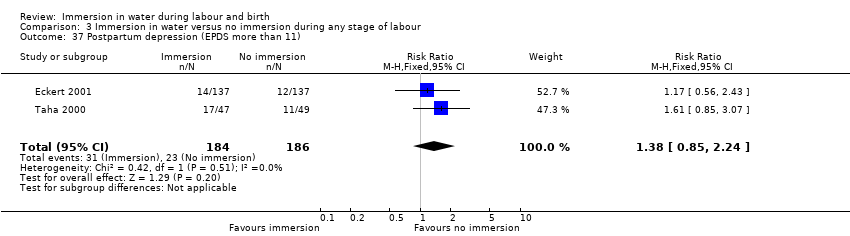 Comparison 3 Immersion in water versus no immersion during any stage of labour, Outcome 37 Postpartum depression (EPDS more than 11). | ||||
| 38 Abnormal fetal heart rate patterns Show forest plot | 3 | 487 | Risk Ratio (M‐H, Random, 95% CI) | 0.75 [0.34, 1.67] |
| Analysis 3.38  Comparison 3 Immersion in water versus no immersion during any stage of labour, Outcome 38 Abnormal fetal heart rate patterns. | ||||
| 39 Presence of meconium‐stained liquor Show forest plot | 6 | 1380 | Risk Ratio (M‐H, Fixed, 95% CI) | 0.97 [0.78, 1.21] |
| Analysis 3.39  Comparison 3 Immersion in water versus no immersion during any stage of labour, Outcome 39 Presence of meconium‐stained liquor. | ||||
| 40 Apgar score less than seven at five minutes Show forest plot | 6 | 1953 | Risk Ratio (M‐H, Fixed, 95% CI) | 1.79 [0.76, 4.25] |
| Analysis 3.40  Comparison 3 Immersion in water versus no immersion during any stage of labour, Outcome 40 Apgar score less than seven at five minutes. | ||||
| 41 Apgar score at five minutes Show forest plot | 4 | 1184 | Mean Difference (IV, Fixed, 95% CI) | ‐0.04 [‐0.11, 0.02] |
| Analysis 3.41  Comparison 3 Immersion in water versus no immersion during any stage of labour, Outcome 41 Apgar score at five minutes. | ||||
| 42 Umbilical artery pH less than 7.20 Show forest plot | 2 | 226 | Risk Ratio (M‐H, Fixed, 95% CI) | 1.04 [0.54, 1.98] |
| Analysis 3.42  Comparison 3 Immersion in water versus no immersion during any stage of labour, Outcome 42 Umbilical artery pH less than 7.20. | ||||
| 43 Breastfeeding Show forest plot | 1 | 60 | Risk Ratio (M‐H, Fixed, 95% CI) | 0.86 [0.69, 1.08] |
| Analysis 3.43 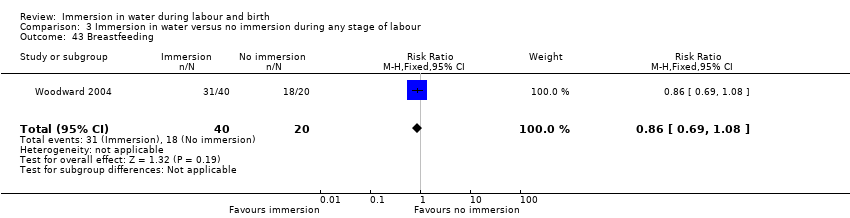 Comparison 3 Immersion in water versus no immersion during any stage of labour, Outcome 43 Breastfeeding. | ||||
| 44 Not breastfeeding after six weeks post birth Show forest plot | 2 | 363 | Risk Ratio (M‐H, Fixed, 95% CI) | 1.17 [0.64, 2.15] |
| Analysis 3.44  Comparison 3 Immersion in water versus no immersion during any stage of labour, Outcome 44 Not breastfeeding after six weeks post birth. | ||||
| Outcome or subgroup title | No. of studies | No. of participants | Statistical method | Effect size |
| 1 Use of pharmacological analgesia (epidural/spinal analgesia/paracervical block) Show forest plot | 1 | 200 | Risk Ratio (M‐H, Fixed, 95% CI) | 2.21 [1.39, 3.52] |
| Analysis 4.1 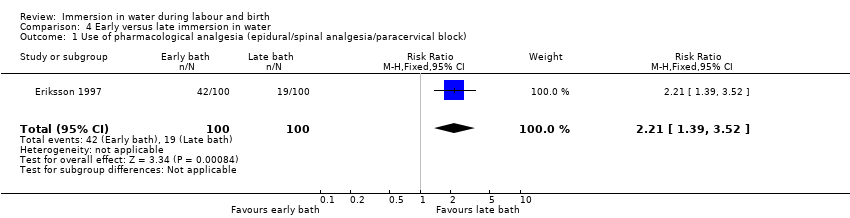 Comparison 4 Early versus late immersion in water, Outcome 1 Use of pharmacological analgesia (epidural/spinal analgesia/paracervical block). | ||||
| 2 Neonatal infection Show forest plot | 1 | 200 | Risk Ratio (M‐H, Fixed, 95% CI) | 3.0 [0.12, 72.77] |
| Analysis 4.2  Comparison 4 Early versus late immersion in water, Outcome 2 Neonatal infection. | ||||
| 3 Use of oxytocin Show forest plot | 1 | 200 | Risk Ratio (M‐H, Fixed, 95% CI) | 1.9 [1.35, 2.68] |
| Analysis 4.3  Comparison 4 Early versus late immersion in water, Outcome 3 Use of oxytocin. | ||||
| 4 Abnormal fetal heart rate patterns Show forest plot | 1 | 200 | Risk Ratio (M‐H, Fixed, 95% CI) | 0.0 [0.0, 0.0] |
| Analysis 4.4  Comparison 4 Early versus late immersion in water, Outcome 4 Abnormal fetal heart rate patterns. | ||||
| 5 Apgar score less than seven at one minute Show forest plot | 1 | 200 | Risk Ratio (M‐H, Fixed, 95% CI) | 0.0 [0.0, 0.0] |
| Analysis 4.5  Comparison 4 Early versus late immersion in water, Outcome 5 Apgar score less than seven at one minute. | ||||

Study flow diagram.

'Risk of bias' graph: review authors' judgements about each risk of bias item presented as percentages across all included studies.

'Risk of bias' summary: review authors' judgements about each risk of bias item for each included study.
Comparison 1 Immersion in water versus no immersion during first stage of labour, Outcome 1 Mode of birth (spontaneous vaginal birth).

Comparison 1 Immersion in water versus no immersion during first stage of labour, Outcome 2 Mode of birth (instrumental vaginal births).
Comparison 1 Immersion in water versus no immersion during first stage of labour, Outcome 3 Mode of birth (caesarean section).

Comparison 1 Immersion in water versus no immersion during first stage of labour, Outcome 4 Use of analgesia (regional).

Comparison 1 Immersion in water versus no immersion during first stage of labour, Outcome 5 Perineal trauma (third‐ or fourth‐degree tears).

Comparison 1 Immersion in water versus no immersion during first stage of labour, Outcome 6 Admission to neonatal intensive care unit.

Comparison 1 Immersion in water versus no immersion during first stage of labour, Outcome 7 Neonatal infection.

Comparison 1 Immersion in water versus no immersion during first stage of labour, Outcome 8 Neonate temperature.

Comparison 1 Immersion in water versus no immersion during first stage of labour, Outcome 9 Estimated blood loss (mL).

Comparison 1 Immersion in water versus no immersion during first stage of labour, Outcome 10 Postpartum haemorrhage.

Comparison 1 Immersion in water versus no immersion during first stage of labour, Outcome 11 Use of analgesia (pharmacological ‐ pethidine/narcotic).

Comparison 1 Immersion in water versus no immersion during first stage of labour, Outcome 12 Use of any analgesia.

Comparison 1 Immersion in water versus no immersion during first stage of labour, Outcome 13 Use of analgesia (pharmacological ‐ any).

Comparison 1 Immersion in water versus no immersion during first stage of labour, Outcome 14 Maternal infection during labour/postnatal period (perineal, systemic, uterine or increase in temperature).
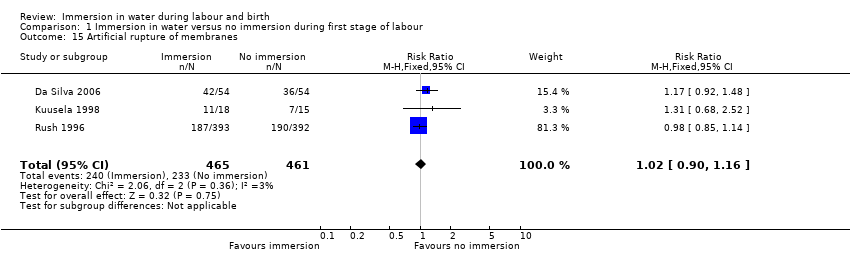
Comparison 1 Immersion in water versus no immersion during first stage of labour, Outcome 15 Artificial rupture of membranes.

Comparison 1 Immersion in water versus no immersion during first stage of labour, Outcome 16 Use of oxytocin for augmentation of labour.
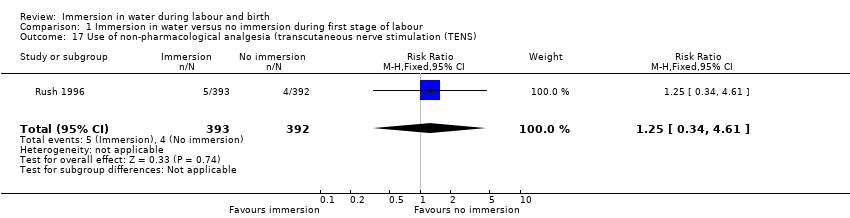
Comparison 1 Immersion in water versus no immersion during first stage of labour, Outcome 17 Use of non‐pharmacological analgesia (transcutaneous nerve stimulation (TENS).

Comparison 1 Immersion in water versus no immersion during first stage of labour, Outcome 18 Duration of first stage (minutes).

Comparison 1 Immersion in water versus no immersion during first stage of labour, Outcome 19 Duration of second stage (minutes).

Comparison 1 Immersion in water versus no immersion during first stage of labour, Outcome 20 Duration of third stage (minutes).

Comparison 1 Immersion in water versus no immersion during first stage of labour, Outcome 21 Duration of total labour (all three stages minutes).

Comparison 1 Immersion in water versus no immersion during first stage of labour, Outcome 22 Perineal trauma (intact).

Comparison 1 Immersion in water versus no immersion during first stage of labour, Outcome 23 Perineal trauma (second‐degree tears).

Comparison 1 Immersion in water versus no immersion during first stage of labour, Outcome 24 Perineal trauma (episiotomy).

Comparison 1 Immersion in water versus no immersion during first stage of labour, Outcome 25 Self reports pain score on visual analogue scale of 0‐10.
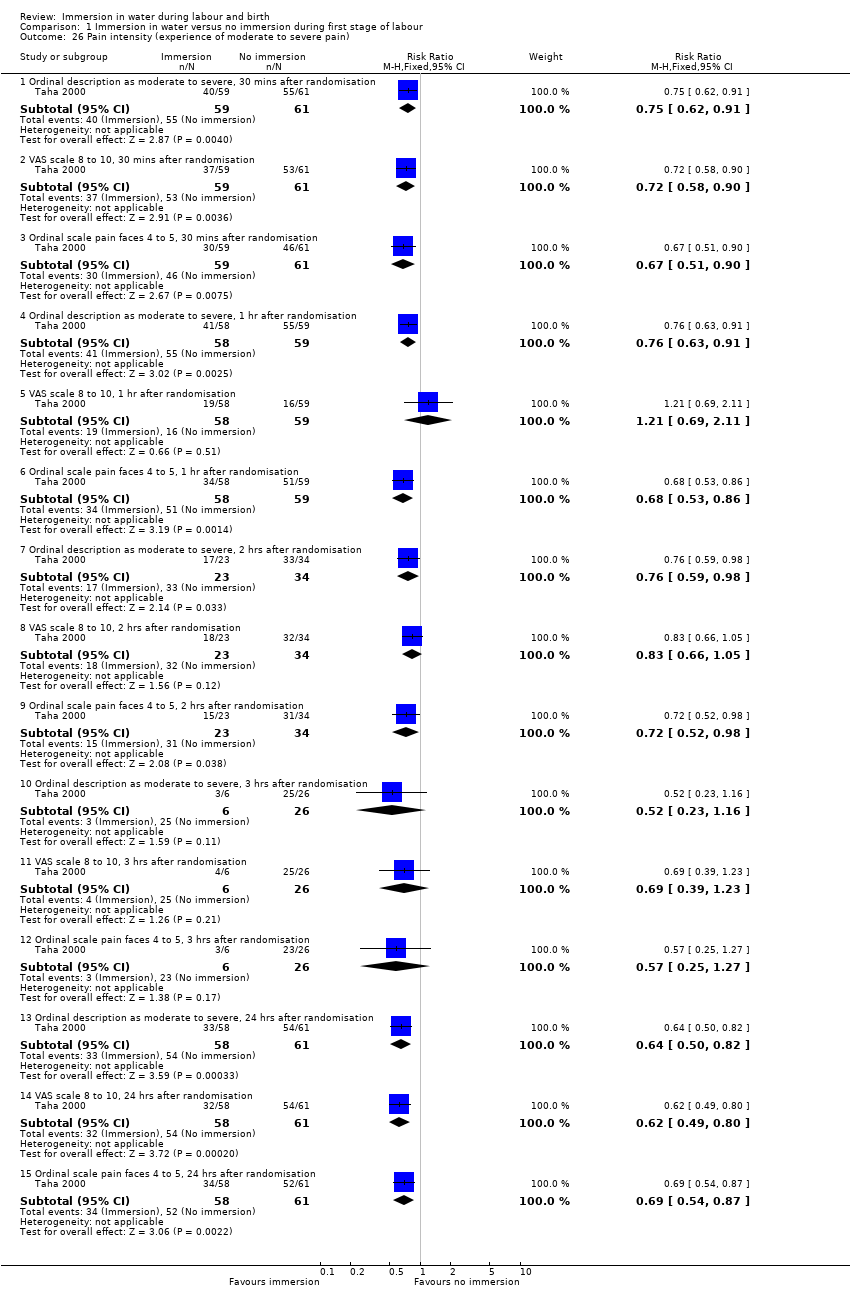
Comparison 1 Immersion in water versus no immersion during first stage of labour, Outcome 26 Pain intensity (experience of moderate to severe pain).
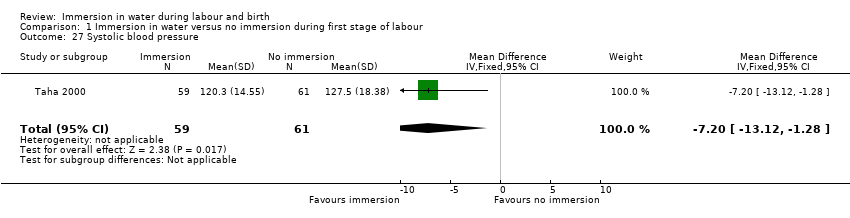
Comparison 1 Immersion in water versus no immersion during first stage of labour, Outcome 27 Systolic blood pressure.

Comparison 1 Immersion in water versus no immersion during first stage of labour, Outcome 28 Diastolic blood pressure.

Comparison 1 Immersion in water versus no immersion during first stage of labour, Outcome 29 Mean arterial blood pressure.

Comparison 1 Immersion in water versus no immersion during first stage of labour, Outcome 30 Preference for care in subsequent labour (Does not wish to use bath with next labour/birth).

Comparison 1 Immersion in water versus no immersion during first stage of labour, Outcome 31 Postpartum depression (EPDS more than 11).

Comparison 1 Immersion in water versus no immersion during first stage of labour, Outcome 32 Abnormal fetal heart rate patterns.
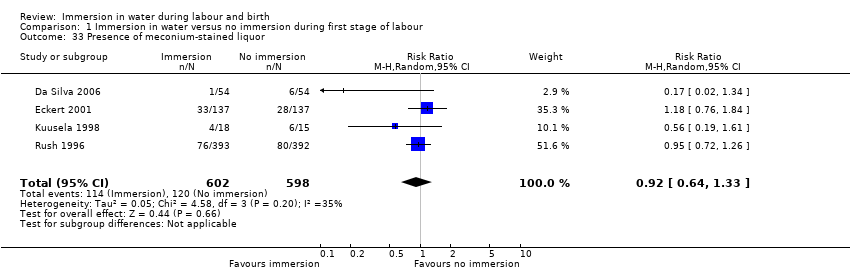
Comparison 1 Immersion in water versus no immersion during first stage of labour, Outcome 33 Presence of meconium‐stained liquor.

Comparison 1 Immersion in water versus no immersion during first stage of labour, Outcome 34 Apgar score less than seven at five minutes.
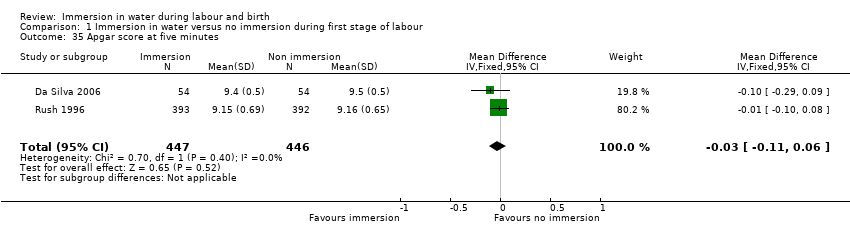
Comparison 1 Immersion in water versus no immersion during first stage of labour, Outcome 35 Apgar score at five minutes.

Comparison 1 Immersion in water versus no immersion during first stage of labour, Outcome 36 Umbilical artery pH less than 7.20.

Comparison 1 Immersion in water versus no immersion during first stage of labour, Outcome 37 Breastfeeding ‐ not breastfeeding after six weeks post birth.
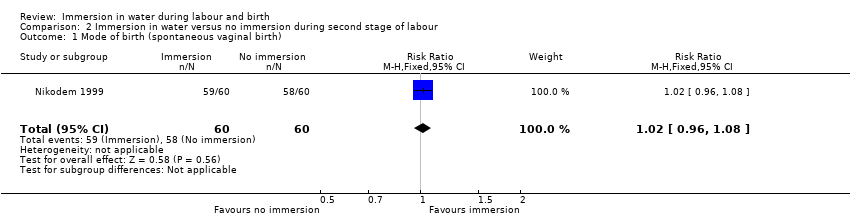
Comparison 2 Immersion in water versus no immersion during second stage of labour, Outcome 1 Mode of birth (spontaneous vaginal birth).

Comparison 2 Immersion in water versus no immersion during second stage of labour, Outcome 2 Mode of birth (instrumental vaginal births).
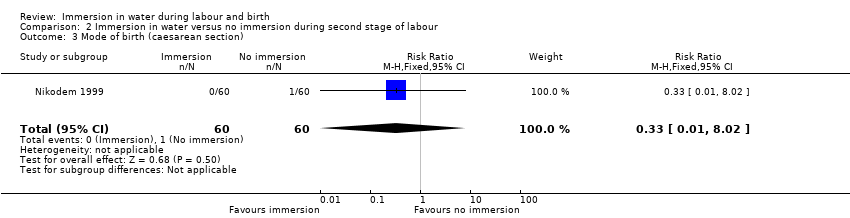
Comparison 2 Immersion in water versus no immersion during second stage of labour, Outcome 3 Mode of birth (caesarean section).

Comparison 2 Immersion in water versus no immersion during second stage of labour, Outcome 4 Perinatal deaths.

Comparison 2 Immersion in water versus no immersion during second stage of labour, Outcome 5 Admission to neonatal intensive care unit.
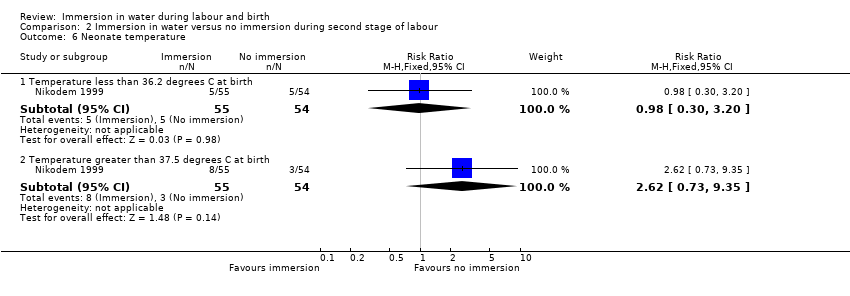
Comparison 2 Immersion in water versus no immersion during second stage of labour, Outcome 6 Neonate temperature.

Comparison 2 Immersion in water versus no immersion during second stage of labour, Outcome 7 Fever reported in first week.
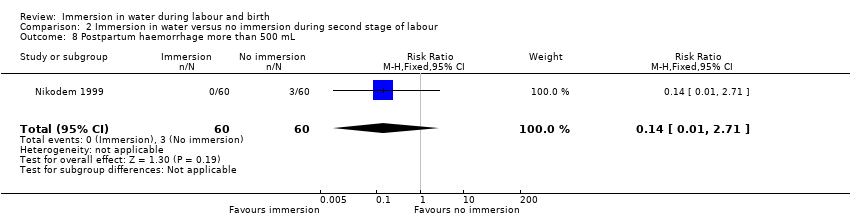
Comparison 2 Immersion in water versus no immersion during second stage of labour, Outcome 8 Postpartum haemorrhage more than 500 mL.

Comparison 2 Immersion in water versus no immersion during second stage of labour, Outcome 9 Duration of second stage (minutes).

Comparison 2 Immersion in water versus no immersion during second stage of labour, Outcome 10 Perineal trauma (episiotomy).
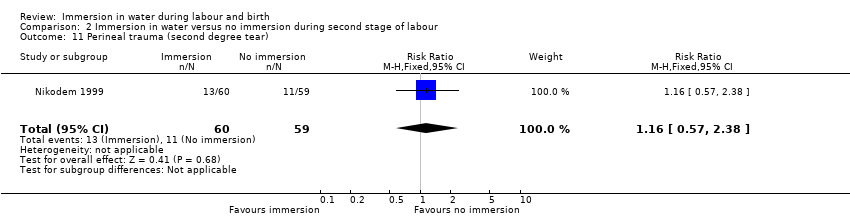
Comparison 2 Immersion in water versus no immersion during second stage of labour, Outcome 11 Perineal trauma (second degree tear).

Comparison 2 Immersion in water versus no immersion during second stage of labour, Outcome 12 Experience of moderate to severe pain.

Comparison 2 Immersion in water versus no immersion during second stage of labour, Outcome 13 Preference for care in subsequent labour (Does not wish to use bath next birth).

Comparison 2 Immersion in water versus no immersion during second stage of labour, Outcome 14 Satisfied with labour.

Comparison 2 Immersion in water versus no immersion during second stage of labour, Outcome 15 Presence of meconium‐stained liquor.
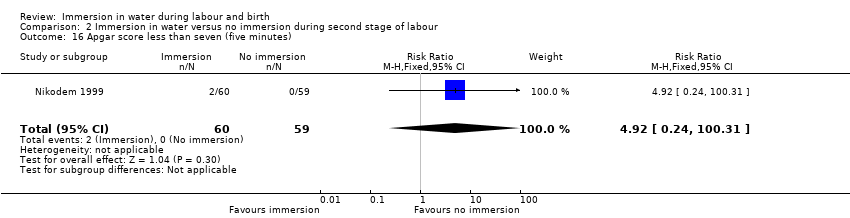
Comparison 2 Immersion in water versus no immersion during second stage of labour, Outcome 16 Apgar score less than seven (five minutes).
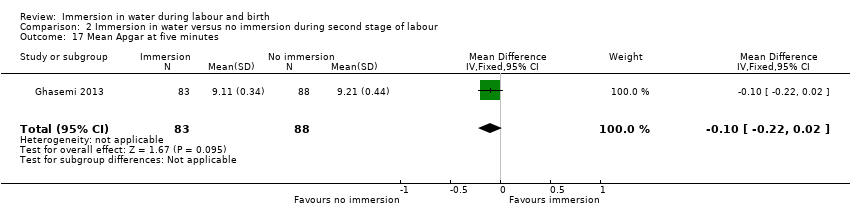
Comparison 2 Immersion in water versus no immersion during second stage of labour, Outcome 17 Mean Apgar at five minutes.

Comparison 2 Immersion in water versus no immersion during second stage of labour, Outcome 18 Umbilical artery pH less than 7.20.
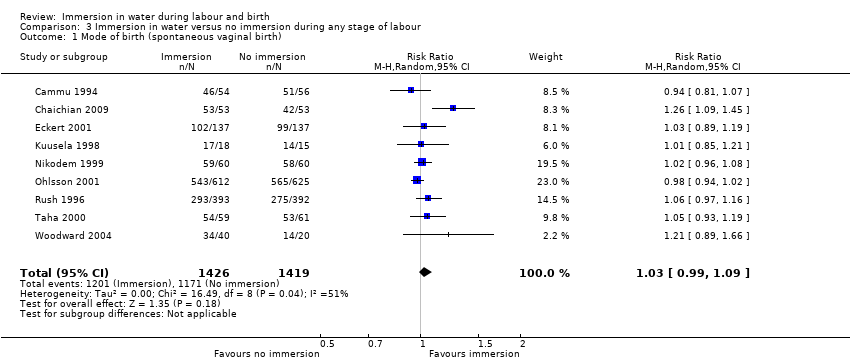
Comparison 3 Immersion in water versus no immersion during any stage of labour, Outcome 1 Mode of birth (spontaneous vaginal birth).

Comparison 3 Immersion in water versus no immersion during any stage of labour, Outcome 2 Mode of birth (instrumental vaginal births).

Comparison 3 Immersion in water versus no immersion during any stage of labour, Outcome 3 Mode of birth (caesarean section).

Comparison 3 Immersion in water versus no immersion during any stage of labour, Outcome 4 Use of analgesia (regional).

Comparison 3 Immersion in water versus no immersion during any stage of labour, Outcome 5 Perineal trauma (third‐ or fourth‐degree tears).

Comparison 3 Immersion in water versus no immersion during any stage of labour, Outcome 6 Perinatal deaths.
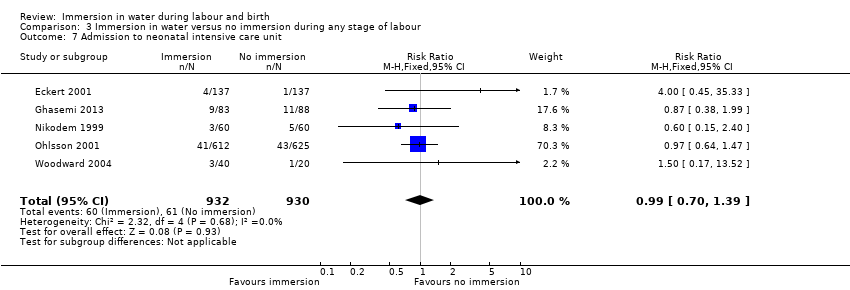
Comparison 3 Immersion in water versus no immersion during any stage of labour, Outcome 7 Admission to neonatal intensive care unit.

Comparison 3 Immersion in water versus no immersion during any stage of labour, Outcome 8 Neonatal infection.
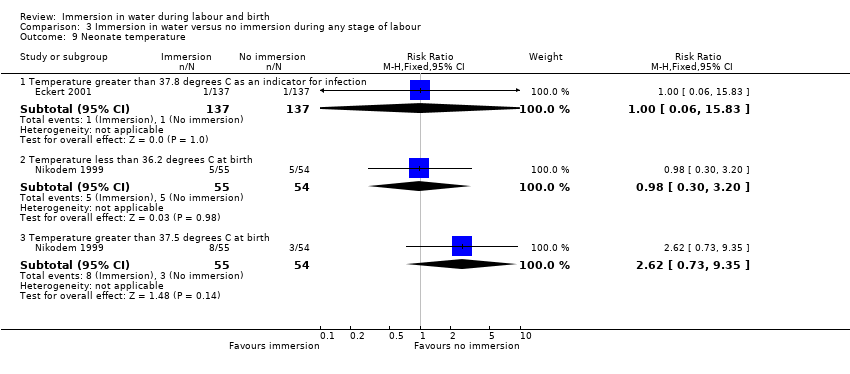
Comparison 3 Immersion in water versus no immersion during any stage of labour, Outcome 9 Neonate temperature.
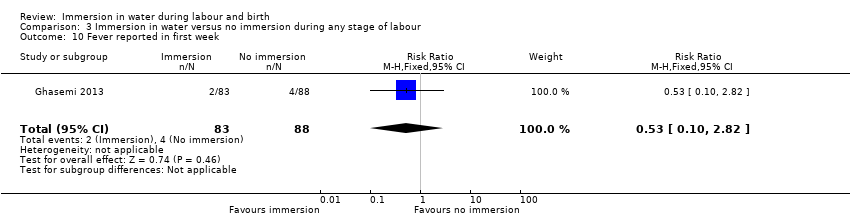
Comparison 3 Immersion in water versus no immersion during any stage of labour, Outcome 10 Fever reported in first week.

Comparison 3 Immersion in water versus no immersion during any stage of labour, Outcome 11 Antibiotics given to neonate.
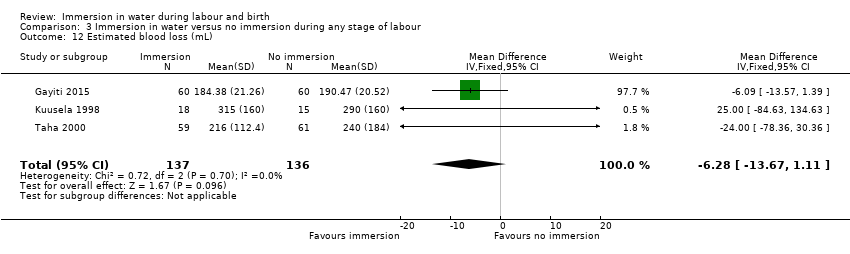
Comparison 3 Immersion in water versus no immersion during any stage of labour, Outcome 12 Estimated blood loss (mL).

Comparison 3 Immersion in water versus no immersion during any stage of labour, Outcome 13 Postpartum haemorrhage.

Comparison 3 Immersion in water versus no immersion during any stage of labour, Outcome 14 Use of analgesia (pharmacological ‐ pethidine/narcotic).

Comparison 3 Immersion in water versus no immersion during any stage of labour, Outcome 15 Use of analgesia (pharmacological ‐ any).

Comparison 3 Immersion in water versus no immersion during any stage of labour, Outcome 16 Use of any analgesia.

Comparison 3 Immersion in water versus no immersion during any stage of labour, Outcome 17 Maternal infection during labour/postnatal period (perineal, systemic, uterine or increase in temperature).

Comparison 3 Immersion in water versus no immersion during any stage of labour, Outcome 18 Artificial rupture of membranes.

Comparison 3 Immersion in water versus no immersion during any stage of labour, Outcome 19 Use of oxytocin for augmentation of labour.

Comparison 3 Immersion in water versus no immersion during any stage of labour, Outcome 20 Use of non‐pharmacological analgesia (transcutaneous nerve stimulation (TENS)).

Comparison 3 Immersion in water versus no immersion during any stage of labour, Outcome 21 Duration of first stage (minutes).

Comparison 3 Immersion in water versus no immersion during any stage of labour, Outcome 22 Duration of second stage (minutes).
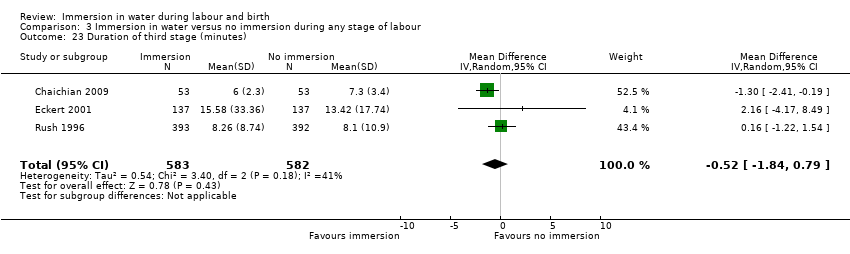
Comparison 3 Immersion in water versus no immersion during any stage of labour, Outcome 23 Duration of third stage (minutes).

Comparison 3 Immersion in water versus no immersion during any stage of labour, Outcome 24 Duration of total labour (all three stages).

Comparison 3 Immersion in water versus no immersion during any stage of labour, Outcome 25 Perineal trauma (none‐ intact).

Comparison 3 Immersion in water versus no immersion during any stage of labour, Outcome 26 Perineal trauma (first‐ and second‐degree tears).

Comparison 3 Immersion in water versus no immersion during any stage of labour, Outcome 27 Perineal trauma (episiotomy).

Comparison 3 Immersion in water versus no immersion during any stage of labour, Outcome 28 Self reports pain score on visual analogue scale of 0‐10.
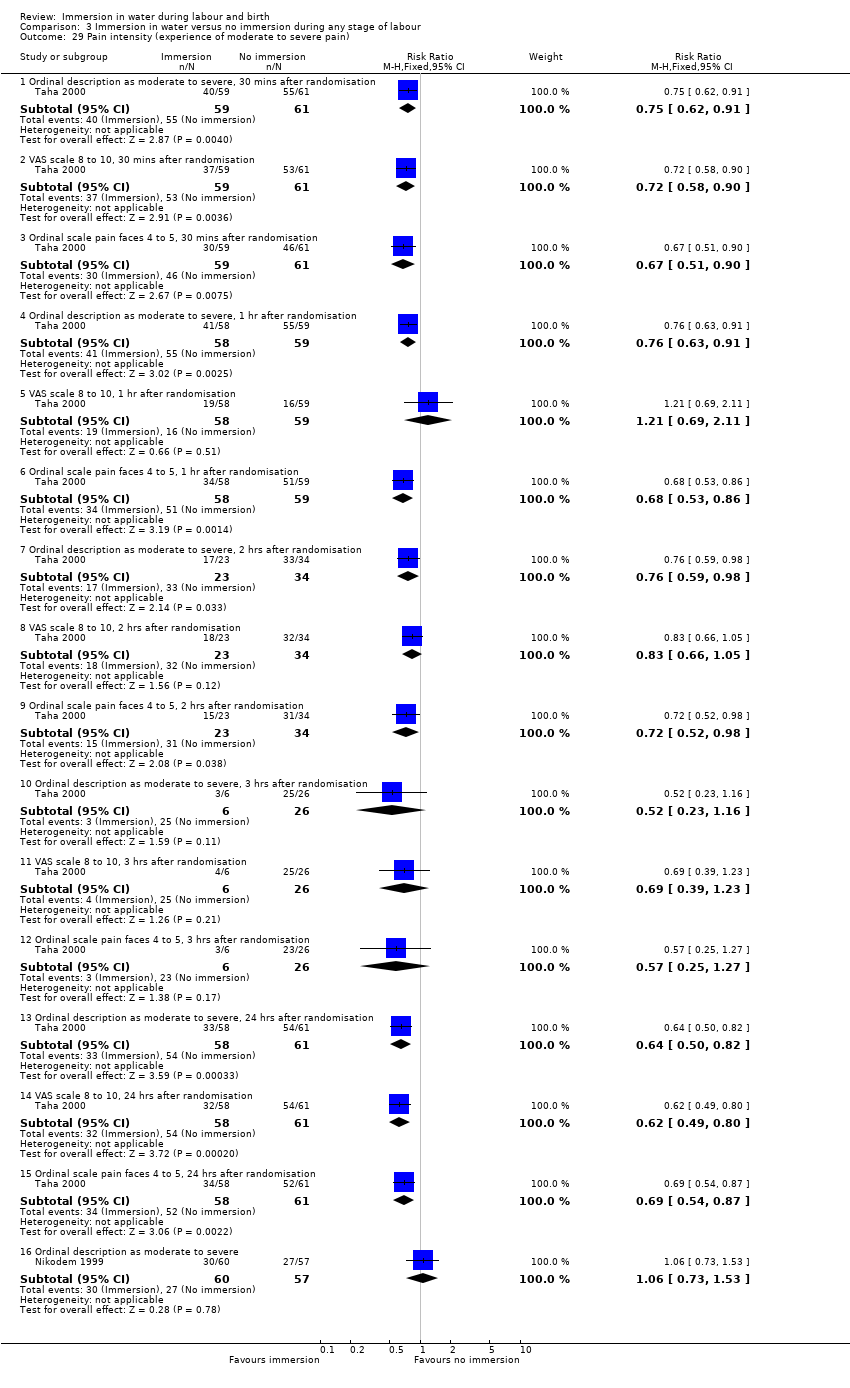
Comparison 3 Immersion in water versus no immersion during any stage of labour, Outcome 29 Pain intensity (experience of moderate to severe pain).
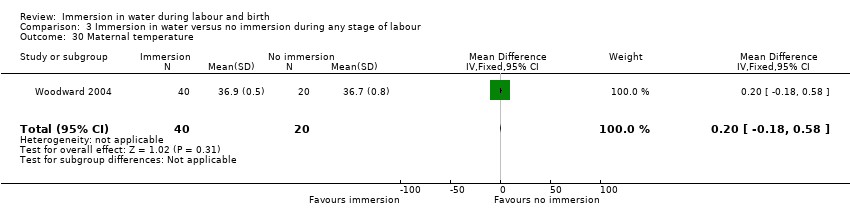
Comparison 3 Immersion in water versus no immersion during any stage of labour, Outcome 30 Maternal temperature.

Comparison 3 Immersion in water versus no immersion during any stage of labour, Outcome 31 Systolic blood pressure.
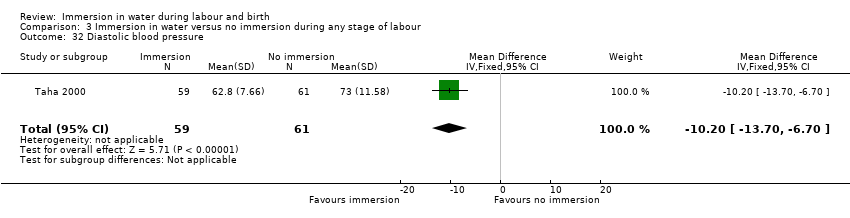
Comparison 3 Immersion in water versus no immersion during any stage of labour, Outcome 32 Diastolic blood pressure.

Comparison 3 Immersion in water versus no immersion during any stage of labour, Outcome 33 Mean arterial blood pressure.
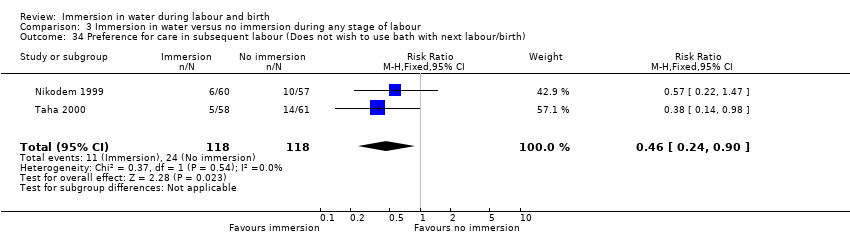
Comparison 3 Immersion in water versus no immersion during any stage of labour, Outcome 34 Preference for care in subsequent labour (Does not wish to use bath with next labour/birth).

Comparison 3 Immersion in water versus no immersion during any stage of labour, Outcome 35 Satisfied with labour.
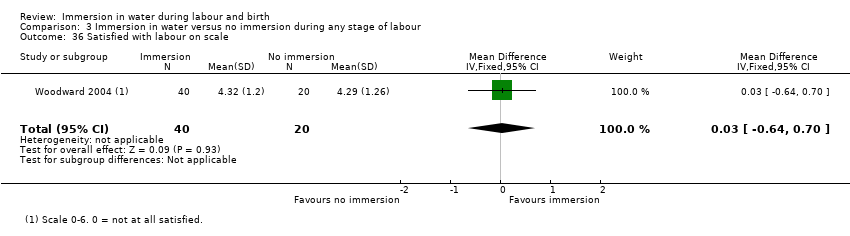
Comparison 3 Immersion in water versus no immersion during any stage of labour, Outcome 36 Satisfied with labour on scale.

Comparison 3 Immersion in water versus no immersion during any stage of labour, Outcome 37 Postpartum depression (EPDS more than 11).

Comparison 3 Immersion in water versus no immersion during any stage of labour, Outcome 38 Abnormal fetal heart rate patterns.
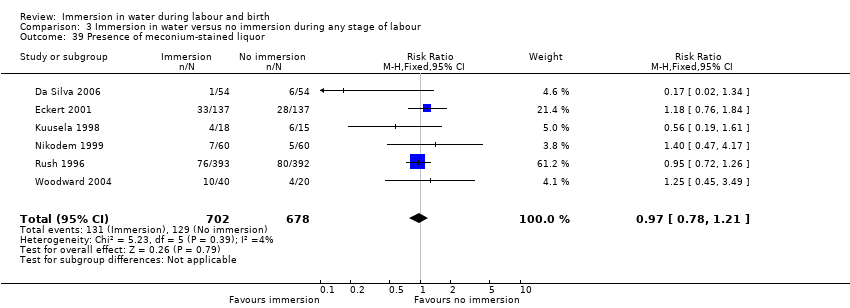
Comparison 3 Immersion in water versus no immersion during any stage of labour, Outcome 39 Presence of meconium‐stained liquor.
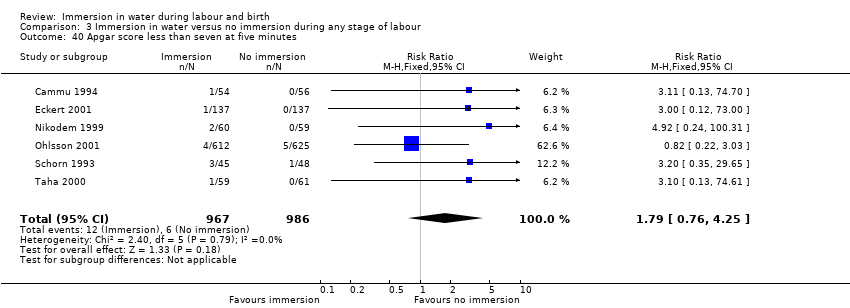
Comparison 3 Immersion in water versus no immersion during any stage of labour, Outcome 40 Apgar score less than seven at five minutes.

Comparison 3 Immersion in water versus no immersion during any stage of labour, Outcome 41 Apgar score at five minutes.

Comparison 3 Immersion in water versus no immersion during any stage of labour, Outcome 42 Umbilical artery pH less than 7.20.

Comparison 3 Immersion in water versus no immersion during any stage of labour, Outcome 43 Breastfeeding.
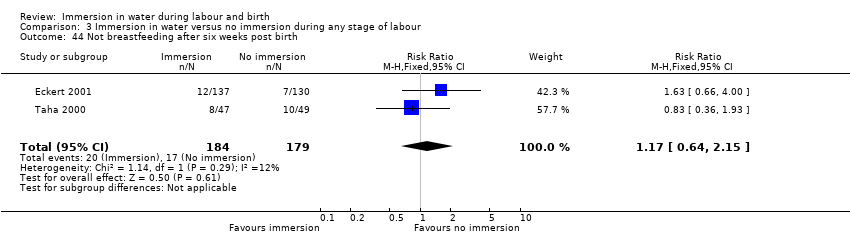
Comparison 3 Immersion in water versus no immersion during any stage of labour, Outcome 44 Not breastfeeding after six weeks post birth.

Comparison 4 Early versus late immersion in water, Outcome 1 Use of pharmacological analgesia (epidural/spinal analgesia/paracervical block).

Comparison 4 Early versus late immersion in water, Outcome 2 Neonatal infection.
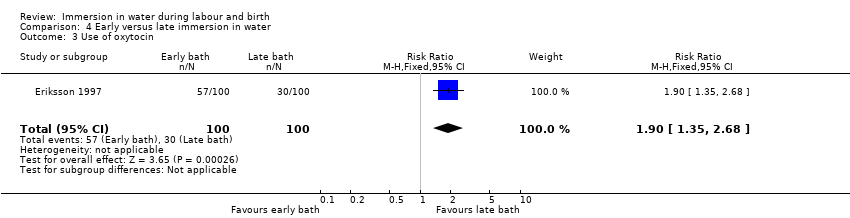
Comparison 4 Early versus late immersion in water, Outcome 3 Use of oxytocin.
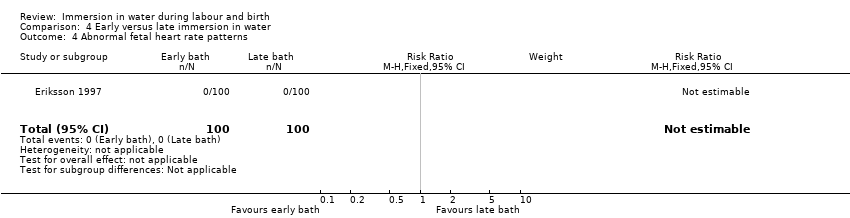
Comparison 4 Early versus late immersion in water, Outcome 4 Abnormal fetal heart rate patterns.

Comparison 4 Early versus late immersion in water, Outcome 5 Apgar score less than seven at one minute.
| Immersion in water compared to no immersion during first stage of labour in water during labour and birth | ||||||
| Patient or population: women in labour | ||||||
| Outcomes | Anticipated absolute effects* (95% CI) | Relative effect | № of participants | Quality of the evidence | Comments | |
| Risk with no immersion during first stage of labour | Risk with immersion in water | |||||
| Mode of birth (spontaneous vaginal birth) | Study population | RR 1.01 | 2559 | ⊕⊕⊕⊝ | ||
| 822 per 1000 | 830 per 1000 | |||||
| Mode of birth (instrumental vaginal birth) | Study population | RR 0.86 (0.70 to 1.05) | 2559 (6 RCTs) | ⊕⊕⊝⊝ | ||
| 138 per 1000 | 119 per 1000 (97 to 1.05) | |||||
| Mode of birth (caesarean section) | Study population | RR 1.27 (0.91 to 1.79) | 2652 (7 RCTs) | ⊕⊕⊝⊝ | ||
| 41 per 1000 | 52 per 1000 (38 to 74) | |||||
| Use of analgesia (regional) | Study population | RR 0.91 | 2439 | ⊕⊕⊕⊝ | ||
| 429 per 1000 | 390 per 1000 | |||||
| Perineal trauma (third‐ or fourth‐degree tears) | Study population | RR 1.36 | 2341 | ⊕⊕⊕⊝ | ||
| 25 per 1000 | 33 per 1000 | |||||
| Perinatal death | Study population | ‐ | ‐ | ‐ | No trial reported this outcome. | |
| see comment | see comment | |||||
| Admission to neonatal intensive care unit | Study population | Average RR 1.30 | 1511 | ⊕⊕⊝⊝ | ||
| 58 per 1000 | 75 per 1000 | |||||
| Neonatal infection | Study population | RR 2.00 | 1295 | ⊕⊝⊝⊝ | ||
| 5 per 1000 | 9 per 1000 | |||||
| Estimated blood loss (mL) | The mean estimated blood loss with immersion was 265.5 mL | MD 14.33 mL lower without immersion | ‐ | 153 | ⊕⊝⊝⊝ | |
| *The risk in the intervention group (and its 95% confidence interval) is based on the assumed risk in the comparison group and the relative effect of the intervention (and its 95% CI). | ||||||
| GRADE Working Group grades of evidence | ||||||
| 1 All trials had design limitations: No trial was blinded, two trials did not randomise adequately, and three did not report all outcomes (‐1) 2 Wide confidence intervals that cross the line of no effect (‐1) 3 All trials had design limitations: No trial was blinded, two trials did not randomise adequately, one did not conceal allocation, and three did not report all outcomes (‐1) 4 Both trials have design limitations: Neither trial was blinded, one trial did not randomise adequately, and both did not report all outcomes (‐1) 5 Few events and wide confidence intervals crossing the line of no effect (‐2) 6 Both trials have design limitations: Neither trial was blinded, one trial did not randomise adequately (‐1) 7 Small sample size and wide confidence intervals crossing the line of no effect (‐2) | ||||||
| Immersion in water compared to no immersion during second stage of labour in water during labour and birth | ||||||
| Patient or population: women in labour | ||||||
| Outcomes | Anticipated absolute effects* (95% CI) | Relative effect | № of participants | Quality of the evidence | Comments | |
| Risk with no immersion during second stage of labour | Risk with immersion in water | |||||
| Mode of birth (spontaneous vaginal birth) | Study population | RR 1.02 | 120 | ⊕⊕⊝⊝ | ||
| 967 per 1000 | 986 per 1000 | |||||
| Mode of birth (instrumental vaginal birth) | Study population | RR 1.00 (0.06 to 15.62) | 120 (1 RCT) | ⊕⊝⊝⊝ | ||
| 17 per 1000 | 17 per 1000 (1 to 260) | |||||
| Mode of birth (caesarean section) | Study population | RR 0.33 (0.01 to 8.02) | 120 (1 RCT) | ⊕⊝⊝⊝ | ||
| 17 per 1000 | 6 per 1000 (0 to 134) | |||||
| Use of analgesia (regional) | Study population | ‐ | ‐ | ‐ | This outcome was not reported as it is not applicable to the second stage of labour. | |
| see comment | see comment | |||||
| Perineal trauma (third‐ or fourth‐degree tears) | Study population | ‐ | ‐ | ‐ | No trial reported this outcome | |
| see comment | see comment | |||||
| Perinatal death | Study population | RR 3.00 | 120 | ⊕⊝⊝⊝ | 1 death occurred in the immersion group in this trial. The infant was born alive to a woman with HIV who was treated 2 weeks previous to birth for vaginal infection. The infant died at 2.5 hours after birth. After investigation the cause of death was determined to be intrauterine infection. | |
| 0 per 1000 | 0 per 1000 | |||||
| Admission to neonatal intensive care unit | Study population | RR 0.78 | 291 | ⊕⊝⊝⊝ | ||
| 108 per 1000 | 84 per 1000 | |||||
| Neonatal infection, including markers of infection such as pyrexia and raised white cell count: Neonatal temperature less than 36.2oC at birth | Study population | RR 0.98 | 109 | ⊕⊝⊝⊝ | Number of neonatal infections was not reported, but temperature was included as a marker of infection. | |
| 93 per 1000 | 91 per 1000 | |||||
| Neonatal infection, including markers of infection such as pyrexia and raised white cell count: Neonatal temperature greater than 37.5oC at birth | Study population | RR 2.62 | 109 | ⊕⊝⊝⊝ | Number of neonatal infections was not reported, but temperature was included as a marker of infection. | |
| 56 per 1000 | 146 per 1000 | |||||
| Neonatal infection, including markers of infection such as pyrexia and raised white cell count: Fever reported in first week | Study population | RR 0.53 | 171 | ⊕⊝⊝⊝ | Number of neonatal infections was not reported, but fever was included as a marker of infection. | |
| 45 per 1000 | 24 per 1000 | |||||
| Estimated blood loss (mL) | Study population | ‐ | ‐ | ‐ | No trial reported this outcome | |
| see comment | see comment | |||||
| *The risk in the intervention group (and its 95% confidence interval) is based on the assumed risk in the comparison group and the relative effect of the intervention (and its 95% CI). | ||||||
| GRADE Working Group grades of evidence | ||||||
| 1 Data from one study with design limitations: trial was not blinded, and did not randomise adequately (‐1) 2 Small sample size (‐1) 3 Small sample size, few events, and wide confidence intervals crossing the line of no effect (‐2) 4 Data from one study with design limitations: trial was not blinded, did not report all outcomes, and was at unclear risk of bias in most domains (‐1) | ||||||
| Outcome or subgroup title | No. of studies | No. of participants | Statistical method | Effect size |
| 1 Mode of birth (spontaneous vaginal birth) Show forest plot | 6 | 2559 | Risk Ratio (M‐H, Fixed, 95% CI) | 1.01 [0.97, 1.04] |
| 2 Mode of birth (instrumental vaginal births) Show forest plot | 6 | 2559 | Risk Ratio (M‐H, Fixed, 95% CI) | 0.86 [0.70, 1.05] |
| 3 Mode of birth (caesarean section) Show forest plot | 7 | 2652 | Risk Ratio (M‐H, Fixed, 95% CI) | 1.27 [0.91, 1.79] |
| 4 Use of analgesia (regional) Show forest plot | 5 | 2439 | Risk Ratio (M‐H, Fixed, 95% CI) | 0.91 [0.83, 0.99] |
| 5 Perineal trauma (third‐ or fourth‐degree tears) Show forest plot | 4 | 2341 | Risk Ratio (M‐H, Fixed, 95% CI) | 1.36 [0.85, 2.18] |
| 6 Admission to neonatal intensive care unit Show forest plot | 2 | 1511 | Risk Ratio (M‐H, Random, 95% CI) | 1.30 [0.42, 3.97] |
| 7 Neonatal infection Show forest plot | 5 | 1295 | Risk Ratio (M‐H, Fixed, 95% CI) | 2.00 [0.50, 7.94] |
| 8 Neonate temperature Show forest plot | 1 | Risk Ratio (M‐H, Fixed, 95% CI) | Subtotals only | |
| 8.1 Temperature greater than 37.8 degrees C as an indicator for infection | 1 | 274 | Risk Ratio (M‐H, Fixed, 95% CI) | 1.0 [0.06, 15.83] |
| 9 Estimated blood loss (mL) Show forest plot | 2 | 153 | Mean Difference (IV, Fixed, 95% CI) | ‐14.33 [‐63.03, 34.37] |
| 10 Postpartum haemorrhage Show forest plot | 1 | 274 | Risk Ratio (M‐H, Fixed, 95% CI) | 1.58 [0.80, 3.13] |
| 11 Use of analgesia (pharmacological ‐ pethidine/narcotic) Show forest plot | 3 | 1180 | Risk Ratio (M‐H, Random, 95% CI) | 1.08 [0.59, 1.96] |
| 12 Use of any analgesia Show forest plot | 3 | 487 | Risk Ratio (M‐H, Fixed, 95% CI) | 0.99 [0.88, 1.12] |
| 13 Use of analgesia (pharmacological ‐ any) Show forest plot | 2 | 394 | Risk Ratio (M‐H, Fixed, 95% CI) | 1.05 [0.80, 1.39] |
| 14 Maternal infection during labour/postnatal period (perineal, systemic, uterine or increase in temperature) Show forest plot | 5 | 1295 | Risk Ratio (M‐H, Fixed, 95% CI) | 0.99 [0.50, 1.96] |
| 15 Artificial rupture of membranes Show forest plot | 3 | 926 | Risk Ratio (M‐H, Fixed, 95% CI) | 1.02 [0.90, 1.16] |
| 16 Use of oxytocin for augmentation of labour Show forest plot | 4 | 1019 | Risk Ratio (M‐H, Fixed, 95% CI) | 0.91 [0.72, 1.15] |
| 17 Use of non‐pharmacological analgesia (transcutaneous nerve stimulation (TENS) Show forest plot | 1 | 785 | Risk Ratio (M‐H, Fixed, 95% CI) | 1.25 [0.34, 4.61] |
| 18 Duration of first stage (minutes) Show forest plot | 5 | 1295 | Mean Difference (IV, Fixed, 95% CI) | ‐11.53 [‐45.42, 22.36] |
| 19 Duration of second stage (minutes) Show forest plot | 6 | 1403 | Mean Difference (IV, Random, 95% CI) | 1.12 [‐5.23, 7.48] |
| 20 Duration of third stage (minutes) Show forest plot | 2 | 1059 | Mean Difference (IV, Fixed, 95% CI) | 0.25 [‐1.10, 1.60] |
| 21 Duration of total labour (all three stages minutes) Show forest plot | 1 | 120 | Mean Difference (IV, Fixed, 95% CI) | ‐27.5 [‐133.05, 78.05] |
| 22 Perineal trauma (intact) Show forest plot | 4 | 1277 | Risk Ratio (M‐H, Fixed, 95% CI) | 1.17 [1.01, 1.37] |
| 23 Perineal trauma (second‐degree tears) Show forest plot | 4 | 1212 | Risk Ratio (M‐H, Fixed, 95% CI) | 0.94 [0.74, 1.20] |
| 24 Perineal trauma (episiotomy) Show forest plot | 4 | 1212 | Risk Ratio (M‐H, Fixed, 95% CI) | 0.94 [0.80, 1.09] |
| 25 Self reports pain score on visual analogue scale of 0‐10 Show forest plot | 2 | Mean Difference (IV, Random, 95% CI) | Subtotals only | |
| 25.1 Pain score at start of assessment period (time zero) | 2 | 141 | Mean Difference (IV, Random, 95% CI) | 0.15 [‐0.79, 1.08] |
| 25.2 Pain score up to 60 minutes later | 2 | 141 | Mean Difference (IV, Random, 95% CI) | ‐0.81 [‐1.34, ‐0.28] |
| 26 Pain intensity (experience of moderate to severe pain) Show forest plot | 1 | Risk Ratio (M‐H, Fixed, 95% CI) | Subtotals only | |
| 26.1 Ordinal description as moderate to severe, 30 mins after randomisation | 1 | 120 | Risk Ratio (M‐H, Fixed, 95% CI) | 0.75 [0.62, 0.91] |
| 26.2 VAS scale 8 to 10, 30 mins after randomisation | 1 | 120 | Risk Ratio (M‐H, Fixed, 95% CI) | 0.72 [0.58, 0.90] |
| 26.3 Ordinal scale pain faces 4 to 5, 30 mins after randomisation | 1 | 120 | Risk Ratio (M‐H, Fixed, 95% CI) | 0.67 [0.51, 0.90] |
| 26.4 Ordinal description as moderate to severe, 1 hr after randomisation | 1 | 117 | Risk Ratio (M‐H, Fixed, 95% CI) | 0.76 [0.63, 0.91] |
| 26.5 VAS scale 8 to 10, 1 hr after randomisation | 1 | 117 | Risk Ratio (M‐H, Fixed, 95% CI) | 1.21 [0.69, 2.11] |
| 26.6 Ordinal scale pain faces 4 to 5, 1 hr after randomisation | 1 | 117 | Risk Ratio (M‐H, Fixed, 95% CI) | 0.68 [0.53, 0.86] |
| 26.7 Ordinal description as moderate to severe, 2 hrs after randomisation | 1 | 57 | Risk Ratio (M‐H, Fixed, 95% CI) | 0.76 [0.59, 0.98] |
| 26.8 VAS scale 8 to 10, 2 hrs after randomisation | 1 | 57 | Risk Ratio (M‐H, Fixed, 95% CI) | 0.83 [0.66, 1.05] |
| 26.9 Ordinal scale pain faces 4 to 5, 2 hrs after randomisation | 1 | 57 | Risk Ratio (M‐H, Fixed, 95% CI) | 0.72 [0.52, 0.98] |
| 26.10 Ordinal description as moderate to severe, 3 hrs after randomisation | 1 | 32 | Risk Ratio (M‐H, Fixed, 95% CI) | 0.52 [0.23, 1.16] |
| 26.11 VAS scale 8 to 10, 3 hrs after randomisation | 1 | 32 | Risk Ratio (M‐H, Fixed, 95% CI) | 0.69 [0.39, 1.23] |
| 26.12 Ordinal scale pain faces 4 to 5, 3 hrs after randomisation | 1 | 32 | Risk Ratio (M‐H, Fixed, 95% CI) | 0.57 [0.25, 1.27] |
| 26.13 Ordinal description as moderate to severe, 24 hrs after randomisation | 1 | 119 | Risk Ratio (M‐H, Fixed, 95% CI) | 0.64 [0.50, 0.82] |
| 26.14 VAS scale 8 to 10, 24 hrs after randomisation | 1 | 119 | Risk Ratio (M‐H, Fixed, 95% CI) | 0.62 [0.49, 0.80] |
| 26.15 Ordinal scale pain faces 4 to 5, 24 hrs after randomisation | 1 | 119 | Risk Ratio (M‐H, Fixed, 95% CI) | 0.69 [0.54, 0.87] |
| 27 Systolic blood pressure Show forest plot | 1 | 120 | Mean Difference (IV, Fixed, 95% CI) | ‐7.20 [‐13.12, ‐1.28] |
| 28 Diastolic blood pressure Show forest plot | 1 | 120 | Mean Difference (IV, Fixed, 95% CI) | ‐10.20 [‐13.70, ‐6.70] |
| 29 Mean arterial blood pressure Show forest plot | 1 | 120 | Mean Difference (IV, Fixed, 95% CI) | ‐10.5 [‐14.68, ‐6.32] |
| 30 Preference for care in subsequent labour (Does not wish to use bath with next labour/birth) Show forest plot | 1 | 119 | Risk Ratio (M‐H, Fixed, 95% CI) | 0.38 [0.14, 0.98] |
| 31 Postpartum depression (EPDS more than 11) Show forest plot | 2 | 370 | Risk Ratio (M‐H, Fixed, 95% CI) | 1.38 [0.85, 2.24] |
| 32 Abnormal fetal heart rate patterns Show forest plot | 3 | 487 | Risk Ratio (M‐H, Random, 95% CI) | 0.75 [0.34, 1.67] |
| 33 Presence of meconium‐stained liquor Show forest plot | 4 | 1200 | Risk Ratio (M‐H, Random, 95% CI) | 0.92 [0.64, 1.33] |
| 34 Apgar score less than seven at five minutes Show forest plot | 5 | 1834 | Risk Ratio (M‐H, Fixed, 95% CI) | 1.58 [0.63, 3.93] |
| 35 Apgar score at five minutes Show forest plot | 2 | 893 | Mean Difference (IV, Fixed, 95% CI) | ‐0.03 [‐0.11, 0.06] |
| 36 Umbilical artery pH less than 7.20 Show forest plot | 1 | 110 | Risk Ratio (M‐H, Fixed, 95% CI) | 5.18 [0.25, 105.51] |
| 37 Breastfeeding ‐ not breastfeeding after six weeks post birth Show forest plot | 2 | 363 | Risk Ratio (M‐H, Fixed, 95% CI) | 1.17 [0.64, 2.15] |
| Outcome or subgroup title | No. of studies | No. of participants | Statistical method | Effect size |
| 1 Mode of birth (spontaneous vaginal birth) Show forest plot | 1 | 120 | Risk Ratio (M‐H, Fixed, 95% CI) | 1.02 [0.96, 1.08] |
| 2 Mode of birth (instrumental vaginal births) Show forest plot | 1 | 120 | Risk Ratio (M‐H, Fixed, 95% CI) | 1.0 [0.06, 15.62] |
| 3 Mode of birth (caesarean section) Show forest plot | 1 | 120 | Risk Ratio (M‐H, Fixed, 95% CI) | 0.33 [0.01, 8.02] |
| 4 Perinatal deaths Show forest plot | 1 | 120 | Risk Ratio (M‐H, Fixed, 95% CI) | 3.0 [0.12, 72.20] |
| 5 Admission to neonatal intensive care unit Show forest plot | 2 | 291 | Risk Ratio (M‐H, Fixed, 95% CI) | 0.78 [0.38, 1.59] |
| 6 Neonate temperature Show forest plot | 1 | Risk Ratio (M‐H, Fixed, 95% CI) | Subtotals only | |
| 6.1 Temperature less than 36.2 degrees C at birth | 1 | 109 | Risk Ratio (M‐H, Fixed, 95% CI) | 0.98 [0.30, 3.20] |
| 6.2 Temperature greater than 37.5 degrees C at birth | 1 | 109 | Risk Ratio (M‐H, Fixed, 95% CI) | 2.62 [0.73, 9.35] |
| 7 Fever reported in first week Show forest plot | 1 | 171 | Risk Ratio (M‐H, Fixed, 95% CI) | 0.53 [0.10, 2.82] |
| 8 Postpartum haemorrhage more than 500 mL Show forest plot | 1 | 120 | Risk Ratio (M‐H, Fixed, 95% CI) | 0.14 [0.01, 2.71] |
| 9 Duration of second stage (minutes) Show forest plot | 2 | 291 | Mean Difference (IV, Fixed, 95% CI) | ‐1.83 [‐8.18, 4.52] |
| 10 Perineal trauma (episiotomy) Show forest plot | 1 | 119 | Risk Ratio (M‐H, Fixed, 95% CI) | 0.74 [0.17, 3.15] |
| 11 Perineal trauma (second degree tear) Show forest plot | 1 | 119 | Risk Ratio (M‐H, Fixed, 95% CI) | 1.16 [0.57, 2.38] |
| 12 Experience of moderate to severe pain Show forest plot | 1 | 117 | Risk Ratio (M‐H, Fixed, 95% CI) | 1.06 [0.73, 1.53] |
| 12.1 Ordinal description as moderate to severe | 1 | 117 | Risk Ratio (M‐H, Fixed, 95% CI) | 1.06 [0.73, 1.53] |
| 13 Preference for care in subsequent labour (Does not wish to use bath next birth) Show forest plot | 1 | 117 | Risk Ratio (M‐H, Fixed, 95% CI) | 0.57 [0.22, 1.47] |
| 14 Satisfied with labour Show forest plot | 1 | 117 | Risk Ratio (M‐H, Fixed, 95% CI) | 0.24 [0.07, 0.80] |
| 14.1 Little or not satisfied with coping experience | 1 | 117 | Risk Ratio (M‐H, Fixed, 95% CI) | 0.24 [0.07, 0.80] |
| 15 Presence of meconium‐stained liquor Show forest plot | 1 | 120 | Risk Ratio (M‐H, Fixed, 95% CI) | 1.4 [0.47, 4.17] |
| 16 Apgar score less than seven (five minutes) Show forest plot | 1 | 119 | Risk Ratio (M‐H, Fixed, 95% CI) | 4.92 [0.24, 100.31] |
| 17 Mean Apgar at five minutes Show forest plot | 1 | 171 | Mean Difference (IV, Fixed, 95% CI) | ‐0.10 [‐0.22, 0.02] |
| 18 Umbilical artery pH less than 7.20 Show forest plot | 1 | 116 | Risk Ratio (M‐H, Fixed, 95% CI) | 0.89 [0.45, 1.75] |
| Outcome or subgroup title | No. of studies | No. of participants | Statistical method | Effect size |
| 1 Mode of birth (spontaneous vaginal birth) Show forest plot | 9 | 2845 | Risk Ratio (M‐H, Random, 95% CI) | 1.03 [0.99, 1.09] |
| 2 Mode of birth (instrumental vaginal births) Show forest plot | 8 | 2739 | Risk Ratio (M‐H, Fixed, 95% CI) | 0.86 [0.70, 1.04] |
| 3 Mode of birth (caesarean section) Show forest plot | 9 | 2832 | Risk Ratio (M‐H, Fixed, 95% CI) | 1.19 [0.86, 1.65] |
| 4 Use of analgesia (regional) Show forest plot | 6 | 2499 | Risk Ratio (M‐H, Fixed, 95% CI) | 0.90 [0.82, 0.98] |
| 5 Perineal trauma (third‐ or fourth‐degree tears) Show forest plot | 5 | 2401 | Risk Ratio (M‐H, Fixed, 95% CI) | 1.37 [0.86, 2.17] |
| 6 Perinatal deaths Show forest plot | 1 | 120 | Risk Ratio (M‐H, Fixed, 95% CI) | 3.0 [0.12, 72.20] |
| 7 Admission to neonatal intensive care unit Show forest plot | 5 | 1862 | Risk Ratio (M‐H, Fixed, 95% CI) | 0.99 [0.70, 1.39] |
| 8 Neonatal infection Show forest plot | 5 | 1295 | Risk Ratio (M‐H, Fixed, 95% CI) | 2.00 [0.50, 7.94] |
| 9 Neonate temperature Show forest plot | 2 | Risk Ratio (M‐H, Fixed, 95% CI) | Subtotals only | |
| 9.1 Temperature greater than 37.8 degrees C as an indicator for infection | 1 | 274 | Risk Ratio (M‐H, Fixed, 95% CI) | 1.0 [0.06, 15.83] |
| 9.2 Temperature less than 36.2 degrees C at birth | 1 | 109 | Risk Ratio (M‐H, Fixed, 95% CI) | 0.98 [0.30, 3.20] |
| 9.3 Temperature greater than 37.5 degrees C at birth | 1 | 109 | Risk Ratio (M‐H, Fixed, 95% CI) | 2.62 [0.73, 9.35] |
| 10 Fever reported in first week Show forest plot | 1 | 171 | Risk Ratio (M‐H, Fixed, 95% CI) | 0.53 [0.10, 2.82] |
| 11 Antibiotics given to neonate Show forest plot | 1 | 60 | Risk Ratio (M‐H, Fixed, 95% CI) | 1.5 [0.17, 13.52] |
| 12 Estimated blood loss (mL) Show forest plot | 3 | 273 | Mean Difference (IV, Fixed, 95% CI) | ‐6.28 [‐13.67, 1.11] |
| 13 Postpartum haemorrhage Show forest plot | 2 | 394 | Risk Ratio (M‐H, Random, 95% CI) | 0.73 [0.08, 6.90] |
| 14 Use of analgesia (pharmacological ‐ pethidine/narcotic) Show forest plot | 4 | 1240 | Risk Ratio (M‐H, Random, 95% CI) | 0.85 [0.46, 1.56] |
| 15 Use of analgesia (pharmacological ‐ any) Show forest plot | 2 | 394 | Risk Ratio (M‐H, Fixed, 95% CI) | 1.05 [0.80, 1.39] |
| 16 Use of any analgesia Show forest plot | 5 | 653 | Risk Ratio (M‐H, Random, 95% CI) | 0.72 [0.46, 1.12] |
| 17 Maternal infection during labour/postnatal period (perineal, systemic, uterine or increase in temperature) Show forest plot | 5 | 1295 | Risk Ratio (M‐H, Fixed, 95% CI) | 0.99 [0.50, 1.96] |
| 18 Artificial rupture of membranes Show forest plot | 3 | 926 | Risk Ratio (M‐H, Fixed, 95% CI) | 1.02 [0.90, 1.16] |
| 19 Use of oxytocin for augmentation of labour Show forest plot | 5 | 1125 | Risk Ratio (M‐H, Random, 95% CI) | 0.64 [0.32, 1.28] |
| 20 Use of non‐pharmacological analgesia (transcutaneous nerve stimulation (TENS)) Show forest plot | 2 | 845 | Risk Ratio (M‐H, Fixed, 95% CI) | 1.05 [0.37, 2.94] |
| 21 Duration of first stage (minutes) Show forest plot | 8 | 1561 | Mean Difference (IV, Random, 95% CI) | ‐42.21 [‐80.93, ‐3.49] |
| 22 Duration of second stage (minutes) Show forest plot | 11 | 1960 | Mean Difference (IV, Random, 95% CI) | ‐2.85 [‐8.85, 3.16] |
| 23 Duration of third stage (minutes) Show forest plot | 3 | 1165 | Mean Difference (IV, Random, 95% CI) | ‐0.52 [‐1.84, 0.79] |
| 24 Duration of total labour (all three stages) Show forest plot | 2 | 240 | Mean Difference (IV, Fixed, 95% CI) | ‐40.83 [‐87.09, 5.43] |
| 25 Perineal trauma (none‐ intact) Show forest plot | 5 | 1337 | Risk Ratio (M‐H, Fixed, 95% CI) | 1.16 [0.99, 1.35] |
| 26 Perineal trauma (first‐ and second‐degree tears) Show forest plot | 7 | Risk Ratio (M‐H, Fixed, 95% CI) | Subtotals only | |
| 26.1 Second‐degree tear | 7 | 1525 | Risk Ratio (M‐H, Fixed, 95% CI) | 0.89 [0.71, 1.10] |
| 27 Perineal trauma (episiotomy) Show forest plot | 7 | 1511 | Risk Ratio (M‐H, Random, 95% CI) | 0.88 [0.67, 1.17] |
| 28 Self reports pain score on visual analogue scale of 0‐10 Show forest plot | 3 | Mean Difference (IV, Random, 95% CI) | Subtotals only | |
| 28.1 Pain score at start of assessment period (time zero) | 2 | 141 | Mean Difference (IV, Random, 95% CI) | 0.15 [‐0.79, 1.08] |
| 28.2 Pain score up to 60 minutes later | 2 | 141 | Mean Difference (IV, Random, 95% CI) | ‐0.81 [‐1.34, ‐0.28] |
| 28.3 overall pain score (assessed once post labour) | 1 | 100 | Mean Difference (IV, Random, 95% CI) | ‐3.43 [‐3.95, ‐2.91] |
| 29 Pain intensity (experience of moderate to severe pain) Show forest plot | 2 | Risk Ratio (M‐H, Fixed, 95% CI) | Subtotals only | |
| 29.1 Ordinal description as moderate to severe, 30 mins after randomisation | 1 | 120 | Risk Ratio (M‐H, Fixed, 95% CI) | 0.75 [0.62, 0.91] |
| 29.2 VAS scale 8 to 10, 30 mins after randomisation | 1 | 120 | Risk Ratio (M‐H, Fixed, 95% CI) | 0.72 [0.58, 0.90] |
| 29.3 Ordinal scale pain faces 4 to 5, 30 mins after randomisation | 1 | 120 | Risk Ratio (M‐H, Fixed, 95% CI) | 0.67 [0.51, 0.90] |
| 29.4 Ordinal description as moderate to severe, 1 hr after randomisation | 1 | 117 | Risk Ratio (M‐H, Fixed, 95% CI) | 0.76 [0.63, 0.91] |
| 29.5 VAS scale 8 to 10, 1 hr after randomisation | 1 | 117 | Risk Ratio (M‐H, Fixed, 95% CI) | 1.21 [0.69, 2.11] |
| 29.6 Ordinal scale pain faces 4 to 5, 1 hr after randomisation | 1 | 117 | Risk Ratio (M‐H, Fixed, 95% CI) | 0.68 [0.53, 0.86] |
| 29.7 Ordinal description as moderate to severe, 2 hrs after randomisation | 1 | 57 | Risk Ratio (M‐H, Fixed, 95% CI) | 0.76 [0.59, 0.98] |
| 29.8 VAS scale 8 to 10, 2 hrs after randomisation | 1 | 57 | Risk Ratio (M‐H, Fixed, 95% CI) | 0.83 [0.66, 1.05] |
| 29.9 Ordinal scale pain faces 4 to 5, 2 hrs after randomisation | 1 | 57 | Risk Ratio (M‐H, Fixed, 95% CI) | 0.72 [0.52, 0.98] |
| 29.10 Ordinal description as moderate to severe, 3 hrs after randomisation | 1 | 32 | Risk Ratio (M‐H, Fixed, 95% CI) | 0.52 [0.23, 1.16] |
| 29.11 VAS scale 8 to 10, 3 hrs after randomisation | 1 | 32 | Risk Ratio (M‐H, Fixed, 95% CI) | 0.69 [0.39, 1.23] |
| 29.12 Ordinal scale pain faces 4 to 5, 3 hrs after randomisation | 1 | 32 | Risk Ratio (M‐H, Fixed, 95% CI) | 0.57 [0.25, 1.27] |
| 29.13 Ordinal description as moderate to severe, 24 hrs after randomisation | 1 | 119 | Risk Ratio (M‐H, Fixed, 95% CI) | 0.64 [0.50, 0.82] |
| 29.14 VAS scale 8 to 10, 24 hrs after randomisation | 1 | 119 | Risk Ratio (M‐H, Fixed, 95% CI) | 0.62 [0.49, 0.80] |
| 29.15 Ordinal scale pain faces 4 to 5, 24 hrs after randomisation | 1 | 119 | Risk Ratio (M‐H, Fixed, 95% CI) | 0.69 [0.54, 0.87] |
| 29.16 Ordinal description as moderate to severe | 1 | 117 | Risk Ratio (M‐H, Fixed, 95% CI) | 1.06 [0.73, 1.53] |
| 30 Maternal temperature Show forest plot | 1 | 60 | Mean Difference (IV, Fixed, 95% CI) | 0.20 [‐0.18, 0.58] |
| 31 Systolic blood pressure Show forest plot | 1 | 120 | Mean Difference (IV, Fixed, 95% CI) | ‐7.20 [‐13.12, ‐1.28] |
| 32 Diastolic blood pressure Show forest plot | 1 | 120 | Mean Difference (IV, Fixed, 95% CI) | ‐10.20 [‐13.70, ‐6.70] |
| 33 Mean arterial blood pressure Show forest plot | 1 | 120 | Mean Difference (IV, Fixed, 95% CI) | ‐10.5 [‐14.68, ‐6.32] |
| 34 Preference for care in subsequent labour (Does not wish to use bath with next labour/birth) Show forest plot | 2 | 236 | Risk Ratio (M‐H, Fixed, 95% CI) | 0.46 [0.24, 0.90] |
| 35 Satisfied with labour Show forest plot | 1 | 117 | Risk Ratio (M‐H, Fixed, 95% CI) | 0.24 [0.07, 0.80] |
| 35.1 Little or not satisfied with coping experience | 1 | 117 | Risk Ratio (M‐H, Fixed, 95% CI) | 0.24 [0.07, 0.80] |
| 36 Satisfied with labour on scale Show forest plot | 1 | 60 | Mean Difference (IV, Fixed, 95% CI) | 0.03 [‐0.64, 0.70] |
| 37 Postpartum depression (EPDS more than 11) Show forest plot | 2 | 370 | Risk Ratio (M‐H, Fixed, 95% CI) | 1.38 [0.85, 2.24] |
| 38 Abnormal fetal heart rate patterns Show forest plot | 3 | 487 | Risk Ratio (M‐H, Random, 95% CI) | 0.75 [0.34, 1.67] |
| 39 Presence of meconium‐stained liquor Show forest plot | 6 | 1380 | Risk Ratio (M‐H, Fixed, 95% CI) | 0.97 [0.78, 1.21] |
| 40 Apgar score less than seven at five minutes Show forest plot | 6 | 1953 | Risk Ratio (M‐H, Fixed, 95% CI) | 1.79 [0.76, 4.25] |
| 41 Apgar score at five minutes Show forest plot | 4 | 1184 | Mean Difference (IV, Fixed, 95% CI) | ‐0.04 [‐0.11, 0.02] |
| 42 Umbilical artery pH less than 7.20 Show forest plot | 2 | 226 | Risk Ratio (M‐H, Fixed, 95% CI) | 1.04 [0.54, 1.98] |
| 43 Breastfeeding Show forest plot | 1 | 60 | Risk Ratio (M‐H, Fixed, 95% CI) | 0.86 [0.69, 1.08] |
| 44 Not breastfeeding after six weeks post birth Show forest plot | 2 | 363 | Risk Ratio (M‐H, Fixed, 95% CI) | 1.17 [0.64, 2.15] |
| Outcome or subgroup title | No. of studies | No. of participants | Statistical method | Effect size |
| 1 Use of pharmacological analgesia (epidural/spinal analgesia/paracervical block) Show forest plot | 1 | 200 | Risk Ratio (M‐H, Fixed, 95% CI) | 2.21 [1.39, 3.52] |
| 2 Neonatal infection Show forest plot | 1 | 200 | Risk Ratio (M‐H, Fixed, 95% CI) | 3.0 [0.12, 72.77] |
| 3 Use of oxytocin Show forest plot | 1 | 200 | Risk Ratio (M‐H, Fixed, 95% CI) | 1.9 [1.35, 2.68] |
| 4 Abnormal fetal heart rate patterns Show forest plot | 1 | 200 | Risk Ratio (M‐H, Fixed, 95% CI) | 0.0 [0.0, 0.0] |
| 5 Apgar score less than seven at one minute Show forest plot | 1 | 200 | Risk Ratio (M‐H, Fixed, 95% CI) | 0.0 [0.0, 0.0] |