| 1 Death or dependency, end of trial by intervention Show forest plot | 16 | 15489 | Odds Ratio (IV, Random, 95% CI) | 0.98 [0.92, 1.05] |
|
| 1.1 ACE inhibitors | 2 | 126 | Odds Ratio (IV, Random, 95% CI) | 1.12 [0.53, 2.36] |
| 1.2 ARA(po) | 3 | 3737 | Odds Ratio (IV, Random, 95% CI) | 1.07 [0.93, 1.23] |
| 1.3 Beta‐blockers | 1 | 86 | Odds Ratio (IV, Random, 95% CI) | 1.03 [0.42, 2.55] |
| 1.4 Nitric oxide donor | 7 | 4194 | Odds Ratio (IV, Random, 95% CI) | 0.97 [0.86, 1.10] |
| 1.5 Low BP target | 4 | 7346 | Odds Ratio (IV, Random, 95% CI) | 0.95 [0.86, 1.04] |
| 2 Death or dependency, end of trial by stroke type Show forest plot | 16 | 15366 | Odds Ratio (M‐H, Random, 95% CI) | 0.98 [0.92, 1.05] |
|
| 2.1 Ischaemic stroke | 8 | 11015 | Odds Ratio (M‐H, Random, 95% CI) | 1.00 [0.92, 1.08] |
| 2.2 Combined Ischaemic stroke and Intracerebral haemorrhage | 5 | 142 | Odds Ratio (M‐H, Random, 95% CI) | 1.31 [0.64, 2.65] |
| 2.3 Intracerebral haemorrhage | 7 | 4209 | Odds Ratio (M‐H, Random, 95% CI) | 1.01 [0.84, 1.21] |
| 3 Death or dependency, end of trial by stroke location Show forest plot | 6 | 11950 | Odds Ratio (M‐H, Random, 95% CI) | 0.94 [0.87, 1.01] |
|
| 3.1 Intracerebral haemorrhage, deep | 3 | 2536 | Odds Ratio (M‐H, Random, 95% CI) | 0.86 [0.73, 1.00] |
| 3.2 Intracerebral haemorrhage, superficial | 3 | 851 | Odds Ratio (M‐H, Random, 95% CI) | 1.02 [0.77, 1.35] |
| 3.3 Ischaemic stroke, cortical | 4 | 6180 | Odds Ratio (M‐H, Random, 95% CI) | 0.94 [0.81, 1.09] |
| 3.4 Ischaemic stroke, subcortical | 4 | 2383 | Odds Ratio (M‐H, Random, 95% CI) | 0.98 [0.76, 1.27] |
| 4 Death or dependency, end of trial by time to treatment Show forest plot | 16 | 15489 | Odds Ratio (M‐H, Random, 95% CI) | 0.98 [0.92, 1.05] |
|
| 4.1 Ultra‐acute/pre‐hospital | 1 | 41 | Odds Ratio (M‐H, Random, 95% CI) | 0.36 [0.09, 1.43] |
| 4.2 Hyper‐acute | 3 | 3506 | Odds Ratio (M‐H, Random, 95% CI) | 0.87 [0.76, 0.99] |
| 4.3 Acute | 7 | 10440 | Odds Ratio (M‐H, Random, 95% CI) | 1.02 [0.94, 1.11] |
| 4.4 Subacute | 6 | 1502 | Odds Ratio (M‐H, Random, 95% CI) | 1.05 [0.84, 1.31] |
| 5 Death, early by intervention Show forest plot | 16 | 10050 | Odds Ratio (IV, Random, 95% CI) | 0.97 [0.74, 1.28] |
|
| 5.1 ACE inhibitors (po) | 4 | 164 | Odds Ratio (IV, Random, 95% CI) | 0.51 [0.06, 4.34] |
| 5.2 ARA (po) | 2 | 1379 | Odds Ratio (IV, Random, 95% CI) | 0.45 [0.05, 3.97] |
| 5.3 Beta‐blockers | 1 | 86 | Odds Ratio (IV, Random, 95% CI) | 0.25 [0.02, 2.93] |
| 5.4 Calcium channel blockers (po) | 1 | 77 | Odds Ratio (IV, Random, 95% CI) | 0.65 [0.17, 2.50] |
| 5.5 Calcium channel blockers (iv) | 1 | 11 | Odds Ratio (IV, Random, 95% CI) | 2.69 [0.10, 73.20] |
| 5.6 Nitric oxide donor | 7 | 4189 | Odds Ratio (IV, Random, 95% CI) | 0.79 [0.37, 1.72] |
| 5.7 Low BP target | 2 | 4144 | Odds Ratio (IV, Random, 95% CI) | 1.10 [0.66, 1.83] |
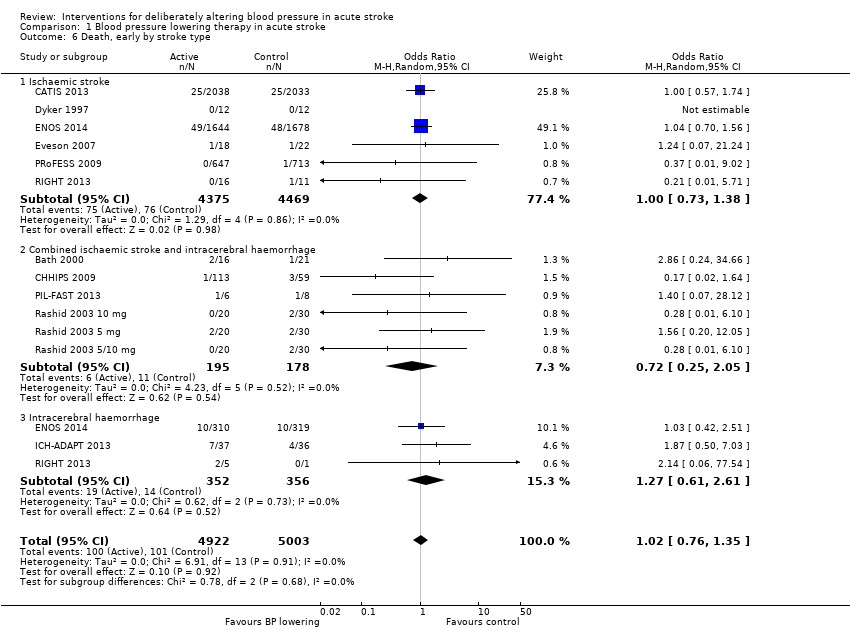
| 6 Death, early by stroke type Show forest plot | 13 | 9925 | Odds Ratio (M‐H, Random, 95% CI) | 1.02 [0.76, 1.35] |
|
| 6.1 Ischaemic stroke | 6 | 8844 | Odds Ratio (M‐H, Random, 95% CI) | 1.00 [0.73, 1.38] |
| 6.2 Combined ischaemic stroke and intracerebral haemorrhage | 6 | 373 | Odds Ratio (M‐H, Random, 95% CI) | 0.72 [0.25, 2.05] |
| 6.3 Intracerebral haemorrhage | 3 | 708 | Odds Ratio (M‐H, Random, 95% CI) | 1.27 [0.61, 2.61] |
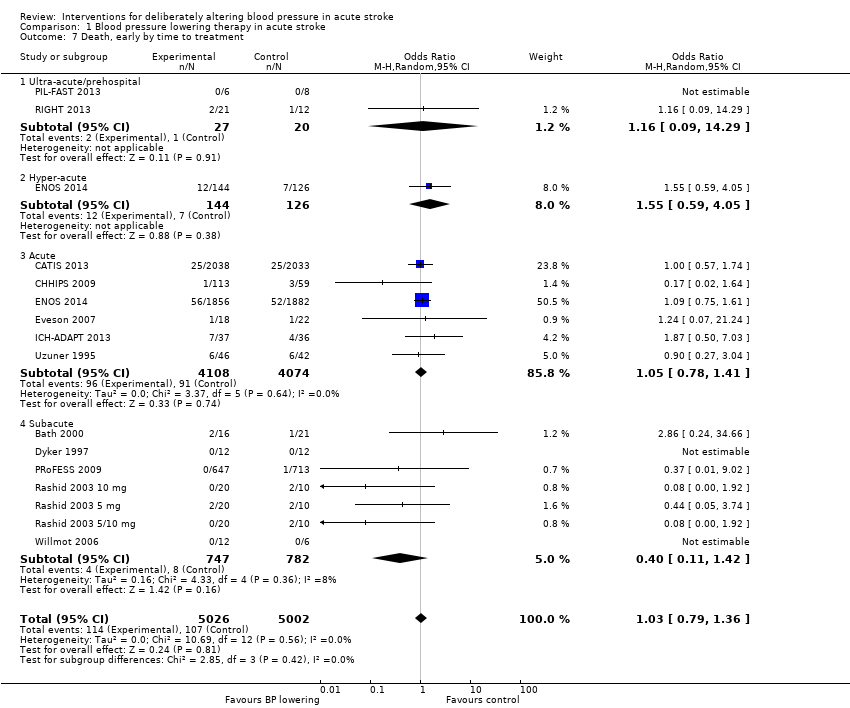
| 7 Death, early by time to treatment Show forest plot | 15 | 10028 | Odds Ratio (M‐H, Random, 95% CI) | 1.03 [0.79, 1.36] |
|
| 7.1 Ultra‐acute/prehospital | 2 | 47 | Odds Ratio (M‐H, Random, 95% CI) | 1.16 [0.09, 14.29] |
| 7.2 Hyper‐acute | 1 | 270 | Odds Ratio (M‐H, Random, 95% CI) | 1.55 [0.59, 4.05] |
| 7.3 Acute | 6 | 8182 | Odds Ratio (M‐H, Random, 95% CI) | 1.05 [0.78, 1.41] |
| 7.4 Subacute | 7 | 1529 | Odds Ratio (M‐H, Random, 95% CI) | 0.40 [0.11, 1.42] |
| 8 Death, end of trial by intervention Show forest plot | 20 | 15818 | Odds Ratio (IV, Random, 95% CI) | 0.95 [0.84, 1.06] |
|
| 8.1 ACE inhibitors (po) | 4 | 165 | Odds Ratio (IV, Random, 95% CI) | 0.47 [0.15, 1.48] |
| 8.2 ARA (po) | 5 | 4120 | Odds Ratio (IV, Random, 95% CI) | 0.92 [0.59, 1.44] |
| 8.3 Beta‐blockers | 1 | 86 | Odds Ratio (IV, Random, 95% CI) | 0.57 [0.17, 1.89] |
| 8.4 Nitric oxide donor | 7 | 4197 | Odds Ratio (IV, Random, 95% CI) | 0.86 [0.72, 1.04] |
| 8.5 Low BP target | 4 | 7250 | Odds Ratio (IV, Random, 95% CI) | 1.04 [0.87, 1.25] |
| 9 Death, end of trial by stroke type Show forest plot | 20 | 15750 | Odds Ratio (M‐H, Random, 95% CI) | 0.95 [0.84, 1.07] |
|
| 9.1 Ischaemic stroke | 10 | 11238 | Odds Ratio (M‐H, Random, 95% CI) | 0.95 [0.78, 1.16] |
| 9.2 Combined ischaemic stroke and intracerebral haemorrhage | 7 | 328 | Odds Ratio (M‐H, Random, 95% CI) | 0.59 [0.29, 1.22] |
| 9.3 Intracerebral haemorrhage | 6 | 4184 | Odds Ratio (M‐H, Random, 95% CI) | 0.98 [0.82, 1.18] |
| 10 Death, end of trial by time to treatment Show forest plot | 20 | 15818 | Odds Ratio (M‐H, Random, 95% CI) | 0.90 [0.75, 1.08] |
|
| 10.1 Ultra‐acute/pre‐hospital | 2 | 52 | Odds Ratio (M‐H, Random, 95% CI) | 0.47 [0.11, 2.07] |
| 10.2 Hyper‐acute | 3 | 3506 | Odds Ratio (M‐H, Random, 95% CI) | 0.70 [0.38, 1.26] |
| 10.3 Acute | 8 | 10708 | Odds Ratio (M‐H, Random, 95% CI) | 0.97 [0.77, 1.22] |
| 10.4 Subacute | 8 | 1552 | Odds Ratio (M‐H, Random, 95% CI) | 0.92 [0.39, 2.15] |
| 11 Barthel Index, end of trial, by intervention Show forest plot | 2 | 4350 | Mean Difference (IV, Random, 95% CI) | 0.63 [‐3.28, 4.54] |
|
| 11.1 ARA | 1 | 339 | Mean Difference (IV, Random, 95% CI) | ‐1.90 [‐6.46, 2.66] |
| 11.2 Nitric oxide donor | 1 | 4011 | Mean Difference (IV, Random, 95% CI) | 2.20 [‐0.20, 4.60] |
| 12 Barthel Index, end of trial, by stroke type Show forest plot | 2 | 4310 | Mean Difference (IV, Random, 95% CI) | 1.33 [‐1.04, 3.69] |
|
| 12.1 Ischaemic stroke | 2 | 3681 | Mean Difference (IV, Random, 95% CI) | 0.84 [‐3.21, 4.89] |
| 12.2 Intracerebral haemorrhage | 1 | 629 | Mean Difference (IV, Random, 95% CI) | 0.90 [‐5.18, 6.98] |
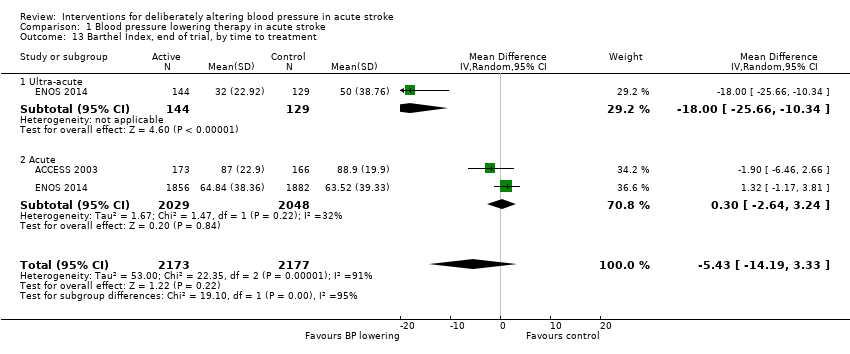
| 13 Barthel Index, end of trial, by time to treatment Show forest plot | 2 | 4350 | Mean Difference (IV, Random, 95% CI) | ‐5.43 [‐14.19, 3.33] |
|
| 13.1 Ultra‐acute | 1 | 273 | Mean Difference (IV, Random, 95% CI) | ‐18.0 [‐25.66, ‐10.34] |
| 13.2 Acute | 2 | 4077 | Mean Difference (IV, Random, 95% CI) | 0.30 [‐2.64, 3.24] |
| 14 Early neurological deterioration, by intervention Show forest plot | 7 | 7575 | Odds Ratio (M‐H, Random, 95% CI) | 1.07 [0.92, 1.24] |
|
| 14.1 ACE inhibitors | 1 | 86 | Odds Ratio (M‐H, Random, 95% CI) | 1.59 [0.30, 8.41] |
| 14.2 Beta‐blockers | 1 | 86 | Odds Ratio (M‐H, Random, 95% CI) | 0.53 [0.03, 8.74] |
| 14.3 Nitric oxide donor | 2 | 4052 | Odds Ratio (M‐H, Random, 95% CI) | 1.14 [0.66, 1.98] |
| 14.4 Low BP target | 4 | 3351 | Odds Ratio (M‐H, Random, 95% CI) | 0.97 [0.80, 1.18] |
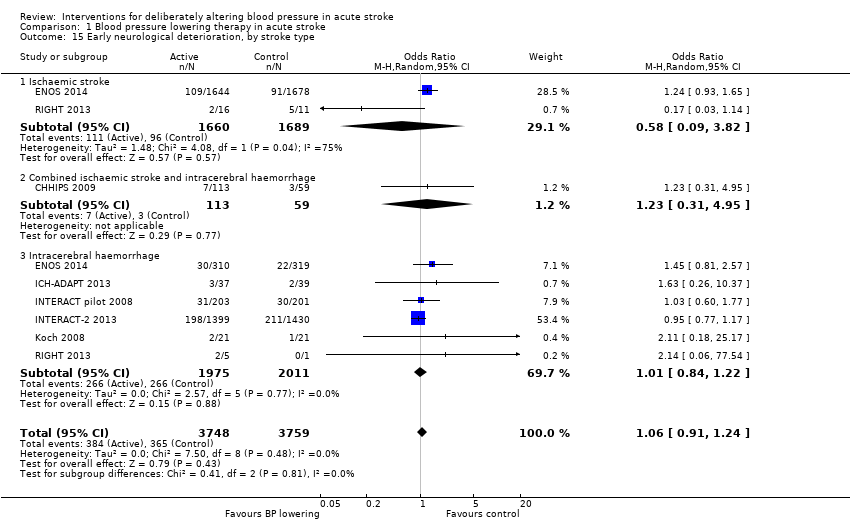
| 15 Early neurological deterioration, by stroke type Show forest plot | 7 | 7507 | Odds Ratio (M‐H, Random, 95% CI) | 1.06 [0.91, 1.24] |
|
| 15.1 Ischaemic stroke | 2 | 3349 | Odds Ratio (M‐H, Random, 95% CI) | 0.58 [0.09, 3.82] |
| 15.2 Combined ischaemic stroke and intracerebral haemorrhage | 1 | 172 | Odds Ratio (M‐H, Random, 95% CI) | 1.23 [0.31, 4.95] |
| 15.3 Intracerebral haemorrhage | 6 | 3986 | Odds Ratio (M‐H, Random, 95% CI) | 1.01 [0.84, 1.22] |
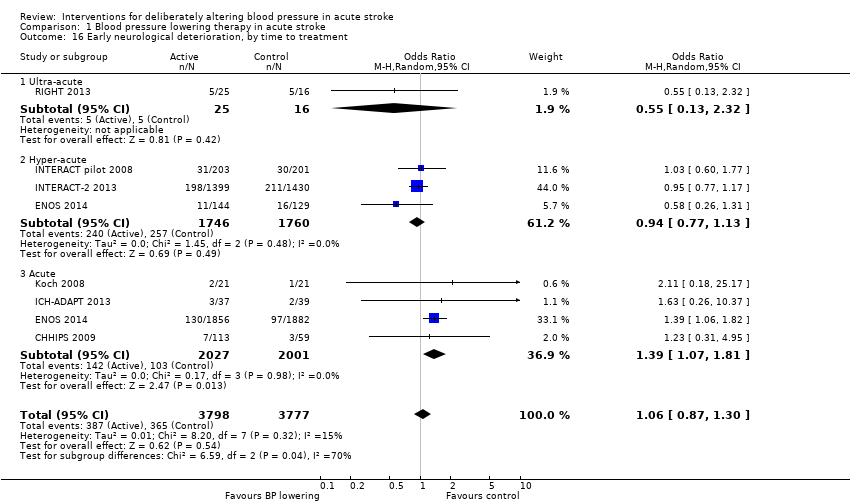
| 16 Early neurological deterioration, by time to treatment Show forest plot | 7 | 7575 | Odds Ratio (M‐H, Random, 95% CI) | 1.06 [0.87, 1.30] |
|
| 16.1 Ultra‐acute | 1 | 41 | Odds Ratio (M‐H, Random, 95% CI) | 0.55 [0.13, 2.32] |
| 16.2 Hyper‐acute | 3 | 3506 | Odds Ratio (M‐H, Random, 95% CI) | 0.94 [0.77, 1.13] |
| 16.3 Acute | 4 | 4028 | Odds Ratio (M‐H, Random, 95% CI) | 1.39 [1.07, 1.81] |
| 17 Quality of life (EuroQol) at end of trial, by intervention Show forest plot | 3 | 6881 | Mean Difference (IV, Fixed, 95% CI) | 0.02 [0.01, 0.04] |
|
| 17.1 Nitric oxide donor | 2 | 4052 | Mean Difference (IV, Fixed, 95% CI) | 0.01 [‐0.01, 0.03] |
| 17.2 Low BP target | 1 | 2829 | Mean Difference (IV, Fixed, 95% CI) | 0.05 [0.02, 0.08] |
| 18 Quality of life (EuroQoL) at end of trial, by stroke type Show forest plot | 3 | 7502 | Mean Difference (IV, Random, 95% CI) | 0.03 [‐0.01, 0.07] |
|
| 18.1 Ischaemic stroke | 2 | 4038 | Mean Difference (IV, Random, 95% CI) | 0.13 [‐0.14, 0.40] |
| 18.2 Intracerebral haemorrhage | 3 | 3464 | Mean Difference (IV, Random, 95% CI) | 0.02 [‐0.03, 0.08] |
| 19 Quality of life (EuroQoL) at end of trial, by time to treatment Show forest plot | 3 | 6867 | Mean Difference (IV, Random, 95% CI) | 0.05 [‐0.00, 0.11] |
|
| 19.1 Ultra‐acute | 1 | 27 | Mean Difference (IV, Random, 95% CI) | 0.29 [0.07, 0.51] |
| 19.2 Hyperacute | 2 | 3102 | Mean Difference (IV, Random, 95% CI) | 0.06 [0.03, 0.08] |
| 19.3 Acute | 1 | 3738 | Mean Difference (IV, Random, 95% CI) | 0.0 [‐0.02, 0.02] |
| 20 Length of stay, by intervention Show forest plot | 4 | 8295 | Mean Difference (IV, Fixed, 95% CI) | ‐0.01 [‐0.30, 0.28] |
|
| 20.1 ACE inhibitors | 1 | 86 | Mean Difference (IV, Fixed, 95% CI) | ‐0.13 [‐2.11, 1.85] |
| 20.2 Beta‐blockers | 1 | 86 | Mean Difference (IV, Fixed, 95% CI) | 0.21 [‐1.76, 2.18] |
| 20.3 Nitric oxide donor | 2 | 4052 | Mean Difference (IV, Fixed, 95% CI) | ‐0.31 [‐1.76, 1.14] |
| 20.4 Low BP target | 1 | 4071 | Mean Difference (IV, Fixed, 95% CI) | 0.0 [‐0.31, 0.31] |
| 21 Length of stay, by stroke type Show forest plot | 3 | 8194 | Mean Difference (IV, Random, 95% CI) | ‐0.00 [‐0.30, 0.29] |
|
| 21.1 Ischaemic stroke | 2 | 7393 | Mean Difference (IV, Random, 95% CI) | ‐0.03 [‐0.33, 0.28] |
| 21.2 Combined ischaemic and Intracerebral haemorrhage | 1 | 172 | Mean Difference (IV, Random, 95% CI) | 0.20 [‐1.20, 1.60] |
| 21.3 Intracerebral haemorrhage | 1 | 629 | Mean Difference (IV, Random, 95% CI) | 2.60 [‐1.49, 6.69] |
| 22 Length of stay, by time to treatment Show forest plot | 4 | 8295 | Mean Difference (IV, Random, 95% CI) | ‐0.01 [‐0.30, 0.29] |
|
| 22.1 Ultra‐acute | 2 | 314 | Mean Difference (IV, Random, 95% CI) | ‐1.88 [‐6.58, 2.83] |
| 22.2 Acute | 3 | 7981 | Mean Difference (IV, Random, 95% CI) | 0.00 [‐0.29, 0.30] |
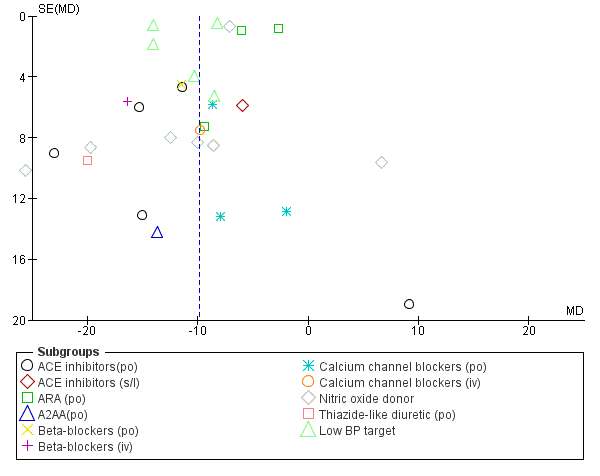
| 23 SBP, first after randomisation, by intervention Show forest plot | 24 | 15432 | Mean Difference (IV, Random, 95% CI) | ‐9.83 [‐12.11, ‐7.56] |
|
| 23.1 ACE inhibitors(po) | 5 | 123 | Mean Difference (IV, Random, 95% CI) | ‐13.68 [‐20.03, ‐7.32] |
| 23.2 ACE inhibitors (s/l) | 1 | 42 | Mean Difference (IV, Random, 95% CI) | ‐4.00 [‐17.55, 5.55] |
| 23.3 ARA (po) | 3 | 3408 | Mean Difference (IV, Random, 95% CI) | ‐4.59 [‐7.71, ‐1.48] |
| 23.4 A2AA(po) | 1 | 4 | Mean Difference (IV, Random, 95% CI) | ‐13.67 [‐41.48, 14.14] |
| 23.5 Beta‐blockers (po) | 1 | 44 | Mean Difference (IV, Random, 95% CI) | ‐11.5 [‐20.29, ‐2.71] |
| 23.6 Beta‐blockers (iv) | 1 | 41 | Mean Difference (IV, Random, 95% CI) | ‐16.40 [‐27.40, ‐5.40] |
| 23.7 Calcium channel blockers (po) | 3 | 106 | Mean Difference (IV, Random, 95% CI) | ‐7.62 [‐17.21, 1.96] |
| 23.8 Calcium channel blockers (iv) | 1 | 11 | Mean Difference (IV, Random, 95% CI) | ‐9.76 [‐24.42, 4.90] |
| 23.9 Nitric oxide donor | 7 | 4192 | Mean Difference (IV, Random, 95% CI) | ‐9.25 [‐14.54, ‐3.96] |
| 23.10 Thiazide‐like diuretic (po) | 1 | 40 | Mean Difference (IV, Random, 95% CI) | ‐20.0 [‐38.60, ‐1.40] |
| 23.11 Low BP target | 5 | 7421 | Mean Difference (IV, Random, 95% CI) | ‐11.39 [‐15.30, ‐7.49] |
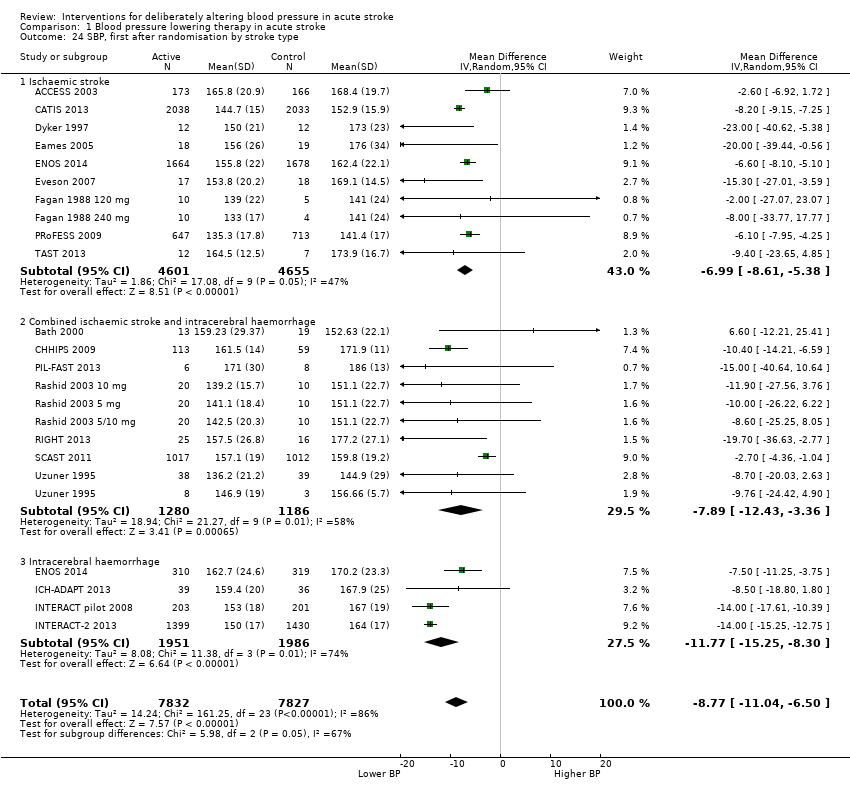
| 24 SBP, first after randomisation by stroke type Show forest plot | 22 | 15659 | Mean Difference (IV, Random, 95% CI) | ‐8.77 [‐11.04, ‐6.50] |
|
| 24.1 Ischaemic stroke | 10 | 9256 | Mean Difference (IV, Random, 95% CI) | ‐6.99 [‐8.61, ‐5.38] |
| 24.2 Combined ischaemic stroke and intracerebral haemorrhage | 9 | 2466 | Mean Difference (IV, Random, 95% CI) | ‐7.89 [‐12.43, ‐3.36] |
| 24.3 Intracerebral haemorrhage | 4 | 3937 | Mean Difference (IV, Random, 95% CI) | ‐11.77 [‐15.25, ‐8.30] |
| 25 SBP, first after randomisation by time to treatment Show forest plot | 17 | 15211 | Mean Difference (IV, Random, 95% CI) | ‐9.67 [‐12.14, ‐7.20] |
|
| 25.1 Ultra‐acute/prehospital | 2 | 55 | Mean Difference (IV, Random, 95% CI) | ‐15.98 [‐30.43, ‐1.53] |
| 25.2 Hyper‐acute | 3 | 3506 | Mean Difference (IV, Random, 95% CI) | ‐13.38 [‐15.41, ‐11.35] |
| 25.3 Acute | 6 | 10120 | Mean Difference (IV, Random, 95% CI) | ‐7.23 [‐9.83, ‐4.63] |
| 25.4 Subacute | 7 | 1530 | Mean Difference (IV, Random, 95% CI) | ‐7.26 [‐10.02, ‐4.50] |
| 26 SBP, at day 1 Show forest plot | 18 | 14203 | Mean Difference (IV, Random, 95% CI) | ‐8.33 [‐10.97, ‐5.69] |
|
| 26.1 ACE inhibitors (po) | 5 | 120 | Mean Difference (IV, Random, 95% CI) | ‐7.90 [‐16.83, 1.03] |
| 26.2 ACE inhibitors (s/l) | 1 | 42 | Mean Difference (IV, Random, 95% CI) | ‐12.0 [‐25.60, 1.60] |
| 26.3 ARA (po) | 2 | 2368 | Mean Difference (IV, Random, 95% CI) | ‐0.50 [‐2.52, 1.51] |
| 26.4 A2AA (po) | 1 | 4 | Mean Difference (IV, Random, 95% CI) | ‐21.83 [‐66.12, 22.46] |
| 26.5 Beta‐blockers(po) | 1 | 44 | Mean Difference (IV, Random, 95% CI) | ‐14.00 [‐27.28, ‐0.72] |
| 26.6 Beta‐blockers (iv) | 1 | 43 | Mean Difference (IV, Random, 95% CI) | ‐5.0 [‐18.44, 8.44] |
| 26.7 Calcium channel blockers (po) | 2 | 84 | Mean Difference (IV, Random, 95% CI) | ‐13.23 [‐43.36, 16.91] |
| 26.8 Calcium channel blockers (iv) | 1 | 11 | Mean Difference (IV, Random, 95% CI) | ‐31.90 [‐64.73, 0.93] |
| 26.9 Nitric oxide donor | 7 | 4183 | Mean Difference (IV, Random, 95% CI) | ‐12.10 [‐19.06, ‐5.14] |
| 26.10 Low BP target | 3 | 7304 | Mean Difference (IV, Random, 95% CI) | ‐10.04 [‐12.47, ‐7.61] |
| 27 SBP, at day 7 Show forest plot | 11 | 15151 | Mean Difference (IV, Random, 95% CI) | ‐6.74 [‐9.39, ‐4.10] |
|
| 27.1 ACE inhibitors | 1 | 11 | Mean Difference (IV, Random, 95% CI) | ‐26.0 [‐43.00, ‐7.00] |
| 27.2 ARA(po) | 4 | 3747 | Mean Difference (IV, Random, 95% CI) | ‐5.74 [‐7.44, ‐4.03] |
| 27.3 Thiazide‐like diuretic (po) | 1 | 37 | Mean Difference (IV, Random, 95% CI) | ‐15.0 [‐34.25, 4.25] |
| 27.4 Nitric oxide donor | 2 | 4052 | Mean Difference (IV, Random, 95% CI) | ‐1.16 [‐2.63, 0.31] |
| 27.5 Low BP target | 3 | 7304 | Mean Difference (IV, Random, 95% CI) | ‐7.62 [‐11.69, ‐3.56] |
| 28 SBP, at end of treatment Show forest plot | 20 | 15684 | Mean Difference (IV, Random, 95% CI) | ‐8.02 [‐10.07, ‐5.97] |
|
| 28.1 ACE inhibitors (po) | 4 | 123 | Mean Difference (IV, Random, 95% CI) | ‐17.37 [‐23.42, ‐11.31] |
| 28.2 ACE inhibitors (s/l) | 1 | 42 | Mean Difference (IV, Random, 95% CI) | ‐1.5 [‐12.20, 9.20] |
| 28.3 ARA (po) | 5 | 3785 | Mean Difference (IV, Random, 95% CI) | ‐7.37 [‐10.19, ‐4.56] |
| 28.4 A2AA (po) | 0 | 0 | Mean Difference (IV, Random, 95% CI) | 0.0 [0.0, 0.0] |
| 28.5 Beta‐blockers (po) | 1 | 44 | Mean Difference (IV, Random, 95% CI) | ‐3.20 [‐13.17, 6.77] |
| 28.6 Beta‐blockers (iv) | 1 | 43 | Mean Difference (IV, Random, 95% CI) | ‐13.00 [‐25.21, ‐4.79] |
| 28.7 Calcium channel blockers (po) | 1 | 77 | Mean Difference (IV, Random, 95% CI) | ‐7.80 [‐17.12, 1.52] |
| 28.8 Calcium channel blockers (iv) | 1 | 11 | Mean Difference (IV, Random, 95% CI) | ‐9.20 [‐25.73, 7.33] |
| 28.9 Nitric oxide donor | 4 | 4101 | Mean Difference (IV, Random, 95% CI) | ‐1.05 [‐2.50, 0.39] |
| 28.10 Thiazide‐like diuretic (po) | 1 | 37 | Mean Difference (IV, Random, 95% CI) | 3.0 [‐11.74, 17.74] |
| 28.11 Low BP target | 5 | 7421 | Mean Difference (IV, Random, 95% CI) | ‐10.06 [‐13.58, ‐6.55] |
| 29 DBP, first after randomisation by intervention Show forest plot | 17 | 12397 | Mean Difference (IV, Random, 95% CI) | ‐3.86 [‐5.07, ‐2.64] |
|
| 29.1 ACE inhibitors(po) | 5 | 123 | Mean Difference (IV, Random, 95% CI) | ‐4.23 [‐9.68, 1.21] |
| 29.2 ACE inhibitors (s/l) | 1 | 42 | Mean Difference (IV, Random, 95% CI) | 2.20 [‐5.50, 9.90] |
| 29.3 ARA (po) | 3 | 3408 | Mean Difference (IV, Random, 95% CI) | ‐2.48 [‐4.35, ‐0.61] |
| 29.4 A2AA | 1 | 4 | Mean Difference (IV, Random, 95% CI) | ‐2.10 [‐15.43, 11.23] |
| 29.5 Beta‐Blockers (po) | 1 | 43 | Mean Difference (IV, Random, 95% CI) | ‐5.40 [‐13.01, 2.21] |
| 29.6 Beta‐Blockers (iv) | 1 | 41 | Mean Difference (IV, Random, 95% CI) | ‐17.5 [‐25.32, ‐9.68] |
| 29.7 Calcium channel blockers (po) | 1 | 77 | Mean Difference (IV, Random, 95% CI) | ‐3.30 [‐9.28, 2.68] |
| 29.8 Calcium channel blockers (iv) | 1 | 11 | Mean Difference (IV, Random, 95% CI) | ‐12.90 [‐31.35, 5.55] |
| 29.9 Nitric oxide donor | 6 | 4173 | Mean Difference (IV, Random, 95% CI) | ‐3.39 [‐4.25, ‐2.52] |
| 29.10 Low BP target | 2 | 4475 | Mean Difference (IV, Random, 95% CI) | ‐6.43 [‐12.10, ‐0.75] |
| 30 DBP, first after randomisation by stroke type Show forest plot | 16 | 14952 | Mean Difference (IV, Random, 95% CI) | ‐3.73 [‐4.69, ‐2.76] |
|
| 30.1 Ischaemic stroke | 6 | 7500 | Mean Difference (IV, Random, 95% CI) | ‐3.53 [‐4.20, ‐2.87] |
| 30.2 Combined ischaemic stroke and Intracerebral haemorrhage | 10 | 6419 | Mean Difference (IV, Random, 95% CI) | ‐2.85 [‐4.26, ‐1.44] |
| 30.3 Intracerebral haemorrhage | 2 | 1033 | Mean Difference (IV, Random, 95% CI) | ‐6.80 [‐11.99, ‐1.60] |
| 31 DBP, first after randomisation by time to treatment Show forest plot | 16 | 10977 | Mean Difference (IV, Random, 95% CI) | ‐3.80 [‐5.06, ‐2.54] |
|
| 31.1 Ultra‐acute/prehospital | 2 | 55 | Mean Difference (IV, Random, 95% CI) | 1.39 [‐7.71, 10.48] |
| 31.2 Hyper‐acute | 2 | 677 | Mean Difference (IV, Random, 95% CI) | ‐6.48 [‐12.55, ‐0.41] |
| 31.3 Acute | 6 | 10076 | Mean Difference (IV, Random, 95% CI) | ‐3.11 [‐4.26, ‐1.97] |
| 31.4 Subacute | 7 | 169 | Mean Difference (IV, Random, 95% CI) | ‐3.88 [‐7.98, 0.22] |
| 32 DBP, at day 1 Show forest plot | 16 | 11361 | Mean Difference (IV, Random, 95% CI) | ‐3.05 [‐4.20, ‐1.91] |
|
| 32.1 ACE inhibitors (po) | 4 | 96 | Mean Difference (IV, Random, 95% CI) | ‐3.24 [‐8.95, 2.47] |
| 32.2 ACE inhibitors (s/l) | 1 | 42 | Mean Difference (IV, Random, 95% CI) | ‐2.0 [‐9.70, 5.70] |
| 32.3 ARA (po) | 2 | 2368 | Mean Difference (IV, Random, 95% CI) | 1.00 [‐3.47, 1.48] |
| 32.4 A2AA (po) | 1 | 4 | Mean Difference (IV, Random, 95% CI) | 0.17 [‐26.77, 27.11] |
| 32.5 Beta‐blockers (po) | 1 | 43 | Mean Difference (IV, Random, 95% CI) | ‐1.0 [‐8.99, 6.99] |
| 32.6 Beta‐blockers (iv) | 1 | 41 | Mean Difference (IV, Random, 95% CI) | ‐5.0 [‐13.21, 3.21] |
| 32.7 Calcium channel blockers (po) | 2 | 84 | Mean Difference (IV, Random, 95% CI) | ‐6.10 [‐14.08, 1.89] |
| 32.8 Calcium channel blockers (iv) | 1 | 11 | Mean Difference (IV, Random, 95% CI) | ‐12.90 [‐31.35, 5.55] |
| 32.9 Nitric oxide donor | 7 | 4197 | Mean Difference (IV, Random, 95% CI) | ‐3.31 [‐4.17, ‐2.44] |
| 32.10 Low BP target | 2 | 4475 | Mean Difference (IV, Random, 95% CI) | ‐5.34 [‐9.02, ‐1.65] |
| 33 DBP, at day 7 Show forest plot | 10 | 12686 | Mean Difference (IV, Random, 95% CI) | ‐2.90 [‐3.96, ‐1.83] |
|
| 33.1 ACE inhibitors | 1 | 11 | Mean Difference (IV, Random, 95% CI) | ‐18.0 [‐33.10, ‐2.90] |
| 33.2 ARA(po) | 5 | 4152 | Mean Difference (IV, Random, 95% CI) | ‐2.47 [‐3.24, ‐1.70] |
| 33.3 Nitric oxide donor | 1 | 4011 | Mean Difference (IV, Random, 95% CI) | ‐1.10 [‐2.00, ‐0.20] |
| 33.4 Thiazide‐like diuretic (po) | 1 | 37 | Mean Difference (IV, Random, 95% CI) | ‐5.0 [‐16.00, 6.00] |
| 33.5 Low BP target | 2 | 4475 | Mean Difference (IV, Random, 95% CI) | ‐4.49 [‐6.18, ‐2.80] |
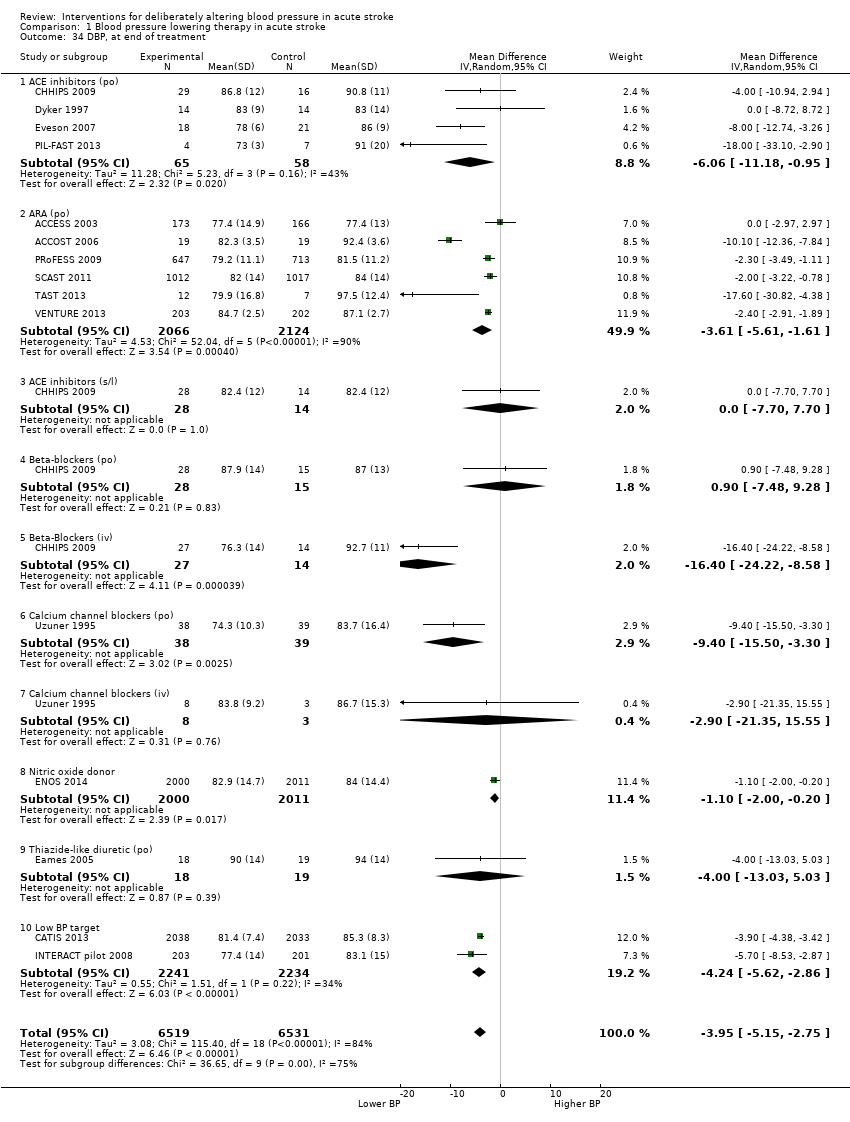
| 34 DBP, at end of treatment Show forest plot | 15 | 13050 | Mean Difference (IV, Random, 95% CI) | ‐3.95 [‐5.15, ‐2.75] |
|
| 34.1 ACE inhibitors (po) | 4 | 123 | Mean Difference (IV, Random, 95% CI) | ‐6.06 [‐11.18, ‐0.95] |
| 34.2 ARA (po) | 6 | 4190 | Mean Difference (IV, Random, 95% CI) | ‐3.61 [‐5.61, ‐1.61] |
| 34.3 ACE inhibitors (s/l) | 1 | 42 | Mean Difference (IV, Random, 95% CI) | 0.0 [‐7.70, 7.70] |
| 34.4 Beta‐blockers (po) | 1 | 43 | Mean Difference (IV, Random, 95% CI) | 0.90 [‐7.48, 9.28] |
| 34.5 Beta‐Blockers (iv) | 1 | 41 | Mean Difference (IV, Random, 95% CI) | ‐16.40 [‐24.22, ‐8.58] |
| 34.6 Calcium channel blockers (po) | 1 | 77 | Mean Difference (IV, Random, 95% CI) | ‐9.40 [‐15.50, ‐3.30] |
| 34.7 Calcium channel blockers (iv) | 1 | 11 | Mean Difference (IV, Random, 95% CI) | ‐2.90 [‐21.35, 15.55] |
| 34.8 Nitric oxide donor | 1 | 4011 | Mean Difference (IV, Random, 95% CI) | ‐1.10 [‐2.00, ‐0.20] |
| 34.9 Thiazide‐like diuretic (po) | 1 | 37 | Mean Difference (IV, Random, 95% CI) | ‐4.0 [‐13.03, 5.03] |
| 34.10 Low BP target | 2 | 4475 | Mean Difference (IV, Random, 95% CI) | ‐4.24 [‐5.62, ‐2.86] |
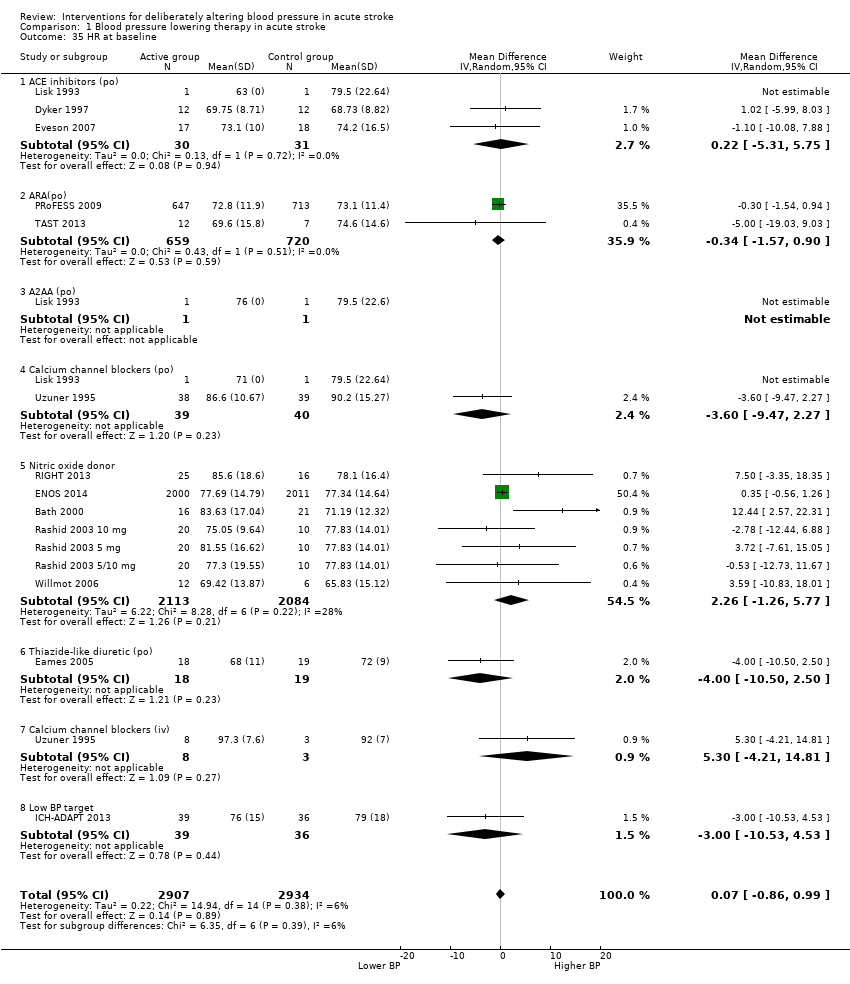
| 35 HR at baseline Show forest plot | 15 | 5841 | Mean Difference (IV, Random, 95% CI) | 0.07 [‐0.86, 0.99] |
|
| 35.1 ACE inhibitors (po) | 3 | 61 | Mean Difference (IV, Random, 95% CI) | 0.22 [‐5.31, 5.75] |
| 35.2 ARA(po) | 2 | 1379 | Mean Difference (IV, Random, 95% CI) | ‐0.34 [‐1.57, 0.90] |
| 35.3 A2AA (po) | 1 | 2 | Mean Difference (IV, Random, 95% CI) | 0.0 [0.0, 0.0] |
| 35.4 Calcium channel blockers (po) | 2 | 79 | Mean Difference (IV, Random, 95% CI) | ‐3.60 [‐9.47, 2.27] |
| 35.5 Nitric oxide donor | 7 | 4197 | Mean Difference (IV, Random, 95% CI) | 2.26 [‐1.26, 5.77] |
| 35.6 Thiazide‐like diuretic (po) | 1 | 37 | Mean Difference (IV, Random, 95% CI) | ‐4.0 [‐10.50, 2.50] |
| 35.7 Calcium channel blockers (iv) | 1 | 11 | Mean Difference (IV, Random, 95% CI) | 5.30 [‐4.21, 14.81] |
| 35.8 Low BP target | 1 | 75 | Mean Difference (IV, Random, 95% CI) | ‐3.0 [‐10.53, 4.53] |
| 36 HR, first after randomisation Show forest plot | 6 | 4196 | Mean Difference (IV, Random, 95% CI) | 2.74 [‐1.13, 6.61] |
|
| 36.1 ACE inhibitors (po) | 2 | 39 | Mean Difference (IV, Random, 95% CI) | ‐0.58 [‐9.89, 8.72] |
| 36.2 ARA(po) | 0 | 0 | Mean Difference (IV, Random, 95% CI) | 0.0 [0.0, 0.0] |
| 36.3 Calcium channel blockers (po) | 2 | 82 | Mean Difference (IV, Random, 95% CI) | 1.28 [‐21.89, 24.46] |
| 36.4 A2AA (po) | 1 | 3 | Mean Difference (IV, Random, 95% CI) | 0.0 [0.0, 0.0] |
| 36.5 Nitric oxide donor | 3 | 4061 | Mean Difference (IV, Random, 95% CI) | 3.95 [‐1.03, 8.93] |
| 36.6 Calcium channel blockers (iv) | 1 | 11 | Mean Difference (IV, Random, 95% CI) | 10.0 [0.71, 19.29] |
| 37 HR, at day 1 Show forest plot | 10 | 4333 | Mean Difference (IV, Random, 95% CI) | 2.35 [‐1.06, 5.76] |
|
| 37.1 ACE inhibitors (po) | 2 | 39 | Mean Difference (IV, Random, 95% CI) | 0.03 [‐40.45, 40.51] |
| 37.2 Calcium channel blockers (po) | 2 | 83 | Mean Difference (IV, Random, 95% CI) | ‐2.56 [‐7.71, 2.59] |
| 37.3 A2AA (po) | 1 | 3 | Mean Difference (IV, Random, 95% CI) | 0.0 [0.0, 0.0] |
| 37.4 Nitric oxide donor | 7 | 4197 | Mean Difference (IV, Random, 95% CI) | 4.53 [1.46, 7.60] |
| 37.5 Calcium channel blockers (iv) | 1 | 11 | Mean Difference (IV, Random, 95% CI) | ‐16.90 [‐27.35, ‐6.45] |
| 38 HR, at day 7 Show forest plot | 4 | 5449 | Mean Difference (IV, Random, 95% CI) | 0.47 [‐0.24, 1.19] |
|
| 38.1 Thiazide‐like diuretic (po) | 1 | 37 | Mean Difference (IV, Random, 95% CI) | 0.0 [‐6.14, 6.14] |
| 38.2 ARA(po) | 1 | 1360 | Mean Difference (IV, Random, 95% CI) | 0.10 [‐1.07, 1.27] |
| 38.3 Nitric oxide donor | 2 | 4052 | Mean Difference (IV, Random, 95% CI) | 0.72 [‐0.20, 1.63] |
| 39 HR, at end of treatment Show forest plot | 4 | 4124 | Mean Difference (IV, Random, 95% CI) | 0.70 [‐0.21, 1.61] |
|
| 39.1 ACE inhibitors | 1 | 35 | Mean Difference (IV, Random, 95% CI) | 2.40 [‐62.22, 67.02] |
| 39.2 Thiazide‐ like diuretic | 1 | 37 | Mean Difference (IV, Random, 95% CI) | 0.0 [‐6.14, 6.14] |
| 39.3 Nitric oxide donor | 2 | 4052 | Mean Difference (IV, Random, 95% CI) | 0.72 [‐0.20, 1.63] |