Dietary interventions for adults with chronic kidney disease
Abstract
Background
Dietary changes are routinely recommended in people with chronic kidney disease (CKD) on the basis of randomised evidence in the general population and non‐randomised studies in CKD that suggest certain healthy eating patterns may prevent cardiovascular events and lower mortality. People who have kidney disease have prioritised dietary modifications as an important treatment uncertainty.
Objectives
This review evaluated the benefits and harms of dietary interventions among adults with CKD including people with end‐stage kidney disease (ESKD) treated with dialysis or kidney transplantation.
Search methods
We searched the Cochrane Kidney and Transplant Specialised Register (up to 31 January 2017) through contact with the Information Specialist using search terms relevant to this review. Studies contained in the Specialised Register are identified through search strategies specifically designed for CENTRAL, MEDLINE, and EMBASE; handsearching conference proceedings; and searching the International Clinical Trials Register (ICTRP) Search Portal and ClinicalTrials.gov.
Selection criteria
Randomised controlled trials (RCTs) or quasi‐randomised RCTs of dietary interventions versus other dietary interventions, lifestyle advice, or standard care assessing mortality, cardiovascular events, health‐related quality of life, and biochemical, anthropomorphic, and nutritional outcomes among people with CKD.
Data collection and analysis
Two authors independently screened studies for inclusion and extracted data. Results were summarised as risk ratios (RR) for dichotomous outcomes or mean differences (MD) or standardised MD (SMD) for continuous outcomes, with 95% confidence intervals (CI) or in descriptive format when meta‐analysis was not possible. Confidence in the evidence was assessed using GRADE.
Main results
We included 17 studies involving 1639 people with CKD. Three studies enrolled 341 people treated with dialysis, four studies enrolled 168 kidney transplant recipients, and 10 studies enrolled 1130 people with CKD stages 1 to 5. Eleven studies (900 people) evaluated dietary counselling with or without lifestyle advice and six evaluated dietary patterns (739 people), including one study (191 people) of a carbohydrate‐restricted low‐iron, polyphenol enriched diet, two studies (181 people) of increased fruit and vegetable intake, two studies (355 people) of a Mediterranean diet and one study (12 people) of a high protein/low carbohydrate diet. Risks of bias in the included studies were generally high or unclear, lowering confidence in the results. Participants were followed up for a median of 12 months (range 1 to 46.8 months).
Studies were not designed to examine all‐cause mortality or cardiovascular events. In very‐low quality evidence, dietary interventions had uncertain effects on all‐cause mortality or ESKD. In absolute terms, dietary interventions may prevent one person in every 3000 treated for one year avoiding ESKD, although the certainty in this effect was very low. Across all 17 studies, outcome data for cardiovascular events were sparse. Dietary interventions in low quality evidence were associated with a higher health‐related quality of life (2 studies, 119 people: MD in SF‐36 score 11.46, 95% CI 7.73 to 15.18; I2 = 0%). Adverse events were generally not reported.
Dietary interventions lowered systolic blood pressure (3 studies, 167 people: MD ‐9.26 mm Hg, 95% CI ‐13.48 to ‐5.04; I2 = 80%) and diastolic blood pressure (2 studies, 95 people: MD ‐8.95, 95% CI ‐10.69 to ‐7.21; I2 = 0%) compared to a control diet. Dietary interventions were associated with a higher estimated glomerular filtration rate (eGFR) (5 studies, 219 people: SMD 1.08; 95% CI 0.26 to 1.97; I2 = 88%) and serum albumin levels (6 studies, 541 people: MD 0.16 g/dL, 95% CI 0.07 to 0.24; I2 = 26%). A Mediterranean diet lowered serum LDL cholesterol levels (1 study, 40 people: MD ‐1.00 mmol/L, 95% CI ‐1.56 to ‐0.44).
Authors' conclusions
Dietary interventions have uncertain effects on mortality, cardiovascular events and ESKD among people with CKD as these outcomes were rarely measured or reported. Dietary interventions may increase health‐related quality of life, eGFR, and serum albumin, and lower blood pressure and serum cholesterol levels.
Based on stakeholder prioritisation of dietary research in the setting of CKD and preliminary evidence of beneficial effects on risks factors for clinical outcomes, large‐scale pragmatic RCTs to test the effects of dietary interventions on patient outcomes are required.
PICOs
Plain language summary
Dietary patterns for adults with chronic kidney disease
What is the issue?
People who have kidney disease can experience a lower life expectancy, complications including heart disease, and may need treatment for severe kidney failure, such as dialysis. Patients and doctors wish to identify treatments that protect people against kidney failure or heart disease. For both doctors and people who have kidney disease, lifestyle changes such as diet are very important as possible ways to improve health and well‐being, and provide people with a chance to 'self‐manage' their care for kidney disease.
What did we do?
We combined all studies looking at dietary changes for people who kidney disease including people treated with dialysis or who have a kidney transplant.
What did we find?
We found 17 studies involving 1639 people who had chronic kidney disease that looked into whether diet changes or advice improved their health. Studies included men and women with mainly moderate or severe kidney disease. Diets involved increasing fruit and vegetable intake, increasing poultry and fish, higher nut and olive oil use, and some increases in cereals and legumes (e.g. beans), and less red meat, sugar, and salt. We looked particularly at three key outcomes: the risk of death, the risk of advanced kidney disease requiring dialysis, and quality of life. There were four studies involving people who have had a kidney transplant and three studies involving people treated with dialysis.
After combining the available studies, it was uncertain whether making healthy diet changes prevented heart complications as most studies did not measure these. Diet changes may improve life quality. We did see that some risk factors for future disease, such as blood pressure and cholesterol, were lower following diet counselling or healthier eating.
The quality of the included studies was often very low meaning we could not be sure that future studies would find similar results.
Conclusions
We are very uncertain whether dietary changes improve well‐being for people with kidney disease because the available research studies were not designed to learn about these. Diet changes may lower blood pressure and cholesterol, but the longer term impact of these effects on well‐being is not proven. This means we still need large and good‐quality research studies to help understand the impact of diet on the health of people with kidney disease.
Authors' conclusions
Summary of findings
| Dietary modifications (counselling or dietary change) versus control for CKD | ||||||
| Patient or population: people with CKD Intervention: dietary modifications Comparison: control | ||||||
| Outcomes | Illustrative comparative risks* (95% CI) | Relative effect | No. of participants | Quality of the evidence | Comments | |
| Assumed risk | Corresponding risk | |||||
| Standard care | Dietary intervention | |||||
| Death | High risk population | Not estimable | 539 (5) | ⊕⊖⊖⊖ | Studies were not designed to measure effects of dietary interventions on mortality | |
| 150 per 1000 | Not estimable | |||||
| Medium risk population | ||||||
| 25 per 1000 | Not estimable | |||||
| Major cardiovascular event | High risk population | Not estimable | Insufficient data observations | No studies were available for this outcome | Studies were not designed to measure effects of dietary interventions on cardiovascular events. 0 studies reported major cardiovascular events | |
| 150 per 1000 | Not estimable | |||||
| Medium risk population | ||||||
| 45 per 1000 | Not estimable | |||||
| Progression to ESKD Measured as requiring dialysis treatment in people with CKD | 0.6 per 1000 | 0.3 per 1000 | RR 0.53 (0.26 to 1.07) | 242 (2) | ⊕⊖⊖⊖ | 29 participants developed ESKD in these studies. No studies included recipients of a kidney transplant |
| Health‐related quality of life Measured using the Short Form‐36 scale from 0 to 100 | The mean SF‐36 score ranged across control groups from 43.6 to 48.8 | The mean SF‐36 score in the intervention groups was 11.46 higher (95% CI 7.73 to 15.18) | 119 (2) | ⊕⊕⊖⊖ | 0 studies included recipients of a kidney transplant. None of the studies were blinded | |
| *The basis for the assumed risk of mortality (e.g. the median control group risk across studies) was obtained from the absolute population risk estimated from previously published cohort studies or data registries (Johnson 2011; Weiner 2006). The corresponding risk (and its 95% confidence interval) is based on the assumed risk in the comparison group and the relative effect of the intervention (and its 95% CI). | ||||||
| GRADE Working Group grades of evidence | ||||||
| 1 Study limitations were due to high or unclear risks of bias 2 Confidence interval includes range of plausible values that include substantial benefit or harm 3 Based on few events and/or participants across all studies 4 Data not available for recipients of a kidney transplant | ||||||
Background
Description of the condition
Chronic kidney disease (CKD) is a disorder resulting from structural changes to the kidney (cysts, loss of tissue, or masses) and/or urinary tract leading to changes in the composition of the urine, reduced kidney function or both. The kidney is a target organ injured in diseases primary to the kidney (such as glomerulonephritis or polycystic kidney disease) and secondary diseases (including cardiovascular disease, metabolic syndrome, diabetes (predominantly type 2), obesity, and arterial hypertension). Secondary causes of kidney failure now dominate the global epidemiology of kidney disease ‐ diabetes and hypertension are the leading causes of CKD in middle and higher income countries worldwide, accounting for approximately 35% and 25% of kidney disease (Jha 2013). Kidney tissue in systemic diseases is injured by accelerated vascular damage, glomerular hypertension, and increased cellular glycosylation and oxidation.
Overall, CKD affects an estimated 10% to 15% of people around the world (Chadban 2003; Singh 2009; Zhang 2012) and leads to poorer health outcomes for affected individuals and communities. Among people who have moderate to severe CKD, early death and cardiovascular complications are two to three times more likely than for people without kidney disease and quality of life is reduced (Go 2004; Hemmelgarn 2010; Wyld 2012).
Description of the intervention
Dietary modifications (dietary intake of whole foods rather than single dietary nutrients, such as sodium or protein) may play an important and complex role in the aetiology and progression of CKD, in part through modification of systemic disease processes affecting kidney function (arterial hypertension, tissue glycosylation, glomerular injury, and macrovascular and microvascular diseases) and in part through altering the risks of non‐communicable diseases such as diabetes that play such an important role in the prevalence of kidney disease in developed and developing nations. Individual dietary components may influence blood lipid levels, oxidative stress, insulin sensitivity, blood pressure, systemic inflammatory responses, pro fibrotic processes, thrombosis risk, and endothelial function to modify clinical outcomes (Abiemo 2012; Nakayama 1996; Peters 2000; Stamler 1996; van Dijk 2012).
How the intervention might work
While the exact mechanisms through which dietary modifications might act to prolong life expectancy and kidney function are likely to be multifactorial, there is emerging evidence showing the impact of dietary changes on risk factors for kidney injury and cardiovascular disease. In recent Cochrane reviews of dietary advice in primary and secondary prevention studies ‐ predominantly through reduction of salt and fat intake and increased fruit, vegetables, and fibre intake ‐ dietary changes reduced arterial blood pressure by up to 10 mm Hg on average, as well as serum cholesterol and sodium excretion (Hartley 2013; Rees 2013a; Rees 2013b).
Combined dietary and exercise interventions among people at risk of diabetes, many of whom have kidney disease, reduce weight and body mass and have modest effects on blood lipids and blood pressure, while altered carbohydrate or energy intake plus exercise improves glycaemic control in people with type 2 diabetes (Nield 2008; Orozco 2008). Intensive advice and support to reduce salt intake may have small and unsustained effects on blood pressure (Adler 2014) of uncertain clinical importance. Among people at high cardiovascular risk, a Mediterranean diet increases circulating anti‐oxidant levels, which has been proposed as one possible mechanism for improved survival (Zamora‐Ros 2013). Whether dietary alteration of risks factors for cardiovascular events including blood pressure, serum lipids, or anti‐oxidant levels modify clinical outcomes for people with CKD remains uncertain.
Why it is important to do this review
Although numerous randomised controlled trials (RCTs) in people with CKD have evaluated single nutrient management (such as protein intake or salt intake), there is relatively less information about the impact of whole dietary modifications ‐ for example, the Mediterranean diet or Dietary Approaches to Stop Hypertension (DASH) diet ‐ on clinical outcomes in people with CKD. Clinical studies in this area have been largely restricted to modifying protein, sodium, and phosphorus dietary intake as well as antioxidant supplementation (Fouque 2009; Jun 2012; Liu 2015; McMahon 2015). Among people with CKD, lowered dietary salt intake reduced blood pressure and the amount of protein excreted by the kidney (an indicator of cardiovascular risk) (McMahon 2015), although there was no high‐quality evidence this translated to slower kidney disease progression or fewer cardiovascular complications. Although dietary interventions in the setting of CKD have commonly focused on protein restriction as a mechanism to slow kidney failure, there is limited evidence that this dietary strategy is effective and safe and the impact of different protein sources on clinical outcomes is poorly understood (Robertson 2007; Fouque 2009).
Global clinical guidelines recommend dietary strategies in the management of CKD (KDIGO 2012). Specifically, guidelines suggest lower protein intake with appropriate education and avoiding high protein intake for people at risk of kidney disease progression, lower salt intake, and increased physical activity (aiming for at least 30 minutes, 5 times/week). Guidelines recommend that people with CKD receive dietary advice and information in the context of an education program that is tailored to the severity of their CKD and the need to modify salt, phosphate, potassium, and protein intake. Given these guidelines, up to date evidence of the benefits and harms of dietary management is needed to inform practice and policy.
In addition, patients, caregivers and health professionals consider the effects of dietary management as important and a priority treatment uncertainty in CKD (Manns 2014). When speaking about dietary changes, some patients experience dietary restrictions as an intense and unremitting burden (Palmer 2015a), while at the same time offering them greater self‐efficacy in the management of their CKD. In general, patients value better understanding of the role of lifestyle management as a research priority (Tong 2015). Dietary management is therefore an important potential intervention for improving clinical outcomes in CKD that aligns with patient priorities.
Objectives
This review evaluated the benefits and harms of dietary interventions among adults with CKD including people with end‐stage kidney disease (ESKD) treated with dialysis or kidney transplantation.
Methods
Criteria for considering studies for this review
Types of studies
We included RCTs and quasi‐RCTs (in which allocation to treatment was obtained by alternation, use of alternate medical records, date of birth, or other predictable methods) measuring the effect of dietary interventions in adults with CKD.
Types of participants
Inclusion criteria
Adults with any stage of CKD (any structural kidney or urine abnormality with or without reduced glomerular filtration rate below 60 mL/min/1.73 m2 as defined by the Kidney Disease: Improving Global Outcomes (KDIGO 2012)) including people with ESKD treated with dialysis, kidney transplantation or supportive care.
Exclusion criteria
Pregnant women and children younger than 18 years.
Types of interventions
Inclusion criteria
We evaluated the following dietary modifications (including dietary advice or lifestyle management) compared with any other dietary pattern or standard care (including lifestyle advice).
-
Dietary patterns (e.g. DASH diet; Mediterranean diet, American Heart Association diet)
-
Nutritional counselling and education about food‐based dietary interventions
We included studies evaluating interventions for at least one month and studies in which concomitant non‐randomised interventions such as antihypertensive medication, sodium restriction, or other co‐interventions including supplements were used during the study period (e.g. specific blood pressure targets), providing that these interventions were administered to all treatment groups. We included studies of dietary modifications regardless of whether other dietary changes such as salt or phosphorus dietary intake were adjusted. We did not include differing levels of energy intake as interventions in the review.
Exclusion criteria
We excluded dietary interventions that were "single‐nutrient" or nutrient‐focused interventions (including supplementation). This included the following dietary management interventions.
-
Dietary management of specific dietary factors including sodium, phosphorus, and protein (as these are evaluated in other Cochrane reviews (Fouque 2009; Jun 2012; Liu 2015; McMahon 2015)
-
Probiotics, prebiotics, or synbiotics
-
Implementation strategies for dietary or lifestyle management
Types of outcome measures
We categorised outcomes according to length of follow up (< 6 months and ≥ 6 months). We extracted and analysed data for shorter (< 6 months) and longer (≥ 6 months) term outcomes separately.
Primary outcomes
-
All‐cause mortality
-
Major adverse cardiovascular events (as defined by study investigators)
-
Health‐related quality of life (as defined and measured by investigators)
Secondary outcomes
-
Withdrawal from dietary intervention
-
Cause‐specific death (cardiovascular mortality, sudden death, infection‐related mortality)
-
Progression to ESKD (as defined by the investigators including estimated glomerular filtration rate below 15 mL/min/1.73 m2 or requiring treatment with long‐term dialysis or kidney transplantation)
-
Participant adherence to intervention
-
Myocardial infarction
-
Kidney function measures (creatinine clearance or estimated glomerular filtration rate, doubling of serum creatinine, serum creatinine)
-
Serum lipids (total cholesterol, low density lipoprotein (LDL) cholesterol, triglycerides)
-
Blood pressure
-
Blood glucose control (glycated haemoglobin; fasting plasma glucose)
-
Global measures of nutritional status (body mass index (BMI); body weight; waist circumference; subjective global assessment; malnutrition screening tool; mini nutritional assessment; skin‐fold measurements; bioelectrical impedance analysis; albumin; prealbumin)
Search methods for identification of studies
Electronic searches
We searched the Cochrane Kidney and Transplant Specialised Register (up to 31 January 2017) through contact with the Information Specialist using search terms relevant to this review. The Cochrane Kidney and Transplant Specialised Register contains studies identified from several sources.
-
Monthly searches of the Cochrane Central Register of Controlled Trials (CENTRAL)
-
Weekly searches of MEDLINE OVID SP
-
Handsearching of kidney‐related journals and the proceedings of major kidney conferences
-
Searching of the current year of EMBASE OVID SP
-
Weekly current awareness alerts for selected kidney and transplant journals
-
Searches of the International Clinical Trials Register (ICTRP) Search Portal and ClinicalTrials.gov.
Studies contained in the Specialised Register are identified through search strategies for CENTRAL, MEDLINE, and EMBASE based on the scope of Cochrane Kidney and Transplant. Details of these strategies, as well as a list of handsearched journals, conference proceedings and current awareness alerts, are available in the Specialised Register section of information about Cochrane Kidney and Transplant.
See Appendix 1 for search terms used in strategies for this review.
Searching other resources
-
Reference lists of review articles, relevant studies and clinical practice guidelines.
-
Letters seeking information about unpublished or incomplete studies to investigators known to be involved in previous studies.
Data collection and analysis
Selection of studies
The search strategy was used to obtain titles and abstracts of studies that might have been relevant to the review. The titles and abstracts were screened independently by at least two authors (SP and JM), who discarded studies that were not eligible; however, studies and reviews that might have included relevant data or information on studies were retained initially. Two authors (SP and JM) independently assessed retrieved abstracts and, if necessary the full text, of these studies to determine which studies satisfied the inclusion criteria. Any uncertainties about study eligibility were discussed between authors and if necessary with a third author (KC).
Data extraction and management
Data extraction was carried out independently by two authors using pre‐specified standard data extraction forms. Studies reported in non‐English language journals were electronically translated before assessment. Where more than one publication of one study exists, study reports were grouped together and the publication with the most complete data was used in the analyses. Where relevant outcomes are only published in earlier publications of the study, these data were used. Any discrepancy between published versions were evaluated and highlighted.
Assessment of risk of bias in included studies
The following reporting items were independently assessed by two authors (SP and JM) using the Cochrane risk of bias assessment tool (Higgins 2011) (see Appendix 2):
-
Was there adequate sequence generation (selection bias)?
-
Was allocation adequately concealed (selection bias)?
-
Was knowledge of the allocated interventions adequately prevented during the study?
-
Participants and personnel (performance bias)
-
Outcome assessors (detection bias)
-
-
Were incomplete outcome data adequately addressed (attrition bias)?
-
Are reports of the study free of suggestion of selective outcome reporting (reporting bias)?
-
Was the study apparently free of other problems that could put it at a risk of bias? These were pre‐specified as: baseline imbalance, interim reporting, deviation from study protocol in a way that does not reflect clinical practice, pre‐randomisation administration of an intervention that could enhance or diminish the effects of a subsequent randomised intervention, contamination, occurrence of 'null bias' due to interventions being insufficiently well delivered or overly wide inclusion criteria, selective reporting of subgroups, reporting of trial registration, reporting of funding source(s), publication as full journal report, and fraud.
Measures of treatment effect
For dichotomous outcomes (total and cause‐specific mortality, myocardial infarction, progression to ESKD, doubling of serum creatinine, participant adherence, withdrawal from intervention), the treatment effects of dietary management were expressed as a risk ratio (RR) together with 95% confidence intervals (CI). Where continuous scales of measurement are used to assess the effects of dietary management (health‐related quality of life, blood pressure, lipids (total cholesterol, LDL cholesterol, triglycerides), kidney function (serum creatinine, creatinine clearance, glomerular filtration rate), body composition (weight, waist circumference, BMI)), the mean difference (MD) between treatment groups were used, or the standardised mean difference (SMD) if different measurement scales have been reported. A standardised mean difference of 0.2 indicated a small difference, 0.5 a moderate difference and 0.8 a large difference. We evaluated mean end of treatment values for continuous outcomes together with the reported standard deviation in meta‐analyses for these continuous outcomes.
Unit of analysis issues
Studies with more than two interventions were evaluated in this review. We used recommended methods for data extraction and analysis described by the Cochrane Collaboration (Higgins 2011).
Cross‐over studies
There were no cross‐over studies included in this meta‐analysis.
Studies with more than two interventions
Studies with multiple intervention groups were included. When a study was a 'multi‐arm' study, and all treatment arms provided data for eligible interventions, the study was described and included in the systematic review. If there were adequate data from the study, then treatment arms relevant to the treatment comparisons of interest were included in applicable meta‐analyses.
Cluster randomised studies
We planned to include information from cluster randomised studies. We planned to divide the effective sample size for each data point by a quantity called the design effect calculated as 1 + (M ‐ 1) ICC, where M was the average cluster size and ICC was the intra‐cluster correlation coefficient. In this calculation, a common design effect was assumed across all intervention groups. The intra‐cluster coefficient (ICC) is seldom available in published reports. We therefore planned to adopt a common approach to use external estimates obtained from similar studies. For dichotomous outcomes, we planned to divide the number of participants and the number experiencing the event by the design effect. For continuous endpoints only the sample size was planned to be divided by the design effect with means and standard deviations remaining unchanged.
Dealing with missing data
Any further information required from the original author was requested by electronic mail and any relevant information obtained in this manner was included in the review. Evaluation of important numerical data such as screened, randomised patients as well as intention‐to‐treat, as‐treated and per‐protocol population were carefully performed. Attrition rates, for example drop‐outs, losses to follow‐up and withdrawals were investigated. Issues of missing data and imputation methods (for example, last‐observation‐carried‐forward) was critically appraised (Higgins 2011).
Assessment of heterogeneity
Statistical heterogeneity in treatment effects among studies was analysed using a Chi² test on N‐1 degrees of freedom, with an alpha of 0.05 used for statistical significance and with the I² test (Higgins 2003). We considered I² values of 25%, 50% and 75% as corresponding to low, medium and high levels of heterogeneity.
Assessment of reporting biases
There were insufficient data to generate funnel plots to assess for the potential existence of small study bias for the outcome of all‐cause mortality.
Data synthesis
We grouped studies by dietary modifications into similar interventions (e.g. counselling; Mediterranean; fruits and vegetables). Treatment estimates for the specified were summarised within groups of dietary modifications and treatment effects were summarised using random‐effects meta‐analysis. Effects were reported as the relative risk (RR) and 95% confidence interval (CI) for binary outcomes and mean difference (MD) and 95% CI for continuous outcomes.
We summarised information for outcomes in which meta‐analysis is not possible due to insufficient observations using narrative tables. Narrative outcome reporting included health‐related quality of life domains described in the studies and nutrition assessments. The dietary interventions and associated implementation strategies were described using the "Better reporting of interventions: Template for Intervention Description and Replication (TIDieR) checklist and guide" (Hoffmann 2014) and tabulated in the review.
Subgroup analysis and investigation of heterogeneity
There were insufficient extractable data to conduct subgroup and univariate meta‐regression analysis to explore the following variables as possible sources of heterogeneity: mean study age, mean proportion of men, energy intake, study‐level mean blood pressure or cholesterol at baseline, proportion with diabetes, adequacy of allocation concealment, sample size, and duration of follow up (< 12 months versus ≥ 12 months).
Sensitivity analysis
There were insufficient extractable data to perform the following sensitivity analyses in order to explore the influence of the following factors on effect size:
-
Repeating the analysis excluding unpublished studies
-
Repeating the analysis taking account of risk of bias, as specified above
-
Repeating the analysis excluding any very long or large studies to establish how much they dominated the results
-
Repeating the analysis excluding studies using the following filters: diagnostic criteria, language of publication, source of funding (industry versus other), and country.
'Summary of findings' tables
We presented the main results of the review in a 'Summary of findings' table for the outcomes of all‐cause mortality, cardiovascular mortality, ESKD, and health‐related quality of life. 'Summary of findings' tables present key information concerning the quality of the evidence, the magnitude of the effects of the interventions examined, and the sum of the available data for the main outcomes (Schunemann 2011a). The 'Summary of findings' tables also included an overall grading of the evidence related to each of the main outcomes using the GRADE (Grades of Recommendation, Assessment, Development and Evaluation) approach (GRADE 2008). The GRADE approach defines the quality of a body of evidence as the extent to which one can be confident that an estimate of effect or association is close to the true quantity of specific interest. The quality of a body of evidence involves consideration of within‐trial risk of bias (methodological quality), directness of evidence, heterogeneity, precision of effect estimates and risk of publication bias (Schunemann 2011b).
Results
Description of studies
Results of the search
The electronic search strategy of the Cochrane Kidney and Transplant Specialised Register (31 January 2017) identified 824 records (Figure 1). After initial title and abstract screening, 754 records were excluded. The full‐text of the remaining 70 records were evaluated. A further 47 records were excluded (21 were not in people with CKD, 25 were not evaluating dietary patterns, three were not randomised).

Flow diagram of study selection
Seventeen studies (21 records) were included, one study was excluded, and one ongoing study was identified and will be assessed in a future update of this review.
Included studies
See Characteristics of included studies.
Overall, 17 studies reported in 21 publications involving 1639 people with CKD were eligible (Campbell 2008; Chanwikrai 2012; DIRECT Study 2013; Facchini 2003; Flesher 2011; Goraya 2013; Goraya 2014; Leon 2006; Mekki 2010; Orazio 2011; Riccio 2014; Stachowska 2005; Sutton 2007; Teng 2013; Tzvetanov 2014; Whittier 1985; Zhou 2011b). The study characteristics are summarised in Table 1. Studies were published between 2003 and 2014, with all but five (Facchini 2003; Leon 2006; Stachowska 2005; Sutton 2007; Whittier 1985) of the studies published since 2008.
| Study ID | Treatment | Control | CKD stage | GFR (mL/min) | Mean age | % men | Mean GFR (mL/min) | Mean BMI (kg/m2) | Detailed inclusion criteria |
| Counselling | |||||||||
| Dietary counselling | Written material | 4‐5 | ≤ 30 | 69.5 (11.7) 70.9 (11.6) | 61 | 23.1 (7.2) 21.6 (6.1) | 26.8 (4.7) 27.6 (5.2) | > 18 years; eGFR < 30 mL/min/1.73 m2; CKD not previously seen by a dietitian for stage 4 CKD; absence of communication or intellectual impairment; absence of malnutrition from a cause other than CKD; not expected to require RRT within 6 months | |
| Dietary counselling | Standard care | 3‐5 | ‐‐ | ‐‐ | ‐‐ | ‐‐ | ‐‐ | CKD stage 3‐5 | |
| Dietary counselling + exercise | Standard care | 3‐4 | 20‐60 | 63.4 (12.1) 63.4 (11.8) | 53 | 37.2 (3.2) 38.4 (3.0) | ‐‐ | eGFR 20 to 60 mL/min for ≥3 months; presence of urinary protein; adult (≥ 19 years); hypertension or taking at least 1 antihypertensive medication; physician approval to exercise | |
| Dietary counselling and targeting nutritional barriers | Standard care | 5 (HD) | Dialysis | 62 60 | 42 | ‐‐ | 29.0 27.9 | 18 to 85 years; receiving dialysis for at least 9 months; mean serum albumin level for previous 3 months < 3.70 g/dL (bromcresol green method) or < 3.40 g/dL (bromcresol purple method) | |
| Dietary counselling | Standard care | Transplant | Transplant | 54.9 (9.9) 54.7 (11.8) | 61 | 54 (20) 48 (17) | 29 (5) 29 (6) | Kidney transplant > 6 months | |
| Dietary counselling | Low protein diet | ‐‐ | ‐‐ | ‐‐ | ‐‐ | ‐‐ | ‐‐ | CKD not requiring dialysis | |
| Dietary counselling + physical activity | Standard care | 5 (PD) | Dialysis | 60.7 (15.5) 58.5 (15.4) | 55 | ‐‐ | 25.4 (3.8) 25.7 (3.4) | Treatment with CAPD for 3 months or longer; not diabetic | |
| Dietary counselling + exercise | Standard care | 1‐3 | ‐‐ | 62.1 (14.0) 65.7 (11.2) | 71 | 53.7 (18.3) 49.5 (13.3) | 24.4 (3.9) 25.3 (3.1) | 20 years or older; communicate in Mandarin or Taiwanese; aware of CKD diagnosis; GFR range 30 to 106.7 mL/min/1.73 m2 | |
| Dietary counselling + exercise | Standard care | Transplant | Transplant | 46 (6.9) 45 (19) | 47 | ‐‐ | ‐‐ | Kidney transplant; obese | |
| Dietary counselling | Standard care | 5 (PD) | Dialysis | 57.8 (12.8) 59.9 (13.6) | 71 | ‐‐ | 23.3 (4.5) 22.8 (6.2) | 18 to 70 years; receiving long‐term dialysis > 3 months | |
| Mediterranean diet | |||||||||
| Mediterranean diet (restricted calorie) | Low‐fat (restricted calorie) diet Low‐carbohydrate (unrestricted calorie) diet | 3 | 30‐60 | 52.5 (6.2) | 99 | 52.6 (5.9) | 30.9 (3.4) | 40 to 65 years with BMI ≥ 27 kg/m2; individuals with type 2 diabetes or coronary heart disease were eligible regardless of age. Post‐hoc analysis among participants with eGFR 30 to 60 mL/min/1.73 m2 | |
| Mediterranean diet | Standard care | 2‐3 | 60‐89 | 60 (10) 59 (12) | 53 | 70 (10) 75 (15) | 26.9 (3.9) 25.1 (4.2) | eGFR 60 to 89 mL/min/1.73 m2; dyslipidaemia | |
| Modified Mediterranean diet | Low fat diet | Transplant | Transplant | 41 (12.5) 46 (9.5) | 68 | ‐‐ | 25.0 (4.1) 26.2 (4.2) | Stable transplant function | |
| Increased fruit and vegetables | |||||||||
| Increased fruit and vegetable intake | Oral bicarbonate | 4 | 15‐29 | 53.9 (6.9) 54.2 (5.3) | 54 | 22.8 (4.9) 23.0 (3.5) | ‐‐ | Non‐malignant hypertension; eGFR 15 to 29 mL/min/1.73 m2; plasma TCO2< 22 mM; no diabetes or cardiovascular disease; two or more primary care physician visits in previous year; age ≥ 18 years | |
| Increased fruit and vegetable intake | Oral bicarbonate Standard care | 3 | 30‐59 | 53.5 (5.2) 53.9 (4.8) | 44 | 42.3 (7.1) 42.6 (7.6) | ‐‐ | Non‐malignant hypertension, eGFR 30 to 59 mL/min/1.73 m2; plasma TCO2< 25 mM; macroalbuminuria; able to tolerate angiotensin‐converting inhibition; non‐smoking for ≥ 1 year; no diabetes or cardiovascular disease; 2 or more primary care physician visits in previous year; ≥ 18 years | |
| Carbohydrate‐restricted, low‐iron, polyphenol enriched (CR‐LIPE) diet | |||||||||
| CR‐LIPE diet | Protein restriction | 2‐5 | 15‐75 | 59 (10) 60 (12) | 51 | 64 (28) 62 (32) | 28 (5) 28 (5) | Type 2 diabetes; referred to nephrology clinic for kidney failure (15 ± 75 mL/min); otherwise unexplained proteinuria (350 ± 12,000 mg/d); kidney disease attributed to diabetes | |
| High‐nitrogen, low‐carbohydrate diet | |||||||||
| High‐nitrogen, low carbohydrate diet | Standard care | Transplant | Transplant | 33 32 | 75 | ‐‐ | ‐‐ | Kidney transplant; no diabetes | |
BMI ‐ body mass index; CAPD ‐ continuous ambulatory peritoneal dialysis; CKD ‐ chronic kidney disease; eGFR ‐ estimated glomerular filtration rate; HD ‐ haemodialysis; PD ‐ peritoneal dialysis; RRT ‐ renal replacement therapy; TCO2 ‐ total carbon dioxide
Three studies enrolled 341 people treated with long‐term dialysis (haemodialysis (1), peritoneal dialysis (2)), four studies enrolled 168 kidney transplant recipients, and 10 studies enrolled 1130 people with CKD stages 1 to 5.
In the studies involving people with CKD, the average eGFR ranged between 21.6 and 75 mL/min/1.73 m2. Most participants with CKD had an eGFR < 60 mL/min/1.73 m2.The mean study eGFR ranged between 22.8 and 70 mL/min/1.73 m2. In kidney transplant recipients, the eGFR at baseline in the two studies reporting this was between 48 and 54 mL/min/1.73 m2.
Studies had generally small sample sizes (median 73 participants, range 12 to 318 patients). Participants were followed up for between one month and 3.9 years (median 12 months).
Thirteen studies that reported funding received funding from governmental or healthcare organisations, and four studies did not report their funding source.
Studies were conducted in Algeria (Mekki 2010), Australia (Campbell 2008; Orazio 2011), Canada (Flesher 2011), China (Zhou 2011b), Israel (DIRECT Study 2013), Italy (Riccio 2014), Poland (Stachowska 2005), Taiwan (Teng 2013), Thailand (Chanwikrai 2012), the UK (Sutton 2007), and the USA (Facchini 2003; Goraya 2013; Goraya 2014; Leon 2006; Tzvetanov 2014; Whittier 1985).
The mean age in the included studies ranged between 41 years (Stachowska 2005) and 69.5 years (Campbell 2008). The mean BMI at baseline ranged between 22.8 and 38.6 kg/m2(median 28.5 kg/m2).
Dietary interventions
The methods for dietary implementation, tailoring, and measurement of adherence are provided in Table 2 and reported using a Template for Intervention Description and Replication (TIDieR) checklist (Hoffmann 2014).
| Study ID | Materials | Dietary intervention | Adherence | |||||||
| Why | What | Who | How | Where | When and how much | Tailoring | Modification | Planned | Actual | |
| Counselling | ||||||||||
| To determine whether individual nutrition counselling improves body composition, energy intake, and nutritional status | Individualised dietary prescription (including energy (125 to 146 kJ/kg/d) and protein (0.75 to 1.0 g/kg/d)) incorporating KDOQI recommendations to provide intensive nutritional counselling with regular monitoring | Dietitian | Face‐to‐face, telephone, individualised | ‐‐ | Baseline for 60 min; then biweekly for 1st month (15 to 30 min); then weekly till end of study period | Depending on dietary requirements, diet was tailored following clinical data and initial interview. Delivery was guided by the medical nutrition therapy framework from the American Dietetic Association | Self‐management principles: goal‐setting, menu planning, label reading, and identification of foods containing protein, sodium, and so on, depending on requirements | Dietary intake assessed using 3‐day food record, verified by the dietitian. Strategies to improve adherence or fidelity not reported | No patient voluntarily withdrew from the study | |
| Changes of diet and lifestyle can slow progression of CKD | Dietary modification with or without exercise by an empowerment approach (including low protein 0.6 to 0.8 g/kg/d) and low salt (5 g/d). | ‐‐ | ‐‐ | ‐‐ | ‐‐ | ‐‐ | ‐‐ | ‐ | 81 (96%) completed the study program | |
| To determine whether additional of cooking and exercise classes would slow progression of CKD | Individual nutrition counselling on moderate protein and low sodium, with individualised modification of potassium and/or phosphate plus a group nutrition class, cooking classes with a dietitian and cook education, CKD cookbook, shopping tour, and 12‐week exercise program led by a Certified Exercise Physiologist and nurse. Exercise program started after 6 months | Cooking class ‐ dietitian and cook educator; Exercise ‐ exercise physiologist and nurse | Face‐to‐face; individual and group sessions | Exercise class took place in well‐equipped gym at Garatt Wellness Centre: details regarding cooking class not provided | Cooking classes over 4 weeks for 2 hour session, shopping tour; Exercise class at Garratt Wellness centre, 3 x 1 hour session/week with strength training, flexibility components, resistance training | Skills for tailoring and modifying diet and lifestyle were provided. Diet history was discussed in detail at the individual appointments | Self‐management focus in using goal‐setting and building confidence in the management of disease | Adherence to exercise was assessed by physical activity readiness questionnaire and 6 minute submaximal walk test; biochemical and clinical parameters related to cardiovascular health; monitored at baseline, 6 months and 12 months | Overall, the experimental group showed ‘improvement’’ | |
| Whether targeting specific nutritional barriers will improve albumin levels | Study coordinators abstracted medical records and interviewed participants to determine the presence of 10 specific nutritional barriers (nutritional knowledge, appetite, help needed with cooking and shopping, low fluid intake, dialysis dose, depression, difficulty chewing, difficulty swallowing, gastrointestinal symptoms, acidosis). Study coordinators educated all intervention patients about | Study coordinators; dietitians | Face‐to‐face; individualised | During dialysis sessions | During the next 12 months, study coordinators met monthly with patients to reinforce recommendations, | Tailored to specific nutritional barriers identified during interviews | Specific to nutritional barriers | ‐‐ | ‐‐ | |
| To investigate the effect of dietitian involvement in a multidisciplinary lifestyle intervention comparing risk factor modification for cardiovascular disease with standard post‐transplant care in kidney transplant recipients with abnormal glucose tolerance | Individualised dietary advice was provided to participants for the duration of the study. Achievement and/or maintenance of a healthy weight (BMI), 20 to 25 kg/m2) was the primary goal of nutrition therapy using a Mediterranean‐style (< 30% total energy from The long‐term goal of physical activity advice was to achieve 150 min of accumulated physical activity/week, in accordance with current National Physical Activity Recommendations. To help achieve this, goals The Transtheoretical Model of Health Behavior Change or Stage of Change Model underpinned the lifestyle intervention to provide a framework for goal‐setting throughout the study | Multidisciplinary team (nephrologist, dietitian, nurse, endocrinologist) | Individualised advice from nephrologist, dietitian, nurse and endocrinologist (individual or group) | Multiple locations and settings including during routine transplant care, outpatient dietetic and nursing care, and routine diabetes management | Bimonthly reviews for 2 years by nephrologist; 4‐week initial program from dietitian with bimonthly reviews for 2 years and 6 monthly group meetings; bimonthly reviews by nurse and endocrinologist | Dietitian delivery of individual diet initially and then individualist dietetic reviews including weight, waist circumference and hip circumference measurements | Specific to patient and anthropomorphic measurements during follow‐up | ‐‐ | 8/96 participants chose to withdraw | |
| To determine if a simplified dietary approach self‐managed by patients had beneficial impact on nutritional and metabolic control of CKD, to be acceptable and safe | List of recommendations to modify dietary habits (do not add salt at table or for cooking; foods to avoid; replacing noodles or bread; meat, fish and egg intake; 4‐5 servings of fruit or vegetables; replacement of noodles with legumes | Nephrologist | Face‐to‐face; individualised | ‐‐ | ‐‐ | The goal of the study was to tailor and modify diet for participants in intervention group (not otherwise specified) | ‐‐ | Adherence to diet was assessed at regular intervals (1, 3 and 6th), method for assessing adherence was not reported | 19/27 in intervention group were adherent with protein prescription whereas 12/27 in control group were adherent with protein prescription | |
| To determine whether offering dietary advice was effective in supporting patients in adjusting energy intake | The intervention group was offered follow‐up dietary advice that would encourage them to match energy intake with their estimated energy expenditure allowing for dialysate calories and with a protein intake of not < 0.8 to 1.0 g/kg IBW | Dietitian | Face‐to‐face | ‐‐ | Face‐to‐face contact at baseline and 4 months. Suggested snack ideas, alterations in food preparation, or modification of portion sizes | ‐‐ | ‐‐ | ‐ | 49/59 participants completed the study | |
| To examine effects of a targeted Lifestyle Modification Program on lifestyle behaviours, knowledge, and physical indicators of CKD | The Trans Theoretical model using the stage‐of‐change construct was used to assess the patient's readiness stage to promote behaviour change. Targeted interventions were given according to the stage of change about diet and exercise. Patients were encouraged to find individual methods of overcoming barriers to regular exercise. Written materials were provided to encourage adherence to a CKD diet. An information booklet on protecting kidney function was provided and reviewed with patient. Discussion provided information about kidney function and disease, and dietary and lifestyle management | Registered nurse research assistants | Face‐to‐face; individualised | Clinic | Counselling provided with each clinic visit | The goal of the study to tailor and modify diet for participants in intervention group | ‐‐ | To ensure the fidelity of the Lifestyle Modification Program, all provided counselling and information were recorded, and the interventions were reviewed by the investigators at random | There was a 64.4% retention rate at 12 months | |
| Examine the effectiveness of a physical exercise program including behaviour modification interventions and nutritional training for obese recipients of a kidney transplant | Individual physical training (one‐to‐one sessions with a coach) using low‐impact, low‐repetition, resistance‐based weight training with 2 x 1‐hour sessions each week in | Coach | Individual training | Private environment | 2 x 1‐hour sessions each week for 12 months | Standardised process | Response to participants muscle strength, empowerment, and identifying most impactful behaviour/lifestyle changes for each patient | ‐ | Only 4/8 people allocated to the control returned to the 6 month follow up appointment and 2 for the 12 month appointment. Adherence with the supervised rehabilitation program and follow up was 100% in people allocated to the intervention | |
| To investigate the effects of nutrition intervention and individualised nursing care on nutritional status and quality of life in people with ESKD receiving peritoneal dialysis | An individualised nutrition intervention developed by dietitian with regard to the patient's nutritional status, clinical condition, and characteristics. The study group received the following intervention: energy 125 kJ/kg/d, protein 1.2 to 1.3 g/kg/d, and 70% to 75% proportion of protein as of high biological value. Oral enteral nutrition supplements were used for patients who did not receive enough nutrients from food. The volume of water intake was equivalent to the urine volume plus 500 mL/d and sodium was 3 g/d. In addition, nurse practitioners provided psychological care, an individualised exercise program, and blood pressure treatment | Dietitian and nurses | Individual face‐to‐face | ‐‐ | Psychological support was given for 30 min once‐monthly over 6 months | Individualised according to nutritional and clinical status | ‐‐ | ‐‐ | Not reported | |
| Mediterranean diet | ||||||||||
| To investigate the long‐term effect of Mediterranean diet on kidney function | Mediterranean diet: moderate‐fat, restricted calorie, rich in vegetables and low in red meat, with poultry and fish replacing beef and lamb. Energy intake was restricted to 1500 kcal/d for women and 1800 kcal/d for men, with a goal of no more than 35% of calories from fat; the main sources of added fat were 30 to 45 g of olive oil and a handful of nuts (5 to 7 nuts, < 20 g)/d. Low carbohydrate diet: low‐carbohydrate, non‐restricted‐calorie diet aimed to provide 20 g of carbohydrates/d for the 2‐month induction phase and immediately after religious holidays, with a gradual increase to a maximum of 120 g/d to maintain weight loss. Low fat diet: Low‐fat calorie restricted diet based on American Heart Association guidelines, with an energy intake of 1500 kcal/d for women and 1800 kcal/d for men with 30% of calories from fat, 10% of calories from saturated fat, and an intake of 300 mg of cholesterol/d. Patients were counselled to consume low‐fat grains, vegetables, fruits, and legumes and to limit consumption of additional fats, sweets, and high‐fat snacks. This study was included as a post‐hoc analysis of the main study including people with CKD (eGFR < 60 mL/min/1.73 m2) | Dietitian | Members of each treatment group were assigned to subgroups of between 17 and 19 participants, with 6 groups for each dietary treatment group. Each group was assigned to a registered dietitian who led all 6 subgroups of that dietary group. Self‐service cafeterias in workplaces worked closely with dietitians to adjust specific food items to specific diet groups. Each food item was provided with a label showing the number of calories and the number of grams of carbohydrates, fat and saturated fat | ‐‐ | Dietitians met with groups in weeks 1, 3, 5, and 7, and thereafter at 6‐week intervals, for a total of 18 sessions of 90 min each. The Israeli version of the diabetes prevention program was adapted including additional themes for each dietary change. In addition, a group of spouses received education. | 6 times during the 2‐year intervention, another dietitian conducted 10 to 15 min motivational telephone calls with patients who were having difficulty adhering to the diet. | ‐‐ | Adherence with the diets was evaluated by a validated food‐frequency questionnaire that included 127 food items and three portion‐size pictures for 17 items. A subgroup of participants completed two repeated 24‐hour dietary recalls to verify absolute intake. We used a validated questionnaire to assess physical activity. At baseline, and at 6, 12, and 24 months of follow‐up, the questionnaires were self‐administered electronically through the workplace intranet. The 15% of patients who request aid in completing the questionnaires were assisted by the study nurse | Adherence with study intervention was 95.4% at first year and 84.6% at second year | |
| To evaluate effect of nutritional advice on dyslipidaemia and biomarkers | Nutritional advice based on the National Kidney Foundation—Kidney Disease Outcomes Quality Initiative guideline (energy intake 0.12 MJ/kg BW/d, protein 0.75 g/kg BW/d, lipid intake 35%, and carbohydrates 55% of total energy intake). Dietary recommendations were modified and adapted to a Mediterranean diet with increased intake of mono‐unsaturated fatty acids (MUFA), poly‐unsaturated fatty acids (PUFA), and fibres. Patients were asked to consume olive oil and nuts for seasonings, whole grains (50 g bread at each meal, 250 g cereal or starch once a day), fruits (once a day), vegetables (200 g twice a day) and fish (twice a week). A list of foods rich in salt, potassium and phosphorus was provided. In addition, patients received advice about cooking methods best suited to adherence | ‐‐ | Face‐to‐face | Nephrology ward | ‐‐ | ‐‐ | ‐‐ | Recall and record every 4 days, patients interviewed by trained interviewers using adapted and structures questionnaire regarding 24 hour dietary intake. Serving sizes were estimated by the use of the food portion model handbook. Dimensions of dishes, utensils and | By 90 days, the qualitative distribution of nutrients had a tendency to be closer to the recommended diet | |
| To verify the effect of the Mediterranean diet on risk factors of atherosclerosis in people with a kidney transplant | This diet featured carbohydrates with a low GI (poor in glucose, simple carbohydrates, and amylose, rich in cellulose). Approved diet constituents included cereals, pulse, whole‐rye bread, vegetables (cooked or fresh), oat flakes (cooked), and noodles prepared al dente. Amylose‐rich foods, sweets, and sweet drinks were prohibited. Breakfast was the main meal, providing 39% 2% of daily calorie intake, whereas supper provided the least (16% 3%). In the study group, daily energy intake was attributed as follows: 47% carbohydrates, 38% fatty acids (including 10% saturated, 22% monounsaturated, and 6% polyunsaturated species), and 15% protein. Cholesterol and fibre supply was 165 ± 17 mg/d and 47 ± 9 g/d, respectively. The significant content of fibre in the diet was attributed to the use of fresh, unprocessed food, elimination of semi processed products, and daily intake of pulse/cereal (e.g. buckwheat, barley)/vegetables/whole‐meal rye bread. The dominating fatty acid was oleic acid from olive oil and erucic acid‐poor rapeseed oil. Patients consumed 30 mL cold‐pressed | ‐‐ | ‐‐ | ‐‐ | ‐‐ | ‐‐ | ‐‐ | Dietary adherence was ascertained every 4 weeks using questionnaires (24‐h food diaries) and monitoring oleic acid content in plasma triglycerides | The content of oleic acid in triglycerides | |
| Increased fruit and vegetables | ||||||||||
| To evaluate increased intake of base‐producing fruits and vegetables on kidney function and metabolic acidosis | Patients received fruits and vegetables free of charge, distributed from the food bank in amounts to reduce potential renal acid load by half. Prescriptions emphasised base‐producing fruits and vegetables such as apples, apricots, oranges, peaches, pears, raisins, strawberries, carrots, cauliflower, eggplant, lettuce, potatoes, spinach, tomatoes, and zucchini | Dietitian prescribed | Individuals were not given specific dietary instructions and they integrated the prescribed fruits and vegetables into their diets as they wished. To better assure that each patient ate all the prescribed fruits and vegetables, the prescribed amount was given for each household person | ‐‐ | ‐‐ | ‐‐ | ‐‐ | Formal assessment methods was not employed; however to ensure participants consumed required amount of fruit and vegetables, fruit and vegetables were distributed for whole family/household | ‐‐ | |
| To evaluate increased intake of base‐producing fruits and vegetables on kidney function and metabolic acidosis | Patients received fruits and vegetables free of charge, distributed from the food bank in amounts to reduce potential renal acid load by half. Prescriptions emphasised base‐producing fruits and vegetables such as apples, apricots, oranges, peaches, pears, raisins, strawberries, carrots, cauliflower, eggplant, lettuce, potatoes, spinach, tomatoes, and zucchini | Dietitian prescribed | Individuals were not given specific dietary instructions and they integrated the prescribed fruits and vegetables into their diets as they wished. To better assure that each patient ate all the prescribed fruits and vegetables, the prescribed amount was given for each household person | ‐‐ | ‐‐ | ‐‐ | ‐‐ | Formal assessment methods was not employed; however to ensure participants consumed required amount of fruit and vegetables, fruit and vegetables were distributed for whole family/household | ‐‐ | |
| Carbohydrate‐restricted, low‐iron, polyphenol enriched (CR‐LIPE) diet | ||||||||||
| To evaluate whether dietary modification had effect on progression of CKD | CR‐LIPE diet; 50% reduction in carbohydrate intake; substitution of iron‐enriched meats (beef and pork) with iron‐poor white meats (poultry and fish) and with protein‐enriched food items known to inhibit iron absorption (dairy; eggs; soy); elimination of all beverages other than tea, water and red wine; exclusive use of polyphenol‐enriched extra‐virgin olive oil | ‐‐ | ‐‐ | ‐‐ | ‐‐ | ‐‐ | ‐‐ | Serum ferritin level; to assess adherence with low iron diet | Serum ferritin level decreased in group on CR‐LIPE diet | |
| High‐nitrogen, low carbohydrate diet | ||||||||||
| Whether a high‐nitrogen, low carbohydrate diet could result in a positive nitrogen balance and fewer cushingoid side effects in the immediate post‐transplant period | On the morning of the 4th postoperative day, the patients were randomly assigned to receive either the control or the experimental diet. A general daily diet order was prescribed for all patients; it consisted of 800 mL fluid restriction plus an amount equal to the urine volume/d, 2 g sodium, 80 mEq potassium, 800 to 1200 mg of calcium, and 30 calories/kg. Total calories and content of the diet, in identical proportions, were adjusted up or down per kilogram to the nearest 10 kg for patients who weighed more or less than 70 kg since the ideal body weight of these patients varied from 50 to 90 kg prior to transplantation | Dietitian | Diets were prepared in batches in the metabolic kitchen by a research dietician. One meal from each batch was slurried and analysed for nitrogen and electrolyte | Inpatient General Clinical Research Centre for 4‐week duration of study. | Continuous assessment | The composition of the diet was determined according | ‐‐ | Uneaten food from each tray was weighed and subtracted from the daily | Both groups ingested a similar amount of total calories, and when factored by weight, intakes per kg of body weight were very close to the objective of 28 to 30 | |
BMI ‐ body mass index; (I)BW ‐ (individual) body weight‐ CKD ‐ chronic kidney disease; eGFR ‐ estimated glomerular filtration rate; GI ‐ glycaemic index
Dietary interventions included dietary counselling with or without physical activity and lifestyle advice in 10 studies (860 participants) (Campbell 2008; Chanwikrai 2012; Flesher 2011; Leon 2006; Orazio 2011; Riccio 2014; Sutton 2007; Teng 2013; Tzvetanov 2014; Zhou 2011b), a Mediterranean diet in three studies (395 participants) (DIRECT Study 2013; Mekki 2010; Stachowska 2005), increased fruit and vegetable intake in two studies (179 participants) (Goraya 2013; Goraya 2014), a carbohydrate‐restricted, low‐iron available, polyphenol enriched (CR‐LIPE) diet in Facchini 2003 (191 participants), and a high protein/low carbohydrate diet in Whittier 1985 (12 participants). A high fruit and vegetable intake was compared with oral bicarbonate supplementation in the setting of CKD. A Mediterranean diet was compared with a control diet, a low fat diet, or a low carbohydrate diet. In general, dietary modifications tended to include increased intake of fish and poultry, fruit and vegetables, olive oil, and nuts, and lower intake of carbohydrates, red meat, sodium, and sugars.
The aims of the dietary counselling studies were generally to assess whether dietary advice could improve nutritional status and body composition (Campbell 2008; Zhou 2011b), slow progression of CKD (Chanwikrai 2012; Flesher 2011), or decrease biochemical derangement in kidney disease (Riccio 2014; Teng 2013). Studies of dietary patterns were primarily aimed at assessing effects of dietary intake on kidney function (DIRECT Study 2013; Facchini 2003; Goraya 2013; Goraya 2014) or dyslipidaemia (Mekki 2010). Among people treated with dialysis, the interventions were aimed at increasing serum albumin levels (Leon 2006), supporting adjusted energy intake (Sutton 2007), and improving under nutrition (Zhou 2011b). Dietary interventions for transplant recipients aimed to modify cardiovascular risk factors (Orazio 2011; Stachowska 2005), provide lifestyle advice including nutrition guidance (Tzvetanov 2014), or reduce cushingoid side‐effects.
Two studies reported three treatment groups. In DIRECT Study 2013, a calorie‐restricted Mediterranean diet was compared with a calorie‐restricted low‐fat diet or calorie‐unrestricted low‐carbohydrate diet. In Goraya 2014, increased fruit and vegetable intake was compared with oral bicarbonate supplementation and standard care.
Excluded studies
The one study which meet our population and intervention criteria was excluded as it was only for a short duration (10 days) (Parillo 1988).
Risk of bias in included studies
SeeFigure 2; Figure 3 for summary of 'Risk of bias' assessments.
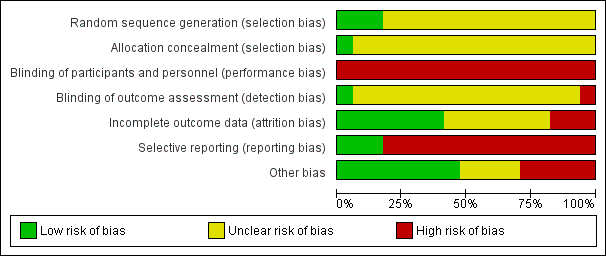
Risk of bias graph: review authors' judgements about each risk of bias item presented as percentages across all included studies.
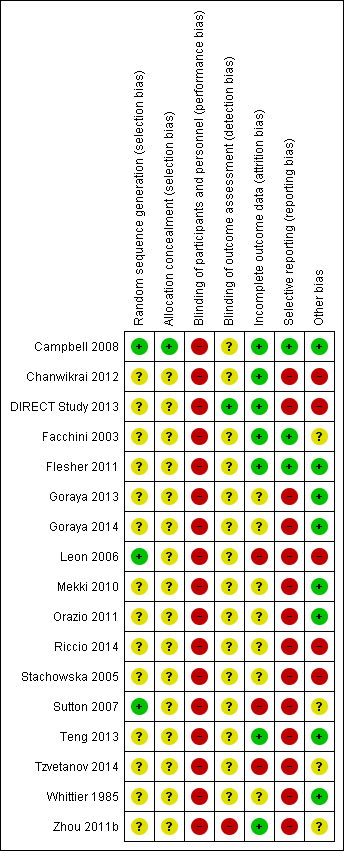
Risk of bias summary: review authors' judgements about each risk of bias item for each included study.
Reporting of details of study methodology was incomplete for most studies. The summary risks of bias are shown in Figure 2 and risk of bias in each individual study is shown in Figure 3.
Allocation
Random sequence generation
Three studies reported adequate (low risk) random sequence generation (Campbell 2008; Leon 2006; Sutton 2007). The risk of bias from random sequence generation methods was unclear in the remaining 14 studies.
Allocation concealment
Only Campbell 2008 was judged to have adequate allocation concealment (low risk). Risks from allocation concealment was unclear in the remaining 16 studies.
Blinding
Performance bias
Dues to the nature of the interventions, performance bias was judged as high risk in all 17 studies.
Detection bias
Detection bias was judged to be low risk in DIRECT Study 2013 and high in Zhou 2011b. Risk of detection bias was unclear in the remaining 15 studies.
Incomplete outcome data
Attrition bias was low risk in seven studies (Campbell 2008; Chanwikrai 2012; DIRECT Study 2013; Facchini 2003; Flesher 2011; Teng 2013; Zhou 2011b) and high risk in three studies (Leon 2006; Sutton 2007; Tzvetanov 2014). Risks from attrition bias were unclear in the remaining seven studies.
Selective reporting
Three studies were at low risk of reporting bias (Campbell 2008; Facchini 2003; Flesher 2011), and the remaining 14 studies were at high risk of reporting bias.
Other potential sources of bias
Eight studies were judged to be at low risk of other potential biases (Campbell 2008; Flesher 2011; Goraya 2013; Goraya 2014; Mekki 2010; Orazio 2011; Teng 2013; Whittier 1985); five studies were judged to be high risk of bias (Chanwikrai 2012; DIRECT Study 2013; Leon 2006; Riccio 2014; Stachowska 2005), and risks of bias were unclear in four studies (Facchini 2003; Sutton 2007; Tzvetanov 2014; Zhou 2011b).
Effects of interventions
Data for health‐related quality of life are shown in Table 3. Adverse event data are reported in Table 4. Adverse events were rarely reported.
| Study ID | Tool | Description |
| Dietary counselling | ||
| Kidney Disease Quality of Life Short Form Version 1.3 (combining the SF‐36 with a kidney‐disease specific module) | "There was a clear trend for a mean increase in ratings from the intervention group with a clinically significant mean improvement in 13 of the 18 sub‐scales from baseline to week 12, indicated by an effect size of 0.2 or greater...". There was a statistically significant difference in mean change for scores of symptoms of kidney disease (7.1 (0.1‐14.1) P = 0.047); cognitive functioning (14.6 (5.4‐23.7) P = 0.003); and vitality (12.0 (4.6‐19.5) P = 0.002) in favour of the intervention." | |
| ‐‐ | Not reported | |
| Self‐Management Questionnaire | "Overall, the experimental group showed 'improvement' in exercise frequency, concern over health condition, and frequency of visits to health providers or hospitalisation. Overall the control group answers indicated an improvement in their communication with health providers in asking question and discussing personal issues." | |
| Kidney Disease Quality of Life questionnaire (combining the SF‐36 with a kidney‐disease specific module) | "There were no differences between intervention and control patients in quality‐of‐life subscales, including general health, physical functioning, emotional well‐being, social function, pain, and dialysis‐related symptoms." | |
| ‐‐ | Not reported | |
| ‐‐ | Not reported | |
| ‐‐ | Not reported | |
| 52‐item HPLP‐IIC questionnaire | Intervention had a significant effect on health responsibility and physical activity, but not stress management, interpersonal relations, spiritual growth or nutrition | |
| SF‐36 | "The mean SF‐36 score at 6 months was significantly higher in the intervention group compared with the control group (583±13 vs 436±22, P = 0.008), reflecting an improved perception of health status. ... The intervention group had improvements compared with the control group in the domains of vitality and general health." | |
| Kidney Disease Quality of Life Short Form Version 1.3 (combining the SF‐36 with a kidney‐disease specific module) | "Prior to intervention, the differences in KDTA and SF‐36 scores were not statistically significant in both groups (P >0.05 for all). After intervention, both KDTA and SF‐36 scores were improved in the study group, but decreased in the control group. The difference in KDTA (P = 0.001) and SF‐36 scores (P = 0.001) before and after intervention were statistically significant in both groups (Table 2)." | |
| Mediterranean diet | ||
| ‐‐ | Not reported | |
| ‐‐ | Not reported | |
| ‐‐ | Not reported | |
| Increased fruit and vegetables | ||
| ‐‐ | Not reported | |
| ‐‐ | Not reported | |
| Carbohydrate‐restricted, low‐iron‐available, polyphenol‐enriched diet | ||
| ‐‐ | Not reported | |
| High‐protein, low carbohydrate diet | ||
| ‐‐ | Not reported | |
| Study | Adverse events reported in study |
| Campbell 2008a | Mortality; need for dialysis |
| Not reported | |
| Not reported | |
| Not reported | |
| Not reported | |
| No participants meeting eGFR and plasma potassium criteria developed plasma potassium concentration >5.0 mEq/L | |
| Not reported | |
| Not reported | |
| Not reported | |
| Not reported | |
| Not reported | |
| Not reported | |
| Mortality; transfer from PD to HD | |
| Not reported | |
| Not reported | |
| Dialysis due to elevated blood urea and potassium concentrations | |
| Not reported |
eGFR ‐ estimated glomerular filtration rate; HD ‐ haemodialysis; PD ‐ peritoneal dialysis
Primary outcomes
No included studies were designed to examine effects of dietary interventions on all‐cause mortality or major cardiovascular events. The confidence in the results for these outcomes was very low.
All‐cause mortality
Five studies (Campbell 2008; Facchini 2003; Flesher 2011; Leon 2006; Sutton 2007) reported the number of deaths. Of these, four studies (Campbell 2008; Flesher 2011; Leon 2006; Sutton 2007) reported deaths as part of the information provided about participant recruitment or attrition from study follow‐up which lasted between 12 weeks and 12 months. Dietary counselling had uncertain effects on all‐cause mortality (Analysis 1.1.1 (4 studies, 371 participants): RR 1.59, 95% CI 0.60 to 4.21; I2 = 0%).
In one study comparing a low‐iron‐available, polyphenol enriched carbohydrate‐restricted (CR‐LIPE) diet with control over 3.9 years (Facchini 2003), mortality was reported as a patient outcome. A CR‐LIPE diet had uncertain effects on all‐cause mortality compared with standard care (Analysis 1.1.2 (1 study, 170 participants): RR 0.50, 95% CI 0.22 to 1.12). The confidence in the evidence for all‐cause mortality was very low (summary of findings Table for the main comparison).
Major adverse cardiovascular events
Campbell 2008 death from cardiovascular causes was described by investigators when reporting study loss to follow‐up during the 12 month study. Dietary counselling had very uncertain effects on cardiovascular mortality (Analysis 1.2.1 (1 study, 62 participants): RR 6.58, 95% CI 0.35 to 122.21). The confidence in the evidence for cardiovascular events was very low (summary of findings Table for the main comparison).
Health‐related quality of life
Only six studies included quality of life measures (Table 3). Of these, four studies used the Kidney Disease Quality of Life questionnaire and/or the Short Form‐36 (Campbell 2008; Leon 2006; Tzvetanov 2014; Zhou 2011b). In two studies (Tzvetanov 2014; Zhou 2011b), dietary counselling was associated with a higher score on the SF‐36 questionnaire than standard care (Analysis 1.3.1 (2 studies, 119 participants): MD 11.46, 95% CI 7.73 to 15.18; I2 = 0%). The confidence in the evidence for health‐related quality of life was low (summary of findings Table for the main comparison).
Secondary outcomes
End‐stage kidney disease
No included studies were designed to examine ESKD or risks of doubling of serum creatinine. The confidence in the results for ESKD was very low. Two studies reported the number of participants experiencing ESKD (Campbell 2008; Facchini 2003). In one of these studies comparing dietary counselling with standard care, the number of people starting dialysis was reported as part of participant progression in the 12‐week study (Campbell 2008). In one study, a CR‐LIPE diet had uncertain effects on ESKD compared with standard care. In the two studies combined, dietary interventions did not have statistically significant effect on risks of ESKD ((Analysis 1.4 (2 studies, 232 participants): RR 0.53, 95% CI 0.26 to 1.07; I2 = 0%). The confidence in the evidence for ESKD was very low (summary of findings Table for the main comparison).
Doubling of serum creatinine
Facchini 2003 reported that a CR‐LIPE diet was associated with lower risks of doubling of serum creatinine ((Analysis 1.5 (1 study, 170 participants): RR 0.53, 95% CI 0.33 to 0.86).
Employment
Dietary counselling had uncertain effects on employment during a single 12 month study involving recipients of a kidney transplant (Analysis 1.6 (1 study, 17 participants): RR 6.22, 95% CI 0.96 to 40.22).
Dietary adherence
Dietary counselling had uncertain effects on dietary adherence compared with standard care, in a single study (Analysis 1.7 (1 study 54 participants): RR 1.58, 95% CI 0.97 to 2.58).
Worsening nutrition
In two studies, the proportion of participants with worsening nutritional status was measured using subjective global assessment (SGA) (Campbell 2008; Leon 2006). Compared with usual care, dietary counselling had uncertain effects on nutritional status as measured by SGA (Analysis 1.8.1 (2 studies, 230 participants): RR 0.40, 95% CI 0.05 to 3.37; I2 = 57%).
Kidney function
eGFR
Dietary intervention was associated with a higher eGFR (Analysis 1.9 (5 studies, 219 participants): SMD 1.08; 95% CI 0.20 to 1.97; I2 = 88%) than standard care, although there was very marked heterogeneity in treatment effects between the four studies evaluating dietary counselling and this may have been due to the different strategies used in participant counselling.
Fruits and vegetables had uncertain effects on the eGFR compared with oral bicarbonate supplementation (Analysis 3.1 (2 studies, 143 participants); MD 0.84 mL/min/1.73 m2, 95% CI ‐0.84 to 2.53; I2 = 0%).
Serum creatinine
Dietary interventions had uncertain effects on serum creatinine when compared to control (Analysis 1.10 (3 studies 112 participants): MD 0.83 µmol/L, 95% CI ‐16.57 to 18.23; I2 = 0%).
In Goraya 2013, fruits and vegetables had very uncertain effects on serum creatinine compared with oral bicarbonate supplementation (Analysis 3.2 (1 study, 71 participants): MD ‐9.00 µmol/L, 95% CI ‐39.11 to 21.11).
Blood pressure
Systolic blood pressure
Dietary interventions lowered systolic blood pressure compared with standard care (Analysis 1.11 (3 studies, 167 participants): MD ‐9.26 mm Hg, 95% CI ‐13.48 to ‐5.04; I2 = 80%). There was heterogeneity in the effects between the two different dietary approaches (I2=88.7%).
Fruits and vegetables lowered systolic blood pressure compared to oral bicarbonate supplementation (Analysis 3.3 (2 studies, 143 participants): MD ‐5.81 mm Hg, 95% CI ‐8.84 to ‐2.77) although there was high heterogeneity between studies (I2 = 79%).
Diastolic blood pressure
Dietary counselling lowered diastolic blood pressure compared with standard care (Analysis 1.12 (2 studies, 95 participants): MD ‐8.95 mm Hg, 95% CI ‐10.69 to ‐7.21; I2 = 0%)
Energy intake
Different dietary interventions had statistically heterogeneous effects on energy intake and therefore the results of all available dietary approaches compared with standard care were not combined within a single analysis.
Dietary counselling had uncertain effects on energy intake compared to standard care (Analysis 1.13.1 (4 studies, 340 participants); SMD 1.54, 95% CI ‐0.87 to 3.95). There was very high heterogeneity in this analysis (I2 = 99%) likely due to the differing counselling approaches in the included studies.
A Mediterranean diet was associated with higher energy intake than standard care in Mekki 2010 (Analysis 1.13.2 (1 study, 40 participants): SMD 1.86, 95% CI 1.11‐2.61).
A high nitrogen and low carbohydrate diet had uncertain effects on energy intake in Whittier 1985 (Analysis 1.13 (1 study, 12 participants): SMD ‐0.65, 95% CI ‐1.82 to 0.53).
Body weight, BMI, waist circumference, waist‐to‐hip ratio and arm circumference
Body weight
Dietary interventions had uncertain effects on body weight compared with control (Analysis 1.14 (6 studies, 454 participants): MD ‐0.44 kg, 95% CI ‐1.46 to 0.58; I2 = 15%).
A higher fruit and vegetable intake was associated with a lower body weight than oral bicarbonate supplementation (Analysis 3.4 (2 studies, 143 participants):; MD ‐5.09 kg, 95% CI ‐7.73 to ‐2.44; I2 = 56%).
BMI
Dietary interventions had uncertain effects on BMI compared with control (Analysis 1.15 (2 studies, 119 participants): MD ‐1.70 kg/m2, 95% CI ‐5.23 to 1.82; I2 = 14%).
Waist‐to‐hip ratio, waist circumference, and arm circumference
In Orazio 2011, dietary interventions had uncertain effects on waist‐to‐hip ratio compared with control (Analysis 1.16 (1 study, 82 participants): MD ‐1.05, 95% CI ‐5.92 to 3.82). In the same study, dietary interventions had uncertain effects on the waist circumference (Analysis 1.17 (1 study, 82 participants): MD ‐0.46 cm, 95% CI ‐2.05 to 1.13).
Dietary interventions had uncertain effects on arm circumference compared with control (Analysis 1.18 (2 studies, 149 participants): MD 0.37 cm, 95% CI ‐0.39 to 1.12; I2 = 0%).
Serum albumin
Dietary interventions increased serum albumin levels compared with control (Analysis 1.19 (6 studies, 541 participants): MD 0.16 g/dL, 95% CI 0.07 to 0.24; I2 = 26%).
Serum LDL cholesterol
In Mekki 2010, a Mediterranean diet lowered serum LDL cholesterol levels compared with a control diet (Analysis 1.20.1 (1 study, 40 participants): MD ‐1.00 mmol/L, 95% CI ‐1.56 to ‐0.44).
In Facchini 2003, a CR‐LIPE diet had uncertain effects on serum LDL cholesterol levels compared with a control diet (Analysis 1.20.2 (1 study, 148 participants): MD 0.21 mmol/L, 95% CI ‐0.38 to 0.81).
In Stachowska 2005, a Mediterranean diet lowered serum LDL cholesterol levels compared with a low fat diet (Analysis 2.1 (1 study, 38 participants): MD ‐0.60 mmol/L, 95% CI ‐1.15 to ‐0.05).
Investigation of publication bias, sub‐group analyses and sensitivity analyses
Investigation of publication bias, sub‐group analyses and sensitivity analyses were not possible due to a lack of data observations. In particular there were insufficient data observations to test whether effects of dietary interventions were modified by stage of kidney disease.
Discussion
Summary of main results
This review summarises 17 studies of dietary interventions involving 1639 people with CKD that took place in a wide variety of global regions and health systems. Dietary interventions were evaluated for a median of 12 months. Dietary interventions were counselling, or a dietary pattern (Mediterranean; low fat; low carbohydrate; high fruit and vegetable; carbohydrate‐restricted, low‐iron available, polyphenol‐enriched; low carbohydrate‐high nitrogen) compared with standard care, low protein intake, low fat or low carbohydrate intake, or oral bicarbonate supplementation. The studies included people with stages 1‐5 CKD, kidney transplant recipients, and people with ESKD requiring dialysis. There was considerable heterogeneity in dietary interventions and their implementation, together with differences in tailoring of dietary management to individual requirements and methods to support adherence. Risks of bias in the included studies were often high or unclear, and these risks combined with imprecision in effect estimates led to low or very low confidence in the results.
Studies were not designed to assess dietary effects on risks of death or cardiovascular events. As a result there was considerable uncertainty about the effects of dietary approaches on these outcomes including risks of myocardial infarction or stroke. This finding is particularly relevant as many people with CKD will die from cardiovascular causes before requiring treatment with dialysis or kidney transplantation.
Dietary effects on health‐related quality of life were infrequently reported and were documented using different tools, limiting the ability of studies to be combined. In low quality evidence, dietary interventions may have clinically‐important increases in the SF‐36 quality of life score. There was evidence that dietary modification impacted risks of ESKD, although dietary interventions may increase GFR compared with standard care. Dietary interventions lowered systolic and diastolic blood pressure by nearly 10 mm Hg on average and increased serum albumin levels.
Overall, these data suggest that current evidence for dietary interventions in the setting of CKD is of very low quality and insufficient to guide clinical practice. Possible beneficial effects of dietary modifications on risk factors for disease in this review, the association of healthy eating patterns with lower mortality in non‐randomised studies (Chen 2016; Gutierrez 2014; Muntner 2013), and the priority placed on dietary restrictions in research (Tong 2015a) suggest dietary interventions remain an important research and clinical uncertainty in the setting of kidney disease.
Overall completeness and applicability of evidence
The strengths of this review comprehensive systematic searching for eligible studies, rigid inclusion criteria for RCTs, and data extraction and analysis by two independent investigators. We aimed to evaluate the effectiveness of dietary modification for range of food groups for people with CKD. This review included a small number of studies with heterogeneous interventions and implementation strategies. We could not robustly assess the effect of dietary pattern on endpoints such as mortality or cardiovascular events in people with CKD as there were few studies of sufficient size or duration to examine these outcomes. Despite preliminary evidence for improved blood pressure and serum cholesterol with some dietary patterns, evidence for the longer‐term effects of dietary pattern on patient‐level outcomes remains to be determined. There was a lack of consistency in estimating health‐related quality of life among the available studies. Given the patients report dietary requirements and restrictions as a sometimes intense burden (Palmer 2015a), this aspect of dietary interventions remains important for future exploration. Reporting of health‐related quality of life using tools validated for CKD would be helpful in future research studies.
Quality of the evidence
We assessed the quality of study evidence using standard risks of bias domains within the Cochrane tool together with GRADE methodology. Confidence in evidence for all‐cause mortality, major cardiovascular events and health‐related quality of life was very low or could not be estimated, meaning future studies might offer different results. No study had low risk methods for allocation concealment and none of the participants or study investigators was masked to treatment allocation. We downgraded for the possibility of publication bias due to the very low numbers of data observations for each outcome, precluding formal testing.
Data summary was also difficult due to the variable methods of reporting in the individual studies. Particularly relevant was the heterogeneous manner of reporting GFR and serum creatinine concentrations. Some studies did not report an estimate of variance (SE or SD) and some provided data in descriptive or figure format only.
Potential biases in the review process
Potential biases in this review relate to the data availability in the individual studies. First, there was heterogeneity in treatment interventions and comparisons; due to the small number of data observations, robust statistical estimates of heterogeneity could not be estimated. Second, we could not assess for potential reporting bias due to the small number of studies in the review. Third, while most participants had moderate CKD (stage 3 or 4), there was wide variation in the definition of kidney disease for inclusion in eligible studies. Fourth, studies were frequently at high risks of bias, but poorer quality studies could not be excluded from sensitivity analyses due to the limited number of data observations. Fifth, the treatment endpoints were principally surrogate markers of health (blood pressure, serum cholesterol, serum albumin) and the effects of dietary interventions on longer term outcomes remains uncertain. Sixth, adverse event reporting in the available studies was infrequent and inconsistent. Finally, selective outcome reporting was a limitation across the included studies.
Agreements and disagreements with other studies or reviews
A recently published Cochrane review (McMahon 2015) evaluated salt restriction among patients with CKD. While the intervention decreased blood pressure, as in this review there were insufficient data available to assess the impact of salt restriction on all‐cause mortality or cardiovascular mortality. Similarly, in a Cochrane review of dietary interventions for mineral and bone disorder in CKD, there was low quality evidence that calcium enriched bread might influence biochemical parameters, and data were insufficient to identify treatment effects on clinical outcomes including cardiovascular mortality and fracture (Liu 2015). In a Cochrane review of low protein diets among people with CKD, a delay in progression of CKD was observed with a low protein intake (Fouque 2009). A recent meta‐analysis of eight non‐randomised of eating patterns among 15,285 people with CKD, healthy eating was associated with lower risks of all‐cause mortality (RR 0.73, 95% CI 0.63 to 0.83), but no effect on ESKD was detected (personal communication). The possible reasons for differences between the findings of that review and the present meta‐analysis could include the non‐randomised nature of the data, with the possibility of residual confounding accounting for the results, or a larger sample size providing greater statistical power to observe differences between treatment groups. A non‐randomised study conducted in the general population reported a dietary pattern rich in whole grains, fruit, and low‐fat dairy foods was associated with lower urinary albumin to creatinine ratio (Nettleton 2008). Albumin to creatinine ratio is used as a proxy marker for possibility of development of kidney disease in the general population and is also suggestive of increased risk of cardiovascular disease in patients with diabetes and hypertension. The finding that a study in this review showing a diet pattern with lower red meat and carbohydrates and higher olive oil content was associated with lower risks of kidney failure suggests larger studies evaluating dietary patterns on progression of CKD are clinically relevant.
Flow diagram of study selection
Risk of bias graph: review authors' judgements about each risk of bias item presented as percentages across all included studies.
Risk of bias summary: review authors' judgements about each risk of bias item for each included study.

Comparison 1 Dietary intervention versus control, Outcome 1 All‐cause mortality.

Comparison 1 Dietary intervention versus control, Outcome 2 Cardiovascular mortality.
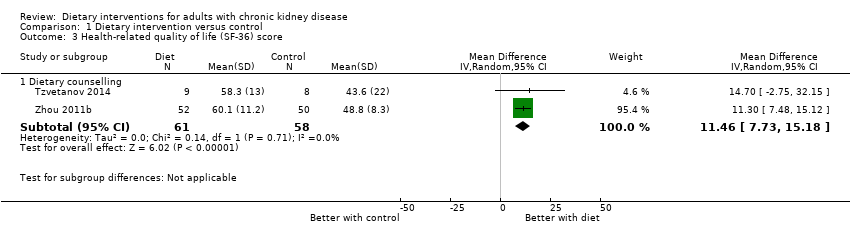
Comparison 1 Dietary intervention versus control, Outcome 3 Health‐related quality of life (SF‐36) score.
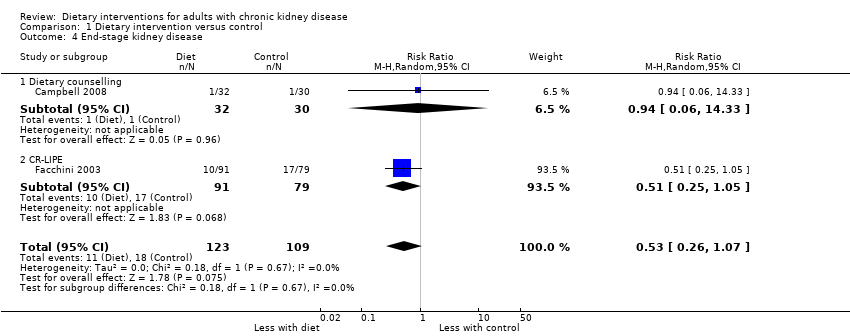
Comparison 1 Dietary intervention versus control, Outcome 4 End‐stage kidney disease.

Comparison 1 Dietary intervention versus control, Outcome 5 Doubling of serum creatinine.

Comparison 1 Dietary intervention versus control, Outcome 6 Employment.
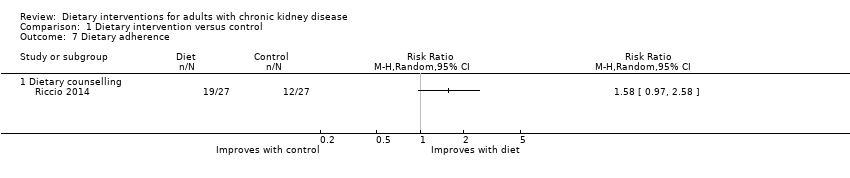
Comparison 1 Dietary intervention versus control, Outcome 7 Dietary adherence.
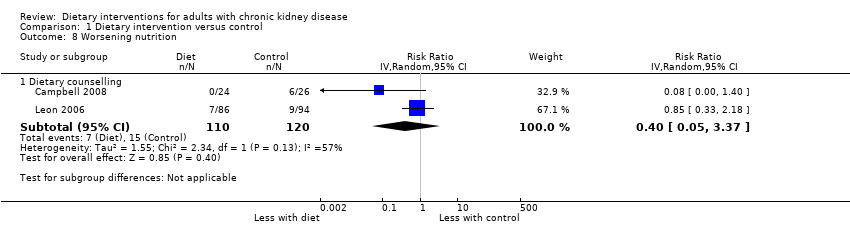
Comparison 1 Dietary intervention versus control, Outcome 8 Worsening nutrition.
![Comparison 1 Dietary intervention versus control, Outcome 9 eGFR [mL/min/1.73 m2].](/cdsr/doi/10.1002/14651858.CD011998.pub2/media/CDSR/CD011998/image_n/nCD011998-CMP-001-09.png)
Comparison 1 Dietary intervention versus control, Outcome 9 eGFR [mL/min/1.73 m2].

Comparison 1 Dietary intervention versus control, Outcome 10 Serum creatinine.
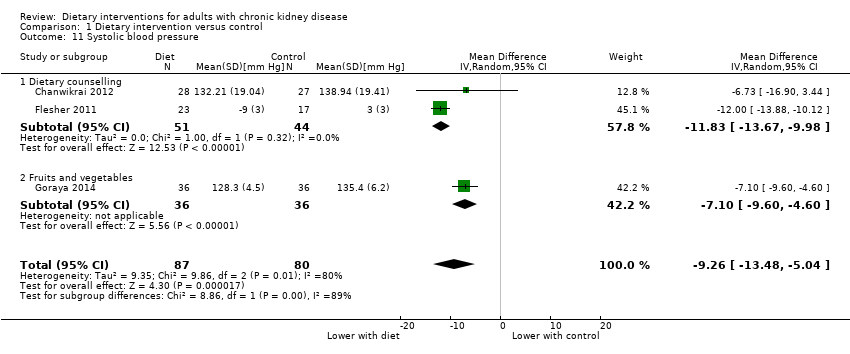
Comparison 1 Dietary intervention versus control, Outcome 11 Systolic blood pressure.

Comparison 1 Dietary intervention versus control, Outcome 12 Diastolic blood pressure.

Comparison 1 Dietary intervention versus control, Outcome 13 Energy intake.
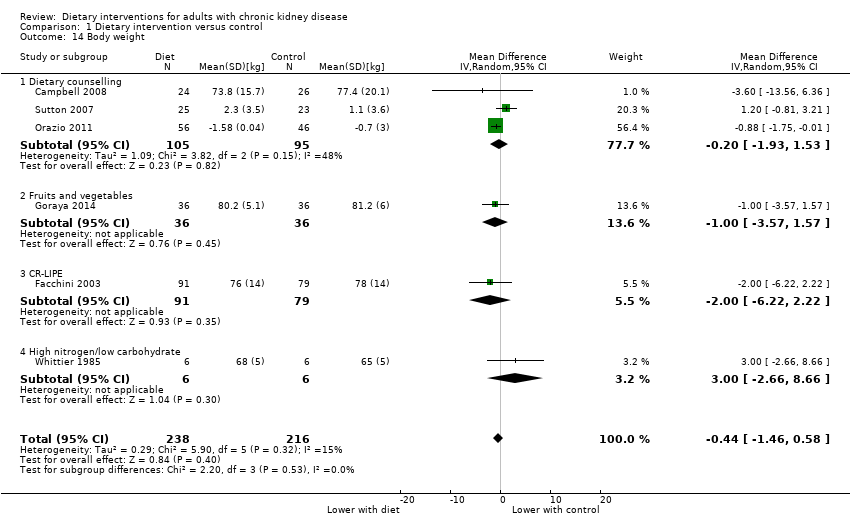
Comparison 1 Dietary intervention versus control, Outcome 14 Body weight.
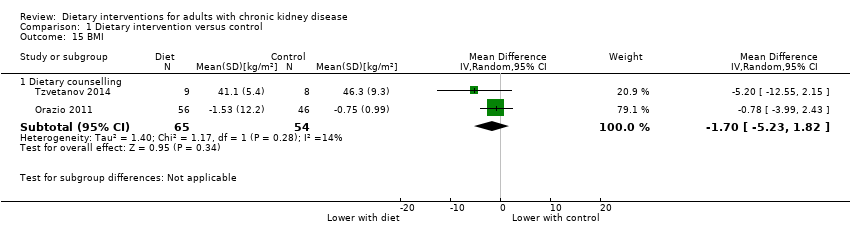
Comparison 1 Dietary intervention versus control, Outcome 15 BMI.
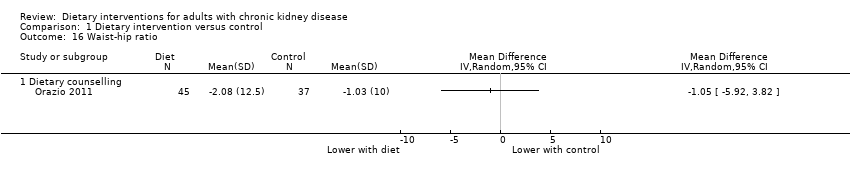
Comparison 1 Dietary intervention versus control, Outcome 16 Waist‐hip ratio.

Comparison 1 Dietary intervention versus control, Outcome 17 Waist circumference, cm.

Comparison 1 Dietary intervention versus control, Outcome 18 Arm circumference.
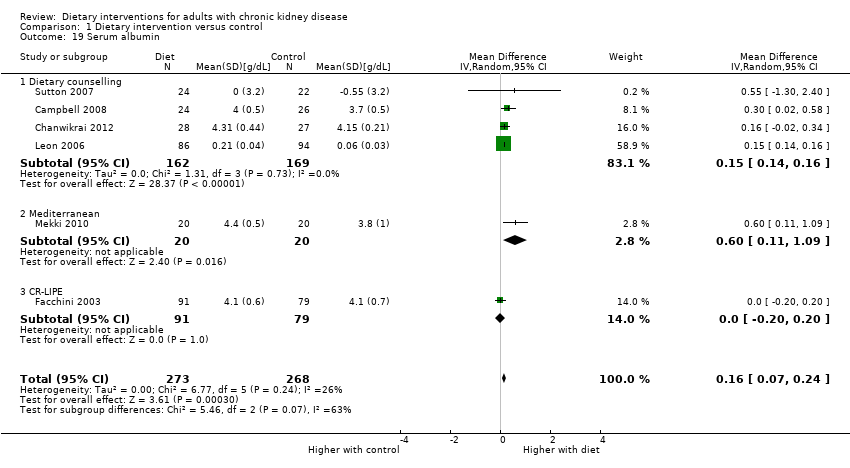
Comparison 1 Dietary intervention versus control, Outcome 19 Serum albumin.

Comparison 1 Dietary intervention versus control, Outcome 20 Serum LDL cholesterol.

Comparison 2 Mediterranean diet versus low fat, Outcome 1 Serum LDL cholesterol.
![Comparison 3 Fruits and vegetables versus bicarbonate, Outcome 1 eGFR [mL/min/1.73 m2].](/cdsr/doi/10.1002/14651858.CD011998.pub2/media/CDSR/CD011998/image_n/nCD011998-CMP-003-01.png)
Comparison 3 Fruits and vegetables versus bicarbonate, Outcome 1 eGFR [mL/min/1.73 m2].

Comparison 3 Fruits and vegetables versus bicarbonate, Outcome 2 Serum creatinine.

Comparison 3 Fruits and vegetables versus bicarbonate, Outcome 3 Systolic blood pressure.
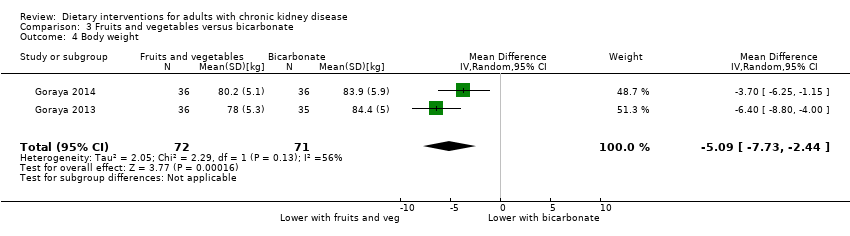
Comparison 3 Fruits and vegetables versus bicarbonate, Outcome 4 Body weight.
| Dietary modifications (counselling or dietary change) versus control for CKD | ||||||
| Patient or population: people with CKD Intervention: dietary modifications Comparison: control | ||||||
| Outcomes | Illustrative comparative risks* (95% CI) | Relative effect | No. of participants | Quality of the evidence | Comments | |
| Assumed risk | Corresponding risk | |||||
| Standard care | Dietary intervention | |||||
| Death | High risk population | Not estimable | 539 (5) | ⊕⊖⊖⊖ | Studies were not designed to measure effects of dietary interventions on mortality | |
| 150 per 1000 | Not estimable | |||||
| Medium risk population | ||||||
| 25 per 1000 | Not estimable | |||||
| Major cardiovascular event | High risk population | Not estimable | Insufficient data observations | No studies were available for this outcome | Studies were not designed to measure effects of dietary interventions on cardiovascular events. 0 studies reported major cardiovascular events | |
| 150 per 1000 | Not estimable | |||||
| Medium risk population | ||||||
| 45 per 1000 | Not estimable | |||||
| Progression to ESKD Measured as requiring dialysis treatment in people with CKD | 0.6 per 1000 | 0.3 per 1000 | RR 0.53 (0.26 to 1.07) | 242 (2) | ⊕⊖⊖⊖ | 29 participants developed ESKD in these studies. No studies included recipients of a kidney transplant |
| Health‐related quality of life Measured using the Short Form‐36 scale from 0 to 100 | The mean SF‐36 score ranged across control groups from 43.6 to 48.8 | The mean SF‐36 score in the intervention groups was 11.46 higher (95% CI 7.73 to 15.18) | 119 (2) | ⊕⊕⊖⊖ | 0 studies included recipients of a kidney transplant. None of the studies were blinded | |
| *The basis for the assumed risk of mortality (e.g. the median control group risk across studies) was obtained from the absolute population risk estimated from previously published cohort studies or data registries (Johnson 2011; Weiner 2006). The corresponding risk (and its 95% confidence interval) is based on the assumed risk in the comparison group and the relative effect of the intervention (and its 95% CI). | ||||||
| GRADE Working Group grades of evidence | ||||||
| 1 Study limitations were due to high or unclear risks of bias 2 Confidence interval includes range of plausible values that include substantial benefit or harm 3 Based on few events and/or participants across all studies 4 Data not available for recipients of a kidney transplant | ||||||
| Study ID | Treatment | Control | CKD stage | GFR (mL/min) | Mean age | % men | Mean GFR (mL/min) | Mean BMI (kg/m2) | Detailed inclusion criteria |
| Counselling | |||||||||
| Dietary counselling | Written material | 4‐5 | ≤ 30 | 69.5 (11.7) 70.9 (11.6) | 61 | 23.1 (7.2) 21.6 (6.1) | 26.8 (4.7) 27.6 (5.2) | > 18 years; eGFR < 30 mL/min/1.73 m2; CKD not previously seen by a dietitian for stage 4 CKD; absence of communication or intellectual impairment; absence of malnutrition from a cause other than CKD; not expected to require RRT within 6 months | |
| Dietary counselling | Standard care | 3‐5 | ‐‐ | ‐‐ | ‐‐ | ‐‐ | ‐‐ | CKD stage 3‐5 | |
| Dietary counselling + exercise | Standard care | 3‐4 | 20‐60 | 63.4 (12.1) 63.4 (11.8) | 53 | 37.2 (3.2) 38.4 (3.0) | ‐‐ | eGFR 20 to 60 mL/min for ≥3 months; presence of urinary protein; adult (≥ 19 years); hypertension or taking at least 1 antihypertensive medication; physician approval to exercise | |
| Dietary counselling and targeting nutritional barriers | Standard care | 5 (HD) | Dialysis | 62 60 | 42 | ‐‐ | 29.0 27.9 | 18 to 85 years; receiving dialysis for at least 9 months; mean serum albumin level for previous 3 months < 3.70 g/dL (bromcresol green method) or < 3.40 g/dL (bromcresol purple method) | |
| Dietary counselling | Standard care | Transplant | Transplant | 54.9 (9.9) 54.7 (11.8) | 61 | 54 (20) 48 (17) | 29 (5) 29 (6) | Kidney transplant > 6 months | |
| Dietary counselling | Low protein diet | ‐‐ | ‐‐ | ‐‐ | ‐‐ | ‐‐ | ‐‐ | CKD not requiring dialysis | |
| Dietary counselling + physical activity | Standard care | 5 (PD) | Dialysis | 60.7 (15.5) 58.5 (15.4) | 55 | ‐‐ | 25.4 (3.8) 25.7 (3.4) | Treatment with CAPD for 3 months or longer; not diabetic | |
| Dietary counselling + exercise | Standard care | 1‐3 | ‐‐ | 62.1 (14.0) 65.7 (11.2) | 71 | 53.7 (18.3) 49.5 (13.3) | 24.4 (3.9) 25.3 (3.1) | 20 years or older; communicate in Mandarin or Taiwanese; aware of CKD diagnosis; GFR range 30 to 106.7 mL/min/1.73 m2 | |
| Dietary counselling + exercise | Standard care | Transplant | Transplant | 46 (6.9) 45 (19) | 47 | ‐‐ | ‐‐ | Kidney transplant; obese | |
| Dietary counselling | Standard care | 5 (PD) | Dialysis | 57.8 (12.8) 59.9 (13.6) | 71 | ‐‐ | 23.3 (4.5) 22.8 (6.2) | 18 to 70 years; receiving long‐term dialysis > 3 months | |
| Mediterranean diet | |||||||||
| Mediterranean diet (restricted calorie) | Low‐fat (restricted calorie) diet Low‐carbohydrate (unrestricted calorie) diet | 3 | 30‐60 | 52.5 (6.2) | 99 | 52.6 (5.9) | 30.9 (3.4) | 40 to 65 years with BMI ≥ 27 kg/m2; individuals with type 2 diabetes or coronary heart disease were eligible regardless of age. Post‐hoc analysis among participants with eGFR 30 to 60 mL/min/1.73 m2 | |
| Mediterranean diet | Standard care | 2‐3 | 60‐89 | 60 (10) 59 (12) | 53 | 70 (10) 75 (15) | 26.9 (3.9) 25.1 (4.2) | eGFR 60 to 89 mL/min/1.73 m2; dyslipidaemia | |
| Modified Mediterranean diet | Low fat diet | Transplant | Transplant | 41 (12.5) 46 (9.5) | 68 | ‐‐ | 25.0 (4.1) 26.2 (4.2) | Stable transplant function | |
| Increased fruit and vegetables | |||||||||
| Increased fruit and vegetable intake | Oral bicarbonate | 4 | 15‐29 | 53.9 (6.9) 54.2 (5.3) | 54 | 22.8 (4.9) 23.0 (3.5) | ‐‐ | Non‐malignant hypertension; eGFR 15 to 29 mL/min/1.73 m2; plasma TCO2< 22 mM; no diabetes or cardiovascular disease; two or more primary care physician visits in previous year; age ≥ 18 years | |
| Increased fruit and vegetable intake | Oral bicarbonate Standard care | 3 | 30‐59 | 53.5 (5.2) 53.9 (4.8) | 44 | 42.3 (7.1) 42.6 (7.6) | ‐‐ | Non‐malignant hypertension, eGFR 30 to 59 mL/min/1.73 m2; plasma TCO2< 25 mM; macroalbuminuria; able to tolerate angiotensin‐converting inhibition; non‐smoking for ≥ 1 year; no diabetes or cardiovascular disease; 2 or more primary care physician visits in previous year; ≥ 18 years | |
| Carbohydrate‐restricted, low‐iron, polyphenol enriched (CR‐LIPE) diet | |||||||||
| CR‐LIPE diet | Protein restriction | 2‐5 | 15‐75 | 59 (10) 60 (12) | 51 | 64 (28) 62 (32) | 28 (5) 28 (5) | Type 2 diabetes; referred to nephrology clinic for kidney failure (15 ± 75 mL/min); otherwise unexplained proteinuria (350 ± 12,000 mg/d); kidney disease attributed to diabetes | |
| High‐nitrogen, low‐carbohydrate diet | |||||||||
| High‐nitrogen, low carbohydrate diet | Standard care | Transplant | Transplant | 33 32 | 75 | ‐‐ | ‐‐ | Kidney transplant; no diabetes | |
| BMI ‐ body mass index; CAPD ‐ continuous ambulatory peritoneal dialysis; CKD ‐ chronic kidney disease; eGFR ‐ estimated glomerular filtration rate; HD ‐ haemodialysis; PD ‐ peritoneal dialysis; RRT ‐ renal replacement therapy; TCO2 ‐ total carbon dioxide | |||||||||
| Study ID | Materials | Dietary intervention | Adherence | |||||||
| Why | What | Who | How | Where | When and how much | Tailoring | Modification | Planned | Actual | |
| Counselling | ||||||||||
| To determine whether individual nutrition counselling improves body composition, energy intake, and nutritional status | Individualised dietary prescription (including energy (125 to 146 kJ/kg/d) and protein (0.75 to 1.0 g/kg/d)) incorporating KDOQI recommendations to provide intensive nutritional counselling with regular monitoring | Dietitian | Face‐to‐face, telephone, individualised | ‐‐ | Baseline for 60 min; then biweekly for 1st month (15 to 30 min); then weekly till end of study period | Depending on dietary requirements, diet was tailored following clinical data and initial interview. Delivery was guided by the medical nutrition therapy framework from the American Dietetic Association | Self‐management principles: goal‐setting, menu planning, label reading, and identification of foods containing protein, sodium, and so on, depending on requirements | Dietary intake assessed using 3‐day food record, verified by the dietitian. Strategies to improve adherence or fidelity not reported | No patient voluntarily withdrew from the study | |
| Changes of diet and lifestyle can slow progression of CKD | Dietary modification with or without exercise by an empowerment approach (including low protein 0.6 to 0.8 g/kg/d) and low salt (5 g/d). | ‐‐ | ‐‐ | ‐‐ | ‐‐ | ‐‐ | ‐‐ | ‐ | 81 (96%) completed the study program | |
| To determine whether additional of cooking and exercise classes would slow progression of CKD | Individual nutrition counselling on moderate protein and low sodium, with individualised modification of potassium and/or phosphate plus a group nutrition class, cooking classes with a dietitian and cook education, CKD cookbook, shopping tour, and 12‐week exercise program led by a Certified Exercise Physiologist and nurse. Exercise program started after 6 months | Cooking class ‐ dietitian and cook educator; Exercise ‐ exercise physiologist and nurse | Face‐to‐face; individual and group sessions | Exercise class took place in well‐equipped gym at Garatt Wellness Centre: details regarding cooking class not provided | Cooking classes over 4 weeks for 2 hour session, shopping tour; Exercise class at Garratt Wellness centre, 3 x 1 hour session/week with strength training, flexibility components, resistance training | Skills for tailoring and modifying diet and lifestyle were provided. Diet history was discussed in detail at the individual appointments | Self‐management focus in using goal‐setting and building confidence in the management of disease | Adherence to exercise was assessed by physical activity readiness questionnaire and 6 minute submaximal walk test; biochemical and clinical parameters related to cardiovascular health; monitored at baseline, 6 months and 12 months | Overall, the experimental group showed ‘improvement’’ | |
| Whether targeting specific nutritional barriers will improve albumin levels | Study coordinators abstracted medical records and interviewed participants to determine the presence of 10 specific nutritional barriers (nutritional knowledge, appetite, help needed with cooking and shopping, low fluid intake, dialysis dose, depression, difficulty chewing, difficulty swallowing, gastrointestinal symptoms, acidosis). Study coordinators educated all intervention patients about | Study coordinators; dietitians | Face‐to‐face; individualised | During dialysis sessions | During the next 12 months, study coordinators met monthly with patients to reinforce recommendations, | Tailored to specific nutritional barriers identified during interviews | Specific to nutritional barriers | ‐‐ | ‐‐ | |
| To investigate the effect of dietitian involvement in a multidisciplinary lifestyle intervention comparing risk factor modification for cardiovascular disease with standard post‐transplant care in kidney transplant recipients with abnormal glucose tolerance | Individualised dietary advice was provided to participants for the duration of the study. Achievement and/or maintenance of a healthy weight (BMI), 20 to 25 kg/m2) was the primary goal of nutrition therapy using a Mediterranean‐style (< 30% total energy from The long‐term goal of physical activity advice was to achieve 150 min of accumulated physical activity/week, in accordance with current National Physical Activity Recommendations. To help achieve this, goals The Transtheoretical Model of Health Behavior Change or Stage of Change Model underpinned the lifestyle intervention to provide a framework for goal‐setting throughout the study | Multidisciplinary team (nephrologist, dietitian, nurse, endocrinologist) | Individualised advice from nephrologist, dietitian, nurse and endocrinologist (individual or group) | Multiple locations and settings including during routine transplant care, outpatient dietetic and nursing care, and routine diabetes management | Bimonthly reviews for 2 years by nephrologist; 4‐week initial program from dietitian with bimonthly reviews for 2 years and 6 monthly group meetings; bimonthly reviews by nurse and endocrinologist | Dietitian delivery of individual diet initially and then individualist dietetic reviews including weight, waist circumference and hip circumference measurements | Specific to patient and anthropomorphic measurements during follow‐up | ‐‐ | 8/96 participants chose to withdraw | |
| To determine if a simplified dietary approach self‐managed by patients had beneficial impact on nutritional and metabolic control of CKD, to be acceptable and safe | List of recommendations to modify dietary habits (do not add salt at table or for cooking; foods to avoid; replacing noodles or bread; meat, fish and egg intake; 4‐5 servings of fruit or vegetables; replacement of noodles with legumes | Nephrologist | Face‐to‐face; individualised | ‐‐ | ‐‐ | The goal of the study was to tailor and modify diet for participants in intervention group (not otherwise specified) | ‐‐ | Adherence to diet was assessed at regular intervals (1, 3 and 6th), method for assessing adherence was not reported | 19/27 in intervention group were adherent with protein prescription whereas 12/27 in control group were adherent with protein prescription | |
| To determine whether offering dietary advice was effective in supporting patients in adjusting energy intake | The intervention group was offered follow‐up dietary advice that would encourage them to match energy intake with their estimated energy expenditure allowing for dialysate calories and with a protein intake of not < 0.8 to 1.0 g/kg IBW | Dietitian | Face‐to‐face | ‐‐ | Face‐to‐face contact at baseline and 4 months. Suggested snack ideas, alterations in food preparation, or modification of portion sizes | ‐‐ | ‐‐ | ‐ | 49/59 participants completed the study | |
| To examine effects of a targeted Lifestyle Modification Program on lifestyle behaviours, knowledge, and physical indicators of CKD | The Trans Theoretical model using the stage‐of‐change construct was used to assess the patient's readiness stage to promote behaviour change. Targeted interventions were given according to the stage of change about diet and exercise. Patients were encouraged to find individual methods of overcoming barriers to regular exercise. Written materials were provided to encourage adherence to a CKD diet. An information booklet on protecting kidney function was provided and reviewed with patient. Discussion provided information about kidney function and disease, and dietary and lifestyle management | Registered nurse research assistants | Face‐to‐face; individualised | Clinic | Counselling provided with each clinic visit | The goal of the study to tailor and modify diet for participants in intervention group | ‐‐ | To ensure the fidelity of the Lifestyle Modification Program, all provided counselling and information were recorded, and the interventions were reviewed by the investigators at random | There was a 64.4% retention rate at 12 months | |
| Examine the effectiveness of a physical exercise program including behaviour modification interventions and nutritional training for obese recipients of a kidney transplant | Individual physical training (one‐to‐one sessions with a coach) using low‐impact, low‐repetition, resistance‐based weight training with 2 x 1‐hour sessions each week in | Coach | Individual training | Private environment | 2 x 1‐hour sessions each week for 12 months | Standardised process | Response to participants muscle strength, empowerment, and identifying most impactful behaviour/lifestyle changes for each patient | ‐ | Only 4/8 people allocated to the control returned to the 6 month follow up appointment and 2 for the 12 month appointment. Adherence with the supervised rehabilitation program and follow up was 100% in people allocated to the intervention | |
| To investigate the effects of nutrition intervention and individualised nursing care on nutritional status and quality of life in people with ESKD receiving peritoneal dialysis | An individualised nutrition intervention developed by dietitian with regard to the patient's nutritional status, clinical condition, and characteristics. The study group received the following intervention: energy 125 kJ/kg/d, protein 1.2 to 1.3 g/kg/d, and 70% to 75% proportion of protein as of high biological value. Oral enteral nutrition supplements were used for patients who did not receive enough nutrients from food. The volume of water intake was equivalent to the urine volume plus 500 mL/d and sodium was 3 g/d. In addition, nurse practitioners provided psychological care, an individualised exercise program, and blood pressure treatment | Dietitian and nurses | Individual face‐to‐face | ‐‐ | Psychological support was given for 30 min once‐monthly over 6 months | Individualised according to nutritional and clinical status | ‐‐ | ‐‐ | Not reported | |
| Mediterranean diet | ||||||||||
| To investigate the long‐term effect of Mediterranean diet on kidney function | Mediterranean diet: moderate‐fat, restricted calorie, rich in vegetables and low in red meat, with poultry and fish replacing beef and lamb. Energy intake was restricted to 1500 kcal/d for women and 1800 kcal/d for men, with a goal of no more than 35% of calories from fat; the main sources of added fat were 30 to 45 g of olive oil and a handful of nuts (5 to 7 nuts, < 20 g)/d. Low carbohydrate diet: low‐carbohydrate, non‐restricted‐calorie diet aimed to provide 20 g of carbohydrates/d for the 2‐month induction phase and immediately after religious holidays, with a gradual increase to a maximum of 120 g/d to maintain weight loss. Low fat diet: Low‐fat calorie restricted diet based on American Heart Association guidelines, with an energy intake of 1500 kcal/d for women and 1800 kcal/d for men with 30% of calories from fat, 10% of calories from saturated fat, and an intake of 300 mg of cholesterol/d. Patients were counselled to consume low‐fat grains, vegetables, fruits, and legumes and to limit consumption of additional fats, sweets, and high‐fat snacks. This study was included as a post‐hoc analysis of the main study including people with CKD (eGFR < 60 mL/min/1.73 m2) | Dietitian | Members of each treatment group were assigned to subgroups of between 17 and 19 participants, with 6 groups for each dietary treatment group. Each group was assigned to a registered dietitian who led all 6 subgroups of that dietary group. Self‐service cafeterias in workplaces worked closely with dietitians to adjust specific food items to specific diet groups. Each food item was provided with a label showing the number of calories and the number of grams of carbohydrates, fat and saturated fat | ‐‐ | Dietitians met with groups in weeks 1, 3, 5, and 7, and thereafter at 6‐week intervals, for a total of 18 sessions of 90 min each. The Israeli version of the diabetes prevention program was adapted including additional themes for each dietary change. In addition, a group of spouses received education. | 6 times during the 2‐year intervention, another dietitian conducted 10 to 15 min motivational telephone calls with patients who were having difficulty adhering to the diet. | ‐‐ | Adherence with the diets was evaluated by a validated food‐frequency questionnaire that included 127 food items and three portion‐size pictures for 17 items. A subgroup of participants completed two repeated 24‐hour dietary recalls to verify absolute intake. We used a validated questionnaire to assess physical activity. At baseline, and at 6, 12, and 24 months of follow‐up, the questionnaires were self‐administered electronically through the workplace intranet. The 15% of patients who request aid in completing the questionnaires were assisted by the study nurse | Adherence with study intervention was 95.4% at first year and 84.6% at second year | |
| To evaluate effect of nutritional advice on dyslipidaemia and biomarkers | Nutritional advice based on the National Kidney Foundation—Kidney Disease Outcomes Quality Initiative guideline (energy intake 0.12 MJ/kg BW/d, protein 0.75 g/kg BW/d, lipid intake 35%, and carbohydrates 55% of total energy intake). Dietary recommendations were modified and adapted to a Mediterranean diet with increased intake of mono‐unsaturated fatty acids (MUFA), poly‐unsaturated fatty acids (PUFA), and fibres. Patients were asked to consume olive oil and nuts for seasonings, whole grains (50 g bread at each meal, 250 g cereal or starch once a day), fruits (once a day), vegetables (200 g twice a day) and fish (twice a week). A list of foods rich in salt, potassium and phosphorus was provided. In addition, patients received advice about cooking methods best suited to adherence | ‐‐ | Face‐to‐face | Nephrology ward | ‐‐ | ‐‐ | ‐‐ | Recall and record every 4 days, patients interviewed by trained interviewers using adapted and structures questionnaire regarding 24 hour dietary intake. Serving sizes were estimated by the use of the food portion model handbook. Dimensions of dishes, utensils and | By 90 days, the qualitative distribution of nutrients had a tendency to be closer to the recommended diet | |
| To verify the effect of the Mediterranean diet on risk factors of atherosclerosis in people with a kidney transplant | This diet featured carbohydrates with a low GI (poor in glucose, simple carbohydrates, and amylose, rich in cellulose). Approved diet constituents included cereals, pulse, whole‐rye bread, vegetables (cooked or fresh), oat flakes (cooked), and noodles prepared al dente. Amylose‐rich foods, sweets, and sweet drinks were prohibited. Breakfast was the main meal, providing 39% 2% of daily calorie intake, whereas supper provided the least (16% 3%). In the study group, daily energy intake was attributed as follows: 47% carbohydrates, 38% fatty acids (including 10% saturated, 22% monounsaturated, and 6% polyunsaturated species), and 15% protein. Cholesterol and fibre supply was 165 ± 17 mg/d and 47 ± 9 g/d, respectively. The significant content of fibre in the diet was attributed to the use of fresh, unprocessed food, elimination of semi processed products, and daily intake of pulse/cereal (e.g. buckwheat, barley)/vegetables/whole‐meal rye bread. The dominating fatty acid was oleic acid from olive oil and erucic acid‐poor rapeseed oil. Patients consumed 30 mL cold‐pressed | ‐‐ | ‐‐ | ‐‐ | ‐‐ | ‐‐ | ‐‐ | Dietary adherence was ascertained every 4 weeks using questionnaires (24‐h food diaries) and monitoring oleic acid content in plasma triglycerides | The content of oleic acid in triglycerides | |
| Increased fruit and vegetables | ||||||||||
| To evaluate increased intake of base‐producing fruits and vegetables on kidney function and metabolic acidosis | Patients received fruits and vegetables free of charge, distributed from the food bank in amounts to reduce potential renal acid load by half. Prescriptions emphasised base‐producing fruits and vegetables such as apples, apricots, oranges, peaches, pears, raisins, strawberries, carrots, cauliflower, eggplant, lettuce, potatoes, spinach, tomatoes, and zucchini | Dietitian prescribed | Individuals were not given specific dietary instructions and they integrated the prescribed fruits and vegetables into their diets as they wished. To better assure that each patient ate all the prescribed fruits and vegetables, the prescribed amount was given for each household person | ‐‐ | ‐‐ | ‐‐ | ‐‐ | Formal assessment methods was not employed; however to ensure participants consumed required amount of fruit and vegetables, fruit and vegetables were distributed for whole family/household | ‐‐ | |
| To evaluate increased intake of base‐producing fruits and vegetables on kidney function and metabolic acidosis | Patients received fruits and vegetables free of charge, distributed from the food bank in amounts to reduce potential renal acid load by half. Prescriptions emphasised base‐producing fruits and vegetables such as apples, apricots, oranges, peaches, pears, raisins, strawberries, carrots, cauliflower, eggplant, lettuce, potatoes, spinach, tomatoes, and zucchini | Dietitian prescribed | Individuals were not given specific dietary instructions and they integrated the prescribed fruits and vegetables into their diets as they wished. To better assure that each patient ate all the prescribed fruits and vegetables, the prescribed amount was given for each household person | ‐‐ | ‐‐ | ‐‐ | ‐‐ | Formal assessment methods was not employed; however to ensure participants consumed required amount of fruit and vegetables, fruit and vegetables were distributed for whole family/household | ‐‐ | |
| Carbohydrate‐restricted, low‐iron, polyphenol enriched (CR‐LIPE) diet | ||||||||||
| To evaluate whether dietary modification had effect on progression of CKD | CR‐LIPE diet; 50% reduction in carbohydrate intake; substitution of iron‐enriched meats (beef and pork) with iron‐poor white meats (poultry and fish) and with protein‐enriched food items known to inhibit iron absorption (dairy; eggs; soy); elimination of all beverages other than tea, water and red wine; exclusive use of polyphenol‐enriched extra‐virgin olive oil | ‐‐ | ‐‐ | ‐‐ | ‐‐ | ‐‐ | ‐‐ | Serum ferritin level; to assess adherence with low iron diet | Serum ferritin level decreased in group on CR‐LIPE diet | |
| High‐nitrogen, low carbohydrate diet | ||||||||||
| Whether a high‐nitrogen, low carbohydrate diet could result in a positive nitrogen balance and fewer cushingoid side effects in the immediate post‐transplant period | On the morning of the 4th postoperative day, the patients were randomly assigned to receive either the control or the experimental diet. A general daily diet order was prescribed for all patients; it consisted of 800 mL fluid restriction plus an amount equal to the urine volume/d, 2 g sodium, 80 mEq potassium, 800 to 1200 mg of calcium, and 30 calories/kg. Total calories and content of the diet, in identical proportions, were adjusted up or down per kilogram to the nearest 10 kg for patients who weighed more or less than 70 kg since the ideal body weight of these patients varied from 50 to 90 kg prior to transplantation | Dietitian | Diets were prepared in batches in the metabolic kitchen by a research dietician. One meal from each batch was slurried and analysed for nitrogen and electrolyte | Inpatient General Clinical Research Centre for 4‐week duration of study. | Continuous assessment | The composition of the diet was determined according | ‐‐ | Uneaten food from each tray was weighed and subtracted from the daily | Both groups ingested a similar amount of total calories, and when factored by weight, intakes per kg of body weight were very close to the objective of 28 to 30 | |
| BMI ‐ body mass index; (I)BW ‐ (individual) body weight‐ CKD ‐ chronic kidney disease; eGFR ‐ estimated glomerular filtration rate; GI ‐ glycaemic index | ||||||||||
| Study ID | Tool | Description |
| Dietary counselling | ||
| Kidney Disease Quality of Life Short Form Version 1.3 (combining the SF‐36 with a kidney‐disease specific module) | "There was a clear trend for a mean increase in ratings from the intervention group with a clinically significant mean improvement in 13 of the 18 sub‐scales from baseline to week 12, indicated by an effect size of 0.2 or greater...". There was a statistically significant difference in mean change for scores of symptoms of kidney disease (7.1 (0.1‐14.1) P = 0.047); cognitive functioning (14.6 (5.4‐23.7) P = 0.003); and vitality (12.0 (4.6‐19.5) P = 0.002) in favour of the intervention." | |
| ‐‐ | Not reported | |
| Self‐Management Questionnaire | "Overall, the experimental group showed 'improvement' in exercise frequency, concern over health condition, and frequency of visits to health providers or hospitalisation. Overall the control group answers indicated an improvement in their communication with health providers in asking question and discussing personal issues." | |
| Kidney Disease Quality of Life questionnaire (combining the SF‐36 with a kidney‐disease specific module) | "There were no differences between intervention and control patients in quality‐of‐life subscales, including general health, physical functioning, emotional well‐being, social function, pain, and dialysis‐related symptoms." | |
| ‐‐ | Not reported | |
| ‐‐ | Not reported | |
| ‐‐ | Not reported | |
| 52‐item HPLP‐IIC questionnaire | Intervention had a significant effect on health responsibility and physical activity, but not stress management, interpersonal relations, spiritual growth or nutrition | |
| SF‐36 | "The mean SF‐36 score at 6 months was significantly higher in the intervention group compared with the control group (583±13 vs 436±22, P = 0.008), reflecting an improved perception of health status. ... The intervention group had improvements compared with the control group in the domains of vitality and general health." | |
| Kidney Disease Quality of Life Short Form Version 1.3 (combining the SF‐36 with a kidney‐disease specific module) | "Prior to intervention, the differences in KDTA and SF‐36 scores were not statistically significant in both groups (P >0.05 for all). After intervention, both KDTA and SF‐36 scores were improved in the study group, but decreased in the control group. The difference in KDTA (P = 0.001) and SF‐36 scores (P = 0.001) before and after intervention were statistically significant in both groups (Table 2)." | |
| Mediterranean diet | ||
| ‐‐ | Not reported | |
| ‐‐ | Not reported | |
| ‐‐ | Not reported | |
| Increased fruit and vegetables | ||
| ‐‐ | Not reported | |
| ‐‐ | Not reported | |
| Carbohydrate‐restricted, low‐iron‐available, polyphenol‐enriched diet | ||
| ‐‐ | Not reported | |
| High‐protein, low carbohydrate diet | ||
| ‐‐ | Not reported | |
| Study | Adverse events reported in study |
| Campbell 2008a | Mortality; need for dialysis |
| Not reported | |
| Not reported | |
| Not reported | |
| Not reported | |
| No participants meeting eGFR and plasma potassium criteria developed plasma potassium concentration >5.0 mEq/L | |
| Not reported | |
| Not reported | |
| Not reported | |
| Not reported | |
| Not reported | |
| Not reported | |
| Mortality; transfer from PD to HD | |
| Not reported | |
| Not reported | |
| Dialysis due to elevated blood urea and potassium concentrations | |
| Not reported | |
| eGFR ‐ estimated glomerular filtration rate; HD ‐ haemodialysis; PD ‐ peritoneal dialysis | |
| Outcome or subgroup title | No. of studies | No. of participants | Statistical method | Effect size |
| 1 All‐cause mortality Show forest plot | 5 | Risk Ratio (IV, Random, 95% CI) | Subtotals only | |
| 1.1 Dietary counselling | 4 | 371 | Risk Ratio (IV, Random, 95% CI) | 1.59 [0.60, 4.21] |
| 1.2 CR‐LIPE | 1 | 170 | Risk Ratio (IV, Random, 95% CI) | 0.50 [0.22, 1.12] |
| 2 Cardiovascular mortality Show forest plot | 1 | Risk Ratio (IV, Random, 95% CI) | Totals not selected | |
| 2.1 Dietary counselling | 1 | Risk Ratio (IV, Random, 95% CI) | 0.0 [0.0, 0.0] | |
| 3 Health‐related quality of life (SF‐36) score Show forest plot | 2 | Mean Difference (IV, Random, 95% CI) | Subtotals only | |
| 3.1 Dietary counselling | 2 | 119 | Mean Difference (IV, Random, 95% CI) | 11.46 [7.73, 15.18] |
| 4 End‐stage kidney disease Show forest plot | 2 | 232 | Risk Ratio (M‐H, Random, 95% CI) | 0.53 [0.26, 1.07] |
| 4.1 Dietary counselling | 1 | 62 | Risk Ratio (M‐H, Random, 95% CI) | 0.94 [0.06, 14.33] |
| 4.2 CR‐LIPE | 1 | 170 | Risk Ratio (M‐H, Random, 95% CI) | 0.51 [0.25, 1.05] |
| 5 Doubling of serum creatinine Show forest plot | 1 | Risk Ratio (M‐H, Random, 95% CI) | Totals not selected | |
| 5.1 CR‐LIPE | 1 | Risk Ratio (M‐H, Random, 95% CI) | 0.0 [0.0, 0.0] | |
| 6 Employment Show forest plot | 1 | Risk Ratio (M‐H, Random, 95% CI) | Totals not selected | |
| 6.1 Dietary counselling | 1 | Risk Ratio (M‐H, Random, 95% CI) | 0.0 [0.0, 0.0] | |
| 7 Dietary adherence Show forest plot | 1 | Risk Ratio (M‐H, Random, 95% CI) | Totals not selected | |
| 7.1 Dietary counselling | 1 | Risk Ratio (M‐H, Random, 95% CI) | 0.0 [0.0, 0.0] | |
| 8 Worsening nutrition Show forest plot | 2 | Risk Ratio (IV, Random, 95% CI) | Subtotals only | |
| 8.1 Dietary counselling | 2 | 230 | Risk Ratio (IV, Random, 95% CI) | 0.40 [0.05, 3.37] |
| 9 eGFR [mL/min/1.73 m2] Show forest plot | 5 | 219 | Std. Mean Difference (IV, Random, 95% CI) | 1.08 [0.20, 1.97] |
| 9.1 Dietary counselling | 3 | 107 | Std. Mean Difference (IV, Random, 95% CI) | 1.41 [‐0.40, 3.23] |
| 9.2 Mediterranean | 1 | 40 | Std. Mean Difference (IV, Random, 95% CI) | 0.23 [‐0.39, 0.85] |
| 9.3 Fruits and vegetables | 1 | 72 | Std. Mean Difference (IV, Random, 95% CI) | 1.14 [0.64, 1.64] |
| 10 Serum creatinine Show forest plot | 3 | 112 | Mean Difference (IV, Random, 95% CI) | 0.83 [‐16.57, 18.23] |
| 10.1 Dietary counselling | 2 | 72 | Mean Difference (IV, Random, 95% CI) | 1.79 [‐24.47, 28.05] |
| 10.2 Mediterranean | 1 | 40 | Mean Difference (IV, Random, 95% CI) | ‐1.0 [‐26.17, 24.17] |
| 11 Systolic blood pressure Show forest plot | 3 | 167 | Mean Difference (IV, Random, 95% CI) | ‐9.26 [‐13.48, ‐5.04] |
| 11.1 Dietary counselling | 2 | 95 | Mean Difference (IV, Random, 95% CI) | ‐11.83 [‐13.67, ‐9.98] |
| 11.2 Fruits and vegetables | 1 | 72 | Mean Difference (IV, Random, 95% CI) | ‐7.10 [‐9.60, ‐4.60] |
| 12 Diastolic blood pressure Show forest plot | 2 | Mean Difference (IV, Random, 95% CI) | Subtotals only | |
| 12.1 Dietary counselling | 2 | 95 | Mean Difference (IV, Random, 95% CI) | ‐8.95 [‐10.69, ‐7.21] |
| 13 Energy intake Show forest plot | 6 | Std. Mean Difference (IV, Random, 95% CI) | Subtotals only | |
| 13.1 Dietary counselling | 4 | 340 | Std. Mean Difference (IV, Random, 95% CI) | 1.54 [‐0.87, 3.95] |
| 13.2 Mediterranean diet | 1 | 40 | Std. Mean Difference (IV, Random, 95% CI) | 1.86 [1.11, 2.61] |
| 13.3 High nitrogen/low carbohydrate | 1 | 12 | Std. Mean Difference (IV, Random, 95% CI) | ‐0.65 [‐1.82, 0.53] |
| 14 Body weight Show forest plot | 6 | 454 | Mean Difference (IV, Random, 95% CI) | ‐0.44 [‐1.46, 0.58] |
| 14.1 Dietary counselling | 3 | 200 | Mean Difference (IV, Random, 95% CI) | ‐0.20 [‐1.93, 1.53] |
| 14.2 Fruits and vegetables | 1 | 72 | Mean Difference (IV, Random, 95% CI) | ‐1.0 [‐3.57, 1.57] |
| 14.3 CR‐LIPE | 1 | 170 | Mean Difference (IV, Random, 95% CI) | ‐2.0 [‐6.22, 2.22] |
| 14.4 High nitrogen/low carbohydrate | 1 | 12 | Mean Difference (IV, Random, 95% CI) | 3.0 [‐2.66, 8.66] |
| 15 BMI Show forest plot | 2 | Mean Difference (IV, Random, 95% CI) | Subtotals only | |
| 15.1 Dietary counselling | 2 | 119 | Mean Difference (IV, Random, 95% CI) | ‐1.70 [‐5.23, 1.82] |
| 16 Waist‐hip ratio Show forest plot | 1 | Mean Difference (IV, Random, 95% CI) | Totals not selected | |
| 16.1 Dietary counselling | 1 | Mean Difference (IV, Random, 95% CI) | 0.0 [0.0, 0.0] | |
| 17 Waist circumference, cm Show forest plot | 1 | Mean Difference (IV, Random, 95% CI) | Totals not selected | |
| 17.1 Dietary counselling | 1 | Mean Difference (IV, Random, 95% CI) | 0.0 [0.0, 0.0] | |
| 18 Arm circumference Show forest plot | 2 | Mean Difference (IV, Random, 95% CI) | Subtotals only | |
| 18.1 Dietary counselling | 2 | 149 | Mean Difference (IV, Random, 95% CI) | 0.37 [‐0.39, 1.12] |
| 19 Serum albumin Show forest plot | 6 | 541 | Mean Difference (IV, Random, 95% CI) | 0.16 [0.07, 0.24] |
| 19.1 Dietary counselling | 4 | 331 | Mean Difference (IV, Random, 95% CI) | 0.15 [0.14, 0.16] |
| 19.2 Mediterranean | 1 | 40 | Mean Difference (IV, Random, 95% CI) | 0.60 [0.11, 1.09] |
| 19.3 CR‐LIPE | 1 | 170 | Mean Difference (IV, Random, 95% CI) | 0.0 [‐0.20, 0.20] |
| 20 Serum LDL cholesterol Show forest plot | 2 | Mean Difference (IV, Random, 95% CI) | Totals not selected | |
| 20.1 Mediterranean diet | 1 | Mean Difference (IV, Random, 95% CI) | 0.0 [0.0, 0.0] | |
| 20.2 CR‐LIPE | 1 | Mean Difference (IV, Random, 95% CI) | 0.0 [0.0, 0.0] | |
| Outcome or subgroup title | No. of studies | No. of participants | Statistical method | Effect size |
| 1 Serum LDL cholesterol Show forest plot | 1 | Mean Difference (IV, Random, 95% CI) | Totals not selected | |
| Outcome or subgroup title | No. of studies | No. of participants | Statistical method | Effect size |
| 1 eGFR [mL/min/1.73 m2] Show forest plot | 2 | 143 | Mean Difference (IV, Random, 95% CI) | 0.84 [‐0.84, 2.53] |
| 2 Serum creatinine Show forest plot | 1 | Mean Difference (IV, Random, 95% CI) | Totals not selected | |
| 3 Systolic blood pressure Show forest plot | 2 | 143 | Mean Difference (IV, Random, 95% CI) | ‐5.81 [‐8.84, ‐2.77] |
| 4 Body weight Show forest plot | 2 | 143 | Mean Difference (IV, Random, 95% CI) | ‐5.09 [‐7.73, ‐2.44] |