Preventing occupational stress in healthcare workers
Abstract
Background
Healthcare workers can suffer from occupational stress as a result of lack of skills, organisational factors, and low social support at work. which may lead to distress, burnout and psychosomatic problems, and deterioration in quality of life and service provision.
Objectives
To evaluate the effectiveness of work‐ and person‐directed interventions compared to no intervention or alternative interventions in preventing stress at work in healthcare workers.
Search methods
We searched the Cochrane Central Register of Controlled Trials (CENTRAL), MEDLINE, EMBASE, PsycINFO, CINAHL, NIOSHTIC‐2 and Web of Science up to November 2013.
Selection criteria
Randomised controlled trials (RCTs) of interventions aimed at preventing psychological stress in healthcare workers. For organisational interventions, interrupted time‐series and controlled before‐and‐after (CBA) studies were also eligible.
Data collection and analysis
Two review authors independently extracted data and assessed trial quality. We used Standardised Mean Differences (SMDs) where authors of trials used different scales to measure stress or burnout. We combined studies that were similar in meta‐analyses. We used the GRADE system to rate the quality of the evidence.
Main results
In this update, we added 39 studies, making a total of 58 studies (54 RCTs and four CBA studies), with 7188 participants. We categorised interventions as cognitive‐behavioural training (CBT) (n = 14), mental and physical relaxation (n = 21), combined CBT and relaxation (n = 6) and organisational interventions (n = 20). Follow‐up was less than one month in 24 studies, one to six in 22 studies and more than six months in 12 studies. We categorised outcomes as stress, anxiety or general health.
There was low‐quality evidence that CBT with or without relaxation was no more effective in reducing stress symptoms than no intervention at one month follow‐up in six studies (SMD ‐0.27 (95% Confidence Interval (CI) ‐0.66 to 0.13; 332 participants). But at one to six months follow‐up in seven studies (SMD ‐0.38, 95% CI ‐0.59 to ‐0.16; 549 participants, 13% relative risk reduction), and at more than six months follow‐up in two studies (SMD ‐1.04, 95% CI ‐1.37 to ‐0.70; 157 participants) CBT with or without relaxation reduced stress more than no intervention.
CBT interventions did not lead to a considerably greater effect than an alternative intervention, in three studies.
Physical relaxation (e.g. massage) was more effective in reducing stress than no intervention at one month follow‐up in four studies (SMD ‐0.48, 95% CI ‐0.89 to ‐0.08; 97 participants) and at one to six months follow‐up in six studies (SMD ‐0.47; 95% CI ‐0.70 to ‐0.24; 316 participants). Two studies did not find a considerable difference in stress between massage and taking extra breaks.
Mental relaxation (e.g. meditation) led to similar stress symptom levels as no intervention at one to six months follow‐up in six studies (SMD ‐0.50, 95% CI ‐1.15 to 0.15; 205 participants) but to less stress in one study at more than six months follow‐up. One study showed that mental relaxation reduced stress more effectively than attending a course on theory analysis and another that it was more effective than just relaxing in a chair.
Organisational interventions consisted of changes in working conditions, organising support, changing care, increasing communication skills and changing work schedules. Changing work schedules (from continuous to having weekend breaks and from a four‐week to a two‐week schedule) reduced stress with SMD ‐0.55 (95% CI ‐0.84 to ‐0.25; 2 trials, 180 participants). Other organisational interventions were not more effective than no intervention or an alternative intervention.
We graded the quality of the evidence for all but one comparison as low. For CBT this was due to the possibility of publication bias, and for the other comparisons to a lack of precision and risk of bias. Only for relaxation versus no intervention was the evidence of moderate quality.
Authors' conclusions
There is low‐quality evidence that CBT and mental and physical relaxation reduce stress more than no intervention but not more than alternative interventions. There is also low‐quality evidence that changing work schedules may lead to a reduction of stress. Other organisational interventions have no effect on stress levels. More randomised controlled trials are needed with at least 120 participants that compare the intervention to a placebo‐like intervention. Organisational interventions need better focus on reduction of specific stressors.
PICOs
Plain language summary
Preventing occupational stress in healthcare workers
Background
Healthcare workers suffer from work‐related or occupational stress. Often this is because healthcare workers face high expectations and they may not have enough time, skills and social support at work. This can lead to severe distress, burnout or physical illness. In the end, healthcare workers may be unable to provide high quality healthcare services. Stress and burnout can also be costly because affected healthcare workers take sick leave and may even change jobs.
We evaluated how well different ways to prevent healthcare workers' stress or burnout work.
Study characteristics
We included 58 studies that included altogether 7188 participants. Fiftyfour of the included studies were randomised controlled studies and four were non‐randomised studies. We categorised the interventions as either cognitive‐behavioural training, mental and physical relaxation, or organisational changes.
Key findings and quality of the evidence
Cognitive‐behavioural interventions
According to six studies, there was low‐quality evidence that cognitive‐behavioural training decreased stress with about 18% when compared to no intervention and when measured at follow‐up periods ranging from less than a month up to two years. It is unclear how relevant this reduction is for a person with stress. The results were similar when cognitive‐behavioural training was combined with relaxation. However, in three studies, stress levels were similar after a cognitive‐behavioural training course compared to other training that was not focused on stress management but on the content of care.
Mental and physical relaxation interventions
In 17 studies there was low‐ to moderate‐quality evidence that both mental and physical relaxation led to a reduction of 23% in stress levels compared to no intervention.
Organisational interventions
Organisational interventions were aimed at changing working conditions in 20 studies, improving support or mentoring in six studies, changing content of care in four studies, improving communication skills in one study and improving work schedules in two studies. Shorter or interrupted work schedules reduced stress levels in two studies but there was no clear benefit of any of the other organisational interventions.
Conclusions
We conclude that cognitive‐behavioural training as well as mental and physical relaxation all reduce stress moderately. Changing work schedules can also reduce stress, but other organisational interventions have no clear effects. We need randomised studies with at least 120 participants and preferably a single component intervention. Organisational interventions need to be better focused on addressing specific factors that cause stress.
Authors' conclusions
Summary of findings
| Cognitive‐behavioural intervention compared to no Intervention for reducing stress | ||||||
| Patient or population: Healthcare workers | ||||||
| Outcomes | Illustrative comparative risks* (95% CI) | Relative effect | No of Participants | Quality of the evidence | Comments | |
| Assumed risk | Corresponding risk | |||||
| No Intervention | Cognitive‐behavioural intervention | |||||
| Stress 1 Month | The median stress level across all control groups across all follow‐up times was 24.33 points on the Emotional Exhaustion subscale of the Maslach Burnout Inventory¹ | The mean stress level at 1 month in the intervention groups was 1.22 points lower (2.98 lower to 0.59 higher). | SMD ‐0.27 (‐0.66 to 0.13) | 332 | ⊕⊕⊝⊝ | This meta‐analysis was back transformed to the EE subscale of the MBI by using the median SD of the EE scale across control groups. |
| Stress 1 ‐ 6 months | The median stress level across all control groups across all follow‐up times was 24.33 points on the Emotional Exhaustion subscale of the Maslach Burnout Inventory¹ | The mean stress at 1 ‐ 6 months in the intervention groups was 1.83 points lower (0.77 to 2.85 lower). | SMD ‐0.38 (‐0.59 to ‐0.16) | 549 | ⊕⊕⊝⊝ low²,³ | This meta‐analysis was back transformed to the EE subscale of the MBI by using the median SD of the EE scale across control groups. |
| Stress > 6 months | The median stress level across all control groups across all follow‐up times was 24.33 points on the Emotional Exhaustion subscale of the Maslach Burnout Inventory¹ | The mean stress at more than 6 months in the intervention groups was 11.34 points lower (4.47 to 14.94 lower) | SMD ‐1.04 (‐1.37 to ‐0.70) | 157 | ⊕⊕⊝⊝ low²,³ | This meta‐analysis was back transformed to the EE subscale of the MBI by using the median SD of the EE scale across control groups. |
| *The basis for the assumed risk (e.g. the median control group risk across studies) is provided in footnotes. The corresponding risk (and its 95% confidence interval) is based on the assumed risk in the comparison group and the relative effect of the intervention (and its 95% CI). | ||||||
| GRADE Working Group grades of evidence | ||||||
| 1 This was the median from the control groups of all studies that measured the effect of CBT vs. no intervention on Emotional Exhaustion with the same scale. | ||||||
| Relaxation compared to no intervention (SMD) for | ||||||
| Patient or population: Healthcare workers | ||||||
| Outcomes | Illustrative comparative risks* (95% CI) | Relative effect | No of Participants | Quality of the evidence | Comments | |
| Assumed risk | Corresponding risk | |||||
| no intervention (SMD) | Relaxation | |||||
| Stress 1 month | The median stress level across all control groups across all follow‐up times was 22.17 points on the Emotional Exhaustion subscale of the Maslach Burnout Inventory¹ | The mean stress at 1 month in the intervention groups was 2.14 points lower (0.36 to 3.96 lower). | SMD ‐0.48 (‐0.89 to ‐0.08) | 97 | ⊕⊕⊝⊝ low | This meta‐analysis was back transformed to the EE subscale of the MBI by using the median SD of the EE scale across control groups. |
| Stress 1 ‐ 6 months | The median stress level across all control groups across all follow‐up times was 22.17 points on the Emotional Exhaustion subscale of the Maslach Burnout Inventory¹ | The mean stress at 1 ‐ 6 months in the intervention groups was 4.84 points lower (2.37 to 6.92 lower). | SMD ‐0.49 (‐0.78 to ‐0.21) | 521 | ⊕⊕⊕⊝ moderate | This meta‐analysis was back transformed to the EE subscale of the MBI by using the median SD of the EE scale across control groups. |
| Stress > 6 months | The median stress level across all control groups across all follow‐up times was 22.17 points on the Emotional Exhaustion subscale of the Maslach Burnout Inventory¹ | The mean stress at > 6 months in the intervention groups was 5.67 points lower (3.39 to 7.95 lower). | SMD ‐1.89 (‐2.65 to ‐1.13) | 40 | ⊕⊕⊝⊝ low | This result was back transformed to the EE subscale of the MBI by using the median SD of the EE scale across control groups. |
| *The basis for the assumed risk (e.g. the median control group risk across studies) is provided in footnotes. The corresponding risk (and its 95% confidence interval) is based on the assumed risk in the comparison group and the relative effect of the intervention (and its 95% CI). | ||||||
| GRADE Working Group grades of evidence | ||||||
| 1 This was the median from the control groups of all studies that measured the effect of relaxation vs. no intervention on Emotional Exhaustion with the same scale. | ||||||
Background
Healthcare workers can suffer from work‐related or occupational stress as a result of organisational factors and an imbalance of demands, skills and social support at work, or any combination of these. Under some conditions this can lead to severe distress, burnout or psychosomatic diseases, and the resulting deterioration in quality of life and service provision (Weinberg 2000).
Description of the condition
'Burnout' has been defined as a persistent, negative, work‐related state of mind in 'normal' individuals that is primarily characterised by exhaustion, which is accompanied by distress, a sense of reduced effectiveness, decreased motivation, and the development of dysfunctional attitudes and behaviours at work. This psychological condition develops gradually but may remain unnoticed for a long time for the individual involved. It results from a misfit between intentions and reality at the job. Often burnout is self‐perpetuating because of inadequate coping strategies that are associated with the syndrome (Schaufeli 2003). Burnout and occupational stress are both considered to result from exposure to stressors at work, the effects of which are mediated by personal coping or the ability to deal with environmental stressors at a personal level (Cooper 2001; Schaufeli 2003). Burnout is considered here as a specific form of psychological stress and not as a clinical diagnosis (Firth‐Cozens 1999). The economic impact of such conditions is high, as can be inferred from data on absenteeism and turnover (Jacobson 1996; Raiger 2005). More than 10% of total claims for occupational diseases are attributed to stress at work (Williamson 1994). There are a variety of stress factors in the workplace of healthcare workers that have been shown to increase the risk of distress and burnout, such as increasing workload, emotional response to contact with suffering and dying patients, and organisational problems and conflicts (Payne 1987; McNeely 2005). In addition, many studies have shown that levels of dissatisfaction, distress and burnout at work are quite high in healthcare workers (Deckard 1994; Karasek 1992; Maslach 1982; Raiger 2005; Ramirez 1996).
Description of the intervention
Work‐related stress and burnout can be addressed with one or more of the following approaches: teaching cognitive‐behavioural techniques, engaging in mental or physical relaxation or by changing the organisation of work.
How the intervention might work
Cognitive‐behavioural techniques work by providing new ways to feel, think and act in stressful situations. Mental and physical relaxation techniques divert attention away from unpleasant stressful thoughts and feelings and build resilience. Organisational interventions can prevent stressful events from occurring or the feeling of stress or burnout from developing by adjusting work practices so that they match and make use of workers' capabilities better.
Why it is important to do this review
An extensive number of reviews have been published on the effectiveness of interventions to prevent or treat stress (DeFrank 1987; Lamontagne 2007; Murphy 1995; Van der Hek 1997; Van der Klink 2001). However, apart from Jones 2000b and Mimura 2003, there are no other reviews that focus specifically on interventions directed at stress prevention in healthcare workers. According to the Fifth European Working Conditions Survey (Eurofound 2012), the healthcare sector rates the highest on two important potential causes of work stress: hiding one's own emotions and adverse social behaviour, with 'mental health at risk' at an intermediate level compared with other sectors. In the UK, the healthcare sector has the highest estimated prevalence rate of work‐related stress (HSE 2013).
Because the characteristics of interventions designed for healthcare workers may be different from those of other occupations, the aim of this review is to determine the effectiveness of interventions to reduce stress specifically in healthcare workers. This is a fully updated version of the review that we first published in 2006.
Objectives
To evaluate the effectiveness of work‐ and person‐directed interventions compared to no intervention or alternative interventions in preventing stress at work in healthcare workers.
Methods
Criteria for considering studies for this review
Types of studies
For interventions directed at persons or the person/work interface such as relaxation or cognitive‐behavioural interventions, we considered only randomised controlled trials.
For work‐directed interventions such as organisational changes (see Types of interventions) it is usually unfeasible to randomise study participants because the interventions are usually executed at the environmental or group level. This can be overcome by using the cluster‐randomised design where workplaces or departments are randomised to the intervention or control groups. However, as this is a difficult and fairly new design, we also considered additional study designs for inclusion that allow for environmental interventions at the group level: controlled before‐and‐after studies (otherwise known as prospective cohort studies or quasi‐experimental studies) and interrupted time‐series. The interrupted time‐series design is defined by the Cochrane Effective Practice and Organisation of Care Review Group as a series of at least three outcome measurements before and at least three after the implementation of an intervention (EPOC 2013).
Types of participants
We included studies in which the interventions were directed at workers who had not actively sought help for conditions such as burnout, depression or anxiety disorder. This included interventions directed at healthcare workers officially employed in any healthcare setting or at student nurses or physicians otherwise in training to become a professional who were also doing clinical work. This excluded studies in which the participants were simply caregivers and were not employed by a healthcare organisation.
Types of interventions
We included studies with any kind of intervention aimed at preventing or reducing stress arising from work. 'Prevention' is defined as an intervention directed at healthy individuals not diagnosed with a specific disease.
We categorised interventions into three groups:
1. Cognitive‐behavioural interventions that aim to change the way in which participants think, feel and consequently behave in stressful situations.
2. Relaxation interventions that aim to induce a state of mental or bodily calmness, or both, to counteract the agitation caused by stress. This can be achieved by, for example, being a passive recipient of a massage or by actively performing various exercises. Thus focus is directed towards a specific relaxing activity and away from the unpleasant thoughts and feelings associated with stress.
3. Organisational interventions that are measures to change resources, the working environment, work tasks or working methods. The intention here is to prevent or decrease stress by ensuring that workers are better equipped to deal with the tasks associated with their jobs.
Some authors also distinguish multimodal interventions that consist of cognitive‐behavioural interventions combined with, for example, relaxation. We considered it more informative to describe such studies as combining cognitive‐behavioural interventions with relaxation.
For all kinds of interventions we included studies with both non‐intervention controls and with one or more alternative interventions as a control group.
In the previous version of this review (Marine 2006) we categorised interventions as person‐ and work‐directed. We think the new categorisation is more informative.
Types of outcome measures
Primary outcomes
As the primary outcome we considered all validated self‐report questionnaires measuring occupational stress or burnout. These included measures such as: Maslach Burnout Inventory (MBI) (Maslach 1982), the Nursing Stress Scale (Gray‐Toft 1981) and Karasek's Job Content Questionnaire (Karasek 1998).
Secondary outcomes
As secondary outcomes we considered all outcome measures of the detrimental effects of stress or burnout. These included measures such as:
(a) Psychological symptoms: anxiety and depression, such as the State‐Trait Anxiety Inventory (Spielberger 1970), General Health Questionnaire (Goldberg 1991), Beck Depression Inventory (Beck 1961);
(b) Physical symptoms and physiological parameters: for example, hormone levels such as prolactin, corticosteroids or others;
(c) Measures on the cost effectiveness of interventions, such as incremental cost‐effectiveness ratios (ICERs), incremental cost‐per‐QALY (quality‐adjusted life year) and cost‐benefit ratios.
We considered the effects on the following time‐scales:
(i) Up to one month
(ii) From one month to six months
(iii) Over six months
We deemed all other outcomes that do not measure stress or its effects on individuals beyond the scope of this review and thus we excluded them from analyses. Examples of excluded outcomes are: coping skills, knowledge or attitude change, work performance, patient satisfaction and claims from clients, employee absenteeism and turnover.
Search methods for identification of studies
Electronic searches
The original systematic searches:
(a) MEDLINE/PubMed (1966 ‐ May 2005)
(b) PsycINFO/Ovid (1967 ‐ May 2005)
(c) Cochrane Depression, Anxiety and Neurosis Group (CCDAN) Specialised registry (last search: February 2002)
(d) Cochrane Occupational Health Field (COHF) Specialised registry (last search: May 2005)
The updated systematic searches:
(a) Cochrane Central Register of Controlled Trials (CENTRAL) (The Cochrane Library, 2013, Issue 11 (November))
(b) MEDLINE/PubMed (1966 ‐ November 2013)
(c) EMBASE.COM (1986 ‐ November 2013)
(d) PsycINFO/ProQuest (1967 ‐ November 2013)
(e) CINAHL/EBSCO (1981 ‐ November 2013)
(f) NIOSHTIC‐2 (1900 ‐ December 2013)
(g) Web of Science (1988 ‐ November 2013)
Searching other resources
Reference lists
We carefully examined the reference lists from articles and reviews for any additional eligible studies.
Handsearching
We handsearched all issues of Work & Stress between January 1987 and November 2013.
Data collection and analysis
Selection of studies
Two review authors (JR, JV) independently selected the studies to include in the review according to the inclusion criteria. If there was any disagreement concerning the inclusion of a study, we discussed this jointly, and where necessary a third review author (AM or CS) resolved the disagreement.
Data extraction and management
We conducted the extraction of data by using a made‐to‐measure data extraction form filled in independently by two review authors (JR and JV or AM and CS) for each study.
(a) If studies used a cross‐over design we used the results from just after the implementation of the intervention in the intervention group, compared to the results in the concurrent waiting‐list control group.
(b) If studies compared more than one active intervention we chose the most intensive intervention to enter into the meta‐analysis.
Assessment of risk of bias in included studies
We used the following items to assess risk of bias in the included studies: adequate sequence generation, allocation concealment, incomplete outcome data addressed and selective outcome reporting. We did not use items on blinding because none of the studies could blind participants or intervention providers, and all primary outcomes were from self‐reported questionnaires.
Measures of treatment effect
We plotted the results of each trial as means and standard deviations (SDs) for continuous outcomes. Because in many cases different instruments were used to measure stress, we transformed the means into standardised mean differences (SMDs) or effect sizes. Because these outcomes are difficult to interpret for clinical use, we also reported the means and standard deviations for the most‐used stress‐measurement instrument and the MBI.
In many cases multiple similar outcome measures were used or an instrument had several sub‐scales but no summary measure. In case of multiple similar outcomes, we chose the outcome which we deemed to best represent a measure of stress in healthcare workers, such as the Nursing Stress Scale (Gray‐Toft 1981) instead of, for example, the Perceived Stress Scale (Cohen 1983). When study authors used subscales such as with the MBI (Maslach 1996), we chose the subscale that in our view best represented stress, such as the emotional exhaustion scale of the MBI (Maslach 1996) or the effort subscale of the Effort Reward Imbalance Questionnaire (Siegrist 2004).
Unit of analysis issues
For studies that employed a cluster‐randomised design and that reported sufficient data to be included in the meta‐analysis and that did not make an allowance for the design effect, we calculated the design effect based on a fairly large assumed intra‐cluster correlation of 0.10. Even though we did not find information for the intra‐cluster correlation for these types of studies we assumed that 0.10 would be a realistic estimate. We based this assumption by analogy on studies about implementation research (Campbell 2001). We followed the methods stated in the Cochrane Handbook for Systematic Reviews of Interventions (Cochrane Handbook, Higgins 2011) for the calculations: design effect = 1+(M‐1)*ICC, where M is the average cluster size and ICC is the intra‐cluster correlation coefficient.
For studies with multiple study‐arms, we decided which was the least extensive intervention and compared all other arms to that intervention only, to prevent increasing the number of comparisons. When more than one arm of an intervention was included in the same comparison, we divided the number of control participants in two and used half of the control participants for each intervention arm to prevent double‐counting.
For studies with a cross‐over design we judged if a sufficient wash‐out period was used in the study design. We expected that the effects of most stress‐management interventions would extend over longer periods of time, and for these types of studies we only used data from before the washout period. For studies where a more immediate effect would be expected, such as in studies that evaluated working schedules, we accepted that with a reasonable washout period the results of the second period could also be used.
Dealing with missing data
Where necessary, we sought missing statistical data (means and standard deviations) from authors. We received unpublished statistical data from the authors of the following studies: Cohen‐Katz 2005; Ketelaar 2013; Gärtner 2013; Jones 2000a; McElligott 2003; Moody 2013; Oman 2006. The first author of Bittman 2003 did not wish to share their data and the first author of Ewers 2002 did not have the data anymore. The authors of Razavi 1993 referred us to the results of Delvaux 2004 instead. The author of Rowe 2006 reported that after baseline they had only measured MBI, which explains the apparent selective reporting.
When standard deviations (SDs) were not reported we calculated them from other reported values according to the methods stated in the Cochrane Handbook (Higgins 2011). For West 1984 we took the means and SDs that resulted from the post hoc comparisons in the repeated measures analyses. For Norvell 1987, we took the post‐treatment values and calculated SDs based on the P value. We calculated a t‐value from this P value even though the authors used a Mann‐Whitney U test. For Shapiro 2005, we took the post‐treatment values and the F‐value reported by the authors. We calculated a t‐value and subsequent SDs by taking the square root of the F‐value as the t‐value. For Tsai 1993, we took the post‐treatment values from the figure reporting the results of the repeated measures analysis. We took the reported P value belonging to the repeated measures analysis as if it had resulted from a t‐test and calculated the SDs based on this t‐value. For Ewers 2002, we took the post‐treatment scores and the P values belonging to the independent t‐tests to calculate a t‐value and subsequently SDs. For Martins 2011, we imputed the average of the SDs from the other studies in the same comparison.
Assessment of heterogeneity
We assessed first if studies were clinically homogeneous, i.e. sufficiently similar regarding their participants, interventions, control condition, outcome and follow‐up time to be combined in one comparison. Then we assessed statistical heterogeneity with the I² statistic. We deemed an I² value of more than 50% to indicate considerable heterogeneity.
Assessment of reporting biases
We avoided reporting bias by including studies and not articles. If multiple articles reported reported results from a single study, we consolidated all the data from all articles under one study ID only. We avoided language bias by including studies in any language. The Cochrane Handbook (Higgins 2011) recommends assessing publication bias with funnel plots when there are at least ten studies in a comparison. However, as this recommended cut‐off is arbitrary, we assessed publication bias with funnel plots in comparisons containing five or more studies.
Data synthesis
We combined studies that we deemed sufficiently similar regarding participants, intervention, control, outcome and follow‐up time in one comparison.
We pooled the results statistically when the outcomes were similar concepts, such as perceived stress. Because many different instruments were used, we used standardised mean differences (SMDs) to combine the stress‐related outcomes in the meta‐analysis.Not all instruments used one summary score but presented the results of various subscales. In cases where there was no summary measure, we chose the subscale that best represented a measure of stress. For example, for this analysis, we used only the emotional exhaustion subscale of the Maslach Burnout Inventory. In this way, we considered the various stress scales to measure the same concept.
To better enable the interpretation of these results we recalculated the pooled SMD back into a mean difference for the emotional exhaustion subscale of the MBI by dividing the SMD by an estimation of standard deviation. For this estimation we used the median value of the SDs of the control group in the studies that evaluated this intervention and used the MBI.
If there was little or no statistical heterogeneity in a comparison, we pooled the results using a fixed‐effect model. If the I² statistic was more than 50% we combined the study results using a random‐effects model.
Subgroup analysis and investigation of heterogeneity
Since various occupational groups of healthcare workers have different work content, their stress levels could be different and also the effect of interventions. We therefore evaluated the effect in nurses, physicians, and other health professionals like physiotherapists in subgroups if available in the same comparison.
When substantial heterogeneity was present in a comparison as indicated by I² greater than 50%, we tried to find an explanation. In our opinion, the most likely explanation is that there are data input errors.
Sensitivity analysis
To assess the effect of risk of bias on the pooled results, we performed a sensitivity analysis in which we excluded studies with a high risk of bias and assessed whether this changed the results appreciably.
Results
Description of studies
Results of the search
From the initial set of references found with the original systematic searches conducted in 2005, we identified a set of 51 potentially eligible studies (Figure 1). We scrutinised these further, and excluded 31 studies, leaving a total of 20 studies. However, we noticed that two studies actually reported separate sets of results of a single study so we included them as one study and henceforth refer to it as Lökk 2000. Thus, the original sample consisted of 19 studies. The first updated systematic searches conducted in 2008 yielded a set of 8623 references, after excluding duplicates, of which 5334 covered the period of the original search. Screening these references for eligibility resulted in 17 of the 19 studies already included in the original sample and an additional 30 potentially eligible studies for the period covered by the original search. This showed that the original search had not been sensitive enough. The first updated search in 2008 yielded another 34 potential studies that had been published since 2005. Other sources resulted in another six potential studies. We scrutinised the full‐text articles of these 70 new potentially eligible studies with regard to our inclusion and exclusion criteria. Altogether we excluded 56 studies, leaving a total of 14 new studies. However, one of these new studies (Rowe 2006) actually reported new follow‐up data for an earlier study (Rowe 1999). Because the more recent article reported the results of all measurements starting from baseline, we used these data and thus included the study only once. The systematic searches have since been updated three times, in November 2010, May 2012 and November 2013. These yielded altogether 9646 references, excluding duplicates. We assessed 100 full text articles for eligibility and excluded 76. This left 24 new studies. Put together, via four rounds of systematic searches conducted in 2008, 2010, 2012 and 2013, we have identified altogether 58 studies that fulfilled our inclusion criteria and 212 that did not and that we summarily excluded. In addition, we located three ongoing studies (Gomez‐Gascon 2013; Niks 2013; Spoor 2010) for which we could not find published outcome data.

Study flow diagram.
We sought additional information regarding study details and statistical data or both from 18 authors and we received it from 12. Eight of the authors provided data that had not been published in their articles which enabled us to enter two of these studies into the meta‐analyses.
Included studies
Study designs
Of the 58 included studies, 42 were randomised controlled trials, eight were cluster‐randomised trials, four were cross‐over studies and four were controlled before‐and‐after studies of a work‐directed intervention.
Six of the eight included cluster‐randomised trials had a unit of analysis error. In other words, these studies ignored the clustering of the data in their analysis. Hence we had to adjust the data accordingly. See Unit of analysis issues for the formula we used to calculate the design effect based on average cluster size (M) and an intra‐cluster correlation coefficient. We calculated the design effect as 2.01 for the Jensen 2006 study (19 clusters, M = 11.05); 2.2 for the Lökk 2000 study (2 clusters, M = 13); 2.73 for the Schrijnemaekers 2003 study (16 clusters, M = 18.3); 1.72 for the Proctor 1998 study (12 clusters, M = 8.2), 2.7 for Uchiyama 2013 (24 clusters, M = 18.08) and 1.42 for Ketelaar 2013 (58 clusters, M = 5.17). We used the design effect to reduce the number of participants in both intervention and control groups if we were able to use quantitative outcome data in meta‐analyses.
For the four cross‐over studies we wanted to use data from the first period only for Bittman 2003 and Lai 2011, but the studies did not provide these and thus could not contribute to the analysis. Von Baeyer 1983 reported the results of the first period separately and we included these. Lucas 2012 studied the immediate effect of different working schedules and used a washout period of four weeks between the intervention and the control period, which seemed reasonable. For this study we included the post‐intervention results of all participants.
We were aiming also to include studies with interrupted time‐series designs but the final sample contained none of these.
Country and time period
Twelve of the included studies had been conducted before the year 2000, 22 between the years 2000 and 2010, and 24 in 2010 or later. Nineteen studies had been carried out in Europe, another 24 in North America, eight in Asia, three in the Middle East, two in South America and two in Australia.
Type of settings and participants
Altogether 39 of the included studies had been conducted in hospitals, eight in residential care homes for the elderly or the disabled, seven in mixed healthcare settings, three in a secure unit and one in a nursing school. Thirty‐five studies included exclusively nurses (including all institutions), 15 included all healthcare staff, but usually the majority of the staff were nurses and only a small fraction (about 5%) were physicians, six studies exclusively included physicians and two included either physiotherapists or respiratory therapists.
Sample sizes
The total number of participants was 7188, with 3592 in various intervention groups and 3596 in control groups. The number of participants was less than 20 in five studies, more than 20 but less than 60 in 27 studies, more than 60 but less than 300 in 20 studies, and more than 300 in six studies.
Interventions
Thirteen study‐arms (Delvaux 2004; Gardner CBT 2005; Gardner Coping 2005; Ketelaar 2013; Gärtner 2013; Günüsen 2010; Jensen 2006; Kwok 2012; Lee 1994; Lökk 2000; Martins 2011; Rowe 2006; Yamagishi 2008) examined cognitive‐behavioural interventions.
Six studies (Jones 2000a; Norvell 1987; Reynolds 1993; Sood 2011; Von Baeyer 1983; West 1984) assessed a combination of cognitive‐behavioural elements and relaxation.
Twenty‐two study‐arms examined relaxation interventions. We categorised relaxation interventions as: physical: Bittman 2003; Brennan 2006; Griffith 2008; Hansen 2006; Kurebayashi 2012; Lai 2011; Lemaire 2011; McElligott 2003; Palumbo 2012; Saganha 2012; Tsai 1993; Yazdani 2010; Yung 2004; and mental relaxation: Cohen‐Katz 2005; Klatt 2012; Mackenzie 2006; Moody 2013; Oman 2006; Shapiro 2005; Stanton 1988.
Twenty‐one study‐arms examined the effectiveness of organisational interventions. Of these, six tried to improve working conditions with or without the participation of workers (Bourbonnais 2011; Le Blanc 2007; Melchior 1996; Proctor 1998; Romig 2012; Uchiyama 2013). Another seven organised some kind of support, for example peer support groups, to discuss problems at work that increase stress (Carson 1999; Günüsen 2010; Heaney 1995; Leiter 2011; Li 2011; Peterson 2008; Salles 2013). Four studies evaluated the introduction of special care models such as emotion‐oriented care training (Finnema 2005; Razavi 1993; Redhead 2011; Schrijnemaekers 2003). Two studies evaluated the effect of different work schedules on stress (Ali 2011; Lucas 2012), one assessed the effect of improving nurses' knowledge about serious mental illness on stress (Ewers 2002) and another evaluated the effect of communication skills training on stress (Ghazavi 2010).
Type of control group (no intervention versus other active or 'passive' interventions)
Almost all (45) of the included studies used a no‐intervention or waiting‐list control group.
Eleven studies compared an active intervention to a 'passive' intervention aiming to control for the Hawthorne effect, etc. (Brennan 2006; Carson 1999; Finnema 2005; Jensen 2006; Lai 2011; Lee 1994; Lökk 2000; Moyle 2013; McElligott 2003; Salles 2013; Tsai 1993).
Two studies (Ali 2011; Lucas 2012) compared only active interventions, that is, different work schedules with one another.
Multiple Intervention Arms
Seven studies (Gardner CBT 2005; Gärtner 2013; Günüsen 2010; Kurebayashi 2012; Rowe 2006; West 1984; Yung 2004) compared one or more active stress management interventions. Gardner CBT 2005 included an arm with CBT content and an arm aimed at improving coping with stress with relaxation and other individual self‐management interventions (time management, assertion, problem‐solving, etc.). We used both arms in different subgroups. Ketelaar 2013 and Gärtner 2013 evaluated two interventions with a similar content but with different modes of providing the intervention. We therefore combined those in the same comparison and again halved the numbers in the control group. Günüsen 2010 provided a coping and work support intervention and these were entered in separate comparisons. With Kurebayashi 2012, we entered both interventions in the same comparison of physical relaxation. West 1984 had five study arms but finally reported data only on one study arm versus a no‐intervention or no‐effect condition. We used this as an intervention versus no‐intervention comparison.
Outcomes
Altogether 21 studies used the Maslach Burnout Inventory (MBI) or one of its subscales as their main outcome measure. However, the MBI was only reported as a sum score in Shapiro 2005, and we used the Perceived Stress Scale (PSS) for that study instead of the MBI. Six studies used the Perceived Stress Scale (Brennan 2006; Griffith 2008; Lee 1994; Li 2011; Palumbo 2012; Sood 2011). Four studies used their own definition of burnout (Ali 2011; Bourbonnais 2011; Romig 2012; Salles 2013). Two studies used the Nurse Stress Scale (Delvaux 2004; Razavi 1993). Two studies used the General Health Questionnaire (GHQ) (Reynolds 1993; Yung 2004) and another two used the Profile of Moods States (POMS) (Bittman 2003; Moyle 2013). Two studies used their own developed stress scale (Ghazavi 2010; Lemaire 2011). The other outcome measures were each used by one study only: 4‐dimension complaint checklist (Ketelaar 2013), Brief Job Stress Questionaire (Yamagishi 2008), Depression Anxiety Stress Scale (Yazdani 2010), Derogatis Stress Profile (Jones 2000a), Effort Reward Imbalance Questionnaire (Uchiyama 2013), Job Stress Questionnaire (Hansen 2006), The Mental Health Professional Stress Scale (Gardner CBT 2005), Nurse Stress Checklist (see Benoliel 1990) (Tsai 1993), Occupational Stress Indicator (see Cooper 1988) (Proctor 1998), Organisation and Stress Scale (Finnema 2005), The General Nordic Questionnaire for Psychological and Social Factors at Work (QPS Nordic) (Peterson 2008), Symptom Checklist‐90 (see Derogatis 1976; Derogatis 1983) (Heaney 1995), Somatic Stress (Kwok 2012), Stress Profile (Stanton 1988), Stress Symptom Checklist (Kurebayashi 2012), Structured Stress Questionnaire (Lökk 2000), and Stress Visual Analogue Scale (Lai 2011). Two studies measured only anxiety (McElligott 2003; Von Baeyer 1983).
Altogether 22 studies used more than one of the stress measures listed above.
None of the studies measured the cost effectiveness of interventions.
Follow‐up
(i)Short‐Term:
There were 24 studies in which the last outcome measurement was either at the end of the intervention (Ewers 2002; Finnema 2005; Ghazavi 2010; Griffith 2008; Hansen 2006; Kurebayashi 2012; Lai 2011; Lemaire 2011; Li 2011; Lucas 2012; Mackenzie 2006; Martins 2011; McElligott 2003; Moyle 2013; Norvell 1987; Palumbo 2012; Proctor 1998; Saganha 2012; Shapiro 2005; Sood 2011; Von Baeyer 1983; Yamagishi 2008) or at less than a month after intervention (Brennan 2006; Tsai 1993).
(ii) Medium‐Term :
In another 22 studies the last follow‐up measurement was between one and six months after intervention (Bittman 2003; Carson 1999; Cohen‐Katz 2005; Delvaux 2004; Gardner CBT 2005; Günüsen 2010; Heaney 1995; Klatt 2012; Kwok 2012; Le Blanc 2007; Lee 1994; Leiter 2011; Lökk 2000; Moody 2013; Oman 2006; Razavi 1993; Reynolds 1993; Romig 2012; Salles 2013; West 1984; Yazdani 2010; Yung 2004).
(iii) Long Term :
There were also 12 studies in which the last follow‐up measurement was at six months after intervention or later (Ali 2011; Bourbonnais 2011; Jensen 2006; Jones 2000a; Ketelaar 2013; Melchior 1996; Peterson 2008; Redhead 2011; Rowe 2006; Schrijnemaekers 2003; Stanton 1988; Uchiyama 2013).
Excluded studies
Excluded studies
The main reasons for excluding studies from this review were the following, as illustrated by selected examples of each category (see Characteristics of excluded studies):
-
No control group: Andersen 2010; Cohen 2005; Elo 2000; Michie 1992; Petterson 2006; Schaufeli 1995; Yamagishi 2007.
-
Non‐randomised study design and intervention directed at persons or the person/work interface: Bourbonnais 2006a; Holt 2006; Michie 1994; Petterson 1998; Young 2001; Zimber 2001.
-
No intervention aimed at preventing or treating stress or burnout: Bourbonnais 2006b; Brinkborg 2011; Cámara Conde 2009; Ridge 2011; Wetzel 2011.
-
The intervention is primarily aimed at people with dementia at a care home and not the staff caring for them, although the effects were measured also for the latter: Baldelli 2004.
-
No primary outcome measure of stress or burnout: Bay 2010; Lai 2012; Pipe 2009; Saadat 2012; Sharif 2013; Villani 2012.
-
Participants were not healthcare workers or nursing students with clinical duties: Drain 1991.
-
Participants were nursing students but did not have clinical duties: Johansson 1991; Russler 1991; Sharif 2004.
-
Participants were victims of assault and deemed not healthy as per inclusion criteria: Nhiwatiwa 2003.
-
Participants had been diagnosed with burnout syndrome: Diaz‐Rodriguez 2011a; Diaz‐Rodriguez 2011b.
Risk of bias in included studies
In general, most studies were of low methodological quality, with at least several items that we judged to put them at a high risk of bias (Figure 2). We judged only one study (Günüsen 2010) to be at low risk of bias in randomisation, allocation concealment, incomplete data, selective reporting or other risks of bias. Blinding was consistently problematic in all studies because self report was used to assess stress levels as the outcome and the providers could not be blinded to the intervention. We therefore did not use this item to make a distinction between studies at high or low risk of bias.

Risk of bias summary: review authors' judgements about each risk of bias item for each included study.
Allocation
Only 12 out of the 58 studies clearly described the method for generating random numbers, with the newer studies being better in this regard than the older studies. It is still surprising to note that most studies just describe the whole process as "We randomised participants". The large number of studies that did not report details prevented us from asking all authors to provide better information. Details of allocation concealment were lacking even more often, with only six studies giving an adequate description. Even though many other risks of bias are difficult to avoid in stress management studies, these items can clearly be improved for any study. The fact that a minority of studies reported sufficient detail and content to justify an assessment of low risk of bias means that it is feasible for all.
Blinding
We considered the reporting of stress by questionnaires as an outcome assessment that could be biased by knowledge of the intervention. We judged that it could be possible that a participant in the intervention group, knowing that they have gone through a six‐week course of stress management, would rate their stress symptoms more favourably than a person in the control group. This would create an overestimation of the effect of the intervention. Very few authors mentioned that blinding could be an issue, but said also that they thought that blinding is impossible here. We agree that this is not possible but that does not eliminate the risk of bias and we therefore rated all studies with self reports as being at high risk of bias.
Incomplete outcome data
The loss of participants was mostly low. However, 12 studies (Brennan 2006; Carson 1999; Finnema 2005; Ketelaar 2013; Gärtner 2013; Griffith 2008; Jensen 2006; McElligott 2003; Melchior 1996; Palumbo 2012; Peterson 2008; Tsai 1993) suffered a loss exceeding 20% of the initial sample. These were labelled as being at high risk of bias. Also one study (Bittman 2003) reported the reasons for participants not completing the study but not separately for the two groups. As the reasons listed were not entirely random (e.g. poor attendance and refusal to participate) we judged this study to be at high risk of attrition bias. In six studies (Jones 2000a; Lee 1994; Razavi 1993; Reynolds 1993; Rowe 2006; Shapiro 2005) results were analysed only for participants who provided complete data sets. We labelled these studies as being at high risk of bias. In two studies (Mackenzie 2006; Stanton 1988) it was unclear whether any participants dropped out and the studies were therefore labelled as being at unclear risk of bias.
Selective reporting
In the absence of a protocol, it is difficult to judge if outcomes are reported as planned. If the authors mentioned a protocol, we checked the protocol. If there was no mention of a protocol we judged if the methods and results sections reported the same outcomes. In most (41) of the studies all outcomes were reported as planned and consequently we judged them as being at low risk of bias. In one study (Carson 1999) two of the outcomes (Minnesota Job Satisfaction scale and the Cooper Coping Skills scale) were administered but their results were not reported. We judged this to be a sign of a high risk of bias. In two studies (Gardner CBT 2005; Jensen 2006) only significant differences were reported, which we also took to be a sign of a high risk of bias. In Finnema 2005 the results for nursing assistants consisted of covariance analyses that were not prespecified and because of this we judged the study to be at high risk of bias. In Rowe 2006 authors report only the results of the Maslach Burnout Inventory (MBI) at each follow‐up point, but when we made contact the author explained that this was the plan all along. We therefore assessed the study as being at low risk of bias.
Other potential sources of bias
There were several risks of bias that came up in addition to the risks mentioned above, such as an unclear washout period in a cross‐over trial (Lai 2011), very low compliance with the intervention (Ketelaar 2013) or a loosely validated outcome measure (Ghazavi 2010). If we found nothing else then we left the other potential source of bias as unclear in the 'Risk of bias' tool.
Effects of interventions
See: Summary of findings for the main comparison Cognitive‐behavioural intervention compared to no Intervention for reducing stress; Summary of findings 2 Relaxation compared to no intervention (SMD) for reducing stress
Cognitive‐behavioural interventions
1. Cognitive‐behavioural intervention vs. no intervention
1.1. Any stress‐related outcome (Follow‐up to one month)
1.1.1 Cognitive‐behavioural intervention only vs. no intervention
We could combine the results of four studies (Gardner CBT 2005; Martins 2011; Rowe 2006; Yamagishi 2008) (Analysis 1.1; 248 participants ). There was a standardised mean difference (SMD) of ‐0.25 (95% confidence interval (CI) ‐0.60 to 0.11) showing no difference in stress between the cognitive‐behavioural training (CBT) intervention and no intervention at up to one month follow‐up. The meta‐analysis of this subgroup did not have considerable heterogeneity (I² = 43%).
1.1.2 Cognitive‐behavioural intervention and relaxation vs. no intervention
According to three studies (Gardner Coping 2005; Norvell 1987; Sood 2011) stress levels were similar for the combined cognitive‐behavioural plus relaxation intervention when compared with no intervention at up to one month follow‐up (SMD ‐0.45; 95% CI ‐1.61 to 0.70; Analysis 1.1; 84 participants).
When the above seven studies are combined, stress levels are similar following cognitive‐behavioural intervention with or without relaxation and no intervention (SMD ‐0.27; 95% CI ‐0.66 to 0.13) at up to one month follow‐up (Analysis 1.1). Because of the sizeable heterogeneity (I² = 81%) caused by Gardner Coping 2005, we employed the random effects model in this meta‐analysis.
The funnel plot revealed a lack of studies in the right lower quadrant of the funnel where the small negative studies would be expected, indicating that there could be publication bias (Figure 3). The meta‐analysis combining both subgroups also suffered from considerable heterogeneity (I² = 63%) that was entirely due to Gardner Coping 2005.

Funnel plot of comparison: 1 Cognitive‐behavioural intervention vs no Intervention (SMD), outcome: 1.1 Any Stress‐related Outcome (follow‐up up to 1 month).
1.2 Any stress‐related outcome (Follow‐up from one to six months)
1.2.1 Cognitive‐behavioural intervention only vs. no intervention
According to six studies (Delvaux 2004; Ketelaar 2013; Gärtner 2013; Günüsen 2010; Kwok 2012; Rowe 2006), a cognitive‐behavioural intervention decreased stress more than no intervention (SMD ‐0.28; 95% CI ‐0.47 to ‐0.09; 439 participants) at one to six months follow‐up (Analysis 1.2).
1.2.2 Cognitive‐behavioural intervention and relaxation vs. no intervention
Another two studies (Reynolds 1993; West 1984) showed that cognitive‐behavioural intervention combined with relaxation decreased stress more than no intervention (SMD ‐0.78; 95% CI ‐1.38 to ‐0.18; 110 participants) at one to six months follow‐up (Analysis 1.2).
When the above eight studies are combined, cognitive‐behavioural intervention with or without relaxation reduces stress when compared to no intervention (SMD ‐0.38; 95% CI ‐0.59 to ‐0.16) at one to six months follow‐up (Analysis 1.2).
Also here the funnel plot indicated the potential presence of publication bias (Figure 4). There was some heterogeneity (I² = 33%) that could be explained by the greater effect in studies that combined CBT with relaxation.

Funnel plot of comparison: 1 Cognitive‐behavioural intervention vs no Intervention (SMD), outcome: 1.2 Any Stress‐related Outcome (follow‐up 1 ‐ 6 months).
1.3 Any stress‐related outcome (Follow‐up more than six months)
1.3.1 Cognitive‐behavioural intervention with or without relaxation vs. no intervention
One study (Rowe 2006) showed that a cognitive‐behavioural intervention decreased stress more than no intervention (SMD ‐1.18; 95% CI ‐1.64 to ‐0.71; 84 participants) at more than six months follow‐up (Analysis 1.3). The intervention consisted of refresher courses at regular intervals and the effect was measured at two‐year follow‐up.
The results of another study (Jones 2000a) favoured a cognitive‐behavioural intervention combined with relaxation in reducing stress when compared to no intervention (SMD ‐0.89; 95% CI ‐1.37 to ‐0.41; 73 participants) at more than six months follow‐up (Analysis 1.3).
When the above two studies are combined, cognitive‐behavioural intervention with or without relaxation appears to reduce stress when compared to no intervention (SMD ‐1.04; 95% CI ‐1.37 to ‐0.70) at more than six months follow‐up (Analysis 1.3). Given the lack of heterogeneity in results (I² = 0%), we employed the fixed‐effect model in this meta‐analysis.
1.4 Anxiety (Follow‐up to one month)
Both state and trait anxiety decreased in the CBT plus relaxation intervention studies (Jones 2000a; Von Baeyer 1983; West 1984; 135 participants) more than after no intervention: mean difference (MD) ‐11.07; 95% CI ‐18.39 to ‐3.75 and MD ‐8.36; 95% CI ‐10.02 to ‐6.70 at one month follow‐up (Analysis 1.4).
1.5 Anxiety (Follow‐up one to six months)
Also at six months follow‐up there was a similar difference for both state and trait anxiety between CBT plus relaxation (Jones 2000a; 73 participants) and no intervention in one study: MD ‐8.05; 95% CI ‐12.10 to ‐4.00; and MD ‐6.00; 95% CI ‐10.30 to ‐1.70 at one to six months follow‐up (Analysis 1.5).
1.6 General Health Questionnaire (FU up to one month)
There was no effect in one study of CBT plus relaxation on the General Health Questionnaire score compared to no intervention (Gardner CBT 2005) (MD 0.29; 95% CI ‐1.96 to 2.54; 27 participants) (Analysis 1.6).
2. Cognitive‐behavioural intervention vs. non‐stress‐management intervention
2.1 Any stress scale (Follow‐up from one to six months)
Two studies (Lee 1994; Lökk 2000) measured the effects of a cognitive‐behavioural intervention on decreasing stress when compared to an alternative intervention (computer training or passive attendance of psychologist at staff meetings) by using different stress measures with one to six months follow‐up. The stress levels after the intervention and the control condition were similar (SMD ‐0.54 95% CI ‐1.16 to 0.08; 83 participants) (Analysis 2.1). Given the differences in interventions and outcome measures, we employed the random effects model in this meta‐analysis.
2.2 Any stress scale (Follow‐up more than six months)
One study (Jensen 2006) did not find a considerable effect of a cognitive‐behavioural intervention compared to an alternative intervention (lessons of the participant's own choice on e.g. skin care, proper treatment of a person with diabetes, work and asthma, and safety procedures in chemicals handling) on decreasing stress at more than six months follow‐up (SMD 0.03; 95% CI ‐0.53 to ‐0.59; 49 participants) (Analysis 2.2).
2.3 Anxiety (Follow‐up one to six months)
One study measured anxiety but did not find a considerable effect on anxiety of CBT compared to an alternative intervention (MD ‐0.12; 95% CI ‐1.94 to 1.70; 26 participants) (Analysis 2.3).
Relaxation interventions
3. Relaxation vs. no intervention
3.1 Any stress outcome (Follow‐up to one month)
3.1.1 Physical relaxation vs. no intervention
Four studies (Hansen 2006; Lemaire 2011; Palumbo 2012; Saganha 2012) compared physical relaxation with no intervention at decreasing stress at up to a month follow‐up. The pooled SMD (‐0.48; 95% CI ‐0.89 to ‐0.08; 97 participants) favoured physical relaxation and there was no heterogeneity (Analysis 3.1).
3.2 Any stress outcome (Follow‐up from one to six months)
3.2.1 Mental relaxation vs. no intervention
Six studies (Cohen‐Katz 2005; Mackenzie 2006; Moody 2013; Oman 2006; Shapiro 2005; Stanton 1988) found that mental relaxation was not more effective than no intervention at decreasing stress (SMD ‐0.50; 95% CI ‐1.15 to 0.15; 205 participants) at one to six months follow‐up (Analysis 3.2).
3.2.2 Physical relaxation vs. no intervention
Six studies (7 comparisons) (Bittman 2003; Griffith 2008; Hansen 2006; Kurebayashi 2012 (two arms); Palumbo 2012; Yazdani 2010) found that physical relaxation was more effective than no intervention at decreasing stress (SMD ‐0.47; 95% CI ‐0.70 to ‐0.24; 316 participants) at one to six months follow‐up (Analysis 3.2)
Pooling the results of both mental and physical relaxation gives a SMD of ‐0.49 (95% CI ‐0.78 to ‐0.21) but with substantial heterogeneity (I² = 57%), which is mostly due to the oldest study (Stanton 1988). If we remove this outlier study from the meta‐analysis, the magnitude of effect reduces to SMD ‐0.38 ; 95% CI ‐0.59 to ‐0.17) whilst bringing I² value down to 18%. The funnel plot does not indicate publication bias (Figure 5)

Funnel plot of comparison: 3 Relaxation vs. no intervention (SMD), outcome: 3.2 Any stress outcome (follow‐up 1 ‐ 6 months).
3.3 Any stress outcome (Follow‐up more than 6 months)
3.3.1 Mental relaxation vs. no intervention
According to one study (Stanton 1988) mental relaxation was more effective than no intervention at decreasing stress (SMD ‐1.89; 95% CI ‐2.65 to ‐1.13; 40 participants) at more than six months follow‐up (Analysis 3.3).
3.4 Any anxiety outcome (Follow‐up time from 1 to 6 months)
3.4.1 Mental relaxation vs. no intervention
One study (Yung 2004; 65 participants) found a difference in State Anxiety between participants in the control group and participants that received a cognitive relaxation intervention (Analysis 3.4), but not on Trait Anxiety (Analysis 3.5)
3.4.2 Physical relaxation vs. no intervention
The same study (Yung 2004) also found a difference in State Anxiety between participants in the control group and participants that received a stretch‐release relaxation intervention (Analysis 3.4), but again not on Trait Anxiety (Analysis 3.5).
However, when we combined the data from the two interventions (making sure we included control group data only once), we found that relaxation decreased State Anxiety when compared to no intervention (SMD ‐7.79; 95% CI ‐11.24 to ‐4.34) at one to six months follow‐up (Analysis 3.4) but not Trait Anxiety (SMD ‐1.09; 95% CI ‐4.53 to 2.36) (Analysis 3.5).
4. Relaxation vs. other intervention
4.1 Any stress outcome
4.1.1 Mental relaxation vs. in‐service education (Follow‐up from one to six months)
One study (Tsai 1993) showed that mental relaxation reduced stress more effectively than attending a course on theory analysis (SMD ‐0.61; 95% CI ‐0.97 to ‐0.24; 122 participants) when measured at five weeks after the intervention (Analysis 4.1).
4.1.2 Mental relaxation versus relaxing in a chair (Follow‐up to one month)
Lai 2011 found listening to music more effective in reducing stress levels than just relaxing in a chair (SMD ‐1.14; 95% CI ‐1.55 to ‐0.73; 108 participants) (Analysis 4.1)
4.1.3 Physical relaxation vs. a break (Follow‐up to one month)
Another study (Brennan 2006; 82 participants ) found similar stress levels in participants that were given a 10‐minute massage and in those that took a self‐directed 10‐minute break when measured directly following the intervention. Moyle 2013 compared foot‐massage to silent resting under similar conditions and found resting to be more effective but there were only 19 participants (Analysis 4.1)
4.2 Any anxiety outcome
4.2.1 Physical relaxation vs. standard touch therapy
One study (McElligott 2003) did not find a significant difference in anxiety between participants who had received AMMA therapeutic massage and those who had received the control procedure where the practitioners only held their hands on certain areas of the participants' bodies (SMD ‐0.17; 95% CI ‐1.15 to 0.82; 18 participants) (Analysis 4.2).
4.3 General Health Questionnaire
Tsai 1993 did not find a reduction in the score of the General Health Questionnaire (SMD ‐0.28; 95% CI ‐0.63 to 0.08; 122 participants) after mental relaxation compared to training in theory analysis (Analysis 4.3).
Organisational interventions
5. Organisational intervention vs. no intervention
5.1 Any stress‐related outcome (Follow‐up to one month)
5.1.1 Support interventions vs. no intervention
Li 2011 ( 49 participants) organised a peer‐support mentoring scheme among nurses and did not find a substantive difference between the intervention and no‐intervention control group (SMD ‐0.35; 95% CI ‐0.95 to 0.24) (Analysis 5.1). Salles 2013 reported beneficial effects on 'rates of burnout' in an RCT of an intervention aimed at preventing surgery residents from leaving the specialty by providing them with anecdotes on career choices from their seniors. Despite trying to contact the authors, we were not able to get enough information to include this study in the meta‐analysis.
5.1.2 Communication skills versus no intervention
Another study (Ghazavi 2010) compared the training of communication skills with the no‐intervention control group but did not find a difference at short‐term follow‐up (SMD ‐0.07; 95% CI ‐0.65 to 0.52; 45 participants)(Analysis 5.1).
5.1.3 Special care vs. no intervention
Ewers 2002 evaluated a special training programme called 'psychosocial intervention training' aimed at better handling of behaviorally problematic patients, and found a significant improvement in stress levels after the programme (SMD ‐1.23; 95% CI ‐2.21 to ‐0.26; 20 participants) (Analysis 5.1).
5.1.4 Changing working conditions vs. no intervention
Romig 2012 evaluated the use of telemedicine to decrease the work load of intensivists working at the Intensive Care Unit, but did not find a statistically significant change in the questions used to measure burnout. Because of the lack of reported data we could not include the study in a meta‐analysis. Proctor 1998 evaluated a training programme to improve work but did not find an effect on any of the six subscales of the occupational stress indicator. We could not combine these six subscales into one outcome and therefore could not include this study in the meta‐analysis.
5.2 Any stress‐related outcome (Follow‐up one to six months)
5.2.1 Changing working conditions vs. no intervention
Two studies (Le Blanc 2007; Uchiyama 2013) compared an intensive participatory programme of improving psychosocial working conditions with no intervention, but there was no considerable effect on stress levels in the meta‐analysis (SMD ‐0.12; 95% CI ‐0.30 to 0.05; 525 participants) (Analysis 5.2).
5.2.2 Special care vs. no intervention
One study introduced special care (Razavi 1993) based on a 24‐hour training programme but did not find an effect on stress levels compared to no intervention (SMD ‐0.13; 95% CI ‐0.60 to 0.33; 71 participants) (Analysis 5.2).
5.2.3 Support organisation vs. no intervention
Two studies (Günüsen 2010; Leiter 2011) organised peer support to ameliorate psychosocial stressors but did not find a considerable effect on stress levels (SMD 0.07; 95% CI ‐0.09 to 0.23; 952 participants) (Analysis 5.2). One other RCT (Heaney 1995) found that the intervention did not significantly improve psychological well‐being measured as depressive symptoms and somatization compared to the no‐intervention control group. The study could not be included in the meta‐analysis because the authors reported only regression coefficients,
5.3 Any stress‐related outcome (Follow‐up more than six months)
5.3.1. Changing working conditions vs. no intervention: RCT
Melchior 1996 improved quality of care in an RCT but there was no considerable effect on stress levels compared to no intervention (SMD ‐0.23; 95% CI ‐0.55 to 0.09; 161 participants) (Analysis 5.3).
5.3.2 Changing working conditions vs. no intervention: CCT:
Another study (Bourbonnais 2011) compared an intervention programme aimed at reducing psychosocial stressors at work with no intervention in a non‐randomised controlled design and found a lower level of stress at one month follow‐up (SMD ‐0.38; 95% CI ‐0.56 to ‐0.20; 488 participants) (Analysis 5.3).
5.3.3 Special Care vs. no intervention
Redhead 2011 organised special care for managing symptoms in patients but the stress levels in staff were similar in the no‐intervention control group (SMD 0.08; 95% CI ‐0.78 to 0.95; 21 participants) (Analysis 5.3). Another study (Schrijnemaekers 2003) evaluated emotion‐oriented care for professional caregivers in homes for elderly persons. Due to a lack of detail in reporting of the data, we could not include the study in the meta‐analysis. At twelve months follow‐up, they reported a non‐significant difference between intervention and control group of 1.85 score points on the emotional exhaustion subscale of the Maslach Burnout Inventory (range 0 ‐ 48) in favour of the intervention group. For depersonalisation the score difference was 0.55 score points and also non‐significant. For personal accomplishment the score difference was 1.46 in favour of the intervention group and this was statistically significant.
5.3.4 Support vs. no intervention
In one RCT (Peterson 2008), the organisation of peer‐support groups led to a decrease of stress levels compared to no intervention (SMD ‐0.38; 95% CI ‐0.73 to ‐0.03; 131 participants) (Analysis 5.3)) at long‐term follow‐up. However, the same study found an increase in symptoms on the General Health Questionnaire (MD 7.40; 95% CI 0.79 to 14.01) (Analysis 5.4).
6. Organisational intervention vs. other intervention
6.1 Any stress‐related outcome (Follow‐up time up to one month)
6.1.1 Special care vs. usual care
One study (Finnema 2005) found similar levels of nurses' stress following the implementation of integrated emotion‐oriented care vs. care as usual (SMD 0.07; 95% CI ‐0.60 to 0.75; 46 participants) (Analysis 6.1).
6.2 Any stress‐related outcome (Follow‐up from one to six months)
6.2.1 Support intervention vs. feedback only
One study (Carson 1999) compared a course underlining the importance of social support as a key coping strategy when dealing with stress to only giving participants feedback on their baseline stress questionnaire results. They found similar levels of stress following the intervention and feedback only (SMD 0.53; 95% CI ‐0.02 to 1.08; 53 participants) (Analysis 6.2).
6.3 Any stress‐related outcome (Follow‐up time more than six months)
6.3.1 Shorter vs. longer working schedules
Ali 2011 compared a work schedule with weekend breaks to a continuous schedule among intensive care staff, and Lucas 2012 compared a two‐week with a four‐week schedule among resident physicians. We combined the results of the two studies because the interventions had a similar objective and they both measured emotional exhaustion as an outcome, even though it was measured in different ways. The results showed that the shorter schedule reduced stress (SMD ‐0.55; 95% CI ‐0.84 to ‐0.25; 180 participants) (Analysis 6.3).
6.4 General Health Questionnaire
Carson 1999 measured whether support decreased the score on the GHQ more than after feedback only, but results were similar in both groups (MD ‐0.57; 95% CI ‐3.34 to 2.20; 53 participants) (Analysis 6.4). Finnema 2005 also found no difference on the GHQ after introducing special care compared to care as usual (MD ‐4.48; 95% CI ‐10.46 to 1.50; 47 participants) .
GRADE assessment
For all major comparisons we made an assessment of the quality of the evidence. The arguments on which our decisions were based are given in Table 1 for the major comparisons which included more than three studies. For all the other comparisons, with fewer than three studies and fewer than 400 participants we decided to downgrade by two levels, because of risk of bias and imprecision, to low‐quality evidence.
| Comparison | Risk of Bias | Inconsistency | Indirectness | Imprecision | Publication Bias | Level of Evidence |
| CBT vs no intervention 1 mo follow‐up | 5 out of 6 studies high risk of bias: 1 level down | I² = 64%: no downgrading | No | 332 participants No downgrading | Yes in funnel plot: 1 level down | Low Quality |
| CBT vs no intervention 1 ‐ 6 mo follow‐up | 5 out of 8 studies high risk of bias: 1 level down | I² = 54%: no downgrading | No | 549 participants No downgrading | Yes in funnel plot: 1 level down | Low Quality |
| CBT vs no intervention > 6 months follow‐up | 2 studies high risk of bias: 1 level down | I² = 38%: no downgrading | No | 157 participants 1 level down | Not apparent | Low Quality |
| Relaxation vs no intervention 1 mo follow‐up | 3 out 4 studies high risk of bias: 1 level down | I² = 0%: no downgrading | No | 97 participants 1 level down | Not apparent | Low Quality |
| Relaxation vs no intervention 1 ‐ 6 mo follow‐up | 10 out of 13 studies high risk of bias: 1 level down | I² = 57%: no downgrading | No | 521 participants no downgrading | Not apparent | Moderate Quality |
| Relaxation vs no intervention > 6 mo follow‐up | 1 study: no downgrading | N/A | No | 40 participants 2 levels down | Not apparent | Low Quality |
Sensitivity analysis
Influence of study risk of bias
We defined low‐quality studies as those that had one or more domains at high risk of bias or no domain with a low risk of bias (i.e. all domains had an unclear or high risk of bias). We ignored the blinding issues here, because this applied similarly to all studies. This left us with 40 low‐quality studies, 17 moderate‐quality studies and one high‐quality study (Günüsen 2010).
Removing low‐quality studies from the comparison of CBT versus no intervention left only one study at less than one month follow‐up (Norvell 1987); the SMD was ‐1.20 (95% CI ‐2.47 to 0.08), i.e. substantially greater than with low‐quality studies included (SMD ‐0.25; 95% CI ‐0.60 to 0.11). Doing the same with the comparison at one to six months follow‐up left three studies (Delvaux 2004; Günüsen 2010; West 1984) with an SMD of ‐0.62 (95% CI ‐1.04 to ‐0.19), compared with SMD ‐0.28 (95% CI ‐0.47 to ‐0.09) across six studies. At six months' follow‐up there was only one study, so no sensitivity analysis was possible.
Removing low‐quality studies from the comparison relaxation versus no intervention left only one study at one month follow‐up, with an SMD of ‐0.71 (95% CI ‐1.43 to 0.02), compared with SMD ‐0.48 (95% CI ‐0.89 to ‐0.08) across four studies. At one to six months follow‐up, there were three studies left (Hansen 2006; Moody 2013; Stanton 1988) with an SMD of ‐0.79 (95% CI ‐1.23 to ‐0.35), compared to an SMD of ‐0.49 (95% CI ‐1.15 to 0.15) across 12 studies. Heterogeneity, however, remained high, with an I² of 88%, due to the presence of one study with a large effect (Stanton 1988). At six months follow‐up there was again only one study and thus sensitivity analysis was not possible.
For all the other comparisons there were too few studies to meaningfully re‐analyse the findings.
Influence of similarity of stress measurement instruments assumption
We checked the assumption that various stress measurement instruments measure the same stress concept and can be pooled with SMDs. We redid the analyses with only those studies that measured stress with the MBI. For CBT versus no intervention with a follow‐up of one month, there were two studies that could be included which showed significant improvements in emotional exhaustion (Analysis 7.1). However, the results on the other two subscales depersonalisation and lack of personal accomplishment were too heterogeneous to combine (Analysis 7.1). At medium‐term follow‐up there were two studies that could be included and that showed positive results for emotional exhaustion, non‐significant results for depersonalisation and for the lack of personal accomplishment subscale the results were too heterogeneous to combine (Analysis 7.2). The results for CBT including relaxation showed a decrease in emotional exhaustion but not for personal accomplishment. Results for the depersonalisation were not reported in these studies (Analysis 8.1). In the long‐term comparison of CBT versus another intervention, in one study, none of the scales showed significant differences (Analysis 9.1). Relaxation did not show beneficial effects on any of the subscales but an increase in the score on lack of personal accomplishment compared to no intervention at one to six months follow‐up (Analysis 10.1). Organisational interventions compared to no intervention showed favourable effects on the emotional exhaustion and depersonalisation subscales but not on the personal accomplishment subscale at less than a month's follow‐up (Analysis 11.1). At one to six months' follow‐up however, effects were non‐significant on the emotional exhaustion and depersonalisation subscales and the results were too heterogeneous to combine in meta‐analysis (Analysis 11.2). At more than six months' follow‐up, organisational interventions again yielded favourable effects on the emotional exhaustion and depersonalisation subscales but not on lack of personal accomplishment (Analysis 11.3). However, the one study that could not be included in the meta‐analyses (Schrijnemaekers 2003) yielded a significant effect on the personal accomplishment scale but not on the two other scales at the end of 12 months follow‐up. There was only one study that compared an organisation intervention with an alternative intervention and the results did not reach significance on any of the three subscales of the MBI (Analysis 12.1).
All in all, this analysis shows that meta‐analysis results are similar when combining all stress‐related measures or when using the emotional exhaustion or the depersonalisation subscale, but not when using the personal accomplishment subscale. It could be that it is more difficult to change someone's score on the personal accomplishment subscale with an intervention. Another possible explanation is that with healthcare workers this domain is the least affected to begin with.
Subgroup analysis and explanation of heterogeneity
Since working conditions differ considerable between various occupations in health care, we analysed if there were differences in the effects of CBT and relaxation between various occupations. We did so only for comparisons with sufficient studies: CBT vs. no intervention and relaxation vs. no intervention (Analysis 13.1; Analysis 13.2; Analysis 14.1; Analysis 14.2). We ignored the previous subgroups in the CBT and relaxation intervention categories and divided the studies according to the occupation of the participants into nurses, physicians, all staff and other healthcare professionals. There were no differences between these subgroups. Within the subgroups however, there was still considerable statistical heterogeneity. We therefore do not think that the occupation of the participants explains statistical heterogeneity between studies.
Discussion
Summary of main results
We found low‐quality evidence that cognitive‐behavioural training (CBT) interventions with or without relaxation techniques in healthcare workers reduce the levels of burnout symptoms when compared to no intervention at one to six months in eight studies of 549 people (standardised mean difference (SMD) ‐0.38) and more than six months follow‐up in two studies of 157 people (SMD ‐1.04). At less than one month of follow‐up the difference was not significant. This was not influenced by excluding low‐quality studies nor by types of participants.
Translated back to the emotional exhaustion (EE) subscale of the Maslach Burnout Inventory (MBI), and assuming a standard deviation (SD) of 7.1 (the median of all intervention and control groups that used the MBI EE subscale), an SMD of ‐0.38 means a decrease in the intervention group of 2.7 score points on the EE subscale of the MBI. The median of all control groups' score on this scale of the MBI was 21. Thus the intervention decreases the stress levels by 13% (95% confidence interval (CI) 5% to 20%). Since no clinically or minimally important differences are known for the MBI, this can probably be best considered a modest effect. For comparisons of CBT with other active interventions, there were no considerable differences. It was difficult to draw conclusions because controls varied and most were used in single studies only.
With relaxation interventions the reductions in stress levels were comparable with those of CBT. There was low‐ to moderate‐quality evidence that stress levels remained lower at one month follow‐up, in four studies of 97 people (SMD ‐0.48), at one to six months in 12 studies of 521 people (SMD ‐0.49) and at more than six months in one study of 40 people (SMD ‐1.89). There were no significant differences between physical relaxation such as massage or mental relaxation such as mindfulness meditation. Comparisons of relaxation versus other interventions were difficult to judge because the control groups varied and could not be pooled. The results were at best inconsistent.
There was low‐quality evidence in two studies that changing work schedules reduced stress levels. Other organisational interventions did not lead to considerable reductions of stress levels at any of the three follow‐up times. This conclusion, however, is mostly based on single studies only.
Overall completeness and applicability of evidence
Studies have been performed in many countries and almost all continents except for Africa. Even though we did not perform a specific subgroup analysis, It does not seem that there are differences in effect between different cultures. Chinese relaxation techniques like Qigong are equally applicable in Europe, and conversely CBT seems to lead to effects in Japanese nurses similar to those in US nurses.
Studies have been performed in various healthcare occupations. In the previous version of this review, stress management interventions were almost exclusively studied in nurses, but now a few studies have also been conducted with physicians. We believe that this is important because it is conceivable that the interventions would have a different effect among physicians. We did a formal subgroup analysis of the effect in various healthcare occupations. There were no differences in effect between the subgroups but the power of the test to detect these differences is low.
Recently, the number of studies has increased enormously, with the majority of studies having been published after 2010. This means that the evidence is recent and well applicable to current healthcare situations.
A wide range of person‐directed interventions has been studied, from aroma therapy, massage, music‐making and Qigong to more formal CBT techniques that address the relation between thoughts and emotions. Also when it comes to organisational interventions, a wide range has been studied, varying from the creation of support groups to changing the content of care.
As to the outcomes, it is unclear what the main aim of the interventions is. For example, the MBI discerns three specific aspects of burnout: emotional exhaustion, depersonalisation and lack of personal accomplishment. It is unclear if the various interventions aim to prevent specific aspects of burnout or if they aim only to reduce emotional exhaustion.
Quality of the evidence
The quality of the evidence that we found was not very high. Some studies applied rigorous methods but contended with attrition problems. Most randomised controlled trials (RCTs) had fewer than 120 participants, especially those that examined relaxation techniques. For a SMD of ‐0.38 and using Lehr's formula, a sample size of 110 is sufficient to find a significant difference with P < 0.05 and 80% power (Petrie 2006). Reporting quality was low, with most studies not reporting adequately on random number generation or allocation concealment. We assumed that outcomes that were measured by questionnaire were reported blind to the researchers but we could not be certain about this assumption.
In many studies, it seems that healthcare workers themselves are most interested in the effects of stress management interventions on themselves and their colleagues. This does not always lead to the best quality studies. Formal power calculations are often missing and the personnel of one single department are randomised into an intervention and a control group. Given the great interest in stress prevention in healthcare staff, it would be good if those setting up new studies were better educated on how to design and conduct studies so that risk of bias is minimised.
Even though we found significant results, it is not possible to say how this is related to the clinical relevance of the changes achieved in the studies. With the MBI (Maslach 1996), for example, there is no generally accepted change that would be regarded as clinically relevant. We contacted the authors of the questionnaire but they could not help clarify this issue for us.
Potential biases in the review process
We assumed that the various stress measurement instruments measured the same aspect of perceived stress. There is some evidence that the emotional exhaustion scale of the MBI can be replaced by a single‐item question on self‐defined burnout (Rohland 2004). Given that we found considerable heterogeneity between studies, this assumption is not supported by the evidence. However, we also presented the results separately for studies that used the MBI, and presented the results as the original scales of the MBI, not transformed into SMDs. Even though only a fraction of all the studies could be included, this analysis showed similar results. We therefore believe that the results based on SMDs are reliable.
We had to categorise the interventions ourselves. There is no major framework available for categorising preventive stress interventions. We believe that the main categorisation into person‐ and work‐directed interventions is useful because it is considerably more difficult to change organisational structures or to introduce new organisational elements than to organise an individual stress management course. However, many interventions such as organising peer support groups or mentoring schemes are difficult to classify as either person‐ or work‐directed interventions. If the categorisation of the interventions had been different, then the results could also have changed. However, we do not think that this would have affected our main conclusions based on CBT, relaxation and organisational interventions.
We took follow‐up times into account when pooling the various study results. This led to a spread of studies over various follow‐up times. With different categories of follow‐up times, the comparisons would have been different and possibly also the results. Resources to evaluate the effects of these assumptions were lacking. We do not know how different effects of stress management interventions are at various follow‐up times. It could be that combining all studies with a follow‐up longer than one month is also sensible. We believe that a more conservative approach is warranted if no clear evidence for similar effects is available.
We included reports of studies in all languages and therefore believe that there is no language bias in our review.
We assessed publication bias based on fairly small samples of studies (seven, eight and 13 respectively) and we downgraded the level of evidence in two comparisons based on suspicion of publication bias. As The Cochrane Handbook (Higgins 2011) recommends using a minimum of ten studies to assess publication bias, this may have led to a too conservative estimate of the quality of the evidence.
Agreements and disagreements with other studies or reviews
Reviews on stress prevention in nurses
When compared to older reviews such as Mimura 2003, our review, even though it used more rigorous inclusion criteria, only accepting randomised controlled trials for person‐directed interventions, found 51 more trials. Where Mimura 2003 refrained from drawing clear conclusions based on the studies found, we could make better inferences. Jones 2000b reviewed studies in nurses and student nurses but only for the time period 1992 to 1999, and is mainly narrative. Gilbody 2006 reviewed interventions to improve the morale of staff, restricted to mental healthcare workers only. It reached more or less the same conclusion as our review, even though the number of studies included was fewer and they used a wider range of outcome measures and study designs. Paris 2010 reviewed intervention effectiveness in mental healthcare workers but they located only two non‐randomised intervention studies. They conclude that many strategies to prevent burnout that are mentioned in the literature have not been evaluated, such as the introduction of competitive salaries, financial and non‐financial incentives, opportunities for promotion and career advancement, increased staffing levels, clear job descriptions or expectations, and open‐door policies with management. For other possible interventions that they mention we found evidence in our review: training staff on self‐care strategies, additional clinical supervision and mentoring, routine assessment of burnout, flexible work schedules, social events and informal support as well as in‐service training. Galbraith 2011 studied intervention effects in student nurses. The review located 16 studies and concluded that relaxation and skills for changing maladaptive cognitions were effective. In addition, the authors concluded that interventions that promoted skills to reduce stressors were also successful but that there was no effect on academic performance. They agree with our conclusions that the design of stress interventions should be more driven by theory. Pulido‐Martos 2012 reviewed 23 studies on sources of stress in student nurses and found that, in addition to stress from academic performance, students perceived stress from clinical situations such as fear of unknown situations, mistakes with patients or handling of technical equipment. It is unclear if current interventions would also address these factors, even though better individual stress‐management in general would probably also work in these situations.
Reviews on stress prevention in all occupations
The quality of the evidence that we found was also better than Michie 2003 found, as their sample consisted almost entirely of cross‐sectional studies. Another review by Van der Klink 2001 involved a meta‐analysis of interventions to prevent or treat stress in all occupations. In line with the results of this version of our review, Van der Klink 2001 concluded that there was no evidence in favour of work‐directed interventions. Richardson 2008 performed a systematic review and meta‐analysis of RCTs of stress management interventions in any occupation. They found 36 studies and pooled all of them, resulting in an SMD of 0.526 (95% CI 0.36 to 0.69). In their analysis, cognitive‐behavioral programmes produced larger effects than other types of interventions. Treatment length, outcome type, and occupation did not reveal significant variations in effect size by intervention type. These results are comparable with ours but we found that the effects of relaxation and CBT were similar. The review missed many studies performed in health care because the authors did not search MEDLINE.Theirs was the only review that assessed publication bias. Using the trim‐and‐fill method they found only a weak indication of publication bias for CBT studies. Awa 2010 reviewed, up until 2007, 25 intervention studies aimed at preventing burnout. They included all before‐and‐after evaluations but only with burnout‐like outcome measures such as the MBI. They concluded that person‐directed interventions reduced burnout in the short term (six months or less), while a combination of both person‐ and organisation‐directed interventions had longer‐lasting positive effects (12 months and over). In all cases, positive intervention effects diminished over the course of time. These conclusions are not clear from our review. This could be due to the different categorisation of interventions, but also to the fact that the authors did not perform meta‐analysis. Chiesa 2009 identified 10 studies that evaluated mindfulness‐based stress reduction and found that mindfulness‐based interventions are effective in reducing stress. Based on one study they concluded, in line with our review, that mindfulness‐based interventions produced effects similar to physical relaxation. They rated the quality of the evidence as low and proposed to compare mindfulness‐based interventions with other non‐specific interventions. Malgorzata 2010 gave a general overview of organisational interventions aimed at reducing stress, but this was not a systematic review.
Overviews of systematic reviews
Günthner 2010 gave an overview of systematic reviews on stress management as burnout prevention. They conclude that CBT is the most effective intervention even though they did not perform a network meta‐analysis. They concluded that booster sessions are beneficial. Bhui 2012 also gave a narrative overview of the effectiveness of individual, organisational and mixed interventions on mental health based on 23 systematic reviews. They concluded that meta‐analyses found a greater effect size of individual interventions on individual outcomes. Organisational interventions showed mixed evidence of benefit. In contrast to our review, they found that cognitive‐behavioural programmes produced larger effects at the individual level compared with other interventions. They did not address the possibility of publication bias.
It seems therefore that no review has covered all recent studies on stress management in healthcare staff published after 2010. Most of the other reviews did not examine the possibility of publication bias favouring beneficial results. Compared to other reviews, our conclusions are more tentative.
Risk of bias summary: review authors' judgements about each risk of bias item for each included study.
Funnel plot of comparison: 1 Cognitive‐behavioural intervention vs no Intervention (SMD), outcome: 1.1 Any Stress‐related Outcome (follow‐up up to 1 month).
Funnel plot of comparison: 1 Cognitive‐behavioural intervention vs no Intervention (SMD), outcome: 1.2 Any Stress‐related Outcome (follow‐up 1 ‐ 6 months).
Funnel plot of comparison: 3 Relaxation vs. no intervention (SMD), outcome: 3.2 Any stress outcome (follow‐up 1 ‐ 6 months).

Comparison 1 Cognitive‐behavioural intervention vs no Intervention (SMD), Outcome 1 Any Stress‐related Outcome (follow‐up up to 1 month).
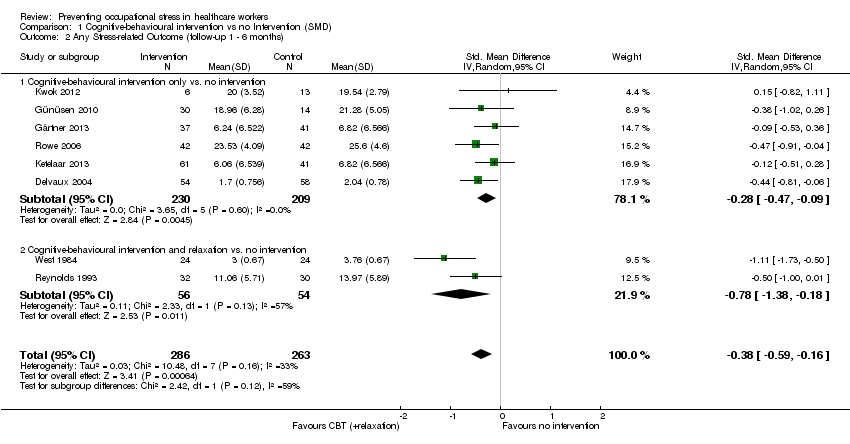
Comparison 1 Cognitive‐behavioural intervention vs no Intervention (SMD), Outcome 2 Any Stress‐related Outcome (follow‐up 1 ‐ 6 months).

Comparison 1 Cognitive‐behavioural intervention vs no Intervention (SMD), Outcome 3 Any Stress‐related Outcome (follow‐up more than 6 months).

Comparison 1 Cognitive‐behavioural intervention vs no Intervention (SMD), Outcome 4 State‐Trait Anxiety Inventory (follow‐up up to 1 month).

Comparison 1 Cognitive‐behavioural intervention vs no Intervention (SMD), Outcome 5 State‐Trait Anxiety Inventory (follow‐up 1 ‐ 6 months).

Comparison 1 Cognitive‐behavioural intervention vs no Intervention (SMD), Outcome 6 General Health Questionnaire (follow‐up up to 1 month).

Comparison 2 Cognitive‐behavioural intervention vs. non‐stress management intervention (SMD), Outcome 1 Any stress scale (follow‐up 1 ‐ 6 months).

Comparison 2 Cognitive‐behavioural intervention vs. non‐stress management intervention (SMD), Outcome 2 Any stress scale (follow‐up more than 6 months).

Comparison 2 Cognitive‐behavioural intervention vs. non‐stress management intervention (SMD), Outcome 3 Anxiety (follow‐up 1 ‐ 6 months).

Comparison 3 Relaxation vs. no intervention (SMD), Outcome 1 Any stress outcome (follow‐up up to 1 month).

Comparison 3 Relaxation vs. no intervention (SMD), Outcome 2 Any stress outcome (follow‐up 1 ‐ 6 months).

Comparison 3 Relaxation vs. no intervention (SMD), Outcome 3 Any stress outcome (follow‐up more than 6 months).

Comparison 3 Relaxation vs. no intervention (SMD), Outcome 4 State Anxiety (follow‐up 1 ‐ 6 months).

Comparison 3 Relaxation vs. no intervention (SMD), Outcome 5 Trait Anxiety (follow‐up 1 ‐ 6 months).

Comparison 3 Relaxation vs. no intervention (SMD), Outcome 6 General Health (follow‐up 1 ‐ 6 months).

Comparison 4 Relaxation vs. other intervention (SMD), Outcome 1 Any stress outcome.

Comparison 4 Relaxation vs. other intervention (SMD), Outcome 2 Any anxiety outcome.

Comparison 4 Relaxation vs. other intervention (SMD), Outcome 3 General Health Questionnaire.

Comparison 5 Organisational intervention vs. no intervention (SMD), Outcome 1 Any stress‐related outcome (follow‐up up to 1 month).

Comparison 5 Organisational intervention vs. no intervention (SMD), Outcome 2 Any stress‐related outcome RCTs (follow‐up 1 ‐ 6 months).

Comparison 5 Organisational intervention vs. no intervention (SMD), Outcome 3 Any stress‐related outcome (follow‐up more than 6 months).
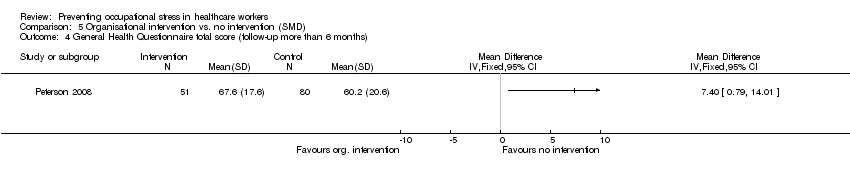
Comparison 5 Organisational intervention vs. no intervention (SMD), Outcome 4 General Health Questionnaire total score (follow‐up more than 6 months).
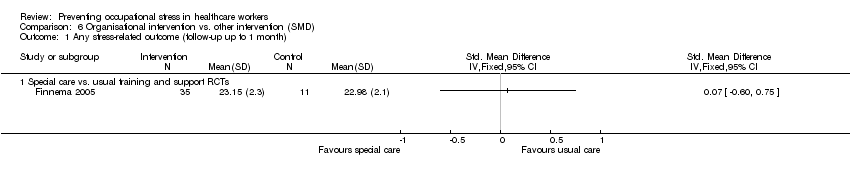
Comparison 6 Organisational intervention vs. other intervention (SMD), Outcome 1 Any stress‐related outcome (follow‐up up to 1 month).

Comparison 6 Organisational intervention vs. other intervention (SMD), Outcome 2 Any stress‐related outcome (follow‐up 1 ‐ 6 months).

Comparison 6 Organisational intervention vs. other intervention (SMD), Outcome 3 Any stress‐related outcome (follow‐up more than 6 months).
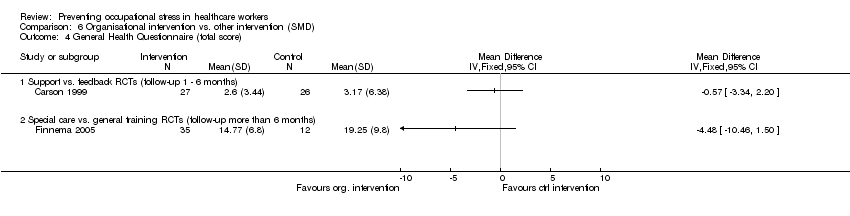
Comparison 6 Organisational intervention vs. other intervention (SMD), Outcome 4 General Health Questionnaire (total score).

Comparison 7 Cognitive‐behavioural intervention vs. no intervention (MD), Outcome 1 Maslach Burnout Inventory (follow‐up up to 1 month).

Comparison 7 Cognitive‐behavioural intervention vs. no intervention (MD), Outcome 2 Maslach Burnout Inventory (follow‐up 1 to 6 months).

Comparison 8 Cognitive‐behavioural intervention and relaxation vs. no intervention (MD), Outcome 1 Maslach Burnout Inventory (follow‐up up to 1 month).
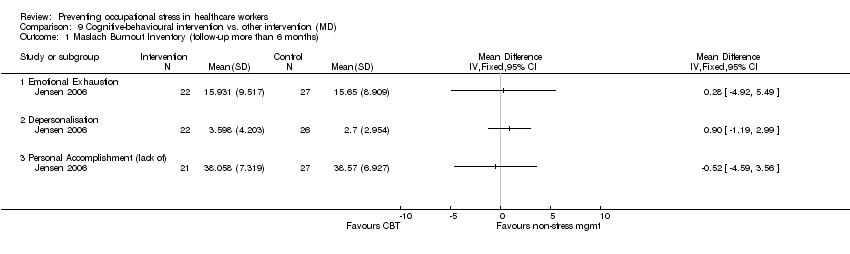
Comparison 9 Cognitive‐behavioural intervention vs. other intervention (MD), Outcome 1 Maslach Burnout Inventory (follow‐up more than 6 months).

Comparison 10 Relaxation vs. no intervention (MD), Outcome 1 Maslach Burnout Inventory (follow‐up 1 ‐ 6 months).

Comparison 11 Organisational intervention vs. no intervention (MD), Outcome 1 Maslach Burnout Inventory (follow‐up less than 1 month).
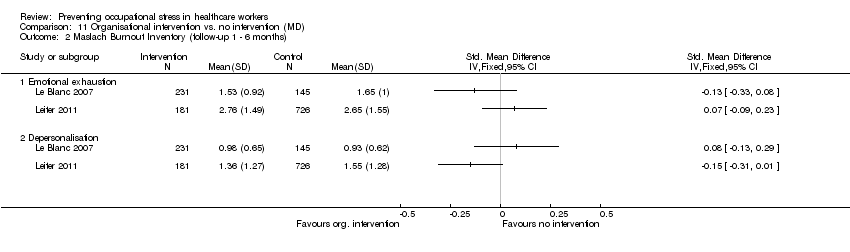
Comparison 11 Organisational intervention vs. no intervention (MD), Outcome 2 Maslach Burnout Inventory (follow‐up 1 ‐ 6 months).
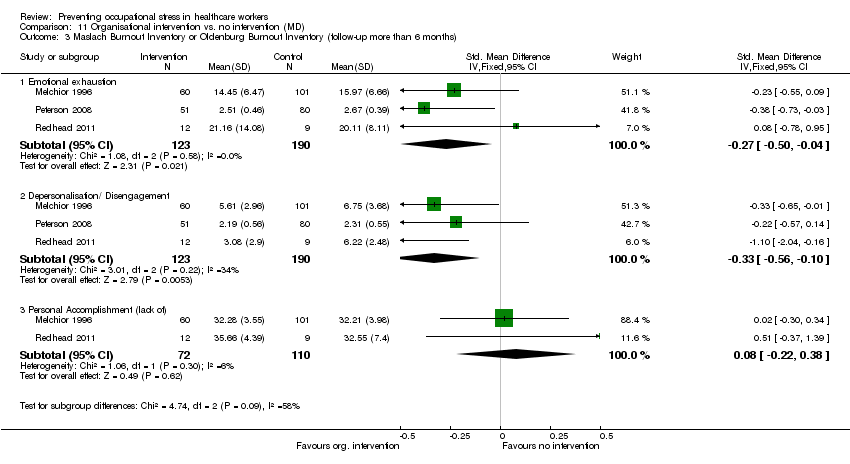
Comparison 11 Organisational intervention vs. no intervention (MD), Outcome 3 Maslach Burnout Inventory or Oldenburg Burnout Inventory (follow‐up more than 6 months).
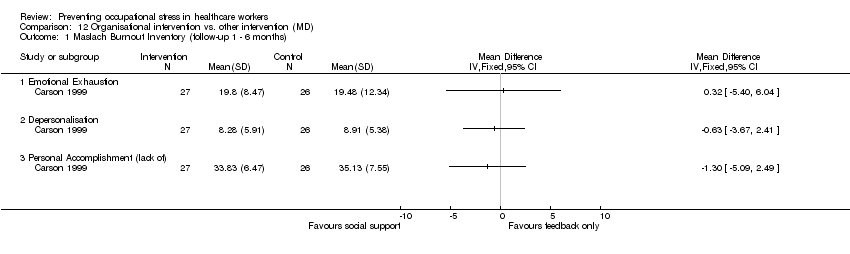
Comparison 12 Organisational intervention vs. other intervention (MD), Outcome 1 Maslach Burnout Inventory (follow‐up 1 ‐ 6 months).

Comparison 13 Cognitive‐behavioural intervention vs. no Intervention (SUBGROUPS) (SMD), Outcome 1 Any Stress‐related Outcome (follow‐up up to 1 month).
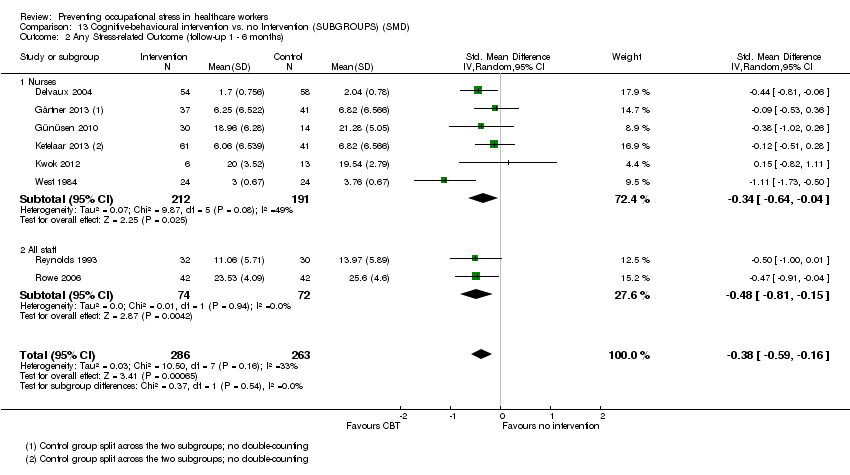
Comparison 13 Cognitive‐behavioural intervention vs. no Intervention (SUBGROUPS) (SMD), Outcome 2 Any Stress‐related Outcome (follow‐up 1 ‐ 6 months).

Comparison 14 Relaxation vs. no intervention (SUBGROUPS) (SMD), Outcome 1 Any stress outcome (follow‐up to 1 month).

Comparison 14 Relaxation vs. no intervention (SUBGROUPS) (SMD), Outcome 2 Any stress outcome (follow‐up 1 ‐ 6 months).
| Cognitive‐behavioural intervention compared to no Intervention for reducing stress | ||||||
| Patient or population: Healthcare workers | ||||||
| Outcomes | Illustrative comparative risks* (95% CI) | Relative effect | No of Participants | Quality of the evidence | Comments | |
| Assumed risk | Corresponding risk | |||||
| No Intervention | Cognitive‐behavioural intervention | |||||
| Stress 1 Month | The median stress level across all control groups across all follow‐up times was 24.33 points on the Emotional Exhaustion subscale of the Maslach Burnout Inventory¹ | The mean stress level at 1 month in the intervention groups was 1.22 points lower (2.98 lower to 0.59 higher). | SMD ‐0.27 (‐0.66 to 0.13) | 332 | ⊕⊕⊝⊝ | This meta‐analysis was back transformed to the EE subscale of the MBI by using the median SD of the EE scale across control groups. |
| Stress 1 ‐ 6 months | The median stress level across all control groups across all follow‐up times was 24.33 points on the Emotional Exhaustion subscale of the Maslach Burnout Inventory¹ | The mean stress at 1 ‐ 6 months in the intervention groups was 1.83 points lower (0.77 to 2.85 lower). | SMD ‐0.38 (‐0.59 to ‐0.16) | 549 | ⊕⊕⊝⊝ low²,³ | This meta‐analysis was back transformed to the EE subscale of the MBI by using the median SD of the EE scale across control groups. |
| Stress > 6 months | The median stress level across all control groups across all follow‐up times was 24.33 points on the Emotional Exhaustion subscale of the Maslach Burnout Inventory¹ | The mean stress at more than 6 months in the intervention groups was 11.34 points lower (4.47 to 14.94 lower) | SMD ‐1.04 (‐1.37 to ‐0.70) | 157 | ⊕⊕⊝⊝ low²,³ | This meta‐analysis was back transformed to the EE subscale of the MBI by using the median SD of the EE scale across control groups. |
| *The basis for the assumed risk (e.g. the median control group risk across studies) is provided in footnotes. The corresponding risk (and its 95% confidence interval) is based on the assumed risk in the comparison group and the relative effect of the intervention (and its 95% CI). | ||||||
| GRADE Working Group grades of evidence | ||||||
| 1 This was the median from the control groups of all studies that measured the effect of CBT vs. no intervention on Emotional Exhaustion with the same scale. | ||||||
| Relaxation compared to no intervention (SMD) for | ||||||
| Patient or population: Healthcare workers | ||||||
| Outcomes | Illustrative comparative risks* (95% CI) | Relative effect | No of Participants | Quality of the evidence | Comments | |
| Assumed risk | Corresponding risk | |||||
| no intervention (SMD) | Relaxation | |||||
| Stress 1 month | The median stress level across all control groups across all follow‐up times was 22.17 points on the Emotional Exhaustion subscale of the Maslach Burnout Inventory¹ | The mean stress at 1 month in the intervention groups was 2.14 points lower (0.36 to 3.96 lower). | SMD ‐0.48 (‐0.89 to ‐0.08) | 97 | ⊕⊕⊝⊝ low | This meta‐analysis was back transformed to the EE subscale of the MBI by using the median SD of the EE scale across control groups. |
| Stress 1 ‐ 6 months | The median stress level across all control groups across all follow‐up times was 22.17 points on the Emotional Exhaustion subscale of the Maslach Burnout Inventory¹ | The mean stress at 1 ‐ 6 months in the intervention groups was 4.84 points lower (2.37 to 6.92 lower). | SMD ‐0.49 (‐0.78 to ‐0.21) | 521 | ⊕⊕⊕⊝ moderate | This meta‐analysis was back transformed to the EE subscale of the MBI by using the median SD of the EE scale across control groups. |
| Stress > 6 months | The median stress level across all control groups across all follow‐up times was 22.17 points on the Emotional Exhaustion subscale of the Maslach Burnout Inventory¹ | The mean stress at > 6 months in the intervention groups was 5.67 points lower (3.39 to 7.95 lower). | SMD ‐1.89 (‐2.65 to ‐1.13) | 40 | ⊕⊕⊝⊝ low | This result was back transformed to the EE subscale of the MBI by using the median SD of the EE scale across control groups. |
| *The basis for the assumed risk (e.g. the median control group risk across studies) is provided in footnotes. The corresponding risk (and its 95% confidence interval) is based on the assumed risk in the comparison group and the relative effect of the intervention (and its 95% CI). | ||||||
| GRADE Working Group grades of evidence | ||||||
| 1 This was the median from the control groups of all studies that measured the effect of relaxation vs. no intervention on Emotional Exhaustion with the same scale. | ||||||
| Comparison | Risk of Bias | Inconsistency | Indirectness | Imprecision | Publication Bias | Level of Evidence |
| CBT vs no intervention 1 mo follow‐up | 5 out of 6 studies high risk of bias: 1 level down | I² = 64%: no downgrading | No | 332 participants No downgrading | Yes in funnel plot: 1 level down | Low Quality |
| CBT vs no intervention 1 ‐ 6 mo follow‐up | 5 out of 8 studies high risk of bias: 1 level down | I² = 54%: no downgrading | No | 549 participants No downgrading | Yes in funnel plot: 1 level down | Low Quality |
| CBT vs no intervention > 6 months follow‐up | 2 studies high risk of bias: 1 level down | I² = 38%: no downgrading | No | 157 participants 1 level down | Not apparent | Low Quality |
| Relaxation vs no intervention 1 mo follow‐up | 3 out 4 studies high risk of bias: 1 level down | I² = 0%: no downgrading | No | 97 participants 1 level down | Not apparent | Low Quality |
| Relaxation vs no intervention 1 ‐ 6 mo follow‐up | 10 out of 13 studies high risk of bias: 1 level down | I² = 57%: no downgrading | No | 521 participants no downgrading | Not apparent | Moderate Quality |
| Relaxation vs no intervention > 6 mo follow‐up | 1 study: no downgrading | N/A | No | 40 participants 2 levels down | Not apparent | Low Quality |
| Outcome or subgroup title | No. of studies | No. of participants | Statistical method | Effect size |
| 1 Any Stress‐related Outcome (follow‐up up to 1 month) Show forest plot | 7 | 332 | Std. Mean Difference (IV, Random, 95% CI) | ‐0.27 [‐0.66, 0.13] |
| 1.1 Cognitive‐behavioural intervention only vs. no intervention | 4 | 248 | Std. Mean Difference (IV, Random, 95% CI) | ‐0.25 [‐0.60, 0.11] |
| 1.2 Cognitive‐behavioural intervention and relaxation vs. no intervention | 3 | 84 | Std. Mean Difference (IV, Random, 95% CI) | ‐0.45 [‐1.61, 0.70] |
| 2 Any Stress‐related Outcome (follow‐up 1 ‐ 6 months) Show forest plot | 8 | 549 | Std. Mean Difference (IV, Random, 95% CI) | ‐0.38 [‐0.59, ‐0.16] |
| 2.1 Cognitive‐behavioural intervention only vs. no intervention | 6 | 439 | Std. Mean Difference (IV, Random, 95% CI) | ‐0.28 [‐0.47, ‐0.09] |
| 2.2 Cognitive‐behavioural intervention and relaxation vs. no intervention | 2 | 110 | Std. Mean Difference (IV, Random, 95% CI) | ‐0.78 [‐1.38, ‐0.18] |
| 3 Any Stress‐related Outcome (follow‐up more than 6 months) Show forest plot | 2 | 157 | Std. Mean Difference (IV, Fixed, 95% CI) | ‐1.04 [‐1.37, ‐0.70] |
| 3.1 Cognitive‐behavioural intervention with or without relaxation vs. no intervention | 2 | 157 | Std. Mean Difference (IV, Fixed, 95% CI) | ‐1.04 [‐1.37, ‐0.70] |
| 4 State‐Trait Anxiety Inventory (follow‐up up to 1 month) Show forest plot | 3 | Mean Difference (IV, Random, 95% CI) | Subtotals only | |
| 4.1 CBT and relaxation vs. no intervention State Anxiety | 3 | 135 | Mean Difference (IV, Random, 95% CI) | ‐11.07 [‐18.39, ‐3.75] |
| 4.2 CBT and relaxation vs. no intervention Trait Anxiety | 3 | 135 | Mean Difference (IV, Random, 95% CI) | ‐8.36 [‐10.02, ‐6.70] |
| 5 State‐Trait Anxiety Inventory (follow‐up 1 ‐ 6 months) Show forest plot | 1 | Mean Difference (IV, Fixed, 95% CI) | Totals not selected | |
| 5.1 CBT and relaxation vs. no intervention State Anxiety | 1 | Mean Difference (IV, Fixed, 95% CI) | 0.0 [0.0, 0.0] | |
| 5.2 CBT and relaxation vs. no intervention Trait Anxiety | 1 | Mean Difference (IV, Fixed, 95% CI) | 0.0 [0.0, 0.0] | |
| 6 General Health Questionnaire (follow‐up up to 1 month) Show forest plot | 1 | Mean Difference (IV, Fixed, 95% CI) | Totals not selected | |
| 6.1 CBT and relaxation vs. no intervention | 1 | Mean Difference (IV, Fixed, 95% CI) | 0.0 [0.0, 0.0] | |
| Outcome or subgroup title | No. of studies | No. of participants | Statistical method | Effect size |
| 1 Any stress scale (follow‐up 1 ‐ 6 months) Show forest plot | 2 | 83 | Std. Mean Difference (IV, Random, 95% CI) | ‐0.54 [‐1.16, 0.08] |
| 2 Any stress scale (follow‐up more than 6 months) Show forest plot | 1 | Std. Mean Difference (IV, Random, 95% CI) | Totals not selected | |
| 3 Anxiety (follow‐up 1 ‐ 6 months) Show forest plot | 1 | Mean Difference (IV, Fixed, 95% CI) | Totals not selected | |
| 3.1 CBT vs. passive support by a psychologist | 1 | Mean Difference (IV, Fixed, 95% CI) | 0.0 [0.0, 0.0] | |
| Outcome or subgroup title | No. of studies | No. of participants | Statistical method | Effect size |
| 1 Any stress outcome (follow‐up up to 1 month) Show forest plot | 4 | 97 | Std. Mean Difference (IV, Random, 95% CI) | ‐0.48 [‐0.89, ‐0.08] |
| 1.1 Physical relaxation (follow‐up up to 1 month) | 4 | 97 | Std. Mean Difference (IV, Random, 95% CI) | ‐0.48 [‐0.89, ‐0.08] |
| 2 Any stress outcome (follow‐up 1 ‐ 6 months) Show forest plot | 12 | 521 | Std. Mean Difference (IV, Random, 95% CI) | ‐0.49 [‐0.78, ‐0.21] |
| 2.1 Mental relaxation | 6 | 205 | Std. Mean Difference (IV, Random, 95% CI) | ‐0.50 [‐1.15, 0.15] |
| 2.2 Physical relaxation | 6 | 316 | Std. Mean Difference (IV, Random, 95% CI) | ‐0.47 [‐0.70, ‐0.24] |
| 3 Any stress outcome (follow‐up more than 6 months) Show forest plot | 1 | Std. Mean Difference (IV, Fixed, 95% CI) | Totals not selected | |
| 3.1 Mental relaxation | 1 | Std. Mean Difference (IV, Fixed, 95% CI) | 0.0 [0.0, 0.0] | |
| 4 State Anxiety (follow‐up 1 ‐ 6 months) Show forest plot | 1 | 66 | Mean Difference (IV, Fixed, 95% CI) | ‐7.79 [‐11.24, ‐4.34] |
| 4.1 Mental relaxation vs. no intervention | 1 | 33 | Mean Difference (IV, Fixed, 95% CI) | ‐8.74 [‐13.94, ‐3.54] |
| 4.2 Physical relaxation vs. no intervention | 1 | 33 | Mean Difference (IV, Fixed, 95% CI) | ‐7.04 [‐11.65, ‐2.43] |
| 5 Trait Anxiety (follow‐up 1 ‐ 6 months) Show forest plot | 1 | 66 | Mean Difference (IV, Fixed, 95% CI) | ‐1.09 [‐4.53, 2.36] |
| 5.1 Mental relaxation vs. no intervention | 1 | 33 | Mean Difference (IV, Fixed, 95% CI) | ‐2.41 [‐6.93, 2.11] |
| 5.2 Physical relaxation vs. no intervention | 1 | 33 | Mean Difference (IV, Fixed, 95% CI) | 0.75 [‐4.58, 6.08] |
| 6 General Health (follow‐up 1 ‐ 6 months) Show forest plot | 2 | Mean Difference (IV, Fixed, 95% CI) | Subtotals only | |
| 6.1 Mental relaxation vs. no intervention | 1 | 33 | Mean Difference (IV, Fixed, 95% CI) | ‐7.10 [‐11.39, ‐2.81] |
| 6.2 Physical relaxation vs. no intervention | 2 | 70 | Mean Difference (IV, Fixed, 95% CI) | ‐3.22 [‐6.53, 0.08] |
| Outcome or subgroup title | No. of studies | No. of participants | Statistical method | Effect size |
| 1 Any stress outcome Show forest plot | 4 | Std. Mean Difference (IV, Fixed, 95% CI) | Totals not selected | |
| 1.1 Mental relaxation training vs. training on theory analysis (follow‐up 1 ‐ 6 months) | 1 | Std. Mean Difference (IV, Fixed, 95% CI) | 0.0 [0.0, 0.0] | |
| 1.2 Mental relaxation vs. relaxing in a chair (follow‐up to 1 month) | 1 | Std. Mean Difference (IV, Fixed, 95% CI) | 0.0 [0.0, 0.0] | |
| 1.3 Physical relaxation vs. break (follow‐up to 1 month) | 2 | Std. Mean Difference (IV, Fixed, 95% CI) | 0.0 [0.0, 0.0] | |
| 2 Any anxiety outcome Show forest plot | 1 | Std. Mean Difference (IV, Random, 95% CI) | Totals not selected | |
| 2.1 AMMA touch therapy vs. touch therapy without intent (follow‐up to 1 month) | 1 | Std. Mean Difference (IV, Random, 95% CI) | 0.0 [0.0, 0.0] | |
| 3 General Health Questionnaire Show forest plot | 1 | Std. Mean Difference (IV, Fixed, 95% CI) | Totals not selected | |
| 3.1 Physical relaxation training vs. training on theory analysis (follow‐up 1 ‐ 6 months) | 1 | Std. Mean Difference (IV, Fixed, 95% CI) | 0.0 [0.0, 0.0] | |
| Outcome or subgroup title | No. of studies | No. of participants | Statistical method | Effect size |
| 1 Any stress‐related outcome (follow‐up up to 1 month) Show forest plot | 3 | Std. Mean Difference (IV, Fixed, 95% CI) | Totals not selected | |
| 1.1 Support | 1 | Std. Mean Difference (IV, Fixed, 95% CI) | 0.0 [0.0, 0.0] | |
| 1.2 Communication skills | 1 | Std. Mean Difference (IV, Fixed, 95% CI) | 0.0 [0.0, 0.0] | |
| 1.3 Special Care RCTs | 1 | Std. Mean Difference (IV, Fixed, 95% CI) | 0.0 [0.0, 0.0] | |
| 2 Any stress‐related outcome RCTs (follow‐up 1 ‐ 6 months) Show forest plot | 5 | Std. Mean Difference (IV, Fixed, 95% CI) | Subtotals only | |
| 2.1 Working conditions RCTs | 2 | 525 | Std. Mean Difference (IV, Fixed, 95% CI) | ‐0.12 [‐0.30, 0.05] |
| 2.2 Special Care RCTs | 1 | 71 | Std. Mean Difference (IV, Fixed, 95% CI) | ‐0.13 [‐0.60, 0.33] |
| 2.3 Support RCTs | 2 | 952 | Std. Mean Difference (IV, Fixed, 95% CI) | 0.07 [‐0.09, 0.23] |
| 3 Any stress‐related outcome (follow‐up more than 6 months) Show forest plot | 4 | Std. Mean Difference (IV, Fixed, 95% CI) | Totals not selected | |
| 3.1 Working conditions RCTs | 1 | Std. Mean Difference (IV, Fixed, 95% CI) | 0.0 [0.0, 0.0] | |
| 3.2 Working conditions CCTs | 1 | Std. Mean Difference (IV, Fixed, 95% CI) | 0.0 [0.0, 0.0] | |
| 3.3 Special Care RCTs | 1 | Std. Mean Difference (IV, Fixed, 95% CI) | 0.0 [0.0, 0.0] | |
| 3.4 Support RCTs | 1 | Std. Mean Difference (IV, Fixed, 95% CI) | 0.0 [0.0, 0.0] | |
| 4 General Health Questionnaire total score (follow‐up more than 6 months) Show forest plot | 1 | Mean Difference (IV, Fixed, 95% CI) | Totals not selected | |
| Outcome or subgroup title | No. of studies | No. of participants | Statistical method | Effect size |
| 1 Any stress‐related outcome (follow‐up up to 1 month) Show forest plot | 1 | Std. Mean Difference (IV, Fixed, 95% CI) | Totals not selected | |
| 1.1 Special care vs. usual training and support RCTs | 1 | Std. Mean Difference (IV, Fixed, 95% CI) | 0.0 [0.0, 0.0] | |
| 2 Any stress‐related outcome (follow‐up 1 ‐ 6 months) Show forest plot | 1 | Std. Mean Difference (IV, Fixed, 95% CI) | Totals not selected | |
| 2.1 Support vs. feedback only RCTs | 1 | Std. Mean Difference (IV, Fixed, 95% CI) | 0.0 [0.0, 0.0] | |
| 3 Any stress‐related outcome (follow‐up more than 6 months) Show forest plot | 2 | Std. Mean Difference (IV, Fixed, 95% CI) | Subtotals only | |
| 3.1 Shorter vs longer working schedules RCTs | 2 | 180 | Std. Mean Difference (IV, Fixed, 95% CI) | ‐0.55 [‐0.84, ‐0.25] |
| 4 General Health Questionnaire (total score) Show forest plot | 2 | Mean Difference (IV, Fixed, 95% CI) | Totals not selected | |
| 4.1 Support vs. feedback RCTs (follow‐up 1 ‐ 6 months) | 1 | Mean Difference (IV, Fixed, 95% CI) | 0.0 [0.0, 0.0] | |
| 4.2 Special care vs. general training RCTs (follow‐up more than 6 months) | 1 | Mean Difference (IV, Fixed, 95% CI) | 0.0 [0.0, 0.0] | |
| Outcome or subgroup title | No. of studies | No. of participants | Statistical method | Effect size |
| 1 Maslach Burnout Inventory (follow‐up up to 1 month) Show forest plot | 2 | Mean Difference (IV, Fixed, 95% CI) | Subtotals only | |
| 1.1 Emotional exhaustion | 2 | 158 | Mean Difference (IV, Fixed, 95% CI) | ‐2.01 [‐3.34, ‐0.68] |
| 1.2 Depersonalisation | 2 | 158 | Mean Difference (IV, Fixed, 95% CI) | ‐1.35 [‐2.33, ‐0.36] |
| 1.3 Personal accomplishment (lack of) | 2 | 158 | Mean Difference (IV, Fixed, 95% CI) | 0.16 [‐1.21, 1.54] |
| 2 Maslach Burnout Inventory (follow‐up 1 to 6 months) Show forest plot | 2 | Mean Difference (IV, Fixed, 95% CI) | Subtotals only | |
| 2.1 Emotional exhaustion | 2 | 128 | Mean Difference (IV, Fixed, 95% CI) | ‐2.13 [‐3.77, ‐0.49] |
| 2.2 Depersonalisation | 2 | 142 | Mean Difference (IV, Fixed, 95% CI) | ‐0.47 [‐1.53, 0.59] |
| 2.3 Personal accomplishment (lack of) | 2 | 143 | Mean Difference (IV, Fixed, 95% CI) | ‐0.62 [‐1.83, 0.59] |
| Outcome or subgroup title | No. of studies | No. of participants | Statistical method | Effect size |
| 1 Maslach Burnout Inventory (follow‐up up to 1 month) Show forest plot | 2 | Mean Difference (IV, Fixed, 95% CI) | Totals not selected | |
| 1.1 Emotional Exhaustion | 2 | Mean Difference (IV, Fixed, 95% CI) | 0.0 [0.0, 0.0] | |
| 1.2 Personal Accomplishment (lack of) | 2 | Mean Difference (IV, Fixed, 95% CI) | 0.0 [0.0, 0.0] | |
| Outcome or subgroup title | No. of studies | No. of participants | Statistical method | Effect size |
| 1 Maslach Burnout Inventory (follow‐up more than 6 months) Show forest plot | 1 | Mean Difference (IV, Fixed, 95% CI) | Totals not selected | |
| 1.1 Emotional Exhaustion | 1 | Mean Difference (IV, Fixed, 95% CI) | 0.0 [0.0, 0.0] | |
| 1.2 Depersonalisation | 1 | Mean Difference (IV, Fixed, 95% CI) | 0.0 [0.0, 0.0] | |
| 1.3 Personal Accomplishment (lack of) | 1 | Mean Difference (IV, Fixed, 95% CI) | 0.0 [0.0, 0.0] | |
| Outcome or subgroup title | No. of studies | No. of participants | Statistical method | Effect size |
| 1 Maslach Burnout Inventory (follow‐up 1 ‐ 6 months) Show forest plot | 4 | Mean Difference (IV, Random, 95% CI) | Subtotals only | |
| 1.1 Emotional Exhaustion | 4 | 137 | Mean Difference (IV, Random, 95% CI) | ‐1.06 [‐5.98, 3.87] |
| 1.2 Depersonalisation | 4 | 137 | Mean Difference (IV, Random, 95% CI) | ‐1.03 [‐2.70, 0.64] |
| 1.3 Personal Accomplishment (lack of) | 4 | 137 | Mean Difference (IV, Random, 95% CI) | 3.96 [0.70, 7.21] |
| Outcome or subgroup title | No. of studies | No. of participants | Statistical method | Effect size |
| 1 Maslach Burnout Inventory (follow‐up less than 1 month) Show forest plot | 1 | Std. Mean Difference (IV, Fixed, 95% CI) | Totals not selected | |
| 1.1 Emotional exhaustion | 1 | Std. Mean Difference (IV, Fixed, 95% CI) | 0.0 [0.0, 0.0] | |
| 1.2 Depersonalisation/ Disengagement | 1 | Std. Mean Difference (IV, Fixed, 95% CI) | 0.0 [0.0, 0.0] | |
| 1.3 Personal Accomplishment (lack of) | 1 | Std. Mean Difference (IV, Fixed, 95% CI) | 0.0 [0.0, 0.0] | |
| 2 Maslach Burnout Inventory (follow‐up 1 ‐ 6 months) Show forest plot | 2 | Std. Mean Difference (IV, Fixed, 95% CI) | Totals not selected | |
| 2.1 Emotional exhaustion | 2 | Std. Mean Difference (IV, Fixed, 95% CI) | 0.0 [0.0, 0.0] | |
| 2.2 Depersonalisation | 2 | Std. Mean Difference (IV, Fixed, 95% CI) | 0.0 [0.0, 0.0] | |
| 3 Maslach Burnout Inventory or Oldenburg Burnout Inventory (follow‐up more than 6 months) Show forest plot | 3 | Std. Mean Difference (IV, Fixed, 95% CI) | Subtotals only | |
| 3.1 Emotional exhaustion | 3 | 313 | Std. Mean Difference (IV, Fixed, 95% CI) | ‐0.27 [‐0.50, ‐0.04] |
| 3.2 Depersonalisation/ Disengagement | 3 | 313 | Std. Mean Difference (IV, Fixed, 95% CI) | ‐0.33 [‐0.56, ‐0.10] |
| 3.3 Personal Accomplishment (lack of) | 2 | 182 | Std. Mean Difference (IV, Fixed, 95% CI) | 0.08 [‐0.22, 0.38] |
| Outcome or subgroup title | No. of studies | No. of participants | Statistical method | Effect size |
| 1 Maslach Burnout Inventory (follow‐up 1 ‐ 6 months) Show forest plot | 1 | Mean Difference (IV, Fixed, 95% CI) | Totals not selected | |
| 1.1 Emotional Exhaustion | 1 | Mean Difference (IV, Fixed, 95% CI) | 0.0 [0.0, 0.0] | |
| 1.2 Depersonalisation | 1 | Mean Difference (IV, Fixed, 95% CI) | 0.0 [0.0, 0.0] | |
| 1.3 Personal Accomplishment (lack of) | 1 | Mean Difference (IV, Fixed, 95% CI) | 0.0 [0.0, 0.0] | |
| Outcome or subgroup title | No. of studies | No. of participants | Statistical method | Effect size |
| 1 Any Stress‐related Outcome (follow‐up up to 1 month) Show forest plot | 7 | 332 | Std. Mean Difference (IV, Random, 95% CI) | ‐0.27 [‐0.66, 0.13] |
| 1.1 Nurses | 1 | 36 | Std. Mean Difference (IV, Random, 95% CI) | ‐0.18 [‐0.84, 0.48] |
| 1.2 Physicians | 2 | 106 | Std. Mean Difference (IV, Random, 95% CI) | ‐0.59 [‐1.00, ‐0.18] |
| 1.3 All staff | 3 | 178 | Std. Mean Difference (IV, Random, 95% CI) | 0.11 [‐0.57, 0.80] |
| 1.4 Other professionals | 1 | 12 | Std. Mean Difference (IV, Random, 95% CI) | ‐1.20 [‐2.47, 0.08] |
| 2 Any Stress‐related Outcome (follow‐up 1 ‐ 6 months) Show forest plot | 8 | 549 | Std. Mean Difference (IV, Random, 95% CI) | ‐0.38 [‐0.59, ‐0.16] |
| 2.1 Nurses | 6 | 403 | Std. Mean Difference (IV, Random, 95% CI) | ‐0.34 [‐0.64, ‐0.04] |
| 2.2 All staff | 2 | 146 | Std. Mean Difference (IV, Random, 95% CI) | ‐0.48 [‐0.81, ‐0.15] |
| Outcome or subgroup title | No. of studies | No. of participants | Statistical method | Effect size |
| 1 Any stress outcome (follow‐up to 1 month) Show forest plot | 4 | 97 | Std. Mean Difference (IV, Fixed, 95% CI) | ‐0.48 [‐0.89, ‐0.08] |
| 1.1 Nurses | 2 | 43 | Std. Mean Difference (IV, Fixed, 95% CI) | ‐0.70 [‐1.32, ‐0.07] |
| 1.2 Physicians | 1 | 38 | Std. Mean Difference (IV, Fixed, 95% CI) | ‐0.18 [‐0.81, 0.46] |
| 1.3 Other Professionals | 1 | 16 | Std. Mean Difference (IV, Fixed, 95% CI) | ‐0.70 [‐1.71, 0.32] |
| 2 Any stress outcome (follow‐up 1 ‐ 6 months) Show forest plot | 12 | 521 | Std. Mean Difference (IV, Random, 95% CI) | ‐0.49 [‐0.78, ‐0.21] |
| 2.1 Nurses | 7 | 288 | Std. Mean Difference (IV, Random, 95% CI) | ‐0.59 [‐1.02, ‐0.16] |
| 2.2 Physicians | 0 | 0 | Std. Mean Difference (IV, Random, 95% CI) | 0.0 [0.0, 0.0] |
| 2.3 All Staff | 5 | 233 | Std. Mean Difference (IV, Random, 95% CI) | ‐0.36 [‐0.71, ‐0.01] |
| 2.4 Other Professionals | 0 | 0 | Std. Mean Difference (IV, Random, 95% CI) | 0.0 [0.0, 0.0] |