Cyclophosphamide for connective tissue disease–associated interstitial lung disease
Abstract
Background
Approximately one‐third of individuals with interstitial lung disease (ILD) have associated connective tissue disease (CTD). The connective tissue disorders most commonly associated with ILD include scleroderma/systemic sclerosis (SSc), rheumatoid arthritis, polymyositis/dermatomyositis, and Sjögren's syndrome. Although many people with CTD‐ILD do not develop progressive lung disease, a significant proportion do progress, leading to reduced physical function, decreased quality of life, and death. ILD is now the major cause of death amongst individuals with systemic sclerosis.
Cyclophosphamide is a highly potent immunosuppressant that has demonstrated efficacy in inducing and maintaining remission in autoimmune and inflammatory illnesses. However this comes with potential toxicities, including nausea, haemorrhagic cystitis, bladder cancer, bone marrow suppression, increased risk of opportunistic infections, and haematological and solid organ malignancies.
Decision‐making in the treatment of individuals with CTD‐ILD is difficult; the clinician needs to identify those who will develop progressive disease, and to weigh up the balance between a high level of need for therapy in a severely unwell patient population against the potential for adverse effects from highly toxic therapy, for which only relatively limited data on efficacy can be found. Similarly, it is not clear whether histological subtype, disease duration, or disease extent can be used to predict treatment responsiveness.
Objectives
To assess the efficacy and adverse effects of cyclophosphamide in the treatment of individuals with CTD‐ILD.
Search methods
We performed searches on CENTRAL, MEDLINE, Embase, CINAHL, and Web of Science up to May 2017. We handsearched review articles, clinical trial registries, and reference lists of retrieved articles.
Selection criteria
We included randomised controlled parallel‐group trials that compared cyclophosphamide in any form, used individually or concomitantly with other immunomodulating therapies, versus non‐cyclophosphamide‐containing therapies for at least six months, with follow‐up of at least 12 months from the start of treatment.
Data collection and analysis
We imported studies identified by the search into a reference manager database. We retrieved the full‐text versions of relevant studies, and two review authors independently extracted data. Primary outcomes were change in lung function (change in forced vital capacity (FVC) % predicted and diffusing capacity of the lung for carbon monoxide (DLCO) % predicted), adverse events, and health‐related quality of life measures. Secondary outcomes included all‐cause mortality, dyspnoea, cough, and functional exercise testing. When appropriate, we performed meta‐analyses and subgroup analyses by severity of lung function, connective tissue disease diagnosis, and radiological pattern of fibrosis. We assessed the evidence using the Grading of Recommendations Assessment, Development and Evaluation (GRADE) approach and created 'Summary of findings' tables.
Main results
We included in the analysis four trials with 495 participants (most with systemic sclerosis). We formed two separate comparisons: cyclophosphamide versus placebo (two trials, 195 participants) and cyclophosphamide versus mycophenolate (two trials, 300 participants). We found evidence to be of low quality, as dropout rates were high in the intervention groups, and as we noted a wide confidence interval around the effect with small differences, which affected the precision of results.
The data demonstrates significant improvement in lung function with cyclophosphamide compared with placebo (post‐treatment FVC % mean difference (MD) 2.83, 95% confidence interval (CI) 0.80 to 4.87; P = 0.006) but no significant difference in post‐treatment DLCO (% MD ‐1.68, 95% CI ‐4.37 to 1.02; P = 0.22; two trials, 182 participants).
Risk of adverse effects was increased in the cyclophosphamide treatment groups compared with the placebo groups, in particular, haematuria, leukopenia, and nausea, leading to a higher rate of withdrawal from cyclophosphamide treatment. The data demonstrates statistically significant improvement in one‐measure of quality of life in one trial favouring cyclophosphamide over placebo and clinically and statistically significant improvement in breathlessness in one trial favouring cyclophosphamide compared with placebo, with no significant impact on mortality.
Trialists reported no significant impact on lung function when cyclophosphamide was used compared with mycophenolate at 12 months (FVC % MD ‐0.82, 95% CI ‐3.95 to 2.31; P = 0.61; two trials, 149 participants; DLCO % MD ‐1.41, 95% CI ‐10.40 to 7.58; P = 0.76; two trials, 149 participants).
Risk of side effects was increased with cyclophosphamide versus mycophenolate, in particular, leukopenia and thrombocytopenia.
The data demonstrates no significant impact on health‐related quality of life, all‐cause mortality, dyspnoea, or cough severity in the cyclophosphamide group compared with the mycophenolate group. No trials reported outcomes associated with functional exercise tests.
We performed subgroup analysis to determine whether severity of lung function, connective tissue disease diagnosis, or radiological pattern had any impact on outcomes. One trial reported that cyclophosphamide protected against decreased FVC in individuals with worse fibrosis scores, and also showed that cyclophosphamide may be more effective in those with worse lung function. No association could be made between connective tissue disease diagnosis and outcomes.
Authors' conclusions
This review, which is based on studies of varying methodological quality, demonstrates that overall, in this population, small benefit may be derived from the use of cyclophosphamide in terms of mean difference in % FVC when compared with placebo, but not of the difference in % DLCO, or when compared with mycophenolate. Modest clinical improvement in dyspnoea may be noted with the use of cyclophosphamide. Clinical practice guidelines should advise clinicians to consider individual patient characteristics and to expect only modest benefit at best in preserving FVC. Clinicians should carefully monitor for adverse effects during treatment and in the years thereafter.
Further studies are required to examine the use of cyclophosphamide; they should be adequately powered to compare outcomes within different subgroups, specifically, stratified for extent of pulmonary infiltrates on high‐resolution computed tomography (HRCT) and skin involvement in SSc. Studies on other forms of connective tissue disease are needed. Researchers may consider comparing cyclophosphamide (a potent immunosuppressant) versus antifibrotic agents, or comparing both versus placebo, in particular, for those with evidence of rapidly progressive fibrotic disease, who may benefit the most.
PICOs
Plain language summary
Cyclophosphamide for interstitial lung disease associated with connective tissue disease
Background
People with connective tissue disease such as rheumatoid arthritis and systemic sclerosis may develop a group of lung diseases called interstitial lung disease. This can affect breathing and quality of life, and can lead to a reduced life span. A drug called cyclophosphamide has been useful in treating other illnesses, but it has side effects.
Review question
We wanted to know if cyclophosphamide helped preserve lung function in people with interstitial lung disease due to connective tissue disease. We also wanted to look at whether the drug causes side effects, and if it helps improve peoples' quality of life, length of life, breathing, and ability to exercise.
Study characteristics
We searched for studies up to May 2017, and we included four studies involving a total of 495 people with interstitial lung disease due to connective tissue disease. Some people were given cyclophosphamide, and others were given other drugs or a placebo. We compared these different groups to look for differences.
Key findings
We found some low‐quality evidence showing small benefit of using cyclophosphamide compared with placebo in terms of lung function and symptoms of breathlessness. No clear evidence shows that people who took cyclophosphamide had better lung function than people who took a different drug (mycophenolate mofetil). Some people experienced low blood counts, blood in their urine, and nausea.
Quality of the evidence
We rated the quality of the evidence using one of the following grades: very low, low, moderate, or high. A rating of very low‐quality evidence means that we are uncertain about the results. A rating of high‐quality evidence means that we are very certain about the results. For this Cochrane review, we found evidence of low quality. We included randomised controlled trials that were blinded, which means that participants and those people who assessed study results did not know whether participants had received cyclophosphamide or a placebo. However, the trials mostly included people with systemic sclerosis, so these results may not apply to all people with interstitial lung disease with connective tissue disease.
Authors' conclusions
Summary of findings
| Cyclophosphamide compared with placebo for connective tissue disease–associated interstitial lung disease | |||||
| Patient or population: people with connective tissue disease‐associated interstitial lung disease | |||||
| Outcomes | Anticipated absolute effects* (95% CI) | Relative effect | No. of participants | Quality of the evidence | |
| Risk with placebo | Risk difference with cyclophosphamide | ||||
| Change in lung function (FVC % predicted) 12‐month follow‐up | ‐ | MD in FVC was 2.83% higher | ‐ | 182 (2 RCTs) | ⊕⊕⊝⊝ |
| Change in lung function (diffusing capacity of the lung for carbon monoxide (DLCO) % predicted) 12‐month follow‐up | ‐ | MD in DLCO was 1.66% lower | ‐ | 182 (2 RCTs) | ⊕⊕⊝⊝ |
| Adverse events: pneumonia 12‐month follow‐up | 49 per 1000 | 32 more per 1000 | OR 1.70 | 203 (2 RCTs) | ⊕⊕⊝⊝ |
| Adverse events: haematuria 12‐month follow‐up | 88 per 1000 | 113 more per 1000 | OR 2.60 | 203 (2 RCTs) | ⊕⊕⊝⊝ |
| Health‐related quality of life (HAQ‐DI) 12‐month follow‐up | MD in HAQ‐DI was 0.27 lower (0.42 lower to 0.12 lower) | ‐ | 158 (1 RCT) | ⊕⊕⊕⊝ | |
| All‐cause mortality 12‐month follow‐up | 34 per 1000 | 2 fewer per 1000 | OR 0.94 | 179 (2 RCTs) | ⊕⊕⊝⊝ |
| *The risk in the intervention group (and its 95% confidence interval) is based on the assumed risk in the comparison group and the relative effect of the intervention (and its 95% CI). | |||||
| GRADE Working Group grades of evidence. | |||||
| aThe study population included well, stable participants, and results may not be directly applicable to the general patient population. bConfidence intervals are wide, and the population size is small. | |||||
| Cyclophosphamide compared with mycophenolate for connective tissue disease–associated interstitial lung disease | |||||
| Patient or population: people with connective tissue disease‐associated interstitial lung disease | |||||
| Outcomes | Anticipated absolute effects* (95% CI) | Relative effect | No. of participants | Quality of the evidence | |
| Risk with mycophenolate | Risk difference with cyclophosphamide | ||||
| Change in lung function (FVC % predicted) 12‐month follow‐up | ‐ | MD 0.82% lower (3.95 lower to 2.31 higher) | ‐ | 149 (2 RCTs) | ⊕⊕⊝⊝ |
| Change in lung function (diffusing capacity of the lung for carbon monoxide (DLCO) % predicted) 12‐month follow‐up | ‐ | MD 1.41% lower (10.4 lower to 7.58 higher) | ‐ | 145 (2 RCTs) | ⊕⊕⊝⊝ |
| Adverse events: leukopenia 12‐month follow‐up | 27 per 1000 | 135 more per 1000 | OR 6.86 | 300 (2 RCTs) | ⊕⊕⊝⊝ |
| Adverse events: pneumonia 12‐month follow‐up | 103 per 1000 | 1 more per 1000 | OR 1.01 | 300 (2 RCTs) | ⊕⊕⊝⊝ |
| Adverse events: anaemia 12‐month follow‐up | 55 per 1000 | 32 more per 1000 | OR 1.63 | 300 (2 RCTs) | ⊕⊕⊝⊝ |
| Adverse events: thrombocytopenia 12‐month follow‐up | 0 per 1000 | 30 more per 1000 (0 to 60 more) | RD 0.03 (0.00 to 0.06) | 300 (2 RCTs) | ⊕⊕⊝⊝ |
| Health‐related quality of life (HAQ‐DI) 12‐month follow‐up | ‐ | MD for HAQ‐DI was 0.05 lower (0.17 lower to 0.07 higher) | ‐ | 142 (1 RCT) | ⊕⊕⊝⊝ |
| All‐cause mortality 12‐month follow‐up | 88 per 1000 | 46 more per 1000 | OR 1.60 | 187 (2 RCTs) | ⊕⊕⊝⊝ |
| *The risk in the intervention group (and its 95% confidence interval) is based on the assumed risk in the comparison group and the relative effect of the intervention (and its 95% CI). | |||||
| GRADE Working Group grades of evidence. | |||||
| aThe study population included well, stable participants, and results may not be directly applicable to the general patient population. bConfidence intervals are wide, and the population size is small. cSubstantial statistical heterogeneity detected; I2 = 81%, but not downgraded as no heterogeneity when analysed as a ratio. | |||||
Background
Description of the condition
Connective tissue disease (CTD) can affect any component of the respiratory tract, causing a diverse range of disorders. When it is associated with interstitial lung disease (ILD), CTD is classified within the current American Thoracic Society (ATS)/European Respiratory Society (ERS) consensus statement as one of the forms of diffuse parenchymal lung disease of known cause (ATS/ERS Consensus Statement). Approximately 30% of individuals with ILD have associated CTD, which presents subsequent to the development of ILD in about 15% of these individuals (Mittoo 2009).
Various approaches have been used to define connective tissue disease–associated interstitial lung disease (CTD‐ILD). The most rigorous approach includes only people with features that clearly meet published diagnostic criteria for systemic autoimmune disease. However, many people with ILD display one or more features of CTD clinically or serologically, without meeting diagnostic criteria. Amongst the definitions that have so far been applied to this cohort, significant heterogeneity in disease behaviour has been displayed, suggesting that further refinement is required to distinguish persons in this group with CTD‐ILD from those with idiopathic interstitial pneumonia (Corte 2012).
The connective tissue disorders most commonly associated with ILD include scleroderma/systemic sclerosis (SSc), rheumatoid arthritis, polymyositis/dermatomyositis, and Sjögren's syndrome. Each may be associated with progressive and fatal disease, but survival data in general are better than those reported for idiopathic forms of ILD (Fischer 2008; Park 2007). As an example, five‐year survival for people with systemic sclerosis–related ILD has been reported to be approximately 85%, as opposed to 50% for idiopathic disease (Wells 1994). It remains to be elucidated what features are the principal determinants of progression among people with CTD‐ILD. Histologically, non‐specific interstitial pneumonia, usual interstitial pneumonia (UIP), organising pneumonia, and lymphocytic interstitial pneumonia all may occur. Although for idiopathic interstitial pneumonia, UIP carries a significantly worse prognosis than other histological forms, with the exception of rheumatoid arthritis, a histological impact on prognosis is not seen in CTD‐ILD (Bongartz 2010; Bouros 2002; Kim 2010).
Despite resulting in better survival than its idiopathic counterparts, ILD is the major cause of death amongst individuals with systemic sclerosis (Ferri 2002). When present, ILD contributes to reduced physical function and quality of life (Baron 2008). Correlation has been demonstrated between extent of ILD and degree of disability, and this correlation serves as a predictor of disease behaviour. Radiological and physiological extent of ILD in cohorts with diagnoses of CTD and systemic sclerosis has been demonstrated to adversely affect prognosis (Goh 2008; Park 2007). Presence of greater than 20% disease extent on high‐resolution computed tomography (HRCT) and baseline forced vital capacity (FVC) < 70% have been demonstrated to predict mortality (Goh 2008). A greater rate of decline in physiological values such as FVC is a predictor of mortality in people with systemic sclerosis (Assassi 2010). A rate of decline > 10% in FVC or a 5% to 9% decline with a > 15% decline in diffusing capacity of the lung for carbon monoxide (DLCO) is predictive of mortality (Goh 2017).
Description of the intervention
Cyclophosphamide is a highly potent immunosuppressant that has demonstrated efficacy in inducing and maintaining remission in a range of autoimmune and inflammatory illnesses (Gourley 1996; Hoffman 1992). Its immunosuppressant activity may occur in a number of ways. Through its action as an alkylating agent, cyclophosphamide causes cross‐linkage of a variety of macromolecules, including DNA, producing cell death amongst resting and dividing lymphocytes. Additionally, it produces impaired humoral and cellular immune responses (Hall 1992).
Cyclophosphamide is associated with a range of significant toxicities that make its usage problematic, limiting its prescription to a specialist setting. Most patients experience nausea and hair thinning. Haemorrhagic cystitis and bladder cancer are produced by exposure of the bladder to acrolein, a metabolite of cyclophosphamide. The risk of each is related to total cumulative dose, with a total dosage greater than 100 grams most strongly associated with bladder cancer. To reduce total dosage, duration of cyclophosphamide usage is often limited to periods shorter than 12 months.
Cyclophosphamide causes bone marrow suppression with associated risks of bacterial and opportunistic infections, as well as reactivation of dormant infections such as tuberculosis. It is associated with gonadal toxicity with the potential to cause premature ovarian failure and oligospermia or azoospermia. It is teratogenic and should be avoided throughout pregnancy. Cyclophosphamide has been shown to increase risks of haematological malignancy, skin cancer, and solid organ malignancy.
Cyclophosphamide is administered in daily oral and intermittent intravenous protocols; intravenous regimens are preferred because they allow a reduction by up to two‐thirds of total cumulative dose, thereby reducing risks of malignancy and bladder toxicity (Boumpas 1992). The standard oral dosage for patients with normal renal function is 2 mg/kg/d, and intravenous doses range between 500 and 1000 mg/m2 body surface area administered every four to six weeks. Therapy generally is provided for at least six months and is followed by treatment with a less toxic alternative immunosuppressant.
How the intervention might work
On radiological grounds, fibrotic lung disease associated with CTD is similar to that seen in idiopathic interstitial pneumonia (Hwang 2009). Similar pathways have been suggested in their causation, with elevated levels of a range of similar pro‐inflammatory and pro‐fibrotic cytokines such as transforming growth factor (TGF)‐beta signalling pathways, along with growth factors and chemokines, involved in connective tissue deposition (Mathai 2010; Murray 2011; Peng 2011).
Despite these similarities, recent research has highlighted genetic differences in the MUC5‐B (mucin 5B, oligomeric mucus/gel‐forming gene) promoter region between idiopathic pulmonary fibrosis (IPF) and systemic sclerosis‐related ILD (Stock 2013). Histological differences are apparent, with CTD‐ILD demonstrating an increase in germinal centre density and inflammation and reduced numbers of fibroblastic foci (Song 2009). These differences suggest an alternative "inflammatory" pathogenesis that is likely crucial in providing any basis for improved natural history and responsiveness to immunosuppressant therapy amongst those with CTD‐ILD. Various immunosuppressant approaches have been used to treat people with IPF, and each has demonstrated a disappointing lack of efficacy (Raghu 2012). Only limited data can be found for most of the immunosuppressant therapies used in CTD‐ILD, but supportive case series data are available for several of them, including prednisolone, methotrexate, azathioprine, cyclosporine, and mycophenolate mofetil (Fischer 2013). Cyclophosphamide has significantly greater literature exploring its use, including several placebo‐controlled trials in CTD‐ILD (Hoyles 2006; Tashkin 2006).
Why it is important to do this review
Decision‐making in the treatment of people with CTD‐ILD is difficult, and the clinician must balance a high level of need for therapy in a severely unwell patient population against the potential for adverse effects from highly toxic therapy, for which only relatively limited data on efficacy can be found. Research in this field has been limited, with publications frequently representing case reports or case series. It is not clear whether evidence of efficacy in one CTD subtype can be extrapolated to all forms. Similarly, it is not clear whether histological subtype, disease duration, or disease extent can be used to predict responsiveness. Although these issues cannot currently be addressed in the absence of sufficient clinical studies, improved understanding of the strength of the treatment effect of cyclophosphamide in CTD‐ILD, as well as the extent to which adverse effects can be expected, would be of great assistance in clinical decision‐making.
Objectives
To assess the efficacy and adverse effects of cyclophosphamide in the treatment of individuals with CTD‐ILD.
Methods
Criteria for considering studies for this review
Types of studies
We included randomised controlled parallel‐group trials.
Types of participants
We included all adults (18 to 80 years of age) with a diagnosis of CTD‐ILD. We included only individuals with definitive connective tissue disease as defined by accepted diagnostic criteria at the time studies were identified. We included the connective tissue diseases commonly associated with interstitial lung disease: systemic sclerosis, rheumatoid arthritis, polymyositis/dermatomyositis, Sjögren's syndrome, systemic lupus erythematosus (SLE), and mixed connective tissue disorders.
Types of interventions
We included comparisons of cyclophosphamide, intravenous or oral, used individually or concomitantly with other immunomodulating or immunosuppressant therapies for periods of at least six months and for follow‐up periods of at least 12 months. Comparator groups provided non–cyclophosphamide‐containing therapies.
Types of outcome measures
Primary outcomes
-
Change in lung function (forced vital capacity (FVC) % predicted and diffusing capacity of the lung for carbon monoxide (DLCO) % predicted)
-
Adverse events
-
Health‐related quality of life, as measured by validated questionnaires
Secondary outcomes
-
Survival and mortality (all‐cause)
-
Dyspnoea
-
Cough
-
Functional exercise tolerance (e.g. six‐minute walk test)
Search methods for identification of studies
Electronic searches
We identified trials by conducting searches of the following databases up to May 2017.
-
Cochrane Airways Register of Trials (all years to 2 May 2017).
-
Cochrane Central Register of Controlled Trials (CENTRAL), in the Cochrane Library (May 2017).
-
MEDLINE (Ovid) (1946 to 2 May 2017).
-
Embase (Ovid) (1974 to 2 May 2017).
-
ClinicalTrials.gov and World Health Organization (WHO) trials portal to 2 May 2017.
We searched for grey literature through the Airways Register of Trials and the CENTRAL database. We have detailed our database search strategies in Appendix 1. We applied no restrictions on language of publication. When data were missing, we contacted trial investigators.
Searching other resources
We checked reference lists of all primary studies and review articles for additional references.
Data collection and analysis
Selection of studies
Two review authors (ING and HB) independently screened all abstracts to determine if they met the inclusion criteria. We sought full‐text publications of articles that potentially or definitely met review criteria. Two review authors (ING and HB) then reviewed these full‐text articles to determine eligibility. We resolved disagreements by discussion and consensus. We included in the review a Preferred Reporting Items for Systematic Reviews and Meta‐Analyses (PRISMA) study flow diagram to document the screening process, as recommended in the Cochrane Handbook for Systematic Reviews of Interventions (Higgins 2011).
Data extraction and management
Two review authors (ING and HB) independently extracted data from the included studies. When appropriate, we imported data and pooled them in the Cochrane statistical software, Review Manager 5 (RevMan) for further analysis.
We documented study characteristics and outcome data by using a data collection form that we had piloted on one study included in the review.
We extracted the following data.
-
Methods: study design, duration of the study, study setting, and date of study.
-
Participants: number, mean age and age range, gender, and inclusion and exclusion criteria.
-
Intervention: intervention, dose, mode of administration, concomitant medications, and exclusions.
-
Outcomes: primary and secondary outcomes as specified, type of scale used, and time points collected.
-
Notes: funding for trials and any conflicts of interest for trial authors.
-
'Risk of bias' summary.
We extracted mean and standard deviation (SD) values from each study. When included studies reported standard error or confidence intervals (CIs), we converted these to SD values according to recommendations provided in the Cochrane Handbook for Systematic Reviews of Interventions (Higgins 2011).
Assessment of risk of bias in included studies
Two independent review authors (ING and HB) assessed the included studies for risk of bias using the Cochrane 'Risk of bias' assessment tool (Higgins 2011). We assessed risk of bias according to the following domains.
-
Random sequence generation.
-
Allocation concealment.
-
Blinding of participants and personnel.
-
Blinding of outcome assessment.
-
Incomplete outcome data.
-
Selective outcome reporting.
-
Other bias.
We scored each of these domains separately as introducing low risk of bias, unclear risk of bias (insufficient information to make a judgement), or high risk of bias.
Measures of treatment effect
Continuous data
When possible, we pooled data from all studies. We presented results from continuous variables, such as FVC, using a random‐effects model, and calculated mean differences (MDs) with corresponding 95% CIs.
Dichotomous data
We presented dichotomous data, including adverse events, as Peto odds ratios (ORs) or risk differences (RDs) (to account for zero cells in analyses) when we could pool the data. When we were unable to pool data, we included these results in a descriptive analysis.
Unit of analysis issues
We analysed treatment effect measured 12 months post initiation of therapy and at other shared time points, depending on available data.
Dealing with missing data
We utilised data as presented in published articles and in their supplementary appendices, and we contacted trial investigators to request further data.
Assessment of heterogeneity
We used the I² statistic to measure heterogeneity among the trials in each analysis. When we identified substantial heterogeneity (i.e. I² statistic > 50%), we explored between‐trial differences by performing subgroup analyses and removing potentially substantially different studies.
Assessment of reporting biases
We planned to perform funnel plot analysis to assess for reporting bias; however, given that only four studies were available, this was not possible.
Data synthesis
We performed a pooled quantitative analysis when possible. We synthesised a summary of findings table for change in FVC % predicted and DLCO % predicted, adverse events, and health‐related quality of life using the methods and recommendations described in the Cochrane Handbook for Systematic Reviews of Interventions, along with GRADEpro software (GradePro GDT 2015).
Subgroup analysis and investigation of heterogeneity
We had planned to analyse data according to the following subgroups.
-
FVC < 70% predicted.
-
Analysis by connective tissue disease diagnosis: systemic sclerosis, rheumatoid arthritis, polymyositis/dermatomyositis.
-
Analysis by radiological pattern: usual interstitial pneumonia (UIP), non‐UIP.
-
CTD symptom onset date within two years.
We planned to use the following parameters.
-
Change in lung function (FVC and DLCO).
-
Adverse events.
-
Health‐related quality of life.
However, data were insufficient for review authors to perform such meta‐analyses.
Sensitivity analysis
We planned to perform sensitivity analyses by excluding studies that did not use an intention‐to‐treat analysis or that had high risk of bias. However, given only two studies per comparison group, we found that data were insufficient for this approach.
Results
Description of studies
This review is based on a previously published protocol (Glaspole 2014).
Results of the search
We identified 1149 citations in the initial search, and after screening abstracts, we selected 39 studies for full‐text review. We included four trials with 495 participants in the final meta‐analysis; this included 26 separate citations, including protocols, early abstracts, and further analyses of other secondary outcomes (see Figure 1). We also noted two ongoing studies (see Characteristics of ongoing studies).

Study flow diagram.
Included studies
We included four trials with 495 participants in the final meta‐analysis (see Characteristics of included studies). All four included studies were randomised, parallel trials involving adults with a diagnosis of connective tissue disease according to accepted criteria, and with evidence of interstitial lung disease according to high‐resolution computed tomography (HRCT), lung biopsy, or evidence of active alveolitis on bronchoalveolar lavage. Three studies included only participants with systemic sclerosis (Hoyles 2006; Tashkin 2006; Tashkin 2016), and one study included participants with systemic sclerosis, dermatomyositis/polymyositis, systemic lupus erythematosus (SLE), and rheumatoid arthritis (RA) (Zhang 2015); however, we did not analyse these subgroups separately. Two studies included only participants with impaired lung function (FVC 45% to 85%), and two studies included participants with any lung function (Hoyles 2006; Zhang 2015). Zhang 2015 further analysed outcomes according to forced expiratory volume in one second (FEV1) > 75% and ≤ 75% in subgroup analyses.
Intervention protocols varied across trials. Tashkin 2006 compared oral cyclophosphamide daily (dosed by weight according to standard protocols) versus placebo for 12 months. Tashkin 2016 compared daily oral cyclophosphamide (dosed by weight), followed by oral placebo, for 12 months, versus oral mycophenolate (500 mg twice daily up‐titrated to 1.5 mg twice daily) for 24 months. Hoyles 2006 compared prednisolone (20 mg alternate daily) plus six cycles of IV cyclophosphamide four‐weekly, then oral azathioprine for 12 months, versus placebo, for 12 months. Zhang 2015 compared intravenous (IV) cyclophosphamide for 12 months versus oral mycophenolate (1.5 g daily) for 12 months; in addition, all participants in intervention and control groups received prednisolone, with the starting dose titrated according to disease severity (as deemed by trial doctors) and all participants weaned to 10 mg daily within four weeks.
All four trials included the primary outcome of change in lung function (FVC % predicted and DLCO % predicted). One study reported both change from baseline and post‐treatment change at 12 months (Tashkin 2006), another study reported this as change from baseline at 12 months (Tashkin 2016), and two studies reported post‐treatment change at 12 months (Hoyles 2006; Zhang 2015).
All four studies reported adverse events.
Tashkin 2006 and Tashkin 2016) reported health‐related quality of life outcomes using the Health Assessment Questionnaire (HAQ‐DI: a disease‐specific musculoskeletal targeted measure designed to test functional ability, where 0 = no disability and 3 = severe disability, with mean clinically important difference (MCID) for systemic sclerosis = 0.10 to 0.14 (Khanna 2006)), and Tashkin 2006 used Short Form (SF)‐36 (a generic measure of health‐related quality of life with both physical and mental components; higher score indicates less disability; MCID = 2.5 to 5.0 with different types of arthritis (Khanna 2009)).
In terms of secondary outcomes, all four studies reported mortality at 12 months. Three trials reported dyspnoea; Hoyles 2006 used a modified American Thoracic Society (ATS) respiratory questionnaire (0 = breathlessness after 30 minutes of vigorous activity, 20 = breathlessness after minimal activity; MCID not available); Tashkin 2006 and Tashkin 2016 used Mahlers Dyspnoea Index, renamed the Transition Dyspnoea Index (12‐point scale from ‐9 to +9; lower score indicates worse dyspnoea; MCID = 1.5 (Khanna 2009)).
Two trials reported cough using the modified cough index (0 to 3, with 3 = most severe) (Tashkin 2006; Tashkin 2016).
No studies reported functional exercise tolerance.
Excluded studies
We excluded 15 studies for the following reasons: retrospective analyses of data from studies already included (8); wrong participant population (2); only a protocol of an included study (2); not a randomised trial (1); and ongoing studies (2) (see Characteristics of excluded studies).
Risk of bias in included studies
We assessed risk of bias in the included studies using the Cochrane 'Risk of bias' assessment tool (Higgins 2011), including the domains of allocation, blinding, incomplete outcome data, selective reporting, and other bias. Please see Figure 2 and Figure 3 for a summary of 'Risk of bias' findings.

Risk of bias summary: review authors' judgements about each risk of bias item for each included study.

Risk of bias graph: review authors' judgements about each risk of bias item presented as percentages across all included studies.
Allocation
We assessed random sequence generation as low risk for four studies. We assessed allocation concealment as low risk for three studies ‐ Hoyles 2006; Tashkin 2006; and Tashkin 2016 ‐ and as unclear risk for one study ‐ Zhang 2015 ‐ as trial authors did not report allocation concealment.
Blinding
We assessed blinding of participants as low risk in three studies ‐ Hoyles 2006; Tashkin 2006; and Tashkin 2016 ‐ and as high risk for one study ‐ Zhang 2015 ‐ as one intervention was intravenous and control was oral, and trial authors did not mention blinding, so it was likely participants knew what intervention they were receiving. When IV and oral preparations were used in Hoyles 2006, researchers specifically used a placebo IV and oral formulation to reduce risk of bias. We assessed blinding of outcome assessors as low risk in Tashkin 2006 and as unclear risk in Hoyles 2006, Tashkin 2016, and Zhang 2015, as trial authors did not provide a clear statement.
Incomplete outcome data
We assessed attrition bias as low risk in all four studies. Tashkin 2006 and Tashkin 2016 reported more withdrawals in the intervention group than in the control group, and this may have introduced bias or affected the 'real‐world' tolerability of the intervention. In Tashkin 2006, a total of 20 of 79 participants in the cyclophosphamide group and 13 of 79 participants in the placebo group withdrew within 12 months after randomisation, most because of adverse events or serious adverse events. In Tashkin 2016, a total of 15 of 73 participants in the cyclophosphamide group and 7 of 69 participants in the mycophenolate group withdrew within 12 months after randomisation owing to serious adverse events. However in Tashkin 2006, investigators fitted a generalised estimating equation regression model for participants who withdrew prematurely, and imputed data missing at 12 months for the primary outcome; analysis included 73 participants in the treatment group and 72 in the control group. Tashkin 2016 performed a modified intention‐to‐treat analysis by using an inferential joint model consisting of a mixed‐effects model for longitudinal outcomes and a survival model to handle non‐ignorable missing data due to study dropout, treatment failure, or death (i.e. likely related to disease or treatment, and therefore not random). Hoyles 2006 and Zhang 2015 completely reported outcomes and a low withdrawal rate showing similar numbers distributed across intervention and control groups.
Selective reporting
We assessed selective reporting bias as low risk in Tashkin 2006 and Zhang 2015, as trial authors reported all prespecified outcomes. We assessed reporting bias as high risk in Hoyles 2006 and Tashkin 2016, as some prespecified quality of life outcomes reported as measured were not reported in the final manuscript (Tashkin 2016), and as some outcomes were recorded at more regular intervals than were reported (Hoyles 2006).
Effects of interventions
See: Summary of findings for the main comparison Cyclophosphamide compared with placebo for connective tissue disease–associated interstitial lung disease; Summary of findings 2 Cyclophosphamide compared with mycophenolate for connective tissue disease–associated interstitial lung disease
Cyclophosphamide versus placebo
Primary outcomes
Change in lung function
Two trials reported change in lung function when comparing cyclophosphamide versus placebo at 12 months (Hoyles 2006; Tashkin 2006). Tashkin 2006 reported percent change from baseline and mean post‐treatment values and performed a prespecified Huber covariance analysis to assess treatment effects, which was adjusted for baseline values of FVC, as the data were not normally distributed and included extreme values. Hoyles 2006 reported mean post‐treatment values and the mean treatment effect in FVC, using a covariance analysis adjusted for baseline values of FVC and treatment centre. Treatment effects were combined via the generic inverse method in Review Manager 5.
The mean difference in post‐treatment FVC % predicted between cyclophosphamide and placebo was 2.83 (95% CI 0.80 to 4.87; P = 0.006; two studies, 182 participants; see Figure 4), favouring cyclophosphamide. Studies showed no significant heterogeneity (I² = 0; P = 0.54). The mean difference in post‐treatment DLCO % predicted was ‐1.68 (95% CI ‐4.37 to 1.02; P = 0.22; two studies, 182 participants; see Figure 5). We noted no significant heterogeneity between studies (I² = 0%; P = 0.88).

Forest plot of comparison: 1 Cyclophosphamide versus placebo, outcome: 1.1 FVC % predicted.

Forest plot of comparison: 1 Cyclophosphamide versus placebo, outcome: 1.2 DLCO % predicted.
Tashkin 2006 also reported outcomes at 24 months by performing a non‐parametric analysis using a modified Wilcoxon score test, in which FVC at 12 months and time to death were combined as a composite endpoint, and an extension of the covariance analysis in which the baseline score for fibrosis was accounted for. In this model, the adjusted mean absolute difference in FVC at 12 months between the two groups was 2.97% greater (95% CI 0.75 to 5.19), favouring cyclophosphamide (P = 0.009).
Adverse events
Two studies reported adverse events upon comparing cyclophosphamide with placebo at 12 months (Hoyles 2006; Tashkin 2006).
Risk of haematuria was significantly increased in the cyclophosphamide group compared with the placebo group at 12 months (Peto OR 2.60, 95% CI 1.12 to 6.03; P = 0.03; two studies, 195 participants) in the pooled meta‐analysis. Data show no significant difference in the risk of pneumonia (Peto OR 1.70, 95% CI 0.55 to 5.32; P = 0.27; two studies, 195 participants), but confidence intervals were wide.
Hoyles 2006 reported further adverse events at 12 months. Nausea was 11 times more likely in the cyclophosphamide group than in the placebo group (Peto OR 11.39, 95% CI 2.51 to 51.63; P = 0.002; 45 participants). Data show no significant differences in liver function disturbance (Peto OR 8.11, 95% CI 0.49 to 133.96; P = 0.14; 45 participants), but the effect estimate was highly imprecise.
Tashkin 2006 reported further adverse events. Leukopenia at 12 months was 10 times more likely in the cyclophosphamide group than in the placebo group (Peto OR 9.57, 95% CI 3.68 to 24.90; P < 0.00001; 158 participants). Data show no further events at 24 months. Neutropenia was eight times more likely at 12 months in the cyclophosphamide group than in the placebo group (Peto OR 8.00, 95% CI 1.77 to 36.24; P = 0.007; 158 participants). Trial authors reported no further events of neutropenia at 24 months.
Data show no significant differences in haematuria at 24 months (Peto OR 2.08, 95% CI 0.72 to 6.00; P = 0.18; 158 participants), nor in anaemia at 12 months (Peto OR 7.48, 95% CI 0.46 to 120.72; P = 0.16; 158 participants) or at 24 months (Peto OR 3.43, 95% CI 0.58 to 20.23; P = 0.17; 158 participants). However, events were rare, and results are uncertain.
In Tashkin 2006, 20 of 79 participants in the cyclophosphamide group and 13 of 79 participants in the placebo group withdrew within 12 months after randomisation, most because of adverse events or serious adverse events.
In Hoyles 2006, 2 of 22 participants in the cyclophosphamide group and 0 of 23 participants in the placebo group withdrew within 12 months after randomisation owing to adverse events.
Health‐related quality of life
Only one study with 158 participants reported health‐related quality of life when comparing cyclophosphamide versus placebo using the health assessment questionnaire (Tashkin 2006): Researchers used the disability index (HAQ‐DI), whereby lower score indicates less disability. The mean difference in change from baseline scores was clinically and statistically significant, with a mean difference of ‐0.27 favouring the cyclophosphamide group (95% CI ‐0.42 to ‐0.12; P < 0.0006; one trial, 158 participants). However, at baseline, data show a significantly lower score in the placebo group (indicating better health) than in the cyclophosphamide group.
Tashkin 2006 also reported change from baseline in the Short Form health survey (SF‐36; the lower the score, the greater the disability). Data show no significant differences in the change from baseline in the physical component of the SF‐36 between cyclophosphamide and placebo groups (MD 2.60, 95% CI ‐0.46 to 5.66; P = 0.10; 158 participants) and no significant differences in the mental component of the SF‐36 between cyclophosphamide and placebo groups (MD 2.09, 95% CI ‐2.07 to 6.25; P = 0.32; 158 participants).
Secondary outcomes
All‐cause mortality
Researchers reported no significant difference in all‐cause mortality between cyclophosphamide and placebo groups (Peto OR 0.94, 95% CI 0.19 to 4.77; P = 0.94; two trials, 179 participants), although the confidence interval does not rule out possible harm or benefit from the intervention.
Furst 2010 followed up the Sclerorderma Lung Study (SLS) I cohort for five years with respect to overall mortality and was able to follow‐up with 138 of 158 (87%) participants. Trial authors reported no significant differences between cyclophosphamide and placebo groups; 24 of 66 (36.4%) participants treated with cyclophosphamide had died compared with 22 of 72 placebo‐treated participants (30.6%; P = 0.46). This study did not report specific causes of death and adverse events (Furst 2010).
Dyspnoea
Tashkin 2006 reported dyspnoea outcomes, initially using the Mahler Dyspnoea Index, then using the Transitional Dyspnoea Index (TDI) (the lower the score, the worse the dyspnoea). Data show a significant difference in post‐treatment values favouring cyclophosphamide (MD 2.90, 95% CI 2.79 to 3.01; P < 0.00001; one study, 158 participants).
Cough
Tashkin 2006 reported cough as a percentage of participants affected. The percentage of participants with cough decreased in the cyclophosphamide group, from 71% at baseline to 56% at 12 months, but the percentage of participants in the placebo group with cough remained the same (68%) at both baseline and 12 months. This effect was lost at 24 months, correlating with loss of effect on FVC.
Functional exercise tests
No studies reported any outcome associated with functional exercise tests.
Cyclophosphamide versus mycophenolate
Primary outcomes
Change in lung function
Two trials reported change in lung function upon comparing cyclophosphamide versus mycophenolate (Tashkin 2016; Zhang 2015). Tashkin 2016 treated participants with cyclophosphamide for 12 months and with mycophenolate for 24 months, and Zhang 2015 treated participants with both cyclophosphamide and mycophenolate for 12 months. We reported change in lung function at both 12‐month follow‐up and end of study follow‐up. Tashkin 2016 reported adjusted outcomes using an inferential joint model consisting of a mixed‐effects model for longitudinal outcomes and a survival model to handle non‐ignorable missing data (due to study dropout, treatment failure, or death). Zhang 2015 reported post‐treatment outcomes but did not report baseline characteristics, so it was not clear whether they were similar across both groups. We combined treatment effects using the generic inverse method in Review Manager 5.
Data show no significant differences in FVC % predicted at 12 months (MD ‐0.82, 95% CI ‐3.95 to 2.31; P = 0.61; two trials, 149 participants; see Figure 6), or at end of study (MD ‐0.68, 95% CI ‐5.44 to 4.08; P = 0.78; two trials, 149 participants; see Figure 6). Data show no significant heterogeneity between trials (I² = 16%; P = 0.28 at 12 months; I² = 39%; P = 0.20, at end of study).

Forest plot of comparison: 2 Cyclophosphamide versus mycophenolate, outcome: 2.2 FVC % predicted at end of study.
Data show no significant differences in DLCO % predicted at 12 months (MD ‐1.41, 95% CI ‐10.40 to 7.58; P = 0.76; two trials, 149 participants), or at end of study (MD 2.04, 95% CI ‐1.11 to 5.19; P = 0.20; see Figure 7). We noted significant heterogeneity between trials at 12 months (I² = 76%; P = 0.006), whereby Tashkin 2016 reported a better effect with mycophenolate than with cyclophosphamide, but by 24 months, the effect favoured cyclophosphamide (I² = 0%; P = 0.60).

Forest plot of comparison: 2 Cyclophosphamide versus mycophenolate, outcome: 2.4 DLCO % predicted at end of study.
Adverse events
Two trials reported adverse events upon comparing cyclophosphamide versus mycophenolate at 12 months (Tashkin 2016; Zhang 2015).
Data show significantly more cases of leukopenia (Peto OR 6.86, 95% CI 3.23 to 14.58; P < 0.00001; two trials, 300 participants) and more cases of thrombocytopenia (RD 0.03, 95% CI ‐0.00 to 0.06; P = 0.10; two trials, 300 participants; I² = 81%) in the cyclophosphamide group than in the mycophenolate group in the pooled meta‐analysis. However, the confidence interval for thrombocytopaenia includes no difference, and we detected substantial statistical heterogeneity when analysing the outcome as a risk difference rather than as a ratio. Investigators reported no significant difference for risk of pneumonia (Peto OR 1.01, 95% CI 0.48 to 2.14; p = 0.97; two trials, 300 participants) or anaemia (Peto OR 1.63, 95% CI 0.65 to 4.11; two trials, p = 0.30; 300 participants) in the pooled meta‐analysis. Data show no significant difference in haematuria at 12 months (Peto OR 1.27, 95% CI 0.28 to 5.78; p = 0.76; one trial, 142 participants). However, as in other analyses, effect estimates for pneumonia, anaemia, and haematuria are imprecise.
Health‐related quality of life
Tashkin 2016 reported health‐related quality of life upon comparing cyclophosphamide versus mycophenolate using the health assessment questionnaire disability index (HAQ‐DI), whereby lower scores indicate less disability. Data show no significant difference in the change from baseline at 12 months between cyclophosphamide and mycophenolate (MD ‐0.05, 95% CI ‐0.17 to 0.07; P = 0.41; one trial, 142 participants).
Secondary outcomes
All‐cause mortality
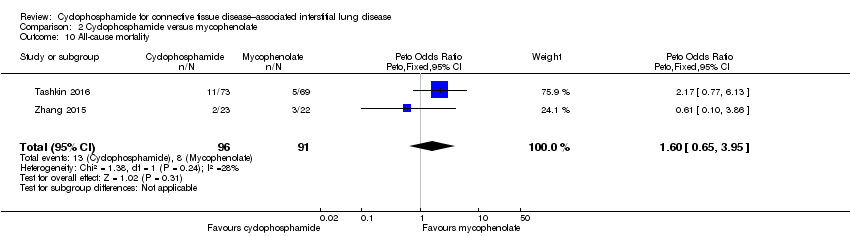
Data show no significant differences in all‐cause mortality at 12 months between cyclophosphamide and mycophenolate (Peto OR 1.60, 95% CI 0.65 to 3.95; P = 0.31; two trials, 187 participants), but results are imprecise.
Dyspnoea
Tashkin 2016 reported Transition Dyspnoea Index change from baseline to 24 months (the lower the score, the worse the dyspnoea). Data show no significant differences between the cyclophosphamide group and the mycophenolate group (MD 0.39, 95% CI ‐0.68 to 1.46; P = 0.48; one trial, 142 participants).
Cough
Tashkin 2016 and Tashkin 2017 reported change in cough severity score from 6 to 18 months (the higher the score, the better the quality of life). They noted no significant differences between the cyclophosphamide group and the mycophenolate group (MD ‐0.17, 95% CI ‐0.39 to 0.05; P = 0.13; one trial, 142 participants).
Functional exercise tests
No studies reported any outcome associated with functional exercise tests.
Subgroup analysis
Severity of lung function (FVC < 70% predicted)
It was not possible to pool data to perform subgroup analysis based on severity of lung function owing to heterogeneity between trials.
Tashkin 2006 performed post hoc subgroup analysis using the joint longitudinal model, and noted that more severe restriction at baseline (FVC < 70% predicted) was associated with a greater difference in % FVC predicted at 12 months between cyclophosphamide and placebo (4.62% higher FVC % predicted in the cyclophosphamide group; P = 0.007) than was observed when the entire cohort was included in the analysis; and the cyclophosphamide treatment effect was even greater at 18 months (6.8% higher FVC % predicted; P = 0.006).
Zhang 2015 performed subgroup analysis for people who had FEV1 and FVC less than 75% predicted and found no significant differences between groups.
Hoyles 2006 did not perform subgroup analysis based on lung function.
Analysis by connective tissue disease diagnosis
Three studies recruited only participants with systemic sclerosis (Hoyles 2006; Tashkin 2006; Tashkin 2016). Zhang 2015 included participants with other connective tissue diseases but did not perform subgroup analysis. We contacted trial authors to request individual data; however, these data were not available at the time of review publication.
Analysis by radiological pattern
Tashkin 2006 performed baseline and post‐treatment fibrosis analysis using a Likert scale (0 = absent, 1 = 1% to 25%, 2 = 26% to 50%, 3 = 51% to 75%, and 4 = 76% to 100%) for extent of four categories of parenchymal abnormality, as indicated by:
-
pure ground glass opacity (pure GGO: hazy parenchymal opacity in the absence of reticular opacity or architectural distortion);
-
lung fibrosis (reticular opacification, traction bronchiectasis, and bronchiolectasis);
-
honeycombing (clustered air‐filled cysts with dense walls); and
-
emphysema (lucencies or cysts without walls).
Researchers performed scoring in each of three lung zones.
-
Upper (lung apex to aortic arch).
-
Middle (aortic arch to inferior pulmonary veins).
-
Lower (inferior pulmonary veins to diaphragm).
Regression analysis was performed to evaluate the effect of the baseline fibrosis score on FVC at 12 months. The regression slope in the placebo group was significantly negative (‐2.01% of predicted FVC per unit score of fibrosis; P = 0.006), indicating a greater decline in FVC over 12 months for those with a worse baseline fibrosis score. In the cyclophosphamide group, data show no relationship between fibrosis score and FVC progression. The difference between regression slopes in the two groups was significant (P < 0.009), suggesting that cyclophosphamide protected against the decrease in FVC seen in patients with more severe fibrosis.
No other study analysed changes in outcomes by radiological pattern subgroups.
Analysis by time of onset of CTD
Tashkin 2006 using SLS I data divided participants into three groups, depending on their duration of SSc (0 to 2 years, 2 to 4 years, > 4 years). Researchers used a mixed‐effects model to analyse the rate of decline in FVC% predicted over one year. Data show no significant differences in terms of the change in FVC between cyclophosphamide and placebo groups based on duration of SSc (P = 0.85) (Khanna 2011).
Sensitivity analysis
Data were insufficient for review authors to perform sensitivity analyses.
Discussion
Summary of main results
This Cochrane review has found that a small benefit may be derived from use of cyclophosphamide in people with connective tissue disease‐associated interstitial lung disease (CTD‐ILD) in mean difference in % forced vital capacity (FVC) when compared with placebo, but not in the difference in % diffusing capacity of the lung for carbon monoxide (DLCO) or mortality. Researchers have found no significant impact on lung function or mortality when compared with mycophenolate.
One trial reported a clinically and statistically significant improvement in breathlessness favouring cyclophosphamide compared with placebo (Tashkin 2006). Another trial found a statistically significant improvement in one measure of quality of life favouring cyclophosphamide compared with placebo (Tashkin 2006). Data show increased risk of side effects in the cyclophosphamide treatment groups, in particular, leukopenia, neutropenia, thrombocytopenia, and anaemia, leading to a higher rate of withdrawal from cyclophosphamide treatment.
This review, based on studies of varying methodological quality, demonstrates that overall, in the population studied, cyclophosphamide may provide a small benefit in terms of mean difference in % FVC when compared with placebo, but not in terms of the difference in % DLCO, or when compared with mycophenolate. Clinical improvement in dyspnoea may be seen with the use of cyclophosphamide.
Overall completeness and applicability of evidence
The conclusions drawn from this review are limited by the small number of trials, the small number of participants involved, and the imprecision of many effect estimates. Further high‐quality trials comparing cyclophosphamide versus placebo and other therapies are required.
In clinical practice, the decision to commence immunosuppression depends on factors that suggest risk of increased mortality, including the severity of disease at presentation and the presence of disease progression. Severity of CTD‐ILD can be derived by the degree of reduction in FVC and the extent of fibrosis evident on high‐resolution computed tomography (HRCT) (Goh 2017). Although two of the included studies included participants with moderately severe impairment in baseline FVC of 65% to 68% (Tashkin 2006; Tashkin 2016), the other two studies included participants with % FVC baseline of 80% (or not specified) (Hoyles 2006; Zhang 2015) ‐ above the threshold associated with increased mortality risk. Risk of mortality in CTD‐ILD is also increased by a recent decline in lung function over time (Goh 2017; Wells 2014). Although this is difficult to depict within the limitations of a clinical trial, the addition or augmentation of immunosuppression could be taken as evidence of recent disease progression. Each of the analysed studies excluded patients with a recent course of high‐dose immunosuppression, and it is probable that they included relatively stable or mildly impaired participants, as stated by Hoyles 2006. This also potentially blunts signals for efficacy, making it difficult to determine the applicability of our findings to a more progressive group, for whom immunosuppression is most likely to be considered.
At the other end of the spectrum, for patients with minor or subclinical disease, these studies suggest that the benefit of using cyclophosphamide compared with no therapy to reduce progression of disease is small and is associated with risk of adverse events. However, the effect is equivalent to that demonstrated by mycophenolate, although mycophenolate demonstrated has fewer adverse effects, suggesting that mycophenolate may be the preferable agent for these patients. Evidence extrapolated from this review is not clear on whether use of mycophenolate would be sufficient in rapidly progressive patients. The included trials involved mostly people with systemic sclerosis, so it is difficult to extrapolate these findings to people with CTD‐ILD from other causes.
Intervention protocols varied across trials, in terms of route of administration of cyclophosphamide used and co‐interventions. Tashkin 2006 and Tashkin 2016 used oral and Hoyles 2006 and Zhang 2015 used intravenous (IV) cyclophosphamide. Although IV cyclophosphamide is believed to have a better safety profile compared with oral cyclophosphamide, the data provided in this review do not address this issue, nor is it able to address whether one formulation is more efficacious than the other. Zhang 2015 and Hoyles 2006 added prednisolone for four weeks in both groups, which may have affected the treatment difference between cyclophosphamide and control groups. Hoyles 2006 utilised maintenance therapy with azathioprine, but the other trials did not. Zhang 2015 also included participants with a variety of different connective tissue diseases, which may have resulted in differences in clinical course and corticosteroid responsiveness compared with systemic sclerosis, making those findings potentially less applicable to individuals with systemic sclerosis.
A large number of participants withdrew from the included trials (25.3% in the cyclophosphamide group and 20.2% in the placebo group of Tashkin 2006 at one year, 43.8% in the cyclophosphamide group and 27.5% in the mycophenolate group of Tashkin 2016 at two years, 50% in each group in Hoyles 2006, and 15% in each group in Zhang 2015). Causes for withdrawal included adverse events, treatment failure, and participant preference.
The conclusions of this review are limited by the outcome measures used. None of the included trials used the six‐minute walk test or measured any other exercise capacity parameters, although musculoskeletal involvement in systemic sclerosis (SSc) may limit performance on exercise tests. It may have been useful to quantify use of rescue immunosuppression therapy or transplantation as other efficacy outcomes. Symptom and health‐related quality of life measurements were limited among the included studies, although we note that these data were collected in the Tashkin 2006 and Tashkin 2016 trials and may be published in future studies. The use of such patient‐reported outcomes has been recognised by the Food and Drug Administration (FDA) and OMERACT as of high clinical utility, and further trials should use well‐validated instruments to measure such outcomes, when available (Tugwell 2007). Quality of life data were limited and future trials should include these in their outcomes.
The primary outcome for most of these trials included change in FVC or DLCO. Some prospective studies have demonstrated that a greater rate of decline in FVC is a predictor of mortality among people with systemic sclerosis (Assassi 2010; Goh 2017). However, evidence regarding the clinical utility and reproducibility of FVC and DLCO is mixed. The British Thoracic Society (BTS) Interstitial Lung Diseases Guideline notes that pulmonary function testing is widely variable, particularly at the milder end of the spectrum, and that variable factors in connective tissue disease‐associated interstitial lung disease, including coexisting pulmonary vascular, muscular, and pleural disease, may render interpretation of pulmonary function testing and its true impact on the patient difficult (Wells 2008). Considerable intersubject and intrasubject variability may be observed in the rate of decline in lung function. Hence, FVC % as a predictor of mortality may not always correlate as a predictor of therapeutic response (Goh 2017; Nathan 2016).
The conclusions of this review are limited by the time points at which outcomes were measured. Tashkin 2006 demonstrated a small but significant effect with 12‐month treatment with cyclophosphamide compared with placebo at 12 months, which increased to 18 months, but this effect had largely dissipated by 24 months. Longer duration of benefit has been suggested by the Scleroderma Lung Study (SLS) II trial; however, owing to lack of placebo groups, it is difficult to draw definitive conclusions. In light of these results, different outcomes may be ascertained depending on which time points are utilised to measure outcomes. The duration of treatment with cyclophosphamide has been limited to 12 months owing to concerns about adverse events (Tashkin 2007). No studies have considered a second course of treatment for responders to cyclophosphamide to assess for further benefit or added risks. The cohort of SLS I was followed up to five years for mortality (Furst 2010); however, other trials have provided very limited follow‐up for efficacy and adverse events ‐ only to 12 months. When possible, the included trials should continue to monitor long‐term outcomes in these patients, and future trials should consider long‐term follow‐up.
We aimed to perform subgroup analysis to determine whether severity of lung function, connective tissue disease diagnosis, or radiological pattern had any impact on outcomes. Tashkin 2006 demonstrated that cyclophosphamide protected against decreased FVC among patients with worse fibrosis scores. Tashkin 2006 found that more severe restriction demonstrated on lung function tests (baseline FVC < 70% predicted) was associated with a greater difference in % FVC predicted at 12 months. Previous studies have found that the best predictors of disease progression and long‐term mortality correspond to the extent of reticular change seen on HRCT (> 20% involvement) and to impact on pulmonary function (< 70% FVC) (Goh 2008). Further publications on the SLS I data have examined subgroup analyses and found that those with worse pulmonary infiltrates on HRCT and those with greater skin involvement showed greater improvement in FVC. Duration of SSc appeared to have no correlation.
Quality of the evidence
Overall we found the evidence to be of low quality. We noted limitations in the directness of evidence, in terms of the population studied and outcomes used. Trials included participants with relatively stable disease, baseline lung function of 66% to 80% FVC, and no recent exacerbations or rescue immunosuppression therapy. None of the included trials used the six‐minute walk test or measured any other exercise capacity parameters, and symptom and health‐related quality of life measurements were limited. We also noted in many analyses a wide confidence interval around a small effect estimate, indicating imprecision.
Except for Zhang 2015 (in which risk of bias was unclear), included studies revealed no significant limitations in the way trials were conducted. We detected substantial heterogeneity in only one analysis (Analysis 2.8) but did not downgrade for inconsistency, as when data are analysed as a ratio heterogeneity is not a factor.
Potential biases in the review process
We conducted this review in accordance with established Cochrane standards. Two review authors independently screened search results and resolved discrepancies by discussion and consensus. We did not restrict the literature search by language, and we translated one study into English to determine suitability for inclusion. Publication bias is possible, whereby failure to identify unpublished negative trials could have led to an overestimation of effect.
Agreements and disagreements with other studies or reviews
Evidence on long‐term treatment to reduce progression of disease is conflicting, is modest at best, and is based on small numbers of clinical, mostly non‐randomised controlled trials. Corticosteroids are commonly used, but little evidence supports their benefit (Mathai 2016). Azathioprine has demonstrated no significant benefit in randomised trials (Hoyles 2006). Cyclosporine and tacrolimus have demonstrated small benefit in retrospective studies on antisynthetase syndrome (Labirua‐Iturburu 2013). Retrospective studies have demonstrated benefit for oral cyclophosphamide followed by mycophenolate mofetil for treatment of inflammatory myopathies (Mira‐Avendano 2013). At present, few other treatments have demonstrated significant benefit in CTD‐ILD. Ongoing studies are examining the use of rituximab (Daoussis 2012; Jordan 2015; Maher 2015), nintedanib (NCT02597933), pirfenidone (NCT02808871), tocilizumab (Khanna 2015), abituzumab (NCT02745145), and autologous stem cell transplantation (van Laar 2014); these results remain to be published.
Risk of bias summary: review authors' judgements about each risk of bias item for each included study.
Risk of bias graph: review authors' judgements about each risk of bias item presented as percentages across all included studies.
Forest plot of comparison: 1 Cyclophosphamide versus placebo, outcome: 1.1 FVC % predicted.
Forest plot of comparison: 1 Cyclophosphamide versus placebo, outcome: 1.2 DLCO % predicted.
Forest plot of comparison: 2 Cyclophosphamide versus mycophenolate, outcome: 2.2 FVC % predicted at end of study.
Forest plot of comparison: 2 Cyclophosphamide versus mycophenolate, outcome: 2.4 DLCO % predicted at end of study.

Comparison 1 Cyclophosphamide versus placebo, Outcome 1 FVC % predicted.

Comparison 1 Cyclophosphamide versus placebo, Outcome 2 DLCO % predicted.
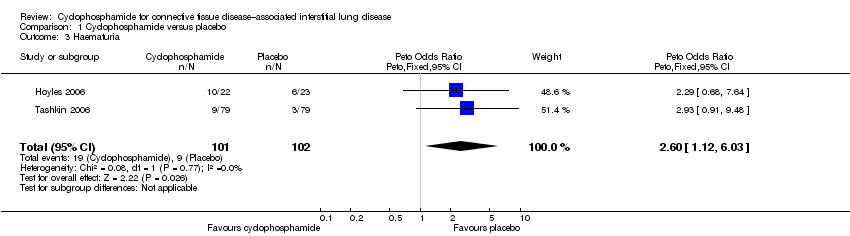
Comparison 1 Cyclophosphamide versus placebo, Outcome 3 Haematuria.

Comparison 1 Cyclophosphamide versus placebo, Outcome 4 Pneumonia.

Comparison 1 Cyclophosphamide versus placebo, Outcome 5 HAQ‐DI.
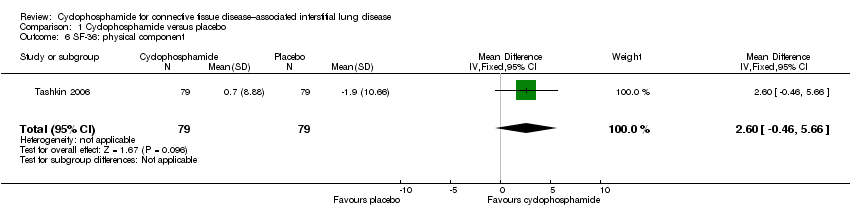
Comparison 1 Cyclophosphamide versus placebo, Outcome 6 SF‐36: physical component.

Comparison 1 Cyclophosphamide versus placebo, Outcome 7 SF‐36: mental component.

Comparison 1 Cyclophosphamide versus placebo, Outcome 8 All‐cause mortality.

Comparison 1 Cyclophosphamide versus placebo, Outcome 9 Breathlessness: Mahler Dyspnoea Index.
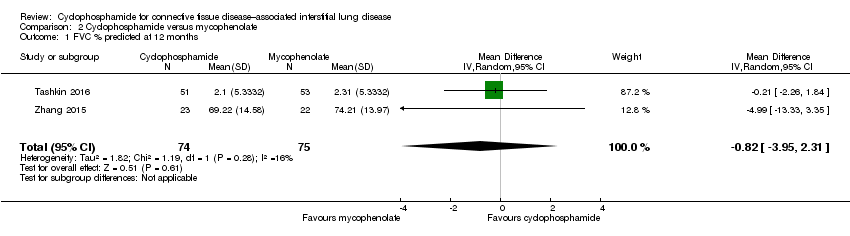
Comparison 2 Cyclophosphamide versus mycophenolate, Outcome 1 FVC % predicted at 12 months.

Comparison 2 Cyclophosphamide versus mycophenolate, Outcome 2 FVC % predicted at end of study.
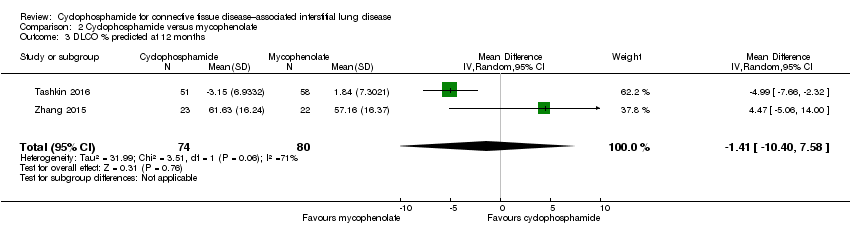
Comparison 2 Cyclophosphamide versus mycophenolate, Outcome 3 DLCO % predicted at 12 months.

Comparison 2 Cyclophosphamide versus mycophenolate, Outcome 4 DLCO % predicted at end of study.

Comparison 2 Cyclophosphamide versus mycophenolate, Outcome 5 Leukopenia.

Comparison 2 Cyclophosphamide versus mycophenolate, Outcome 6 Pneumonia.

Comparison 2 Cyclophosphamide versus mycophenolate, Outcome 7 Anaemia.

Comparison 2 Cyclophosphamide versus mycophenolate, Outcome 8 Thrombocytopenia.

Comparison 2 Cyclophosphamide versus mycophenolate, Outcome 9 Health‐related quality of life.
Comparison 2 Cyclophosphamide versus mycophenolate, Outcome 10 All‐cause mortality.

Comparison 2 Cyclophosphamide versus mycophenolate, Outcome 11 Dyspnoea: TDI.

Comparison 2 Cyclophosphamide versus mycophenolate, Outcome 12 Cough severity score.
| Cyclophosphamide compared with placebo for connective tissue disease–associated interstitial lung disease | |||||
| Patient or population: people with connective tissue disease‐associated interstitial lung disease | |||||
| Outcomes | Anticipated absolute effects* (95% CI) | Relative effect | No. of participants | Quality of the evidence | |
| Risk with placebo | Risk difference with cyclophosphamide | ||||
| Change in lung function (FVC % predicted) 12‐month follow‐up | ‐ | MD in FVC was 2.83% higher | ‐ | 182 (2 RCTs) | ⊕⊕⊝⊝ |
| Change in lung function (diffusing capacity of the lung for carbon monoxide (DLCO) % predicted) 12‐month follow‐up | ‐ | MD in DLCO was 1.66% lower | ‐ | 182 (2 RCTs) | ⊕⊕⊝⊝ |
| Adverse events: pneumonia 12‐month follow‐up | 49 per 1000 | 32 more per 1000 | OR 1.70 | 203 (2 RCTs) | ⊕⊕⊝⊝ |
| Adverse events: haematuria 12‐month follow‐up | 88 per 1000 | 113 more per 1000 | OR 2.60 | 203 (2 RCTs) | ⊕⊕⊝⊝ |
| Health‐related quality of life (HAQ‐DI) 12‐month follow‐up | MD in HAQ‐DI was 0.27 lower (0.42 lower to 0.12 lower) | ‐ | 158 (1 RCT) | ⊕⊕⊕⊝ | |
| All‐cause mortality 12‐month follow‐up | 34 per 1000 | 2 fewer per 1000 | OR 0.94 | 179 (2 RCTs) | ⊕⊕⊝⊝ |
| *The risk in the intervention group (and its 95% confidence interval) is based on the assumed risk in the comparison group and the relative effect of the intervention (and its 95% CI). | |||||
| GRADE Working Group grades of evidence. | |||||
| aThe study population included well, stable participants, and results may not be directly applicable to the general patient population. bConfidence intervals are wide, and the population size is small. | |||||
| Cyclophosphamide compared with mycophenolate for connective tissue disease–associated interstitial lung disease | |||||
| Patient or population: people with connective tissue disease‐associated interstitial lung disease | |||||
| Outcomes | Anticipated absolute effects* (95% CI) | Relative effect | No. of participants | Quality of the evidence | |
| Risk with mycophenolate | Risk difference with cyclophosphamide | ||||
| Change in lung function (FVC % predicted) 12‐month follow‐up | ‐ | MD 0.82% lower (3.95 lower to 2.31 higher) | ‐ | 149 (2 RCTs) | ⊕⊕⊝⊝ |
| Change in lung function (diffusing capacity of the lung for carbon monoxide (DLCO) % predicted) 12‐month follow‐up | ‐ | MD 1.41% lower (10.4 lower to 7.58 higher) | ‐ | 145 (2 RCTs) | ⊕⊕⊝⊝ |
| Adverse events: leukopenia 12‐month follow‐up | 27 per 1000 | 135 more per 1000 | OR 6.86 | 300 (2 RCTs) | ⊕⊕⊝⊝ |
| Adverse events: pneumonia 12‐month follow‐up | 103 per 1000 | 1 more per 1000 | OR 1.01 | 300 (2 RCTs) | ⊕⊕⊝⊝ |
| Adverse events: anaemia 12‐month follow‐up | 55 per 1000 | 32 more per 1000 | OR 1.63 | 300 (2 RCTs) | ⊕⊕⊝⊝ |
| Adverse events: thrombocytopenia 12‐month follow‐up | 0 per 1000 | 30 more per 1000 (0 to 60 more) | RD 0.03 (0.00 to 0.06) | 300 (2 RCTs) | ⊕⊕⊝⊝ |
| Health‐related quality of life (HAQ‐DI) 12‐month follow‐up | ‐ | MD for HAQ‐DI was 0.05 lower (0.17 lower to 0.07 higher) | ‐ | 142 (1 RCT) | ⊕⊕⊝⊝ |
| All‐cause mortality 12‐month follow‐up | 88 per 1000 | 46 more per 1000 | OR 1.60 | 187 (2 RCTs) | ⊕⊕⊝⊝ |
| *The risk in the intervention group (and its 95% confidence interval) is based on the assumed risk in the comparison group and the relative effect of the intervention (and its 95% CI). | |||||
| GRADE Working Group grades of evidence. | |||||
| aThe study population included well, stable participants, and results may not be directly applicable to the general patient population. bConfidence intervals are wide, and the population size is small. cSubstantial statistical heterogeneity detected; I2 = 81%, but not downgraded as no heterogeneity when analysed as a ratio. | |||||
| Outcome or subgroup title | No. of studies | No. of participants | Statistical method | Effect size |
| 1 FVC % predicted Show forest plot | 2 | 190 | Mean Difference (Random, 95% CI) | 2.83 [0.80, 4.87] |
| 2 DLCO % predicted Show forest plot | 2 | 182 | Mean Difference (Random, 95% CI) | ‐1.66 [‐4.39, 1.07] |
| 3 Haematuria Show forest plot | 2 | 203 | Peto Odds Ratio (Peto, Fixed, 95% CI) | 2.60 [1.12, 6.03] |
| 4 Pneumonia Show forest plot | 2 | 203 | Peto Odds Ratio (Peto, Fixed, 95% CI) | 1.70 [0.55, 5.32] |
| 5 HAQ‐DI Show forest plot | 1 | Mean Difference (Fixed, 95% CI) | ‐0.27 [‐0.42, ‐0.12] | |
| 6 SF‐36: physical component Show forest plot | 1 | 158 | Mean Difference (IV, Fixed, 95% CI) | 2.60 [‐0.46, 5.66] |
| 7 SF‐36: mental component Show forest plot | 1 | 158 | Mean Difference (IV, Fixed, 95% CI) | 2.09 [‐2.07, 6.25] |
| 8 All‐cause mortality Show forest plot | 2 | 179 | Peto Odds Ratio (Peto, Fixed, 95% CI) | 0.94 [0.19, 4.77] |
| 9 Breathlessness: Mahler Dyspnoea Index Show forest plot | 1 | 158 | Mean Difference (IV, Fixed, 95% CI) | 2.9 [1.95, 3.85] |
| Outcome or subgroup title | No. of studies | No. of participants | Statistical method | Effect size |
| 1 FVC % predicted at 12 months Show forest plot | 2 | 149 | Mean Difference (IV, Random, 95% CI) | ‐0.82 [‐3.95, 2.31] |
| 2 FVC % predicted at end of study Show forest plot | 2 | Mean Difference (Random, 95% CI) | ‐0.68 [‐5.44, 4.08] | |
| 3 DLCO % predicted at 12 months Show forest plot | 2 | 154 | Mean Difference (IV, Random, 95% CI) | ‐1.41 [‐10.40, 7.58] |
| 4 DLCO % predicted at end of study Show forest plot | 2 | Mean Difference (Random, 95% CI) | 2.04 [‐1.11, 5.19] | |
| 5 Leukopenia Show forest plot | 2 | 300 | Peto Odds Ratio (Peto, Fixed, 95% CI) | 6.86 [3.23, 14.58] |
| 6 Pneumonia Show forest plot | 2 | 300 | Peto Odds Ratio (Peto, Fixed, 95% CI) | 1.01 [0.48, 2.14] |
| 7 Anaemia Show forest plot | 2 | 300 | Peto Odds Ratio (Peto, Fixed, 95% CI) | 1.63 [0.65, 4.11] |
| 8 Thrombocytopenia Show forest plot | 2 | 300 | Risk Difference (M‐H, Fixed, 95% CI) | 0.03 [‐0.00, 0.06] |
| 9 Health‐related quality of life Show forest plot | 1 | 142 | Mean Difference (IV, Fixed, 95% CI) | ‐0.05 [‐0.17, 0.07] |
| 10 All‐cause mortality Show forest plot | 2 | 187 | Peto Odds Ratio (Peto, Fixed, 95% CI) | 1.60 [0.65, 3.95] |
| 11 Dyspnoea: TDI Show forest plot | 1 | Mean Difference (Fixed, 95% CI) | 2.9 [2.79, 3.01] | |
| 12 Cough severity score Show forest plot | 1 | 142 | Mean Difference (IV, Fixed, 95% CI) | ‐0.17 [‐0.39, 0.05] |