Neonatal vitamin A supplementation for the prevention of mortality and morbidity in term neonates in low and middle income countries
Abstract
Background
Vitamin A deficiency is a major public health problem in low and middle income countries. Vitamin A supplementation in children six months of age and older has been found to be beneficial, but no effect of supplementation has been noted for children between one and five months of age. Supplementation during the neonatal period has been suggested to have an impact by increasing body stores in early infancy.
Objectives
To evaluate the role of vitamin A supplementation for term neonates in low and middle income countries with respect to prevention of mortality and morbidity.
Search methods
We used the standard search strategy of the Cochrane Neonatal Review Group to search the Cochrane Central Register of Controlled Trials (CENTRAL; 2016, Issue 2), MEDLINE via PubMed (1966 to 13 March 2016), Embase (1980 to 13 March 2016) and the Cumulative Index to Nursing and Allied Health Literature (CINAHL; 1982 to 13 March 2016). We also searched clinical trials databases, conference proceedings and reference lists of retrieved articles for randomised controlled trials and quasi‐randomised trials.
Selection criteria
Randomised and quasi‐randomised controlled trials. Also trials with a factorial design.
Data collection and analysis
Two review authors independently assessed trial quality and extracted study data. We used the Grading of Recommendations Assessment, Development and Evaluation (GRADE) approach to assess the quality of evidence.
Main results
We included 12 trials (168,460 neonates) in this review, with only a few trials reporting disaggregated data for term infants. Therefore, we analysed data and presented estimates for term infants (when specified) and for all infants.
Data for term neonates from three studies did not show a statistically significant effect on the risk of infant mortality at six months in the vitamin A group compared with the control group (typical risk ratio (RR) 0.80; 95% confidence interval (CI) 0.54 to 1.18; I2 = 63%). Analysis of data for all infants from 11 studies revealed no evidence of a significant reduction in the risk of infant mortality at six months among neonates supplemented with vitamin A compared with control neonates (typical RR 0.98, 95% CI 0.89 to 1.07; I2 = 47%). We observed similar results for infant mortality at 12 months of age with no significant effect of vitamin A compared with control (typical RR 1.04, 95% CI 0.94 to 1.15; I2 = 47%). Limited data were available for the outcomes of cause‐specific mortality and morbidity, vitamin A deficiency, anaemia and adverse events.
Authors' conclusions
Given the high burden of death among children younger than five years of age in low and middle income countries, and the fact that mortality in infancy is a major contributory cause, it is critical to obtain sound scientific evidence of the effect of vitamin A supplementation during the neonatal period on infant mortality and morbidity. Evidence provided in this review does not indicate a potential beneficial effect of vitamin A supplementation among neonates at birth in reducing mortality during the first six months or 12 months of life. Given this finding and the absence of a clear indication of the biological mechanism through which vitamin A could affect mortality, along with substantial conflicting findings from individual studies conducted in settings with potentially varying levels of maternal vitamin A deficiency and infant mortality, absence of follow‐up studies assessing any long‐term impact of a bulging fontanelle after supplementation and the finding of a potentially harmful effect among female infants, additional research is warranted before a decision can be reached regarding policy recommendations for this intervention.
PICOs
Plain language summary
Neonatal vitamin A supplementation for prevention of mortality and morbidity among term neonates in low and middle income countries
Review question: Does vitamin A supplementation among term neonates in low and middle income countries prevent mortality and morbidity?
Background: Vitamin A is an important micronutrient that is required for maintenance of normal functioning of the human body. In the developing world, many pregnant women are vitamin A deficient. During pregnancy, additional vitamin A is required to promote growth of the baby and to provide stores in the baby's liver. Deficiency of this micronutrient in the mother may lead to its deficiency in the baby and may result in adverse effects on the baby's health. The benefits of giving vitamin A to children older than six months of age for reducing death and adverse effects on health have been established, but no available evidence shows this beneficial effect among infants one to five months of age. Potential benefits of vitamin A supplementation during the newborn period (during the first month of life) are under investigation.
Study characteristics: The present review identified 12 studies including 168,460 newborns in which the intervention group was supplemented with vitamin A during the newborn period.
Key results: Analysis of data for all infants shows no significant reduction in infant deaths at six months of age with the intervention and similar findings for infant deaths at 12 months of age.
Quality of evidence: We judged the quality of evidence as high for the most important clinical outcomes, with the exception of two outcomes that we scored as having low and very low quality: ‘diarrhoeal events during the first 48‐72 hours post supplementation’ and ‘all‐cause infant mortality at 6 months in term infants’, respectively.
Authors' conclusions
Summary of findings
| Neonatal vitamin A supplementation versus control for prevention of mortality and morbidity in term neonates in low and middle income countries | ||||||
| Patient or population: mortality and morbidity in term neonates | ||||||
| Outcomes | Illustrative comparative risks* (95% CI) | Relative effect | Number of participants | Quality of the evidence | Comments | |
| Assumed risk | Corresponding risk | |||||
| Control | Neonatal vitamin A supplementation | |||||
| All‐cause infant mortality at 6 months: risk ratios based on cumulative risk (%, adjusted for clustering) ‐ term infants | Low‐risk population | RR 0.80 Risk ratios based on cumulative risk (%) | 22,721 | ⊕⊝⊝⊝ | The pooled estimate of data for term infants from 3 studies (Humphrey 1996; Klemm 2008; Malaba 2005) suggests that risk of death from any cause at 6 months of age for neonates who were supplemented with vitamin A was 20% lower than control and was not statistically significant (pooled RR 0.80, 95% CI 0.54 to 1.18; Analysis 1.1.1) The level of statistical heterogeneity in this analysis was 63%. As the number of studies included was small, a subgroup analysis to investigate heterogeneity was not considered reliable. Given substantial statistical heterogeneity and the small number of included studies, these findings should be interpreted with caution | |
| 13 per 1000 | 10 per 1000 | |||||
| Medium‐risk population | ||||||
| 15 per 1000 | 12 per 1000 | |||||
| High‐risk population | ||||||
| 28 per 1000 | 22 per 1000 | |||||
| All‐cause infant mortality at 6 months: risk ratios based on cumulative risk (%, adjusted for clustering) ‐ all infants | Low‐risk population | RR 0.98 (0.89 to 1.07) Risk ratios based on cumulative risk (%) | 154,634 (11 studies) | ⊕⊕⊕⊕ | The pooled estimate of data for all infants from 11 studies (Benn 2008; Benn 2010; Bhutta 2016; Edmond 2015; Humphrey 1996; Klemm 2008; Malaba 2005; Masanja 2015; Mazumder 2015; Rahmathullah 2003; West 1995) showed no evidence of a significant effect on risk of death from any cause for neonates supplemented with vitamin A as compared with controls (typical RR 0.98, 95% CI 0.89 to 1.07). The level of statistical heterogeneity for this analysis was 47% (Analysis 1.1.2) | |
| 13 per 1000 | 13 per 1000 | |||||
| Medium‐risk population | ||||||
| 15 per 1000 | 15 per 1000 | |||||
| High‐risk population | ||||||
| 28 per 1000 | 27 per 1000 | |||||
| All‐cause neonatal mortality: risk ratios based on cumulative risk (%, adjusted for clustering) ‐ all infants | Low‐risk population | RR 0.99 (0.90 to 1.08) Risk ratios based on cumulative risk (%) | 126,242 (5 studies) | ⊕⊕⊕⊕ | Five included studies measured neonatal mortality in the first month of life (Bhutta 2016; Edmond 2015; Klemm 2008; Masanja 2015; Mazumder 2015). Data from these 5 studies were measured as risk ratios based on cumulative risk. The pooled estimate of data for all infants showed no evidence of a significant effect on risk of death from any cause at 1 month of age for neonates supplemented with vitamin A as compared with controls (typical RR 0.99. 95% CI 0.90 to 1.08) | |
| Medium‐risk population | ||||||
| High‐risk population | ||||||
| Adverse events during first 48‐72 hours post supplementation ‐ bulging fontanelle | 7 per 1000 | 11 per 1000 | RR 1.53 | 100,256 | ⊕⊕⊕⊕ | Data for adverse events in all infants during the first 48 to 72 hours could be pooled from 5 studies (Benn 2008; Edmond 2015; Humphrey 1996; Masanja 2015; Mazumder 2015 ), and only 1 study (Benn 2008) presented adverse events at 1 month of age (Analysis 1.14 and Analysis 1.15) The risk of a bulging fontanelle during the first 48 to 72 hours for neonates supplemented with vitamin A was 53% higher than for controls, which is statistically significant (typical RR 1.53, 95% CI 1.11 to 2.11; I2 = 71%) |
| Adverse events during first 48‐72 hours post supplementation ‐ vomiting | 34 per 1000 | 34 per 1000 | RR 1.00 | 99,582 | ⊕⊕⊕⊕ | Typical RR 1.00 (95% CI 0.93 to 1.07) in vitamin A group vs control group |
| Adverse events during first 48‐72 hours post supplementation ‐ diarrhoea | 43 per 1000 | 41 per 1000 | RR 0.96 | 102,638 | ⊕⊕⊝⊝ | Pooled estimates from the 5 studies provided no evidence of a significant increase in diarrhoea (typical RR 0.96, 95% CI 0.81 to 1.13) |
| Vitamin A deficiency (serum retinol < 0.70 micromol/L) at 6 weeks of age | 331 per 1000 | 311 per 1000 | RR 0.94 (0.75 to 1.19) at 6 weeks | 612 | ⊕⊕⊕⊕ | Vitamin A deficiency defined as serum retinol value < 0.70 µmol/L was available for all infants from 1 study only (Benn 2008), which showed no evidence of a significant effect of vitamin A supplementation on vitamin A deficiency as compared with control at 6 weeks (RR 0.94, 95% CI 0.75 to 1.19) |
| Vitamin A deficiency (serum retinol < 0.70 micromol/L) at 4 months of age | 158 per 1000 | 162 per 1000 | RR 1.02 (0.64 to 1.62) at 4 months | 369 | ⊕⊕⊕⊕ | Vitamin A deficiency defined as serum retinol value < 0.70 µmol/L was available for all infants from 1 study only (Benn 2008), which provided no evidence of a significant effect of vitamin A supplementation on vitamin A deficiency as compared with control at 4 months (RR 1.02, 95% CI 0.64 to 1.62) |
| *The basis for the assumed risk (e.g. median control group risk across studies) is provided in footnotes. The corresponding risk (and its 95% confidence interval) is based on assumed risk in the comparison group and the relative effect of the intervention (and its 95% CI) | ||||||
| GRADE Working Group grades of evidence | ||||||
| aRisk of bias assessment identified a possible issue over the stopping procedure in Klemm 2008. A higher rate of mortality was observed in the placebo group after 2/3 participants had been randomised bThe lower confidence limit indicates a 46% reduction in mortality at 6 months, whereas the upper limit indicates an 18% increase cThe level of statistical heterogeneity between study results was moderate (I2 = 63%). Variation between studies may have been related to differences between study populations and settings in terms of infant mortality rates and baseline prevalence of vitamin A deficiency dAlthough level of statistical heterogeneity was substantial (I2 = 71%), all included studies indicated potential harm. Heterogeneity was caused by differences in strength of association among the included studies eModerate level of statistical heterogeneity (I2 = 58%) fThe lower confidence limit indicates a 19% reduction in diarrhoea, whereas the upper limit indicates a 13% increase gOnly one of the included studies reported this outcome at 6 weeks of age. Review authors noted that data reported on this outcome specified different time points and could not be formally used in the meta‐analysis hOnly 1 of the included studies reported this outcome at 4 months of age. Review authors noted that data reported on this outcome specified different time points and could not be formally used in the meta‐analysis | ||||||
Background
Description of the condition
Vitamin A deficiency is considered a major public health problem in low and middle income countries (WHO 2009). Globally, 9.8 million pregnant women are affected by night blindness, and more than 19 million have low serum retinol concentrations (< 0.70 µmol/L). Night blindness affects 5.2 million preschool children, and an estimated 190 million have low serum retinol concentrations. The prevalence of low serum retinol concentrations among pregnant women is highest in South‐East Asia (17.3%), followed by Africa (13.5%), whereas the prevalence of night blindness is approximately the same in the two regions (9.9% in South‐East Asia vs 9.8% in Africa) (WHO 2009).
Deficiency of vitamin A may be secondary to decreased ingestion, defective absorption and altered metabolism or increased requirements. Factors such as low dietary fat intake or intestinal infection may also interfere with absorption of vitamin A. Vitamin A deficiency is the most important cause of childhood blindness and contributes significantly to morbidity and mortality from common childhood infections (WHO 2016).
Description of the intervention
Vitamin A is an essential micronutrient that is required for maintenance of normal functioning of the human body. It was the first fat‐soluble vitamin to be discovered and for nearly a century has been known to be an important dietary constituent (Hopkins 1912; McCollum 1915). Vitamin A is part of a family of compounds called retinoids; naturally occurring retinoids include retinol, retinal and retinoic acid. For human physiology, retinol is the predominant form and 11‐cis‐retinol is the active form. Inactive retinoids, also known as provitamin A, are produced as plant pigments and are called carotenoids. Although many carotenoids are found in foods, only about 50% can be metabolised into active retinoid forms. Beta‐carotene, a retinol dimer, has the most significant provitamin A activity. Vitamin A is stored in the liver as retinyl esters and, when needed, is transported into blood, where it is carried by retinol binding protein (RBP) for delivery to other tissues (Bowman 2001).
Vitamin A is important for normal functioning of the visual system, as well as for immune response, gene expression, reproduction, embryogenesis and hematopoiesis. It is essential for maintenance of normal epithelial tissues throughout the body (Bowman 2001). Preformed vitamin A is found only in animal foods such as liver, fish and dairy products (such as milk, cheese and butter); it constitutes 65% to 75% of dietary vitamin A intake. Remaining dietary vitamin A is obtained from carotenoids present in plant sources such as carrots, dark green leafy vegetables, red and orange fruits and red palm oil. Recommended Dietary Allowances (RDAs) for vitamin A vary with age. For healthy breast‐fed infants up to six months of age, the average RDA is 400 µg/d, and for infants seven to 12 months of age, the RDA is 500 µg/d. For children one to three years and four to eight years old, the RDA is 300 µg/d and 400 µg/d, respectively (DRI 2001).
Routine consumption of large amounts of vitamin A over time can result in toxic symptoms, which include liver damage, headaches, vomiting, skin desquamation, bone abnormalities, joint pain and alopecia (Bowman 2001). Hypervitaminosis A appears to be due to abnormal transport and distribution of vitamin A and retinoids that is caused by overloading of plasma transport mechanisms. A very high single dose can also cause transient acute toxic symptoms that may include a bulging fontanelle in infants; headaches in older children and adults; and vomiting, diarrhoea, loss of appetite and irritability in all age groups. Toxicity from ingestion of food sources of preformed vitamin A is rare (Hathcock 1997).
How the intervention might work
During pregnancy, women need additional vitamin A (an additional increment of 100 µg/d above basal requirements during the full gestation period) to sustain growth of the foetus and to provide a limited reserve in the foetal liver, as well as to maintain the woman's own tissue growth. Because therapeutic levels of vitamin A are generally higher than preventive levels, the safe intake level recommended during pregnancy is 800 µg retinol equivalents (RE)/d. Women who are or who might become pregnant should carefully limit their total daily vitamin A intake to a maximum of 3000 µg RE (10,000 IU) to minimise risk of foetal toxicity (WHO/NUT 1998). Infants have very low levels of vitamin A stored in the liver at birth and are dependent on breast milk as a source of vitamin A during the first few months of life. Thus, maternal vitamin A deficiency during lactation, early weaning or artificial feeding may result in vitamin A deficiency among infants (Underwood 1994). The physiological vitamin A needs of infants born to vitamin A‐adequate mothers and fed breast milk with adequate vitamin A (in excess of 30 µg/dL, or 1.05 µmol/L) are met for at least the first six months of life (Underwood 1994). Because of the need for vitamin A to promote growth in infancy, the rate of which can vary considerably, a requirement estimate of 180 µg RE/d seems appropriate. Average consumption of human milk by such infants is about 750 mL/d during the first six months (WHO/NUT/98.1 1998). If an average concentration of vitamin A in human milk of about 1.75 mmol/L is assumed, mean daily intake would have to be about 375 µg RE, which is therefore the recommended safe level.
Why it is important to do this review
The role of vitamin A supplementation for children older than six months of age is well established (Beaton 1993; Imdad 2010; Rice 2004). Beaton and colleagues in their meta‐analysis showed that vitamin A supplementation in children six months to five years of age significantly reduced mortality by 23% (Beaton 1993). A recent Cochrane review concluded that two oral doses of 200,000 IU of vitamin A given on consecutive days to children younger than two years of age with measles were associated with reduced risk of overall mortality (risk ratio (RR) 0.18, 95% confidence interval (CI) 0.03 to 0.61) and pneumonia‐specific mortality (RR 0.33, 95% CI 0.08 to 0.92) (Huiming 2005). The World Health Organization (WHO) recommends administration of vitamin A during vaccination contacts to prevent vitamin A deficiency (WHO 1998). The policy of WHO has been to supplement vitamin A by providing 100,000 IU at the earliest possible opportunity after six months of age. However, it is now recommended that an additional 50,000 IU of vitamin A be administered with each of the diphtheria‐tetanus‐pertussis (DTP) and polio vaccinations, which usually are given at six, 10 and 14 weeks of age (Sommer 2002). National and regional programmes of vitamin A supplementation, which are in place in more than 60 countries worldwide, target children older than six months of age (Fawzi 2006). Not only are these programmes highly effective in reducing mortality and morbidity, but in countries in which vitamin A deficiency constitutes a public health problem, they appear to be among the most cost‐effective public health interventions available. Such programmes seek to maximise child survival among children older than six months ‐ the group that accounts for a quarter of deaths in children younger than five years of age. To address the major proportion of deaths in children younger than five, programmes should target children younger than six months of age. Supplementation with vitamin A between one and five months of age has been found to have no beneficial effect (Daulaire 1992; Rahman 1995; WHO/CHD 1998). Supplementation of neonates has been suggested as a feasible approach to bolstering body stores of vitamin A during early infancy, thereby having an impact on mortality and morbidity (Sommer 1995). Several randomised clinical trials and systematic reviews have evaluated this approach (Benn 2008; Benn 2010; Benn 2014; Bhutta 2016; Edmond 2015; Haider 2011; Haider 2015; Humphrey 1996; Klemm 2008; Malaba 2005; Masanja 2015; Mazumder 2015; Rahmathullah 2003; West 1995). This review updates the previous Cochrance review on this topic, which was published in 2011 (Haider 2011), and includes trials published since the time of the previous publication.
Objectives
To evaluate the role of vitamin A supplementation for term neonates in low and middle income countries with respect to prevention of mortality and morbidity.
Methods
Criteria for considering studies for this review
Types of studies
We included in this review all randomised controlled trials (RCTs), both individually randomised and cluster‐randomised, irrespective of publication status and language, conducted to evaluate effects of vitamin A supplementation for term neonates in low and middle income countries. We also included studies using a factorial design and quasi‐randomised trials.
Types of participants
We included all term neonates (born between 37 and 42 weeks' gestational age) up to 28 days after birth.
Types of interventions
Studies compared supplementation with vitamin A within the first 28 days of life against a control (placebo or no supplementation). We excluded from the review any trial with continued supplementation beyond the first 28 days of life. Co‐interventions, if any, should have been identical in the two groups.
Types of outcome measures
Primary outcomes
-
All‐cause infant mortality at six months and 12 months
Secondary outcomes
-
Cause‐specific infant mortality associated with acute respiratory infection and diarrhoea at six months and 12 months
-
Infant morbidity at six months of age, associated with acute respiratory infection and diarrhoea, measured as at least one episode of morbidity
-
Biochemical indicator values of vitamin A deficiency (vitamin A deficiency measured as serum retinol < 0.70 µmol/L)
-
Blindness and signs of xerophthalmia (Bitot's spots and corneal lesions)
-
Mean haemoglobin level or anaemia defined as haemoglobin less than the age‐specific cut‐off value as stated by study authors
-
Adverse events reported in trials due to vitamin A toxicity such as bulging fontanelles, vomiting and diarrhoea
-
All‐cause neonatal mortality (between supplementation and 28 days of age)
Search methods for identification of studies
For the March 2016 update:
-
We conducted a comprehensive search including Cochrane Central Register of Controlled Trials (CENTRAL; 2016, Issue 2) in the Cochrane Library; MEDLINE via PubMed (1966 to 13 March 2016); Embase (1980 to 13 March 2016); and Cumulative Index to Nursing and Allied Health Literature (CINAHL; 1982 to 13 March 2016) using the following search terms: (vitamin A OR retinol OR retinoid OR retinoic OR vitamin A [MeSH]), plus database‐specific limiters for RCTs and neonates (see Appendix 1 for full search strategies for each database). We applied no language or date restrictions.
-
We searched clinical trials registries for ongoing and recently completed trials (clinicaltrials.gov; World Health Organization’s International Trials Registry and Platform ‐ www.whoint/ictrp/search/en/ and the ISRCTN Registry).
For prior searches:
-
We used the standard search strategy of the Cochrane Neonatal Review Group. We searched the Cochrane Central Register of Controlled Trials (CENTRAL; 14 June 2010) in the Cochrane Library; and Embase and MEDLINE (1966 to May 2010) via PubMed using the following search terms: (Newborn OR infan* OR neonat*) AND (vitamin A OR retino*). We limited our search to the clinical trial publication type.
-
We limited searches to human studies and applied no language restrictions. We also searched related conference proceedings for relevant abstracts. We contacted organisations and researchers in the field for information on unpublished and ongoing trials and searched reference lists of all trials identified by the above methods. For further identification of ongoing trials, we searched the websites www.clinicaltrials.gov and www.anzctr.com.
Data collection and analysis
Selection of studies
Two review authors independently assessed for inclusion all potential studies identified as a result of the search strategy. We resolved disagreements through discussion.
Data extraction and management
We designed a form on which to record extracted data. For eligible studies, two review authors extracted data using the agreed form. We resolved discrepancies through discussion. We entered data into Review Manager software (RevMan 2008) and checked them for accuracy.
Assessment of risk of bias in included studies
Two review authors independently assessed risk of bias (low, high or unclear) of all included trials using the Cochrane ‘Risk of bias’ tool (Higgins 2011) for the following domains.
-
Selection bias.
-
Performance bias.
-
Attrition bias.
-
Reporting bias.
-
Any other bias.
We resolved disagreements by discussion or by consultation with a third assessor. See Appendix 2 for a more detailed description of risk of bias for each domain.
Measures of treatment effect
Dichotomous data
For dichotomous data, we presented results as summary risk ratios or rate ratios with 95% confidence intervals (CIs).
Continuous data
We included no continuous outcomes in this review.
Unit of analysis issues
We included in this review three cluster‐randomised trials (Bhutta 2016; Klemm 2008; West 1995). For Bhutta 2016, study investigators reported that the observed design effect and intracluster correlation coefficient (ICC) for neonatal mortality were 1.29 and 0.01, respectively. For infant mortality at six months, the observed design effect and ICC were 1.27 and 0.01. Klemm 2008 reported that the observed design effect was 0.9%. For West 1995, 95% CIs of effect estimates were inflated by 10% to account for the impact of design on study findings. We estimated that the 10% increase in 95% CIs yielded an ICC of 0.04 for the cohort of infants administered vitamin A.
Data synthesis
We analysed the data using a generic inverse variance approach to meta‐analysis via Review Manager software (RevMan 2008) and generated risk ratio or rate ratio estimates with 95% CIs for dichotomous outcomes. For this approach, we entered data as natural logarithms (as log risk ratios and log rate ratios and standard error (SE) of log risk ratios and SE of log rate ratios) for each individual study, using data extracted from published papers or obtained from study authors if not presented in papers. We have presented data used for infant mortality analyses along with their sources in 'Additional tables'. We used the fixed‐effect method for combining data when trials were examining the same intervention, and when we judged trial populations and methods as sufficiently similar.
The review objective was to evaluate the effect of vitamin A supplementation in term neonates. Studies included in this review had enrolled all births identified in their study settings without restriction for gestational age of < 37 or ≥ 37 weeks, which would have allowed us to use only term data. Three studies used birth weight as a criterion: Benn 2008 and Benn 2014 enrolled normal birth weight neonates (birth weight ≥ 2500 grams), and Benn 2010 recruited only low birth weight neonates (birth weight < 2500 grams). One study presented data for term neonates separately only in the published paper for the infant mortality outcome at six months (Klemm 2008). West 1995 (Keith West; personal communication, 2008) did not provide information about gestational age. Given the small number of studies included in the review and limited available data for primary outcomes, we analysed data for term neonates, when available, then performed analyses of data for all infants. For all secondary outcomes, investigators presented data for all infants together in published papers, and we analysed these data as such. As the inclusion criterion for both Benn 2008 and Benn 2014 was birth weight of at least 2500 grams, we assumed that a greater proportion of neonates would be term babies and analysed their data as such in our term neonate analysis. We used the term 'all infants' to refer to aggregated term and preterm infant data throughout this review.
Two studies provided maternal supplementation with vitamin A in the postpartum period (Malaba 2005) or during pregnancy (Klemm 2008). Malaba and colleagues randomised mother‐infant pairs to four treatment arms (described in detail in the Characteristics of included studies table), whereas Klemm and associates randomised neonates within each of three previously randomised treatment arms of a maternal supplementation trial of vitamin A. This resulted in two neonatal treatment arms in Klemm 2008, which were balanced across maternal supplementation arms. Both studies reported no significant interaction between maternal and neonatal supplementation with vitamin A, and we included data for all neonates provided by these studies on the basis of their randomisation to the neonatal vitamin A intervention or control group.
Quality of evidence
We used the Grading of Recommendations Assessment, Development and Evaluation (GRADE) approach, as outlined in the GRADE Handbook (Schünemann 2013), to assess the quality of evidence for the following (clinically relevant) outcomes.
-
All‐cause infant mortality at six months.
-
All‐cause neonatal mortality (between supplementation and 28 days of age).
-
Blindness and signs of xerophthalmia (Bitot's spots and corneal lesions).
-
Adverse events reported in trials due to vitamin A toxicity: bulging fontanelles.
-
Adverse events reported in trials due to vitamin A toxicity: vomiting.
-
Adverse events reported in trials due to vitamin A toxicity: diarrhoea.
-
Biochemical indicator values of vitamin A deficiency (vitamin A deficiency measured as serum retinol < 0.70 µmol/L).
Two review authors independently assessed the quality of evidence for each of the outcomes above. We considered evidence from RCTs as high quality but downgraded the evidence one level for serious (or two levels for very serious) limitations on the basis of the following: design (risk of bias), consistency across studies, directness of the evidence, precision of estimates and presence of publication bias. We used the GRADEpro GDT Guideline Development Tool to create summary of findings Table for the main comparison to report the quality of the evidence.
The GRADE approach results in an assessment of the quality of a body of evidence according to one of four grades.
-
High: We are very confident that the true effect lies close to the estimate of effect.
-
Moderate: We are moderately confident in the effect estimate: The true effect is likely to be close to the estimate of effect but may be substantially different.
-
Low: Our confidence in the effect estimate is limited: The true effect may be substantially different from the estimate of effect.
-
Very low: We have very little confidence in the effect estimate: The true effect is likely to be substantially different from the estimate of effect.
Subgroup analysis and investigation of heterogeneity
We prespecified the following subgroups to investigate heterogeneity.
-
Maternal vitamin A supplementation.
-
Birth weight of neonates.
-
HIV status of mother and infant.
-
Dose and frequency of vitamin A used.
-
High baseline infant mortality.
-
Comorbidities.
-
Timing of vitamin A supplementation (within the first 48 to 72 hours or later).
-
Sex of the neonate.
-
Geographic region.
We measured heterogeneity among trials by calculating the I2 statistic. We considered values of the I2 statistic greater than 50% to represent substantial heterogeneity, in which case we planned to explore heterogeneity by undertaking prespecified subgroup analysis. However, the small number of studies included in the review precluded evaluation of heterogeneity, when identified. We conducted subgroup analysis by geographic region and sex of the infant for mortality outcomes for all infants in response to the special interest of the scientific community in evaluating this differential effect.
We planned to investigate publication bias for outcomes if we identified more than 10 studies for inclusion. However, we did not investigate this bias as the number of studies included was small.
Results
Description of studies
Included studies
We included in this review 12 studies including 168,460 neonates (Figure 1).

Study flow diagram: review update.
Humphrey 1996 was conducted in a single tertiary care hospital in Indonesia as a safety trial for vitamin A supplementation at the time of birth. In this randomised double‐blind placebo‐controlled trial of 2067 infants with birth weight > 1500 grams and without critical illness, researchers randomly assigned infants to receive a single oral dose of vitamin A (50,000 IU) or placebo within 24 hours of delivery. Maternal, infant and household characteristics were similar in the two groups at baseline.
West 1995 was part of a large cluster‐randomised, double‐blind, placebo‐controlled trial of vitamin A supplementation for preschool children conducted in Nepal. Investigators enrolled a total of 11,918 infants younger than six months, of whom 1621 were neonates, and administered vitamin A (50,000 IU to infants < one month old and 100,000 IU to infants one to ≤ five months old) or placebo. Baseline characteristics of the two groups were similar.
Rahmathullah 2003 was also a randomised, double‐blind, placebo‐controlled trial conducted in India in which all live‐born infants within participating villages were eligible for inclusion. Investigators enrolled a total of 11,619 newborn infants born to consenting mothers who were residing in the study area and administered two doses of vitamin A or placebo ‐ the first dose within the first 48 hours of delivery and the second dose within 24 hours of the first dose. Baseline characteristics of families, mothers and infants were similar between treatment groups.
Malaba 2005 was a randomised, double‐bind, placebo‐controlled trial conducted in Zimbabwe in which investigators used a two‐by‐two factorial design. Mother‐infant pairs were eligible for inclusion if the mother planned to reside in the study area after delivery; if neither of the two had a life‐threatening illness; and if the infant's birth weight was > 1500 grams. Researchers enrolled around 14,110 infant‐mother pairs within 96 hours of delivery and assigned them to one of the following groups: Aa (vitamin A supplementation for both mother and infant), Ap (vitamin A for mother and placebo for infant), pa (placebo for mother and vitamin A for infant) and pp (placebo for both mother and infant). The vitamin A dose for mothers was 400,000 IU, and for infants 50,000 IU. All treatment groups were similar at baseline in terms of maternal, household and other related variables.
Klemm 2008 was a cluster‐randomised, double‐bind, placebo‐controlled trial conducted in Bangladesh that was nested within an ongoing parent trial of vitamin A supplementation for pregnant women. All infants born to consenting mothers from the original trial were included in the current trial. A total of 15,948 infants received vitamin A (50,000 IU) or placebo at home as soon as possible after birth. Baseline characteristics of mothers and infants in this study were comparable at baseline.
Benn et al conducted three studies in Guinea Bissau. Benn 2008 was a randomised, double‐blind, placebo‐controlled trial that included 4345 normal birth weight infants (birth weight ≥ 2500 grams). For births occurring at the national hospital or at local health centres, researchers invited mothers to participate in the study at the time of Bacille Calmette‐Guérin (BCG) vaccination. For home births, they invited mothers to participate at the time of their visit to the local health centre for BCG vaccination. Study investigators randomised all infants with birth weight at least 2500 grams, with no serious medical condition or malformation and for whom parental consent was available, to oral drops of vitamin A (50,000 IU) or to placebo. Treatment groups were similar at baseline in terms of various characteristics. Conducted in parallel with Benn 2008, Benn 2010 was a two‐by‐two factorial, randomised, double‐blind, placebo‐controlled trial in low birth weight neonates (birth weight < 2500 grams) that included 1736 neonates randomised to 25,000 IU vitamin A or to placebo, as well as to early BCG vaccine or the usual late BCG vaccine. Investigators in Benn 2014, a double‐blind, placebo‐controlled randomised trial that included 6048 healthy normal birth weight neonates (> 2500 grams), randomly assigned infants in a 1:1:1 ratio to three different treatment groups: 50,000 IU of vitamin A; 25,000 IU of vitamin A; or placebo, concurrent with BCG vaccination.
Recent studies conducted in Ghana, Tanzania, India and Pakistan aimed to evaluate the effect of neonatal supplementation of 50,000 IU of vitamin A against control. All four studies were randomised, double‐blind, placebo‐controlled trials; the study conducted in Pakistan used a cluster‐randomised design.
Edmond 2015, Masanja 2015 and Mazumder 2015 recruited participants who were at least two hours old; were identified at home or in facilities on the day of birth or over the next two days; were able to feed orally; were likely to stay in the study area for at least six months; and had received parental consent to participate. In all three studies, infant and maternal baseline characteristics were similar between intervention and control groups. Investigators conducted Edmond 2015 in seven contiguous districts in the Brong Ahafo region of central rural Ghana, with a sample size of 22,955 neonates; Masanja 2015, in the Morogoro and Dar es Salaam regions of Tanzania, with a sample size of 31,999 neonates; and Mazumder 2015, in two districts (Faridabad and Palwal) in the state of Haryana, India, with a sample size of 44,984 neonates. Masanja 2015 and Mazumder 2015 considered infants from both singleton and multiple births as eligible for enrolment.
Soofi and colleagues conducted a community‐based, cluster‐randomised, placebo‐controlled trial in two districts (Sukkhur and Jehlum) of rural Pakistan (Bhutta 2016). All live‐born infants within participating villages were potentially eligible for inclusion, and infants with obvious congenital malformations and birth weight less than 1500 grams were ineligible. Investigators randomised a total of 11,028 consecutively delivered neonates to receive vitamin A or placebo. Baseline characteristics of the two study arms were comparable.
See the Characteristics of included studies table for additional details.
Ongoing studies
McDonald 2014 is a double‐blind, randomised, placebo‐controlled trial conducted in a peri‐urban area of The Gambia. Researchers recruited two hundred mother‐infant pairs at the Sukuta Health Centre, a government health clinic in the Western coastal region of The Gambia. Inclusion criteria were singleton birth, birth weight ≥ 1500 grams, mothers over 18 years of age, residency within the study area and administration of birth vaccinations and vitamin A supplementation within 48 hours of birth. Exclusion criteria were infants with a congenital disease, a serious infection at birth or inability to feed, and mothers who were seriously ill at the time of enrolment, were participating in other studies and/or were HIV positive. Within 48 hours of birth, investigators randomised neonates to receive an oral dose of 50,000 IU vitamin A or placebo. The primary outcome is frequency of circulating T regulatory (Treg) cells expressing gut homing receptors in infants at 17 weeks post supplementation. Secondary outcomes are differences in thymus size, B cell immune responses and improved mucosal barrier function in infant participants. Recruitment and follow‐up for this study are complete and data analysis is in progress.
See the Characteristics of ongoing studies table for additional details.
Excluded studies
We excluded five studies from the review (Ahmad 2014; Bezzera 2009; Bhaskaram 1998; Mathew 2015; Schmiedchen 2016). Bezzera 2009 provided vitamin A supplementation to mothers only in the immediate postpartum period and did not supplement neonates. Bhaskaram 1998 supplemented only mothers with vitamin A within 24 hours of delivery and gave all neonates oral poliovirus vaccine (OPV) between 48 and 72 hours after birth. Ahmad 2014 reported no relevant outcomes. Mathew 2015 was a commentary on an included study (Mazumder 2015). Schmiedchen 2016 included infants with birth weight < 1500 grams and gestational age < 33 weeks.
Risk of bias in included studies
Allocation
Eight studies adequately randomised neonates to treatment groups (Benn 2008; Benn 2010; Benn 2014; Bhutta 2016; Edmond 2015; Malaba 2005; Masanja 2015; Mazumder 2015) and provided a clear description of the method used to generate the randomisation sequence. Four studies did not provide sufficient details to allow judgement of the adequacy of study methods (Humphrey 1996; Klemm 2008; Rahmathullah 2003; West 1995). Nine studies clearly described the method of allocation concealment (Benn 2008; Benn 2010; Benn 2014; Bhutta 2016; Edmond 2015; Humphrey 1996; Malaba 2005; Masanja 2015; Mazumder 2015), whereas Klemm 2008, Rahmathullah 2003 and West 1995 did not provide sufficient details.
Blinding
All included studies clearly described and achieved blinding of participants, study personnel and outcome assessors.
Incomplete outcome data
Rates of postrandomisation attrition and exclusion of participants were as follows: 1.6% (Benn 2008), 18.7% (Benn 2010), 1.87% (Benn 2014), 6.7% (Bhutta 2016), 1.1% (Edmond 2015), 11% (Humphrey 1996), 7% (Klemm 2008), 41.8% (Malaba 2005), 3.5% (Masanja 2015), 0.1% (Mazumder 2015) and 18.9% (Rahmathullah 2003); papers described reasons for attrition and exclusion of participants. West 1995 reported exclusion and attrition of 1.04% and provided no details.
Selective reporting
Evaluation of selective outcome reporting by review of trial registration documents, if available, or of methods presented in published papers revealed that all trials had reported findings for prespecified or expected outcomes, except for Humphrey 1996, for which reporting was unclear.
Other potential sources of bias
We identified three trials with potentially high risk of other bias: Benn 2008 and Benn 2010 conducted post hoc analyses after assuming that vitamin A might be more beneficial to boys, whereas Klemm 2008 was terminated after randomisation of two‐thirds of the planned number of infants owing to significantly higher mortality in the control group. We found Malaba 2005 to be free of other bias and determined that risk of other bias was uncertain in the remaining eight trials owing to insufficient information (Benn 2014; Bhutta 2016; Edmond 2015; Humphrey 1996; Masanja 2015; Mazumder 2015; Rahmathullah 2003; West 1995).
See the Characteristics of included studies table for additional details on risk of bias in included studies. We have provided in Figure 2 a graphical presentation of our individual judgements per item per study and a summary graph in Figure 3.

Methodological quality summary: review authors' judgements about each methodological quality item for each included study.

Methodological quality graph: review authors' judgements about each methodological quality item presented as percentages across all included studies.
Effects of interventions
We have included in this review summary of findings Table for the main comparison based on outcomes in term neonates, which was prepared in accordance with the method recommended by GRADE (summary of findings Table for the main comparison).
Neonatal vitamin A supplementation versus placebo
Primary outcomes
All‐cause infant mortality at six months of age
We have presented in Table 1 an overview of the type and source of data for this outcome.
| Study ID | Analyzed as rate/risk ratio | Data source (term/all infants) | Infants | Vitamin A group: deaths | Vitamin A group: child‐years of follow‐up | Vitamin A group: n | Control group: deaths | Control group: child‐years of follow‐up | Control group: n |
| Rate ratio/ risk ratio | Correspondence with study investigators; published paper | All infants | 55 | 964 | 2106 | 50 | 1003 | 2169 | |
| Rate ratio/risk ratio | Correspondence with study investigators; published paper | All infants | 62 | 393 | 854 | 62 | 397 | 863 | |
| ‐ | ‐ | ‐ | ‐ | ‐ | ‐ | ‐ | ‐ | ‐ | |
| Risk ratio | Soofi et al (unpublished data) | All infants | 128 | ‐ | 5648 | 115 | ‐ | 5380 | |
| All infants ‐ male | 58 | ‐ | 2966 | 49 | ‐ | 2774 | |||
| All infants ‐ female | 70 | ‐ | 2682 | 66 | ‐ | 2606 | |||
| Risk ratio | Edmond et al (Lancet 2015;385:1315–23) | All infants | 278 | ‐ | 11,345 | 248 | ‐ | 11,353 | |
| All infants ‐ male | 150 | ‐ | 5802 | 124 | ‐ | 5715 | |||
| All infants ‐ female | 128 | ‐ | 5543 | 124 | ‐ | 5638 | |||
| Risk ratio | Correspondence with study investigators (denominators are numbers of neonates randomised) | All infants | 7 | ‐ | 1034 | 18 | ‐ | 1033 | |
| Term infants | 6 | ‐ | 1011 | 15 | ‐ | 1007 | |||
| Risk ratio | Klemm et al (Pediatrics 2008;122:e242‐50) | All infants | 306 | ‐ | 7953 | 360 | ‐ | 7984 | |
| Term infants | 129 | ‐ | 6109 | 171 | ‐ | 6061 | |||
| All infants ‐ male | 169 | ‐ | 4117 | 185 | ‐ | 4020 | |||
| All infants ‐ female | 137 | ‐ | 3836 | 175 | ‐ | 3964 | |||
| Risk ratio | Correspondence with study investigators. Data aggregated for the 4 treatment groups: maternal vitamin A and infant vitamin A + maternal placebo and infant vitamin A vs maternal placebo and infant placebo + maternal vitamin A and infant placebo (for term infants, denominators are numbers of HIV‐negative mothers with term deliveries) | All infants | 73 | ‐ | 4309 | 66 | ‐ | 4352 | |
| Term infants | 62 | ‐ | 4253 | 57 | ‐ | 4280 | |||
| Rate ratio/ risk ratio | Masanja et al (Lancet 2015;385:1324‐32) | All infants | 407 | 7521 | 15,428 | 372 | 7542 | 15,464 | |
| All infants ‐ male | 233 | 3960 | 8135 | 215 | 3927 | 8070 | |||
| All infants ‐ female | 174 | 3559 | 7291 | 157 | 3614 | 7392 | |||
| Risk ratio | Muzumder et al (Lancet 2015;385:1333–42) | All infants | 656 | ‐ | 22,493 | 726 | ‐ | 22,491 | |
| All infants ‐ male | 293 | ‐ | 11,689 | 310 | ‐ | 11,729 | |||
| All infants ‐ female | 363 | ‐ | 10,804 | 416 | ‐ | 10,762 | |||
| Rate ratio/ risk ratio | Rahmathullah et al (BMJ 2003;327(7409):254) | All infants | 146 | 2713 | 5363 | 188 | 2719.1 | 5408 | |
| Correspondence with study investigators | Term infants | 106 | 2348.7 | ‐ | 130 | 2346.7 | ‐ | ||
| Rahmathullah et al (BMJ 2003;327(7409):254) | All infants ‐ male | 68 | 1378.2 | ‐ | 100 | 1412.3 | ‐ | ||
| Rahmathullah et al (BMJ 2003;327(7409):254) | All infants ‐ female | 78 | 1334.8 | ‐ | 88 | 1306.7 | ‐ | ||
| Rate ratio/ risk ratio | West et al (American Journal of Clinical Nutrition 1995;62:143‐8). Data were extracted for infants under 1 month old who had been allocated to treatment | All infants | 38 | 268.4 | 819 | 34 | 256.9 | 785 |
aBhutta 2016 was a cluster‐randomised study. Study investigators reported that observed design effect and intracluster coefficient (ICC) for infant mortality at 6 months were 1.26666 and 0.00978
bKlemm 2008 was a cluster‐randomised study. Study authors reported that observed design effect was 0.9%
cWest 1995 was a cluster‐randomised study. Study authors reported that 95% confidence intervals of effect estimates were inflated by 10% to account for the impact of the design on the study. We estimated that the 10% increase in 95% CIs gave an ICC of 0.04 for the cohort of infants administered vitamin A
Ten included studies (Benn 2008; Benn 2010; Bhutta 2016; Edmond 2015; Humphrey 1996; Klemm 2008; Malaba 2005; Masanja 2015; Mazumder 2015; Rahmathullah 2003) measured infant mortality at six months of age. West 1995 measured mortality at four months of age, and we have included these data in the six‐month mortality analysis.
All‐cause infant mortality at six months of age: risk ratios based on cumulative risk (%) (Outcome 1.1)
Eleven studies measured data as risk ratios based on cumulative risk.
The pooled estimate of data for term infants from three studies (Humphrey 1996; Klemm 2008; Malaba 2005) suggests that risk of death from any cause at six months of age for neonates supplemented with vitamin A is 20% lower than for control infants and was not statistically significant (pooled risk ratio 0.80, 95% CI 0.54 to 1.18; Analysis 1.1.1). The level of statistical heterogeneity in this analysis was 63%. As the number of studies included was small, we considered a subgroup analysis to investigate heterogeneity as not reliable. Given substantial statistical heterogeneity and the small number of included studies, the reader should interpret these findings with caution.
The pooled estimate of data for all infants from 11 studies (Benn 2008; Benn 2010; Bhutta 2016; Edmond 2015; Humphrey 1996; Klemm 2008; Malaba 2005; Masanja 2015; Mazumder 2015; Rahmathullah 2003; West 1995) showed no evidence of a significant effect on risk of death from any cause for neonates supplemented with vitamin A as compared with control neonates (typical risk ratio 0.98, 95% CI 0.89 to 1.07). The level of statistical heterogeneity for this analysis was 47% (Analysis 1.1.2).
For gender‐specific subanalyses, the pooled estimate of data for all male infants from five studies (Bhutta 2016; Edmond 2015; Klemm 2008; Masanja 2015; Mazumder 2015) showed no evidence of a significant effect (typical risk ratio 1.01, 95% CI 0.92 to 1.12). The level of statistical heterogeneity for this analysis was less than 50% (I2 = 11%; Analysis 1.1.3). Likewise, analysis of data for all female infants from five studies (Bhutta 2016; Edmond 2015; Klemm 2008; Masanja 2015; Mazumder 2015) did not reach statistical significance (typical risk ratio 0.95, 95% CI 0.84 to 1.08; I2 = 41%; Analysis 1.1.4).
For the analysis based on geographic region, the pooled estimate from studies conducted in Asia showed a statistically significant reduction in risk of mortality at six months (typical risk ratio 0.89, 95% CI 0.80, 0.99; I2 = 29%), whereas the pooled estimate from studies conducted in Africa indicated higher risk of mortality at six months (P = 0.05; typical risk ratio 1.10, 95% CI 1.00 to 1.21; I2 = 0%).
All‐cause infant mortality at six months of age: rate ratios (per years of follow‐up) (Outcome 1.2)
We analysed data from five studies as rate ratios (per year of follow‐up).
Pooled estimates for term neonates from Benn 2008 and Rahmathullah 2003 showed no evidence of a significant effect on the rate of death from any cause at six months of age in those given vitamin A as compared with control neonates (typical rate ratio 0.93, 95% CI 0.67 to 1.30; Analysis 1.2.1). Analysis of data for all infants from five studies (Benn 2008; Benn 2010; Masanja 2015; Rahmathullah 2003; West 1995) did not show statistical significance (typical rate ratio 0.99, 95% CI 0.84 to 1.17; Analysis 1.2.2). Levels of statistical heterogeneity were as follows: I2 = 51% and 46% for analyses of term and all infants, respectively.
For gender‐specific subanalyses, the pooled estimate of data for all male infants from two studies (Masanja 2015; Rahmathullah 2003) showed no evidence of a significant effect on the rate of death from any cause at six months of age in those who received vitamin A as compared with control infants (typical rate ratio 0.88, 95% CI 0.58 to 1.35; Analysis 1.2.3). Analysis of data for all female infants from two studies (Masanja 2015; Rahmathullah 2003) also did not show statistical significance (typical rate ratio 1.01, 95% CI 0.79 to 1.30; Analysis 1.2.4). Levels of statistical heterogeneity were as follows: 12 = 82% and 46% for analyses of all male infants and all female infants, respectively.
For geography‐specific subanalyses, the pooled estimate from two studies conducted in Asia showed a non‐significant effect on the rate of mortality at six months (typical rate ratio 0.85, 95% CI 0.64 to 1.13; I2 = 33%). Similarly, a pooled estimate from three studies conducted in Africa showed no significant impact on mortality at six months (typical rate ratio 1.09, 95% CI 0.96 to 1.23; I2 = 0%).
All‐cause infant mortality at 12 months of age
We have presented in Table 2 an overview of the type and source of data for this outcome.
| Study ID | Analyzed as rate/risk ratio | Data source | Infants | Vitamin A group: deaths | Vitamin A group: child‐years of follow‐up | Vitamin A group: n | Control group: deaths | Control group: child‐years of follow‐up | Control group: n |
| Rate ratio/risk ratio | Benn et al (BMJ 2008;336(7658):1416‐20) | All infants | 88 | 1795 | 2106 | 86 | 1884 | 2169 | |
| Rate ratio/risk ratio | Benn et al (BMJ 2010;340:c1101) | All infants | 83 | 757 | 701 | 78 | 762 | 710 | |
| Rate ratio/risk ratio | Benn et al (Journal of Nutrition 2014;144:1474‐9) | All infants | 115 | 2744 | 3948 | 45 | 1377 | 1987 | |
| All infants ‐ male | 63 | 1406 | ‐ | 24 | 724 | ‐ | |||
| All infants ‐ female | 52 | 1339 | ‐ | 21 | 653 | ‐ | |||
| ‐ | ‐ | ‐ | ‐ | ‐ | ‐ | ‐ | ‐ | ‐ | |
| Risk ratio | Edmond et al (Lancet 2015;385:1315–23) | All infants | 371 | ‐ | 11,133 | 328 | ‐ | 11,158 | |
| All infants ‐ male | 199 | ‐ | 5676 | 166 | ‐ | 5612 | |||
| All infants ‐ female | 172 | ‐ | 5457 | 162 | ‐ | 5546 | |||
| Rate ratio/risk ratio | Humphrey et al (Journal of Pediatrics 1996;128:489‐96) | All infants (include 6% preterms) | 7 | 969.6 | 925 | 19 | 957.1 | 914 | |
| All infants ‐ male | 2 | 505.8 | ‐ | 13 | 492.1 | ‐ | |||
| All infants ‐ female | 5 | 463.9 | ‐ | 6 | 465 | ‐ | |||
| ‐ | ‐ | ‐ | ‐ | ‐ | ‐ | ‐ | ‐ | ‐ | |
| Rate ratio/ Risk ratio | Malaba et al (American Journal of Clinical Nutrition 2005;81:454‐60). Data aggregated for the 4 treatment groups: maternal vitamin A and infant vitamin A + maternal placebo and infant vitamin A vs maternal placebo and infant placebo + maternal vitamin A and infant placebo | All infants | 88 | 4195 | 4079 | 82 | 4239 | 4127 | |
| Rate ratio/ Risk ratio | Masanja et al (Lancet 2015;385:1324‐32) | All infants | 566 | 15,010 | 14,686 | 546 | 15,059 | 14,749 | |
| All infants ‐ male | 312 | 7899 | 7745 | 324 | 7833 | 7713 | |||
| All infants ‐ female | 254 | 7108 | 6939 | 222 | 7223 | 7034 | |||
| Risk ratio | Muzumder et al (Lancet 2015;385:1333–42) | All infants | 879 | ‐ | 22,493 | 939 | ‐ | 22,491 | |
| All infants ‐ male | 371 | ‐ | 11,689 | 396 | ‐ | 11,729 | |||
| All infants ‐ female | 508 | ‐ | 10,804 | 543 | ‐ | 10,762 | |||
| ‐ | ‐ | ‐ | ‐ | ‐ | ‐ | ‐ | ‐ | ‐ | |
| ‐ | ‐ | ‐ | ‐ | ‐ | ‐ | ‐ | ‐ | ‐ |
Eight included studies (Benn 2008; Benn 2010; Benn 2014; Edmond 2015; Humphrey 1996; Malaba 2005; Masanja 2015; Mazumder 2015) measured infant mortality at 12 months of age.
All‐cause infant mortality at 12 months of age: risk ratios based on cumulative risk (%) (Outcome 1.3)
Eight studies measured data as risk ratios based on cumulative risk. The pooled estimate of data for all infants from the eight studies (Benn 2008; Benn 2010; Edmond 2015; Humphrey 1996; Malaba 2005; Masanja 2015; Mazumder 2015) showed no evidence of a significant effect on risk of death from any cause at 12 months of age for neonates supplemented with vitamin A as compared with control neonates (typical risk ratio 1.04, 95% CI 0.94 to 1.15). The level of statistical heterogeneity for this analysis was less than 50% (I2 = 47%; Analysis 1.3.1).
For gender‐specific subanalyses, the pooled estimate of data for all male infants from three studies (Edmond 2015; Masanja 2015; Mazumder 2015) showed no evidence of a significant effect on risk of death from any cause at 12 months of age for neonates supplemented with vitamin A as compared with control neonates (typical risk ratio 1.00, 95% CI 0.88 to 1.14). The level of statistical heterogeneity for this analysis was less than 50% (I2 = 46%; Analysis 1.3.2). Analysis of the data for all female infants from three studies (Edmond 2015; Masanja 2015; Mazumder 2015) also did not show statistical significance (typical risk ratio 1.04, 95% CI 0.90 to 1.20). The level of statistical heterogeneity for this analysis was 56% (Analysis 1.3.3).
For geography‐specific analyses, the pooled estimate of data from studies conducted in Asia showed no evidence of a significant effect on risk of death from any cause at 12 months of age (typical risk ratio 0.65, 95% CI 0.26 to 1.60; I2 = 78%). The pooled estimate for studies conducted in Africa showed an indication of higher risk of mortality at 12 months of age (typical risk ratio 1.08, 95% CI 1.00 to 1.17; I2 = 0%).
All‐cause infant mortality at 12 months of age: rate ratios (per years of follow up) (Outcome 1.4)
We analysed data from six studies as rate ratios (per year of follow‐up).
Analysis of term neonate data from three studies expressed as rate ratios (Benn 2008; Benn 2014; Humphrey 1996) showed no evidence of a significant effect on infant mortality from any cause at 12 months of age among neonates supplemented with vitamin A as compared with control infants, with statistical heterogeneity of 72% (typical rate ratio 0.94, 95% CI 0.59 to 1.50; Analysis 1.4.1). The pooled estimate of data for all infants from six studies (Benn 2008; Benn 2010; Benn 2014; Humphrey 1996;Malaba 2005;Masanja 2015) also did not reach statistical significance (typical rate ratio 1.06, 95% CI 0.92 to 1.22; Analysis 1.4.2). The level of statistical heterogeneity was lower than 50% (I2 = 31%).
Analysis of data for all male infants from five studies (Benn 2008; Benn 2010; Benn 2014; Humphrey 1996; Masanja 2015) showed no evidence of a significant effect of supplementation of neonates with vitamin A on infant mortality at 12 months of age compared with control (typical rate ratio 0.89, 95% CI 0.66 to 1.19; Analysis 1.4.3). In contrast, the pooled estimate for all female infants from five studies (Benn 2008; Benn 2010; Benn 2014; Humphrey 1996; Masanja 2015) did reach statistical significance (typical rate ratio 1.21, 95% CI 1.05 to 1.41; Analysis 1.4.3). However, differences between subgroups were not statistically significant (P = 0.06). Levels of statistical heterogeneity included the following: 12 = 58% and 0% for analyses of all male infants and all female infants, respectively.
For geography‐specific analyses, the pooled estimate of data from three studies conducted in Asia showed no evidence of a significant effect on risk of death from any cause at 12 months of age (typical rate ratio 0.94, 95% CI 0.69 to 1.29; I2 = 65%). Similarly, the estimate for three studies conducted in Africa showed no impact on mortality at 12 months of age (typical rate ratio 1.13, 95% CI 0.94 to 1.36; I2 = 0%).
Secondary outcomes
Cause‐specific infant mortality at six months of age: diarrhoea and acute respiratory infection (Outcomes 1.5 and 1.6)
Two studies (Humphrey 1996; Rahmathullah 2003) measured infant mortality related to diarrhoea and acute respiratory infection at six months of age. Investigators in Humphrey 1996 provided data for all infants as risk ratios based on cumulative risk, which showed no significant effect of vitamin A supplementation on diarrhoea and respiratory infection as compared with control (diarrhoea‐specific infant mortality: risk ratio 0.20, 95% CI 0.02 to 1.68; acute respiratory infection‐specific infant mortality: risk ratio 0.66, 95% CI 0.11 to 3.91). Rahmathullah 2003 presented data for all infants as rate ratios (per years of follow‐up) and showed a similar non‐significant effect of vitamin A on rates of diarrhoea‐specific and acute respiratory infection‐specific infant mortality at six months of age as compared with control (diarrhoea‐specific infant mortality: rate ratio 0.67, 95% CI 0.32 to 1.39; acute respiratory infection‐specific infant mortality: rate ratio 1.00, 95% CI 0.56 to 1.79).
Cause‐specific infant mortality at 12 months of age: diarrhoea and acute respiratory infection (Outcomes 1.7 and 1.8)
Three studies (Benn 2008; Humphrey 1996; Malaba 2005) measured infant mortality related to diarrhoea and acute respiratory infection at 12 months of age.
Humphrey 1996 provided data for all infants as risk ratios based on cumulative risk and showed no evidence of a significant effect of vitamin A on death due to diarrhoea and acute respiratory infection as compared with control (diarrhoea‐specific infant mortality: risk ratio 0.40, 95% CI 0.08 to 2.03; acute respiratory infection‐specific infant mortality: risk ratio 0.66, 95% CI 0.11 to 3.95). Benn 2008 and Malaba 2005 analysed data for all infants as rate ratios. Pooled data provided no evidence of a significant effect of vitamin A on diarrhoea‐specific and acute respiratory infection‐specific infant mortality at 12 months of age as compared with control (typical rate ratio 1.32, 95% CI 0.80 to 2.16; I2 = 0%; and rate ratio 0.97, 95% CI 0.67 to 1.42; I2 = 0%, respectively).
Cause‐specific infant morbidity at six months of age: diarrhoea and acute respiratory infection (Outcomes 1.9 and 1.10)
Three trials (Benn 2008; Malaba 2005; Rahmathullah 2003) measured infant morbidity at six months of age as rate ratios (per year of follow‐up). Pooled estimates showed no significant effect of vitamin A as compared with control on rates of diarrhoea and acute respiratory infection among infants at six months of age (typical rate ratio 0.89, 95% CI 0.69 to 1.14; I2 = 89%; and rate ratio 1.05, 95% CI 0.91 to 1.21; I2 = 85%, respectively). We did not consider performing a subgroup analysis to investigate heterogeneity because of the small number of studies contributing data to this analysis.
Vitamin A deficiency (Outcomes 1.11 and 1.12)
One study only (Benn 2008) reported vitamin A deficiency defined as serum retinol value < 0.70 µmol/L for all infants and showed no evidence of a significant effect of vitamin A supplementation on vitamin A deficiency as compared with control (at six weeks: risk ratio 0.94, 95% CI 0.75 to 1.19; at four months: risk ratio 1.02, 95% CI 0.64 to 1.62).
Anaemia (Outcome 1.13)
Only one study (Malaba 2005) measured the impact of the intervention on anaemia for all infants born to both HIV‐positive and HIV‐negative women. Vitamin A supplementation in neonates did not lead to a significant impact on anaemia (haemoglobin (Hb) < 105 g/L) at eight to 14 months of age (risk ratio 0.97, 95% CI 0.87 to 1.07) compared with control.
Adverse events (Outcomes 1.14 and 1.15)
We were able to pool data from five studies (Benn 2008; Edmond 2015; Humphrey 1996; Masanja 2015; Mazumder 2015) for adverse events in all infants during the first 48 to 72 hours, and only one study (Benn 2008) presented adverse events at one month of age (Analysis 1.14 and Analysis 1.15). Risk of a bulging fontanelle during the first 48 to 72 hours for neonates supplemented with vitamin A was 53% higher than for control neonates, and this finding is statistically significant (typical risk ratio 1.53, 95% CI 1.11 to 2.11; I2 = 71%). Pooled estimates from the five studies provided no evidence of a significant increase in diarrhoea (typical risk ratio 0.96, 95% CI 0.81 to 1.13) or vomiting (typical risk ratio 1.00, 95% CI 0.93 to 1.07) in the vitamin A group versus the control group. Likewise, analyses from three studies (Edmond 2015; Masanja 2015; Mazumder 2015) indicated no significant increase in fever (typical risk ratio 1.04, 95% CI 0.98 to 1.09), inability to suck or feed (typical risk ratio 1.00, 95% CI 0.81 to 1.23) and convulsions (typical risk ratio 1.12, 95% CI 0.66 to 1.88). Estimates from one study (Mazumder 2015) showed no statistically significant differences in excessive crying (typical risk ratio 0.99, 95% CI 0.93 to 1.05), jaundice (typical risk ratio 1.07, 95% CI 0.96 to 1.19), eye infection (typical risk ratio 0.99, 95% CI 0.88 to 1.12), skin infection (typical risk ratio 0.94, 95% CI 0.82 to 1.09), umbilical infection (typical risk ratio 0.97, 95% 0.81 to 1.15), respiratory infection (typical risk ratio 1.08, 95% 0.94 to 1.24), feeding problems (typical risk ratio 1.01, 95% 0.88 to 1.16) or other adverse events during the first 48 to 72 hours (typical risk ratio 0.93, 95% 0.84 to 1.02). Benn 2008 showed no evidence of a significant increase in adverse events during the first month post supplementation (diarrhoea: risk ratio 1.07, 95% CI 0.46 to 2.51; vomiting: risk ratio 1.22, 95% CI 0.57 to 2.58).
All‐cause neonatal mortality (Outcomes 1.16 and 1.17)
We have presented in Table 3 an overview of the type and source of data for this outcome.
| Study ID | Analyzed as rate/risk ratio | Data source | Infants | Vitamin A group: deaths | Vitamin A group: child‐years of follow‐up | Vitamin A group: n | Control group: deaths | Control group: child‐years of follow‐up | Control group: n |
| ‐ | ‐ | ‐ | ‐ | ‐ | ‐ | ‐ | ‐ | ‐ | |
| ‐ | ‐ | ‐ | ‐ | ‐ | ‐ | ‐ | ‐ | ‐ | |
| ‐ | ‐ | ‐ | ‐ | ‐ | ‐ | ‐ | ‐ | ‐ | |
| Risk ratio | Soofi et al (unpublished data) | All infants | 57 | ‐ | 5648 | 48 | ‐ | 5380 | |
| All infants ‐ male | 26 | ‐ | 2966 | 21 | ‐ | 2774 | |||
| All infants ‐ female | 31 | ‐ | 2682 | 27 | ‐ | 2606 | |||
| Risk ratio | Edmond et al (Lancet 2015;385:1315–23) | All infants | 147 | ‐ | 11,447 | 130 | ‐ | 11,459 | |
| All infants ‐ male | 79 | ‐ | 5857 | 69 | ‐ | 5768 | |||
| All infants ‐ female | 68 | ‐ | 5590 | 61 | ‐ | 5691 | |||
| ‐ | ‐ | ‐ | ‐ | ‐ | ‐ | ‐ | ‐ | ‐ | |
| Risk ratio | Klemm at al (Pediatrics 2008;122:e242‐50) | All infants | 222 | ‐ | 7953 | 250 | ‐ | 7984 | |
| ‐ | ‐ | ‐ | ‐ | ‐ | ‐ | ‐ | ‐ | ‐ | |
| Rate ratio/risk ratio | Masanja et al (Lancet 2015;385:1324‐32) | All infants | 213 | 1192 | 15,677 | 206 | 1194 | 15,710 | |
| All infants ‐ male | 124 | 628 | 8273 | 124 | 622 | 8198 | |||
| All infants ‐ female | 89 | 563 | 7402 | 82 | 572 | 7510 | |||
| Risk ratio | Mazumder et al (Lancet 2015;385:1333–42) | All infants | 281 | ‐ | 22,493 | 298 | ‐ | 22,491 | |
| All infants ‐ male | 124 | ‐ | 11,689 | 132 | ‐ | 11,729 | |||
| All infants ‐ female | 157 | ‐ | 10,804 | 166 | ‐ | 10,762 | |||
| ‐ | ‐ | ‐ | ‐ | ‐ | ‐ | ‐ | ‐ | ‐ | |
| ‐ | ‐ | ‐ | ‐ | ‐ | ‐ | ‐ | ‐ | ‐ |
Five included studies measured neonatal mortality in the first month of life (Bhutta 2016; Edmond 2015; Klemm 2008; Masanja 2015; Mazumder 2015). Investigators measured data for these five studies as risk ratios based on cumulative risk. The pooled estimate of data for all infants showed no evidence of a significant effect on risk of death from any cause at one month of age for neonates supplemented with vitamin A as compared with control neonates (typical risk ratio 0.99, 95% CI 0.90 to 1.08). Analyses for all male infants and for all female infants also did not reach statistical significance (male: typical risk ratio 1.01, 95% CI 0.87 to 1.17; female: typical risk ratio 1.03, 95% CI 0.89 to 1.19). The level of statistical heterogeneity for all three analyses was 0%.
Masanja 2015 analysed data as rate ratios (per year of follow‐up) and showed no significant effect on neonatal mortality for all infants (typical rate ratio 1.04, 95% CI 0.86 to 1.25), all male infants (typical rate ratio 0.99, 95% CI 0.77 to 1.27) or all female infants (typical rate ratio 1.10, 95% CI 0.82 to 1.49) supplemented with vitamin A as compared with control infants.
Other outcomes
Included studies did not measure the impact of neonatal vitamin A supplementation on blindness and xerophthalmia.
Discussion
Summary of main results
We conducted this review to compare the effect of supplementing term neonates with vitamin A as compared with not providing vitamin A supplementation. As term neonatal outcome data were available for only a small number of studies, and then for infant mortality outcomes only, we analysed and presented estimates for both term neonates (when specified) and all infants for various prespecified outcomes. Our analysis of data provided for all infants provided evidence of a non‐significant reduction in risk of death at six months of age in the vitamin A supplemented group as compared with the control group. Analysis of term neonatal outcomes included data from a subset of studies included in the all‐infant analysis and revealed a non‐significant reduction in risk of death in the first six months or 12 months of life. The reader should interpret these findings with caution because of the small number of studies contributing data to these analyses, statistical heterogeneity and wide confidence intervals that are close to the null effect. In addition to these results, our analysis of data from Asia on all infants based on geographical region showed a significant reduction in risk of death at six months as a result of vitamin A (reduction 11%; 95% confidence interval (CI) 1% to 20%). On the contrary, studies from Africa showed an effect that ranged from no impact to a 21% increase in risk of mortality. Overall, our review findings do not suggest a potential effect of this intervention on infant mortality.
Overall completeness and applicability of evidence
This review included a total of 12 trials conducted to evaluate the effect of vitamin A supplementation for neonates. These include all trials conducted to date to assess this intervention. Inclusion of these studies, which we identified through extensive searches of the literature and of additional data obtained by contacting study authors, represents the overall completeness of evidence.
Deficiency of vitamin A is a major nutritional concern in many countries of the world. All studies included in this review were conducted in low and middle income countries with varying levels of vitamin A deficiency and infant mortality. These studies have demonstrated a mix of effects on infant mortality resulting from supplementation with vitamin A, and studies conducted in areas with vitamin A deficiency indicate a potential beneficial effect of supplementation; however, studies conducted in regions with less deficiency suggest no benefit of supplementation and potential for harm.
Reasons for these conflicting findings are unclear, and data show no clear indication of the biological mechanisms through which vitamin A could lower risk of death when given during the neonatal period. Investigators have proposed various mechanisms. Newborns have marginal reserves of vitamin A in their liver, and they depend on breast milk as a source of this vitamin during the first few months of life. Hence, low maternal vitamin A levels translate into vitamin A deficiency among newborns (Underwood 1994). Deficiency of vitamin A could begin very early in life if colostrum is discarded or breastfeeding is inadequate. Colostrum and early breast milk have been found to be very rich sources of vitamin A that can significantly augment vitamin A stores among neonates (Wallingford 1986). Along with inadequate breastfeeding, introduction of artificial feeds hinders establishment of good breastfeeding practices, thereby denying infants this critical source of vitamin A throughout the breastfeeding period (Haskell 1999). Artificial feeds early in life also increase the risk of gastrointestinal infection among these infants. It has been proposed that vitamin A supplementation may have an impact on infant mortality through development and maintenance of the integrity of intestinal and respiratory epithelia, and by provision of enhanced local and systemic immunity (Sommer 1996; Tielsch 2008 ‐ a report on Rahmathullah 2003). These pathways may provide an explanation for the effect of supplementation in settings where the practice of discarding colostrum, the presence of inadequate breastfeeding or reports of artificial feeds and infections are common. Alternatively, early initiation of feeding of colostrum and exclusive breastfeeding could explain absence of a beneficial effect of vitamin A received as a supplement. However, in this review, we could not study these proposed mechanisms, as only a few included studies presented limited information on breastfeeding practices and the use of artificial feeds.
Limited data were available for the outcomes of cause‐specific mortality and morbidity and vitamin A deficiency, measured as serum retinol values in infants. Data on adverse events, specifically bulging fontanelle, vomiting or diarrhoea, were also limited and showed no significant increase within the first 48 to 72 hours of supplementation.
Quality of the evidence
We graded the evidence for most outcomes as high quality, with the exception of two outcomes that we scored as having low and very low quality: ‘diarrhoeal events during the first 48‐72 hours post supplementation’ and ‘all‐cause infant mortality at six months in term infants’, respectively (summary of findings Table for the main comparison). We downgraded the former outcome for inconsistency and imprecision, a moderate level of statistical heterogeneity (I2 = 58%) and wide confidence intervals, with the lower confidence limit indicating a 19% reduction in diarrhoeal events and the upper limit indicating a 13% increase. We downgraded the latter outcome, 'all‐cause infant mortality at six months in term infants', to very low quality, although the previous review judged this outcome as low quality. This change reflected adoption of a random‐effects model; the estimate changed from a risk ratio (RR) of 0.82 (95% CI 0.68 to 0.99) to an RR of 0.80 (95% CI 0.54 to 1.18), with the wider confidence interval indicating less precision. It should be noted that we considered the evidence for all‐cause infant mortality at six months in all infants as high quality, despite inclusion of three studies with the outcome for term infants. With the introduction of eight new studies into the analysis of data for all infants, the relative influence of the three previously included studies decreased. Unclear risk of bias from Klemm 2008 was no longer a reason to downgrade the quality of the entire analysis because it had little effect on the overall risk ratio. Likewise, heterogeneity was lower (I2 = 47%), and imprecision was not indicated as serious.
Potential biases in the review process
This update of the review includes additional data published since the time of the last update. We conducted an extensive literature search to identify new studies or new publications of previously included studies available since the last search was conducted. Two review authors independently screened the updated search for identification of studies, eligibility assessment, risk of bias evaluation and extraction of data from selected studies. Given that we applied the Cochrane methods described above, the findings of this review are unlikely to be affected by biases in the review process.
Agreements and disagreements with other studies or reviews
Considerable debate has surrounded the issue of supplementing neonates with vitamin A owing to conflicting study findings and variability in the results of pooled analyses (Abrams 2008; Bhutta 2008; Gogia 2009; Haider 2015; Sachdev 2008; Tielsch 2008). The current review includes most of the up‐to‐date data available on neonatal vitamin A supplementation and additional data provided when we contacted study authors.
Two of the included trials, one conducted in India (Rahmathullah 2003) and one in Bangladesh (Klemm 2008), examined a population characterised by high infant mortality and vitamin A deficiency. The trial in India showed a reduction of 22% in risk of infant mortality at six months, whereas the trial in Bangladesh showed a 15% reduction in risk of infant mortality in the vitamin A group compared with the control group. In the Indian setting, 5% to 6% of included women reported a history of night blindness, which is a clinical manifestation of vitamin A deficiency, and this event was not significantly different between the two groups (P = 0.26). Study authors noted that the impact of vitamin A supplementation on mortality was evident from two weeks of age and continued until three months, after which no further effect was apparent. The Bangladesh trial reported similar observations, including a difference in mortality among infants as early as after the first week of life that persisted until four months of age. Approximately 9.5% of pregnant women in each group reported night blindness during their most recent pregnancy. Investigators measured a subsample of this study population for serum retinol in the first trimester and showed suboptimal vitamin A status (defined as serum retinol < 1.05 µmol/L) in approximately 41% of women in the vitamin A group and 36% of those in the control group. These findings of an effect of vitamin A on risk of mortality between the early weeks of life until four months do indicate a common biological mechanism of vitamin A. Of the three large recent trials funded by the World Health Organization (WHO), the trial conducted in India by Mazumder et al examined a population with moderate vitamin A deficiency (about 40% of mothers in this setting had low vitamin A status). Researchers reported a significant reduction of 10% in risk of infant mortality at six months of age with vitamin A supplementation for neonates. This beneficial effect was evident in survival curves after a few weeks of supplementation and was sustained until 12 months of age. This study observed no significant interaction between the intervention effect and sex of the infant in terms of mortality at six months. Humphrey 1996, an Indonesian trial, was the first trial of vitamin A supplementation in neonates that was conducted as a safety trial. Although this trial had reported significant benefit for survival that was notable after the first month and became consistent after four months of birth, trial authors had noted that the mother included in the study had little vitamin A deficiency (based on serum retinol levels for a subset of the study population). The infant mortality rate in the control group (7.2 per 1000 child‐years) was well below that reported for families included in this study, which were relatively privileged (Humphrey 1996). Although serum retinol levels were adequate, these findings provide no information on hepatic reserves, which may have been low in this study group (Tielsch 2008).
Studies conducted in Nepal, Zimbabwe, Guinea Bissau, Ghana and Tanzania reported conflicting results. West 1995, the Nepal trial, was part of a larger vitamin A supplementation trial in preschool children. Infants supplemented during the neonatal period did not show a significant effect on infant mortality, which investigators evaluated at four months of age. Of note, this study setting was characterised by endemic vitamin A deficiency and high infant mortality. This finding contrasted with findings from other studies conducted in similar settings. Studies conducted in Zimbabwe (Malaba 2005) and Guinea Bissau (Benn 2008) reported non‐significant effects of vitamin A on both six‐month and 12‐month infant mortality outcomes. Benn and associates (Benn 2010) measured infant mortality in a study conducted in Guinea Bissau at 12 months and reported no effect on this outcome. The vitamin A status of mothers provided evidence of minimal deficiency in these study settings, with mean (± standard deviation (SD)) serum retinol values in a subset of Zimbabwean women in the control group of 1.09 (± 0.29) and 1.19 (± 0.42) µmol/L at six weeks postpartum. In Guinea Bissau, less than 1% of women had low retinol binding proteins (retinol binding proteins < 1.11 µmol/L). This study also measured serum retinol values among infants at six weeks and four months of age and found no evidence of an effect of vitamin A supplementation on vitamin A deficiency. An important feature of this trial is that all eligible children were provided free consultations and essential drugs for any illness during the first year of life. The mechanism through which vitamin A supplementation in children older than six months of age improves survival has been explained in part by a reduction in severity rather than the incidence of infection (Sommer 1996). We believe that provision of free consultations and essential drugs for illnesses in the Guinea Bissau trial masked any beneficial effect of vitamin A supplementation that might have occurred by reducing episodes of severe illness. Recent large trials in Ghana (Edmond 2015) and Tanzania (Masanja 2015) also reported no significant beneficial effect of vitamin A supplementation on infant mortality at six months. Results of these trials indicated potential for harm. Study sites for these recent studies included districts with long‐running demographic surveillance programmes for supplementation of women to address the problem of micronutrient deficiencies. As a result, less than 3% of women in Ghana and 5% to 8% of those in Tanzania had biochemical vitamin A deficiency.
This update also found differences in the effect of vitamin A supplementation for neonates on infant mortality at six months by geographic region, with studies conducted in Asia showing a beneficial effect of supplementation and those in Africa indicating potential for harm. Haider 2015 noted this in another pooled analysis of data. The reasons for possible differences in results of trials conducted in different geographic regions are uncertain. However, these findings could represent genuine differences in population‐attributable risks of micronutrient deficiencies. As noted above, studies included neonates of mothers with varying levels of baseline vitamin A deficiency, both low birth weight and normal birth weight neonates and varying rates of baseline infant mortality. These factors could affect the generalisability of study findings. It should be noted that in contrast to observed benefits of vitamin A supplementation among mothers in Nepal (West 1999), a large trial of maternal vitamin A supplementation in Ghana (Kirkwood 2010) reported no benefit.
Another concern raised by some trial authors is the presence of a differential effect of vitamin A supplementation for neonates on infant mortality by sex (Benn 2014). In the current review, we conducted a subgroup analysis by sex of the infant, when data were available. Although results showed no significant difference in infant mortality at six months of age, findings were statistically significantly different for infant mortality at 12 months, with significantly higher risk noted in the subgroup of female infants (RR 1.21, 95% CI 1.05 to 1.41). Benn 2014 reported similar findings in an assessment and pooled analysis of infant mortality among children six to 12 months of age; however, recent trials did not observe significant interaction of effects of interventions on infant mortality at six months by sex. Given these differences in study findings, additional research is warranted to further study this effect.
Study flow diagram: review update.
Methodological quality summary: review authors' judgements about each methodological quality item for each included study.
Methodological quality graph: review authors' judgements about each methodological quality item presented as percentages across all included studies.

Comparison 1 Neonatal vitamin A supplementation versus control, Outcome 1 All‐cause infant mortality at 6 months: risk ratios based on cumulative risk (%, adjusted for clustering).

Comparison 1 Neonatal vitamin A supplementation versus control, Outcome 2 All‐cause infant mortality at 6 months: rate ratios (per years of follow‐up).

Comparison 1 Neonatal vitamin A supplementation versus control, Outcome 3 All‐cause infant mortality at 12 months: risk ratios based on cumulative risk (%).

Comparison 1 Neonatal vitamin A supplementation versus control, Outcome 4 All‐cause infant mortality at 12 months: rate ratios (per years of follow‐up).

Comparison 1 Neonatal vitamin A supplementation versus control, Outcome 5 Cause‐specific infant mortality at 6 months (all infants): diarrhoea.

Comparison 1 Neonatal vitamin A supplementation versus control, Outcome 6 Cause‐specific infant mortality at 6 months (all infants): respiratory infection.

Comparison 1 Neonatal vitamin A supplementation versus control, Outcome 7 Cause‐specific infant mortality at 12 months (all infants): diarrhoea.

Comparison 1 Neonatal vitamin A supplementation versus control, Outcome 8 Cause‐speciifc infant mortality at 12 months (all infants): respiratory infection.

Comparison 1 Neonatal vitamin A supplementation versus control, Outcome 9 Infant morbidity at 6 months (rate ratio): diarrhoea.

Comparison 1 Neonatal vitamin A supplementation versus control, Outcome 10 Infant morbidity at 6 months (rate ratio): respiratory infection.

Comparison 1 Neonatal vitamin A supplementation versus control, Outcome 11 Vitamin A deficiency (serum retinol < 0.70 micromol/L) at 6 weeks of age.
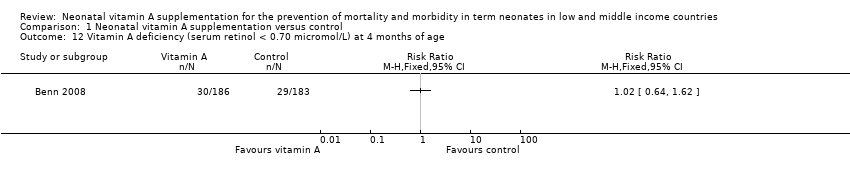
Comparison 1 Neonatal vitamin A supplementation versus control, Outcome 12 Vitamin A deficiency (serum retinol < 0.70 micromol/L) at 4 months of age.

Comparison 1 Neonatal vitamin A supplementation versus control, Outcome 13 Anaemia (haemoglobin < 105 g/L) at 8‐14 months of age.

Comparison 1 Neonatal vitamin A supplementation versus control, Outcome 14 Adverse events during the first 48‐72 hours post supplementation.
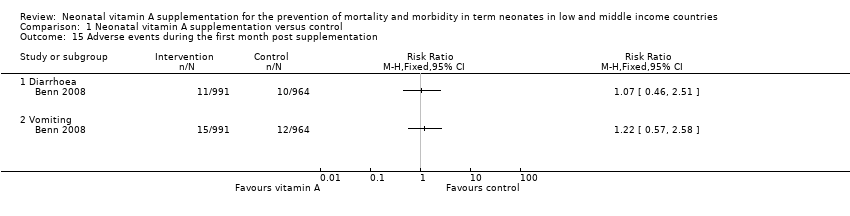
Comparison 1 Neonatal vitamin A supplementation versus control, Outcome 15 Adverse events during the first month post supplementation.

Comparison 1 Neonatal vitamin A supplementation versus control, Outcome 16 All‐cause neonatal mortality: risk ratios based on cumulative risk (%, adjusted for clustering).

Comparison 1 Neonatal vitamin A supplementation versus control, Outcome 17 All‐cause neonatal mortality: rate ratios (person‐years of follow‐up).
| Neonatal vitamin A supplementation versus control for prevention of mortality and morbidity in term neonates in low and middle income countries | ||||||
| Patient or population: mortality and morbidity in term neonates | ||||||
| Outcomes | Illustrative comparative risks* (95% CI) | Relative effect | Number of participants | Quality of the evidence | Comments | |
| Assumed risk | Corresponding risk | |||||
| Control | Neonatal vitamin A supplementation | |||||
| All‐cause infant mortality at 6 months: risk ratios based on cumulative risk (%, adjusted for clustering) ‐ term infants | Low‐risk population | RR 0.80 Risk ratios based on cumulative risk (%) | 22,721 | ⊕⊝⊝⊝ | The pooled estimate of data for term infants from 3 studies (Humphrey 1996; Klemm 2008; Malaba 2005) suggests that risk of death from any cause at 6 months of age for neonates who were supplemented with vitamin A was 20% lower than control and was not statistically significant (pooled RR 0.80, 95% CI 0.54 to 1.18; Analysis 1.1.1) The level of statistical heterogeneity in this analysis was 63%. As the number of studies included was small, a subgroup analysis to investigate heterogeneity was not considered reliable. Given substantial statistical heterogeneity and the small number of included studies, these findings should be interpreted with caution | |
| 13 per 1000 | 10 per 1000 | |||||
| Medium‐risk population | ||||||
| 15 per 1000 | 12 per 1000 | |||||
| High‐risk population | ||||||
| 28 per 1000 | 22 per 1000 | |||||
| All‐cause infant mortality at 6 months: risk ratios based on cumulative risk (%, adjusted for clustering) ‐ all infants | Low‐risk population | RR 0.98 (0.89 to 1.07) Risk ratios based on cumulative risk (%) | 154,634 (11 studies) | ⊕⊕⊕⊕ | The pooled estimate of data for all infants from 11 studies (Benn 2008; Benn 2010; Bhutta 2016; Edmond 2015; Humphrey 1996; Klemm 2008; Malaba 2005; Masanja 2015; Mazumder 2015; Rahmathullah 2003; West 1995) showed no evidence of a significant effect on risk of death from any cause for neonates supplemented with vitamin A as compared with controls (typical RR 0.98, 95% CI 0.89 to 1.07). The level of statistical heterogeneity for this analysis was 47% (Analysis 1.1.2) | |
| 13 per 1000 | 13 per 1000 | |||||
| Medium‐risk population | ||||||
| 15 per 1000 | 15 per 1000 | |||||
| High‐risk population | ||||||
| 28 per 1000 | 27 per 1000 | |||||
| All‐cause neonatal mortality: risk ratios based on cumulative risk (%, adjusted for clustering) ‐ all infants | Low‐risk population | RR 0.99 (0.90 to 1.08) Risk ratios based on cumulative risk (%) | 126,242 (5 studies) | ⊕⊕⊕⊕ | Five included studies measured neonatal mortality in the first month of life (Bhutta 2016; Edmond 2015; Klemm 2008; Masanja 2015; Mazumder 2015). Data from these 5 studies were measured as risk ratios based on cumulative risk. The pooled estimate of data for all infants showed no evidence of a significant effect on risk of death from any cause at 1 month of age for neonates supplemented with vitamin A as compared with controls (typical RR 0.99. 95% CI 0.90 to 1.08) | |
| Medium‐risk population | ||||||
| High‐risk population | ||||||
| Adverse events during first 48‐72 hours post supplementation ‐ bulging fontanelle | 7 per 1000 | 11 per 1000 | RR 1.53 | 100,256 | ⊕⊕⊕⊕ | Data for adverse events in all infants during the first 48 to 72 hours could be pooled from 5 studies (Benn 2008; Edmond 2015; Humphrey 1996; Masanja 2015; Mazumder 2015 ), and only 1 study (Benn 2008) presented adverse events at 1 month of age (Analysis 1.14 and Analysis 1.15) The risk of a bulging fontanelle during the first 48 to 72 hours for neonates supplemented with vitamin A was 53% higher than for controls, which is statistically significant (typical RR 1.53, 95% CI 1.11 to 2.11; I2 = 71%) |
| Adverse events during first 48‐72 hours post supplementation ‐ vomiting | 34 per 1000 | 34 per 1000 | RR 1.00 | 99,582 | ⊕⊕⊕⊕ | Typical RR 1.00 (95% CI 0.93 to 1.07) in vitamin A group vs control group |
| Adverse events during first 48‐72 hours post supplementation ‐ diarrhoea | 43 per 1000 | 41 per 1000 | RR 0.96 | 102,638 | ⊕⊕⊝⊝ | Pooled estimates from the 5 studies provided no evidence of a significant increase in diarrhoea (typical RR 0.96, 95% CI 0.81 to 1.13) |
| Vitamin A deficiency (serum retinol < 0.70 micromol/L) at 6 weeks of age | 331 per 1000 | 311 per 1000 | RR 0.94 (0.75 to 1.19) at 6 weeks | 612 | ⊕⊕⊕⊕ | Vitamin A deficiency defined as serum retinol value < 0.70 µmol/L was available for all infants from 1 study only (Benn 2008), which showed no evidence of a significant effect of vitamin A supplementation on vitamin A deficiency as compared with control at 6 weeks (RR 0.94, 95% CI 0.75 to 1.19) |
| Vitamin A deficiency (serum retinol < 0.70 micromol/L) at 4 months of age | 158 per 1000 | 162 per 1000 | RR 1.02 (0.64 to 1.62) at 4 months | 369 | ⊕⊕⊕⊕ | Vitamin A deficiency defined as serum retinol value < 0.70 µmol/L was available for all infants from 1 study only (Benn 2008), which provided no evidence of a significant effect of vitamin A supplementation on vitamin A deficiency as compared with control at 4 months (RR 1.02, 95% CI 0.64 to 1.62) |
| *The basis for the assumed risk (e.g. median control group risk across studies) is provided in footnotes. The corresponding risk (and its 95% confidence interval) is based on assumed risk in the comparison group and the relative effect of the intervention (and its 95% CI) | ||||||
| GRADE Working Group grades of evidence | ||||||
| aRisk of bias assessment identified a possible issue over the stopping procedure in Klemm 2008. A higher rate of mortality was observed in the placebo group after 2/3 participants had been randomised bThe lower confidence limit indicates a 46% reduction in mortality at 6 months, whereas the upper limit indicates an 18% increase cThe level of statistical heterogeneity between study results was moderate (I2 = 63%). Variation between studies may have been related to differences between study populations and settings in terms of infant mortality rates and baseline prevalence of vitamin A deficiency dAlthough level of statistical heterogeneity was substantial (I2 = 71%), all included studies indicated potential harm. Heterogeneity was caused by differences in strength of association among the included studies eModerate level of statistical heterogeneity (I2 = 58%) fThe lower confidence limit indicates a 19% reduction in diarrhoea, whereas the upper limit indicates a 13% increase gOnly one of the included studies reported this outcome at 6 weeks of age. Review authors noted that data reported on this outcome specified different time points and could not be formally used in the meta‐analysis hOnly 1 of the included studies reported this outcome at 4 months of age. Review authors noted that data reported on this outcome specified different time points and could not be formally used in the meta‐analysis | ||||||
| Study ID | Analyzed as rate/risk ratio | Data source (term/all infants) | Infants | Vitamin A group: deaths | Vitamin A group: child‐years of follow‐up | Vitamin A group: n | Control group: deaths | Control group: child‐years of follow‐up | Control group: n |
| Rate ratio/ risk ratio | Correspondence with study investigators; published paper | All infants | 55 | 964 | 2106 | 50 | 1003 | 2169 | |
| Rate ratio/risk ratio | Correspondence with study investigators; published paper | All infants | 62 | 393 | 854 | 62 | 397 | 863 | |
| ‐ | ‐ | ‐ | ‐ | ‐ | ‐ | ‐ | ‐ | ‐ | |
| Risk ratio | Soofi et al (unpublished data) | All infants | 128 | ‐ | 5648 | 115 | ‐ | 5380 | |
| All infants ‐ male | 58 | ‐ | 2966 | 49 | ‐ | 2774 | |||
| All infants ‐ female | 70 | ‐ | 2682 | 66 | ‐ | 2606 | |||
| Risk ratio | Edmond et al (Lancet 2015;385:1315–23) | All infants | 278 | ‐ | 11,345 | 248 | ‐ | 11,353 | |
| All infants ‐ male | 150 | ‐ | 5802 | 124 | ‐ | 5715 | |||
| All infants ‐ female | 128 | ‐ | 5543 | 124 | ‐ | 5638 | |||
| Risk ratio | Correspondence with study investigators (denominators are numbers of neonates randomised) | All infants | 7 | ‐ | 1034 | 18 | ‐ | 1033 | |
| Term infants | 6 | ‐ | 1011 | 15 | ‐ | 1007 | |||
| Risk ratio | Klemm et al (Pediatrics 2008;122:e242‐50) | All infants | 306 | ‐ | 7953 | 360 | ‐ | 7984 | |
| Term infants | 129 | ‐ | 6109 | 171 | ‐ | 6061 | |||
| All infants ‐ male | 169 | ‐ | 4117 | 185 | ‐ | 4020 | |||
| All infants ‐ female | 137 | ‐ | 3836 | 175 | ‐ | 3964 | |||
| Risk ratio | Correspondence with study investigators. Data aggregated for the 4 treatment groups: maternal vitamin A and infant vitamin A + maternal placebo and infant vitamin A vs maternal placebo and infant placebo + maternal vitamin A and infant placebo (for term infants, denominators are numbers of HIV‐negative mothers with term deliveries) | All infants | 73 | ‐ | 4309 | 66 | ‐ | 4352 | |
| Term infants | 62 | ‐ | 4253 | 57 | ‐ | 4280 | |||
| Rate ratio/ risk ratio | Masanja et al (Lancet 2015;385:1324‐32) | All infants | 407 | 7521 | 15,428 | 372 | 7542 | 15,464 | |
| All infants ‐ male | 233 | 3960 | 8135 | 215 | 3927 | 8070 | |||
| All infants ‐ female | 174 | 3559 | 7291 | 157 | 3614 | 7392 | |||
| Risk ratio | Muzumder et al (Lancet 2015;385:1333–42) | All infants | 656 | ‐ | 22,493 | 726 | ‐ | 22,491 | |
| All infants ‐ male | 293 | ‐ | 11,689 | 310 | ‐ | 11,729 | |||
| All infants ‐ female | 363 | ‐ | 10,804 | 416 | ‐ | 10,762 | |||
| Rate ratio/ risk ratio | Rahmathullah et al (BMJ 2003;327(7409):254) | All infants | 146 | 2713 | 5363 | 188 | 2719.1 | 5408 | |
| Correspondence with study investigators | Term infants | 106 | 2348.7 | ‐ | 130 | 2346.7 | ‐ | ||
| Rahmathullah et al (BMJ 2003;327(7409):254) | All infants ‐ male | 68 | 1378.2 | ‐ | 100 | 1412.3 | ‐ | ||
| Rahmathullah et al (BMJ 2003;327(7409):254) | All infants ‐ female | 78 | 1334.8 | ‐ | 88 | 1306.7 | ‐ | ||
| Rate ratio/ risk ratio | West et al (American Journal of Clinical Nutrition 1995;62:143‐8). Data were extracted for infants under 1 month old who had been allocated to treatment | All infants | 38 | 268.4 | 819 | 34 | 256.9 | 785 | |
| aBhutta 2016 was a cluster‐randomised study. Study investigators reported that observed design effect and intracluster coefficient (ICC) for infant mortality at 6 months were 1.26666 and 0.00978 | |||||||||
| Study ID | Analyzed as rate/risk ratio | Data source | Infants | Vitamin A group: deaths | Vitamin A group: child‐years of follow‐up | Vitamin A group: n | Control group: deaths | Control group: child‐years of follow‐up | Control group: n |
| Rate ratio/risk ratio | Benn et al (BMJ 2008;336(7658):1416‐20) | All infants | 88 | 1795 | 2106 | 86 | 1884 | 2169 | |
| Rate ratio/risk ratio | Benn et al (BMJ 2010;340:c1101) | All infants | 83 | 757 | 701 | 78 | 762 | 710 | |
| Rate ratio/risk ratio | Benn et al (Journal of Nutrition 2014;144:1474‐9) | All infants | 115 | 2744 | 3948 | 45 | 1377 | 1987 | |
| All infants ‐ male | 63 | 1406 | ‐ | 24 | 724 | ‐ | |||
| All infants ‐ female | 52 | 1339 | ‐ | 21 | 653 | ‐ | |||
| ‐ | ‐ | ‐ | ‐ | ‐ | ‐ | ‐ | ‐ | ‐ | |
| Risk ratio | Edmond et al (Lancet 2015;385:1315–23) | All infants | 371 | ‐ | 11,133 | 328 | ‐ | 11,158 | |
| All infants ‐ male | 199 | ‐ | 5676 | 166 | ‐ | 5612 | |||
| All infants ‐ female | 172 | ‐ | 5457 | 162 | ‐ | 5546 | |||
| Rate ratio/risk ratio | Humphrey et al (Journal of Pediatrics 1996;128:489‐96) | All infants (include 6% preterms) | 7 | 969.6 | 925 | 19 | 957.1 | 914 | |
| All infants ‐ male | 2 | 505.8 | ‐ | 13 | 492.1 | ‐ | |||
| All infants ‐ female | 5 | 463.9 | ‐ | 6 | 465 | ‐ | |||
| ‐ | ‐ | ‐ | ‐ | ‐ | ‐ | ‐ | ‐ | ‐ | |
| Rate ratio/ Risk ratio | Malaba et al (American Journal of Clinical Nutrition 2005;81:454‐60). Data aggregated for the 4 treatment groups: maternal vitamin A and infant vitamin A + maternal placebo and infant vitamin A vs maternal placebo and infant placebo + maternal vitamin A and infant placebo | All infants | 88 | 4195 | 4079 | 82 | 4239 | 4127 | |
| Rate ratio/ Risk ratio | Masanja et al (Lancet 2015;385:1324‐32) | All infants | 566 | 15,010 | 14,686 | 546 | 15,059 | 14,749 | |
| All infants ‐ male | 312 | 7899 | 7745 | 324 | 7833 | 7713 | |||
| All infants ‐ female | 254 | 7108 | 6939 | 222 | 7223 | 7034 | |||
| Risk ratio | Muzumder et al (Lancet 2015;385:1333–42) | All infants | 879 | ‐ | 22,493 | 939 | ‐ | 22,491 | |
| All infants ‐ male | 371 | ‐ | 11,689 | 396 | ‐ | 11,729 | |||
| All infants ‐ female | 508 | ‐ | 10,804 | 543 | ‐ | 10,762 | |||
| ‐ | ‐ | ‐ | ‐ | ‐ | ‐ | ‐ | ‐ | ‐ | |
| ‐ | ‐ | ‐ | ‐ | ‐ | ‐ | ‐ | ‐ | ‐ |
| Study ID | Analyzed as rate/risk ratio | Data source | Infants | Vitamin A group: deaths | Vitamin A group: child‐years of follow‐up | Vitamin A group: n | Control group: deaths | Control group: child‐years of follow‐up | Control group: n |
| ‐ | ‐ | ‐ | ‐ | ‐ | ‐ | ‐ | ‐ | ‐ | |
| ‐ | ‐ | ‐ | ‐ | ‐ | ‐ | ‐ | ‐ | ‐ | |
| ‐ | ‐ | ‐ | ‐ | ‐ | ‐ | ‐ | ‐ | ‐ | |
| Risk ratio | Soofi et al (unpublished data) | All infants | 57 | ‐ | 5648 | 48 | ‐ | 5380 | |
| All infants ‐ male | 26 | ‐ | 2966 | 21 | ‐ | 2774 | |||
| All infants ‐ female | 31 | ‐ | 2682 | 27 | ‐ | 2606 | |||
| Risk ratio | Edmond et al (Lancet 2015;385:1315–23) | All infants | 147 | ‐ | 11,447 | 130 | ‐ | 11,459 | |
| All infants ‐ male | 79 | ‐ | 5857 | 69 | ‐ | 5768 | |||
| All infants ‐ female | 68 | ‐ | 5590 | 61 | ‐ | 5691 | |||
| ‐ | ‐ | ‐ | ‐ | ‐ | ‐ | ‐ | ‐ | ‐ | |
| Risk ratio | Klemm at al (Pediatrics 2008;122:e242‐50) | All infants | 222 | ‐ | 7953 | 250 | ‐ | 7984 | |
| ‐ | ‐ | ‐ | ‐ | ‐ | ‐ | ‐ | ‐ | ‐ | |
| Rate ratio/risk ratio | Masanja et al (Lancet 2015;385:1324‐32) | All infants | 213 | 1192 | 15,677 | 206 | 1194 | 15,710 | |
| All infants ‐ male | 124 | 628 | 8273 | 124 | 622 | 8198 | |||
| All infants ‐ female | 89 | 563 | 7402 | 82 | 572 | 7510 | |||
| Risk ratio | Mazumder et al (Lancet 2015;385:1333–42) | All infants | 281 | ‐ | 22,493 | 298 | ‐ | 22,491 | |
| All infants ‐ male | 124 | ‐ | 11,689 | 132 | ‐ | 11,729 | |||
| All infants ‐ female | 157 | ‐ | 10,804 | 166 | ‐ | 10,762 | |||
| ‐ | ‐ | ‐ | ‐ | ‐ | ‐ | ‐ | ‐ | ‐ | |
| ‐ | ‐ | ‐ | ‐ | ‐ | ‐ | ‐ | ‐ | ‐ |
| Outcome or subgroup title | No. of studies | No. of participants | Statistical method | Effect size |
| 1 All‐cause infant mortality at 6 months: risk ratios based on cumulative risk (%, adjusted for clustering) Show forest plot | 11 | Risk Ratio (Random, 95% CI) | Subtotals only | |
| 1.1 Term infants | 3 | 22721 | Risk Ratio (Random, 95% CI) | 0.80 [0.54, 1.18] |
| 1.2 All infants | 11 | 154634 | Risk Ratio (Random, 95% CI) | 0.98 [0.89, 1.07] |
| 1.3 All infants ‐ male | 5 | 65017 | Risk Ratio (Random, 95% CI) | 1.01 [0.92, 1.12] |
| 1.4 All infants ‐ female | 5 | 60518 | Risk Ratio (Random, 95% CI) | 0.95 [0.84, 1.08] |
| 1.5 All infants ‐ Asia | 6 | 86391 | Risk Ratio (Random, 95% CI) | 0.89 [0.80, 0.99] |
| 1.6 All infants ‐ Africa | 5 | 68243 | Risk Ratio (Random, 95% CI) | 1.10 [1.00, 1.21] |
| 2 All‐cause infant mortality at 6 months: rate ratios (per years of follow‐up) Show forest plot | 5 | Rate Ratio (Random, 95% CI) | Subtotals only | |
| 2.1 Term infants | 2 | Rate Ratio (Random, 95% CI) | 0.93 [0.67, 1.30] | |
| 2.2 All infants | 5 | Rate Ratio (Random, 95% CI) | 0.99 [0.84, 1.17] | |
| 2.3 All infants ‐ male | 2 | Rate Ratio (Random, 95% CI) | 0.88 [0.58, 1.35] | |
| 2.4 All infants ‐ female | 2 | Rate Ratio (Random, 95% CI) | 1.01 [0.79, 1.30] | |
| 2.5 All infants ‐ Asia | 2 | Rate Ratio (Random, 95% CI) | 0.85 [0.64, 1.13] | |
| 2.6 All infants ‐ Africa | 3 | Rate Ratio (Random, 95% CI) | 1.09 [0.96, 1.23] | |
| 3 All‐cause infant mortality at 12 months: risk ratios based on cumulative risk (%) Show forest plot | 8 | Risk Ratio (M‐H, Random, 95% CI) | Subtotals only | |
| 3.1 All infants | 8 | 118376 | Risk Ratio (M‐H, Random, 95% CI) | 1.04 [0.94, 1.15] |
| 3.2 All infants ‐ male | 3 | 50164 | Risk Ratio (M‐H, Random, 95% CI) | 1.00 [0.88, 1.14] |
| 3.3 All infants ‐ female | 3 | 46542 | Risk Ratio (M‐H, Random, 95% CI) | 1.04 [0.90, 1.20] |
| 3.4 All infants ‐ Asia | 2 | 46823 | Risk Ratio (M‐H, Random, 95% CI) | 0.65 [0.26, 1.60] |
| 3.5 All infants ‐ Africa | 6 | 71553 | Risk Ratio (M‐H, Random, 95% CI) | 1.08 [1.00, 1.17] |
| 4 All‐cause infant mortality at 12 months: rate ratios (per years of follow‐up) Show forest plot | 6 | Rate Ratio (Random, 95% CI) | Subtotals only | |
| 4.1 Term infants | 3 | Rate Ratio (Random, 95% CI) | 0.94 [0.59, 1.50] | |
| 4.2 All infants | 6 | Rate Ratio (Random, 95% CI) | 1.06 [0.92, 1.22] | |
| 4.3 All infants ‐ male | 5 | Rate Ratio (Random, 95% CI) | 0.89 [0.66, 1.19] | |
| 4.4 All infants ‐ female | 5 | Rate Ratio (Random, 95% CI) | 1.21 [1.05, 1.41] | |
| 4.5 All infants ‐ Asia | 3 | Rate Ratio (Random, 95% CI) | 0.94 [0.69, 1.29] | |
| 4.6 All infants ‐ Africa | 3 | Rate Ratio (Random, 95% CI) | 1.13 [0.94, 1.36] | |
| 5 Cause‐specific infant mortality at 6 months (all infants): diarrhoea Show forest plot | 2 | (Fixed, 95% CI) | Totals not selected | |
| 5.1 Risk ratio | 1 | (Fixed, 95% CI) | 0.0 [0.0, 0.0] | |
| 5.2 Rate ratio | 1 | (Fixed, 95% CI) | 0.0 [0.0, 0.0] | |
| 6 Cause‐specific infant mortality at 6 months (all infants): respiratory infection Show forest plot | 2 | (Fixed, 95% CI) | Totals not selected | |
| 6.1 Risk ratio | 1 | (Fixed, 95% CI) | 0.0 [0.0, 0.0] | |
| 6.2 Rate ratio | 1 | (Fixed, 95% CI) | 0.0 [0.0, 0.0] | |
| 7 Cause‐specific infant mortality at 12 months (all infants): diarrhoea Show forest plot | 3 | (Fixed, 95% CI) | Subtotals only | |
| 7.1 Risk ratios | 1 | (Fixed, 95% CI) | 0.40 [0.08, 2.03] | |
| 7.2 Rate ratios | 2 | (Fixed, 95% CI) | 1.32 [0.80, 2.16] | |
| 8 Cause‐speciifc infant mortality at 12 months (all infants): respiratory infection Show forest plot | 3 | (Fixed, 95% CI) | Subtotals only | |
| 8.1 Risk ratios | 1 | (Fixed, 95% CI) | 0.66 [0.11, 3.95] | |
| 8.2 Rate ratios | 2 | (Fixed, 95% CI) | 0.97 [0.67, 1.42] | |
| 9 Infant morbidity at 6 months (rate ratio): diarrhoea Show forest plot | 3 | Rate ratio (Random, 95% CI) | 0.89 [0.69, 1.14] | |
| 9.1 All Diarrhoea | 3 | Rate ratio (Random, 95% CI) | 0.89 [0.69, 1.14] | |
| 10 Infant morbidity at 6 months (rate ratio): respiratory infection Show forest plot | 2 | Rate ratio (Random, 95% CI) | 1.05 [0.91, 1.21] | |
| 11 Vitamin A deficiency (serum retinol < 0.70 micromol/L) at 6 weeks of age Show forest plot | 1 | Risk Ratio (M‐H, Fixed, 95% CI) | Totals not selected | |
| 12 Vitamin A deficiency (serum retinol < 0.70 micromol/L) at 4 months of age Show forest plot | 1 | Risk Ratio (M‐H, Fixed, 95% CI) | Totals not selected | |
| 13 Anaemia (haemoglobin < 105 g/L) at 8‐14 months of age Show forest plot | 1 | Risk Ratio (M‐H, Fixed, 95% CI) | Totals not selected | |
| 14 Adverse events during the first 48‐72 hours post supplementation Show forest plot | 5 | Risk Ratio (M‐H, Random, 95% CI) | Subtotals only | |
| 14.1 Bulging fontanelle | 5 | 100256 | Risk Ratio (M‐H, Random, 95% CI) | 1.53 [1.11, 2.11] |
| 14.2 Diarrhoea | 5 | 102638 | Risk Ratio (M‐H, Random, 95% CI) | 0.96 [0.81, 1.13] |
| 14.3 Vomiting | 5 | 99582 | Risk Ratio (M‐H, Random, 95% CI) | 1.00 [0.93, 1.07] |
| 14.4 Fever | 3 | 96865 | Risk Ratio (M‐H, Random, 95% CI) | 1.04 [0.98, 1.09] |
| 14.5 Inability to suck or feed | 3 | 96598 | Risk Ratio (M‐H, Random, 95% CI) | 1.00 [0.81, 1.23] |
| 14.6 Convulsions | 3 | 96853 | Risk Ratio (M‐H, Random, 95% CI) | 1.12 [0.66, 1.88] |
| 14.7 Excessive crying | 1 | 44961 | Risk Ratio (M‐H, Random, 95% CI) | 0.99 [0.93, 1.05] |
| 14.8 Jaundice | 1 | 44961 | Risk Ratio (M‐H, Random, 95% CI) | 1.07 [0.96, 1.19] |
| 14.9 Eye infection | 1 | 44961 | Risk Ratio (M‐H, Random, 95% CI) | 0.99 [0.88, 1.12] |
| 14.10 Skin infection | 1 | 44961 | Risk Ratio (M‐H, Random, 95% CI) | 0.94 [0.82, 1.09] |
| 14.11 Umbilical infection | 1 | 44961 | Risk Ratio (M‐H, Random, 95% CI) | 0.97 [0.81, 1.15] |
| 14.12 Respiratory infection | 1 | 44961 | Risk Ratio (M‐H, Random, 95% CI) | 1.08 [0.94, 1.24] |
| 14.13 Feeding problems | 1 | 44961 | Risk Ratio (M‐H, Random, 95% CI) | 1.01 [0.88, 1.16] |
| 14.14 Others | 1 | 44961 | Risk Ratio (M‐H, Random, 95% CI) | 0.93 [0.84, 1.02] |
| 15 Adverse events during the first month post supplementation Show forest plot | 1 | Risk Ratio (M‐H, Fixed, 95% CI) | Totals not selected | |
| 15.1 Diarrhoea | 1 | Risk Ratio (M‐H, Fixed, 95% CI) | 0.0 [0.0, 0.0] | |
| 15.2 Vomiting | 1 | Risk Ratio (M‐H, Fixed, 95% CI) | 0.0 [0.0, 0.0] | |
| 16 All‐cause neonatal mortality: risk ratios based on cumulative risk (%, adjusted for clustering) Show forest plot | 5 | Risk Ratio (Fixed, 95% CI) | Subtotals only | |
| 16.1 All infants | 5 | 126242 | Risk Ratio (Fixed, 95% CI) | 0.99 [0.90, 1.08] |
| 16.2 All infants ‐ male | 4 | 57254 | Risk Ratio (Fixed, 95% CI) | 1.01 [0.87, 1.17] |
| 16.3 All infants ‐ female | 4 | 53047 | Risk Ratio (Fixed, 95% CI) | 1.03 [0.89, 1.19] |
| 17 All‐cause neonatal mortality: rate ratios (person‐years of follow‐up) Show forest plot | 1 | Rate Ratio (Fixed, 95% CI) | Subtotals only | |
| 17.1 All infants | 1 | Rate Ratio (Fixed, 95% CI) | 1.04 [0.86, 1.25] | |
| 17.2 All male infants | 1 | Rate Ratio (Fixed, 95% CI) | 0.99 [0.77, 1.27] | |
| 17.3 All female infants | 1 | Rate Ratio (Fixed, 95% CI) | 1.10 [0.82, 1.49] | |