Regímenes de tratamiento acortados versus régimen estándar para la tuberculosis pulmonar sensible a los fármacos
Information
- DOI:
- https://doi.org/10.1002/14651858.CD012918.pub2Copy DOI

- Database:
-
- Cochrane Database of Systematic Reviews
- Version published:
-
- 12 December 2019see what's new
- Type:
-
- Intervention
- Stage:
-
- Review
- Cochrane Editorial Group:
-
Cochrane Infectious Diseases Group
- Classified:
-
- Up to date
All studies incorporated from most recent search
All eligible published studies found in the last search (10 Jul, 2019) were includedAssessed: 9 December 2019
- Up to date
- Copyright:
-
- Copyright © 2019 The Authors. Cochrane Database of Systematic Reviews published by John Wiley & Sons, Ltd. on behalf of The Cochrane Collaboration.
- This is an open access article under the terms of the Creative Commons Attribution‐Non‐Commercial Licence, which permits use, distribution and reproduction in any medium, provided the original work is properly cited and is not used for commercial purposes.
Article metrics
Altmetric:
Cited by:
Authors
Contributions of authors
AG assessed eligibility, extracted data, assessed risk of bias, undertook meta‐analysis, assessed certainty of evidence using the GRADE approach, and drafted the review. AM assessed eligibility, extracted data, helped assess risk of bias, and helped write the review. SJ, JT, and SS helped write the review. RK helped extract data and helped with data synthesis and assessing certainty of the evidence. PT checked eligibility and data extraction, helped with data synthesis, helped assess the certainty of evidence, and helped write the review. All review authors approved the final version of this review.
Sources of support
Internal sources
-
Sree Balaji Medical College and Hospital, India.
Employment for Angeline G Grace
-
All India Institute of Medical Sciences, New Delhi, India.
Employment for Abhenil Mittal
-
Postgraduate Institute of Medical Education and Research, Chandigarh, India.
Employment for Siddharth Jain
-
International Union Against Tuberculosis and Lung Disease (The Union), South‐East Asia Regional Office, India.
Employment for Jaya P Tripathy and Srinath Sathyanarayana
-
Christian Medical College, Vellore, India.
Employment for Prathap Tharyan and logistic support for the Prof BV Moses Center for Evidence‐Informed Health Care and Health Policy that hosted Cochrane South Asia during developing the protocol and initiating the review. Salary support for Richard Kirubakaran via the Prof. BV Moses Centre
-
Liverpool School of Tropical Medicine, UK.
External sources
-
Department for International Development (DFID), UK.
Project number 300342‐104
Declarations of interest
AG has no known conflicts of interest.
AM has no known conflicts of interest.
SJ has no known conflicts of interest.
JT has no known conflicts of interest.
SS has no known conflicts of interest.
PT supported by the grant previous to READ‐It (Grant: 5242). He was contracted by Cochrane to help build capacity among authors from India and the region to undertake systematic reviews.
RK supported by the grant previous to READ‐It (Grant: 5242), and has no known conflicts of interest.
Acknowledgements
The Academic Editor is Professor Mical Paul.
We thank Vittoria Lutje, the Information Specialist for the Cochrane Infectious Diseases Group (CIDG), for her guidance with the literature search strategy. We are grateful to Paul Garner, CIDG Co‐ordinating Editor, for his comments and support. We also gratefully acknowledge helpful comments from an anonymous peer reviewer and from Dr Marylou Murray. We thank the Contact Editor for this review, Mical Paul, and the CIDG statistician, Marty Richardson, for their painstaking peer review and helpful comments. We thank Dr MS Jawahar, lead author of an included trial, for providing further information about methods and recruitment‐related data.
The editorial base of the Cochrane Infectious Diseases Group is funded by UK aid from the UK government for the benefit of low‐ and middle‐income countries (project number 300342‐104). The views expressed do not necessarily reflect the UK government’s official policies.
The review was supported by READ‐It (project number 300342‐104). RK and PT was supported by the grant previous to READ‐It (Grant: 5242).
This review was undertaken as part of the training course seeking to build capacity on undertaking systematic reviews in India, especially in the context of tuberculosis. The training project was conceived and implemented by the South East Asia office of the International Union Against Tuberculosis and Lung Diseases (The Union) in collaboration with the Central TB Division, Ministry of Health and Family Welfare, Government of India, and Cochrane South Asia. The training was generously supported by the US Agency for International Development (USAID). We also thank the Department for International Development (DFID), UK, for funding the Global Operational Research Fellowship Programme at The Union, Paris, France, in which JT and SS work as Senior Operational Research Fellows.
Version history
| Published | Title | Stage | Authors | Version |
| 2019 Dec 12 | Shortened treatment regimens versus the standard regimen for drug‐sensitive pulmonary tuberculosis | Review | Angeline G Grace, Abhenil Mittal, Siddharth Jain, Jaya P Tripathy, Srinath Satyanarayana, Prathap Tharyan, Richard Kirubakaran | |
| 2018 Jan 12 | Shortened treatment regimens versus the standard regimen for drug‐sensitive pulmonary tuberculosis | Protocol | Angeline G Grace, Abhenil Mittal, Siddharth Jain, Jaya P Tripathy, Srinath Satyanarayana, Prathap Tharyan, Richard Kirubakaran | |
Differences between protocol and review
In the methods, under 'Unit of analysis issues', in the protocol, we had stated that, "When a multi‐arm study contributes multiple comparisons to a particular meta‐analysis, for dichotomous data we will split the ‘shared’ group data appropriately to avoid double counting". In the review, this was considered inappropriate. Instead, from trials with multiple intervention arms, we undertook pair‐wise comparisons of only relevant interventions and when possible combined the results of trial arms with similar ATT regimens.
In the protocol, we had stated that we will carry out a complete case analysis and will explore the effects of missing data in a series of 'best‐worst case' sensitivity analyses. For the review, we believed that these assumptions would be too extreme when outcomes were rare. Instead we assessed the impact of missing data as described in the sections Dealing with missing data and Sensitivity analysis.
In the protocol, we had stated that we would "use the I² statistic with a value of 50% or greater as denoting significant heterogeneity in the results (intertrial variability that exceeds random error). However, if an opposite direction of effect estimates and gross non‐overlapping of confidence intervals of individual trials are observed, we may lower the acceptable level of heterogeneity to an I² statistic of 30%". In the review, we clarified this in accordance with current guidance in the Cochrane Handbook for Systematic Reviews of Interventions, regarding interpreting the I² statistic (Deeks 2011). We had also stated that we would conduct meta‐analyses using a fixed‐effect model when heterogeneity was low and a random‐effects model when heterogeneity was moderate. However, in the review, in keeping with current guidance regarding the I² statistic, if inconsistency was judged to be moderate but due to large and small effects favouring an intervention, and with overlapping 95% confidence intervals, we used a random‐effects model in sensitivity analyses. If this did not change the direction of effect, nor result in imprecision in effect estimates (because the wider 95% CIs with the random‐effects model included non‐appreciable and appreciable benefits), we retained the fixed‐effect model in meta‐analysis but additionally reported the random‐effects meta‐analysis in the results.
In the protocol, we had stated that if we identify significant heterogeneity, one of the potential sources we would explore in subgroup analysis for the primary outcome measure was the category of the shortened treatment regimen (fluoroquinolone‐based and non‐fluoroquinolone‐based). We did not find non‐fluoroquinolone‐based shorter ATT regimens. We therefore explored potential causes of heterogeneity in subgroup analyses based on categories of shortened treatment regimens. We could not undertake subgroup analysis of trials that included adults and those that included children because the included trials recruited only adults.
For the review, we explained in greater detail the sensitivity analyses we would undertake to explore moderate heterogeneity.
For the review, we expanded the section describing the methods of assessing 'Certainty of evidence' to improve transparency and clarity.
Keywords
MeSH
Medical Subject Headings (MeSH) Keywords
Medical Subject Headings Check Words
Humans;
PICOs


Risk of bias summary: review authors' judgements about each risk of bias item for each included trial.

Risk of bias graph: review authors' judgements about each risk of bias item presented as percentages across all included studies.
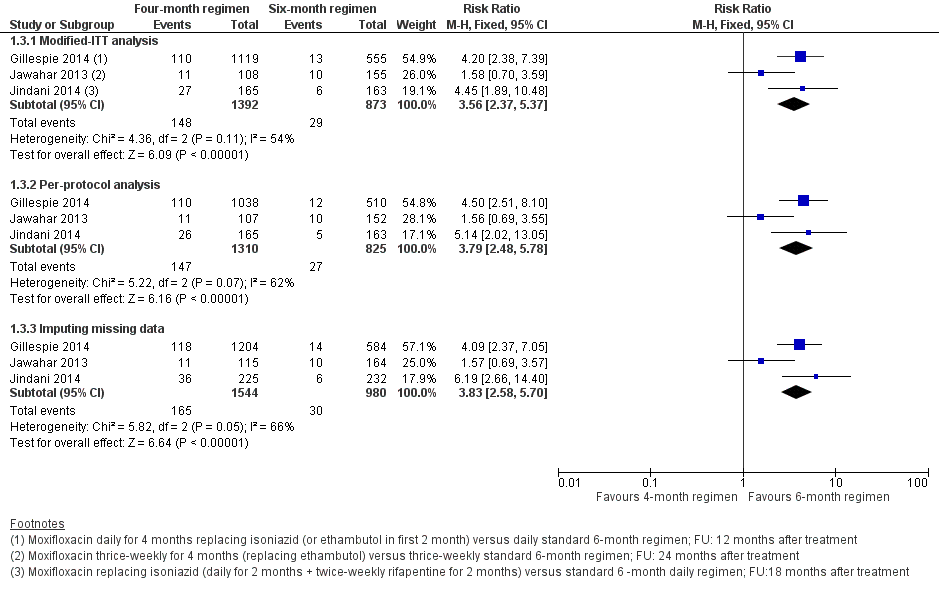
Forest plot of comparison: 1 Moxifloxacin‐containing 4‐month ATT versus standard 6‐month ATT regimens, outcome: 1.3 Relapse: sensitivity analysis accounting for missing data.
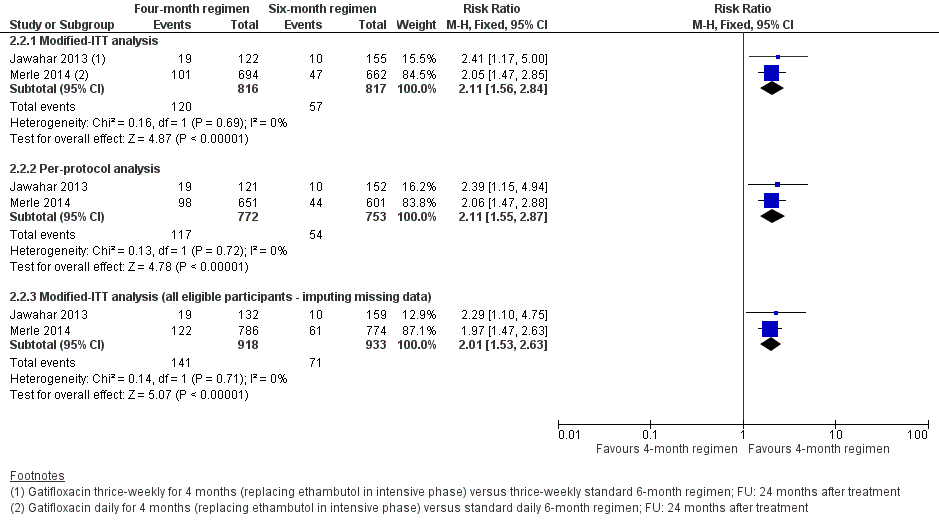
Forest plot of comparison: 2 Gatifloxacin‐containing 4‐month ATT versus standard 6‐month ATT regimens, outcome: 2.2 Relapse: sensitivity analysis accounting for missing data.

Comparison 1 Moxifloxacin‐containing 4‐month ATT versus standard 6‐month ATT regimens, Outcome 1 Relapse.

Comparison 1 Moxifloxacin‐containing 4‐month ATT versus standard 6‐month ATT regimens, Outcome 2 Relapse: subgroup analysis.

Comparison 1 Moxifloxacin‐containing 4‐month ATT versus standard 6‐month ATT regimens, Outcome 3 Relapse: sensitivity analysis accounting for missing data.

Comparison 1 Moxifloxacin‐containing 4‐month ATT versus standard 6‐month ATT regimens, Outcome 4 Death from any cause.

Comparison 1 Moxifloxacin‐containing 4‐month ATT versus standard 6‐month ATT regimens, Outcome 5 Treatment discontinuation.

Comparison 1 Moxifloxacin‐containing 4‐month ATT versus standard 6‐month ATT regimens, Outcome 6 Positive sputum culture/smear at 8 weeks.

Comparison 1 Moxifloxacin‐containing 4‐month ATT versus standard 6‐month ATT regimens, Outcome 7 Treatment failure.

Comparison 1 Moxifloxacin‐containing 4‐month ATT versus standard 6‐month ATT regimens, Outcome 8 Acquired drug resistance.

Comparison 1 Moxifloxacin‐containing 4‐month ATT versus standard 6‐month ATT regimens, Outcome 9 Serious adverse events.

Comparison 2 Gatifloxacin‐containing 4‐month ATT versus standard 6‐month ATT regimens, Outcome 1 Relapse.

Comparison 2 Gatifloxacin‐containing 4‐month ATT versus standard 6‐month ATT regimens, Outcome 2 Relapse: sensitivity analysis accounting for missing data.

Comparison 2 Gatifloxacin‐containing 4‐month ATT versus standard 6‐month ATT regimens, Outcome 3 Death from any cause.

Comparison 2 Gatifloxacin‐containing 4‐month ATT versus standard 6‐month ATT regimens, Outcome 4 Treatment discontinuation.

Comparison 2 Gatifloxacin‐containing 4‐month ATT versus standard 6‐month ATT regimens, Outcome 5 Positive sputum culture at 8 weeks.

Comparison 2 Gatifloxacin‐containing 4‐month ATT versus standard 6‐month ATT regimens, Outcome 6 Treatment failure.

Comparison 2 Gatifloxacin‐containing 4‐month ATT versus standard 6‐month ATT regimens, Outcome 7 Acquired drug resistance.

Comparison 2 Gatifloxacin‐containing 4‐month ATT versus standard 6‐month ATT regimens, Outcome 8 Serious adverse events.
| Moxifloxacin‐containing 4‐month ATT versus standard 6‐month ATT regimen for drug‐sensitive pulmonary tuberculosis | ||||||
| Patient or population: adults with drug‐sensitive pulmonary tuberculosis | ||||||
| Outcomes | Anticipated absolute effects* (95% CI) | Relative effect (95% CI) | Number of participants (studies) | Certainty of the evidence (GRADE) | Comments | |
| Risk with 6‐month standard ATT | Risk with 4‐month moxifloxacin‐containing ATT | |||||
| Relapse | 32 per 1000 | 82 more relapses per 1000 | RR 3.56 | 2265 | ⊕⊕⊕⊝ Due to indirectness | The 4‐month regimen probably increases relapse compared to the 6‐month regimen |
| Death from any cause Follow‐up: range 18 to 24 months | 21 per 1000 | 2 more deaths per 1000 | RR 1.06 | 2760 | ⊕⊕⊕⊝ Due to indirectness | The 4‐month regimen probably makes little or no difference in death from any cause compared to the 6‐month regimen |
| Treatment failure | 16 per 1000 | 5 fewer treatment failures per 1000 | RR 0.71 | 2282 | ⊕⊕⊕⊝ Due to indirectness | The 4‐month regimen probably results in little or no difference in treatment failure compared to the 6‐month regimen |
| Acquired drug resistance | 7 per 1000 | 5 fewer with acquired drug resistance per 1000 (6 fewer to 2 more) | RR 0.33 | 2282 (3 RCTs)e | ⊕⊕⊝⊝ Due to indirectness and imprecision | The 4‐month regimen may be little or no different than the 6‐month regimen in the incidence of acquired drug resistance |
| Serious adverse events Follow‐up: range 18 to 24 months | 62 per 1000 | 2 fewer with serious adverse events per 1000 | RR 0.97 | 3548 | ⊕⊕⊕⊝ Due to indirectness | The 4‐month regimen probably results in little or no difference in serious adverse events compared to the 6‐month regimen |
| *The risk in the intervention group (and its 95% confidence interval) is based on the assumed risk in the comparison group and the relative effect of the intervention (and its 95% CI). | ||||||
| GRADE Working Group grades of evidence. | ||||||
| aNo serious risk of bias: although Jawahar 2013 was at high risk of allocation bias, exclusion of this trial from the sensitivity analysis did not change the direction of effect. Not downgraded. | ||||||
| Gatifloxacin‐containing 4‐month ATT regimens compared to standard 6‐month ATT regimens for drug‐sensitive pulmonary tuberculosis | ||||||
| Patient or population: adults with drug‐sensitive pulmonary tuberculosis | ||||||
| Outcomes | Anticipated absolute effects* (95% CI) | Relative effect | № of participants | Certainty of the evidence | Comments | |
| Risk with 6‐month standard ATT | Risk with gatifloxacin‐containing | |||||
| Relapse | 70 per 1000 | 77 more relapses per 1000 | RR 2.11 | 1633 | ⊕⊕⊕⊝ Due to indirectness | The 4‐month regimen probably increases relapse compared to the 6‐month regimen |
| Death from any cause | 29 per 1000 | 3 fewer deaths per 1000 | RR 0.90 | 1886 | ⊕⊕⊕⊝ Due to indirectness | The 4‐month regimen probably makes little or no difference in death compared to the 6‐month regimen |
| Treatment failure | 25 per 1000 | 1 less treatment failure per 1000 | RR 0.93 | 1657 | ⊕⊕⊝⊝ Due to indirectness | The 4‐month regimen probably makes little or no difference in treatment failure compared to the 6‐month regimen |
| Acquired drug resistance | 12 per 1000 | 9 fewer with acquired drug resistance per 1000 (12 fewer to 49 more) | RR 0.24 (0.01 to 5.01) | 301 (1 RCT)d | ⊕⊝⊝⊝ Due to indirectness, risk of bias, and imprecision | We do not know if acquired drug resistance is any different in the 4‐month and the 6‐month regimens |
| Serious adverse events | 24 per 1000 | 0 fewer serious adverse events per 1000 | RR 1.02 | 1993 | ⊕⊕⊕⊝ Due to indirectness | The 4‐month regimen probably results in little or no difference in serious adverse events compared to the 6‐month regimen |
| *The risk in the intervention group (and its 95% confidence interval) is based on the assumed risk in the comparison group and the relative effect of the intervention (and its 95% CI). | ||||||
| GRADE Working Group grades of evidence. High certainty: we are very confident that the true effect lies close to that of the estimate of the effect. | ||||||
| aNo serious risk of bias: although Jawahar 2013 was assigned high risk of bias for allocation concealment, removal of this trial from the sensitivity analysis did not significantly alter the direction, magnitude, or precision of the effect estimate. Not downgraded. | ||||||
| Study ID (Acronym) | (REMoxTB) | (RIFAQUIN) | (OFLOTUB) | |||||||
| Setting | Multiple sites in Africa (Kenya, South Africa, Tanzania, Zambia), Asia (China, India, Malaysia Thailand), Latin America (Mexico) | 6 sites in 2 cities in India | 6 cities in 4 countries in Africa (Botswana, South Africa, Zambia, Zimbabwe) | 5 countries in Africa (Benin, Guinea, Kenya, Senegal, South Africa) | 2 cities in India | |||||
| Participants | ||||||||||
| Number randomized | 1931 | 429 | 827 | 1836 | 801 | |||||
| Age | Adults (> 18 years) | Adults (> 18 years) | Adults (> 18 years) | Adults (18 to 65 years) | Adults (> 18 years) | |||||
| HIV infection | Included (if CD4 count > 250 cells/μL and not on ART); 110 (7%) | Excluded | Included (if CD4 count > 150/mm³ and not on ART; 158 (27%) | Included if not stage 3 or 4 disease and not on ART; 304 (17%) | Excluded | |||||
| Diagnosis of TB | Positive sputum smears on 2 occasions Culture‐confirmed susceptibility to rifampicin, isoniazid, pyrazinamide, and moxifloxacin | Newly diagnosed pulmonary TB with at least 2 positive sputum cultures. Confirmed by culture and MDR‐TB excluded, susceptibility to ofloxacin (as proxy for moxifloxacin) | 2 sputum samples that were positive for tubercle bacilli on direct smear microscopy No resistance to isoniazid, rifampicin, or moxifloxacin | Acid‐fast bacilli in 2 consecutive sputum smears; confirmed by culture (solid medium) and drug sensitivity tests to rifampicin, isoniazid, ethambutol, streptomycin, and gatifloxacin | 2 positive sputum smear smears for tuberculosis. Culture‐confirmed and MDR‐TB ruled out; susceptible to ofloxacin (as proxy for moxifloxacin) | |||||
| Intervention(s) and comparator | ||||||||||
| Duration of ATT | 4 monthsa | 6 months | 4 monthsb | 6 months | 4 months | 6 monthsc | 4 months | 6 months | 4 monthsa | 6 months |
| Regimens | 2HRZM/2HRM + 2MRZE/2MR | 2HRZE/4HR | 2(HRZG)₃/ 2 (HRG)₃ 2(HRZM)₃/2(HRM)₃ | 2(HRZE)₃ /4(HR)₃ | 2MRZE/ 2P₂M₂ | 2HRZE/ 4HR | 2HRZG/ 2HRG | 2HRZE/4HR | 3HRZM + 2HRZM/ 2RHM + 2HRZM/ 2(RHM)₃ + 2HRZM/ 2(RHEM)₃ | 2(HRZE)₃/ 4(HR)₃ |
| Number allocated | 655 + 636 = 1291 | 640 | 141 118 | 170 | 275 | 275 | 917 | 919 | 629 | 172 |
| Late screening failures excluded after allocation | 38 + 32 = 70 | 40 | 5 3 | 5 | 36 | 35 | 62 | 51 | 13 | 8 |
| Number eligible | 1231 | 600 | 136 115 | 165 | 239 | 240 | 852 | 868 | 616 | 164 |
| Number analysed in m‐ITT analysis (% of those allocated) | 568 + 551 = 1119 (87) | 555 (87) | 136 (97) 115 (98) | 165 (97) | 193 (70) | 188 (68) | 791 (86) | 794 (86) | 590 (94) | 151 (88) |
| Number analysed in per‐protocol analysis (% of those allocated) | 514 + 524 = 1038 (80) | 510 (80) | 131 (93) 113 (96) | 159 (94) | 165 (60) | 163 (59) | 651 (71) | 601 (65) | As above | |
| Number analysed in ancillary analysis (ITT) (% of those allocated) | 617 + 604 = 1221 (94) | 600 (94) | Not done | 239 (87) | 240 (87) | Not reported | Not reported | |||
| Outcomes reported | ||||||||||
| Relapse | Relapse within 18 months after randomization in those with negative culture with treatment. Relapse strains were those shown to be identical on 24‐locus MIRU analysis LJ solid media and MGIT liquid media used for culture | Recurrence of TB over 24 months after treatment in those with a favourable response with treatment: either bacteriologic recurrence (LJ solid media) or clinical/radiologic recurrence | Relapse within 12 to 18 months after treatment. Two positive cultures within a period of 4 months without an intervening negative culture). Re‐infections differentiated from relapse through genotyping (MIRU‐VNTRs) LJ solid media used for culture in some centres, MGIT liquid media in others, and both in some centres | Recurrence of TB over 24 months after treatment proven bacteriologically (2 consecutive positive sputum samples a day apart) or clinically Genotyping (MIRU‐VNTRs) results available for only 70/140 (55%) of those with culture confirmed recurrence. Most were relapses | Not reported | |||||
| Deaths | All deaths TB deaths | Reported (only non‐TB deaths occurred) | All deaths TB deaths | Death during treatment Death after treatment | Not reported | |||||
| Treatment discontinuation | Includes those who did not complete treatment, relocated, or withdrew consent | Includes those who did not complete treatment and those lost to follow‐up | Includes change in treatment due to adverse events, loss to follow‐up, and other treatment changes | Includes those who withdrew consent during treatment and dropouts | Reported but disaggregated data for each group not available | |||||
| Positive smear/ sputum culture at 2 months | Reported using LJ solid media (used in this review) and MGIT liquid media for all randomized participants excluding late screening failures | Reported using LJ solid media for all randomized participants excluding late screening failures | Reported but disaggregated data for moxifloxacin 4‐month and 6‐month treatment groups not available Data also not available for all participants from LJ media | Reported for 752 in the 4‐month and 759 in the 6‐month regimens (88% and 87% of those eligible, respectively) Culture using LJ solid media | Reported for 590 (94%) in the 4‐month and 151 (88%) in the 6‐month regimens | |||||
| Acquired drug resistance | Reported | Reported | Reported | Not reported | Not reported | |||||
| Treatment failure | Includes culture confirmed and not confirmed | Includes culture confirmed and unconfirmed | Culture confirmed | Includes culture confirmed failure | Not reported | |||||
| Serious adverse events | Reported for all randomized participants excluding late screening failures. Grade 3 and 4 severity (DAIDS 2009) | Deduced from adverse events reported for all randomized participants excluding late screening failures. Not graded | Reported for all participants randomized who took 1 dose and assessed as severe or life‐threatening during and 2 weeks after treatment. grade 3 and 4 severity (DAIDS 2009) | Reported for 1692 (92%) of all randomized participants. grade 3 and 4 severity (DAIDS 2009) | Deduced from adverse events reported. Not graded | |||||
| Other adverse events | Not reported | Reported | Not reported | QT prolongation Hyperglycaemic episodes | Reported | |||||
| Abbreviations: ART: anti‐retroviral treatment; ATT: anti‐tuberculosis treatment; E: ethambutol; G: gatifloxacin; H: isoniazid; ITT: intention‐to‐treat; LJ: Löwenstein‐Jensen; M: moxifloxacin; MGIT: mycobacterial growth indicator tube; MIRU‐VNTRs: mycobacterial interspersed repetitive unit–variable number tandem repeats; m‐ITT: modified intention‐to‐treat; P: rifapentine; R: rifampicin; Z: pyrazinamide. Leading numbers in regimens indicate duration in months. Drugs were administered daily, except when given thrice weekly as indicated by subscripts. aData from moxifloxacin‐containing shortened regimens combined for data synthesis. | ||||||||||
| Primary outcome: relapse | ||||||
| Trial ID | ||||||
| Regimens | 4 months | 6 months | 4 months | 6 months | 4 months | 6 months |
| aModified‐ITT analysis (primary analysis) | 110/1119 (9.8%) | 13/555 (2.3%) | 11/108 (10.1%) | 10/155 (6.5%) | 27/165 (16.4%) | 6/163 (3.7%) |
| aPer‐protocol analysis | 110/1038 (10.6%) | 12/510 (2.4%) | 11/107 (10.1%) | 10/152 (6.6%) | 26/165 (15.8%) | 5/163 (3.1%) |
| bSensitivity analysis imputing missing data | 126/1184 (10.7%) | 14/577 (2.4%) | 11/114 (9.7%) | 10/159 (6.3%) | 36/225 (16.0%) | 71/232 (2.6%%) |
| Abbreviations: ATT: anti‐tuberculosis treatment; ITT: intention‐to‐treat. aAs reported in trial reports. | ||||||
| Primary outcome: relapse | ||||
| Trial ID | ||||
| Regimen | 4 months | 6 months | 4 months | 6 months |
| aModified‐ITT analysis (primary analysis) | 19/122 (15.6%) | 10/155 (6.5%) | 101/694 (14.6%) | 47/662 (7.1%) |
| aPer‐protocol analysis | 19/121 (15.7%) | 10/152 (6.6%) | 98/651 (15.1%) | 44/601 (7,3%) |
| bSensitivity analysis imputing missing data | 19/132 (14.4%) | 10/159 (6.3%) | 122/786 (15.5%) | 61/774 (7,9%) |
| Abbreviations: ATT: anti‐tuberculosis treatment; ITT: intention‐to‐treat. aAs reported in trial reports. | ||||
| Outcome or subgroup title | No. of studies | No. of participants | Statistical method | Effect size |
| 1 Relapse Show forest plot | 3 | 2265 | Risk Ratio (M‐H, Fixed, 95% CI) | 3.56 [2.37, 5.37] |
| 2 Relapse: subgroup analysis Show forest plot | 3 | Risk Ratio (M‐H, Fixed, 95% CI) | Subtotals only | |
| 2.1 Moxifloxacin replacing ethambutol | 2 | 1386 | Risk Ratio (M‐H, Fixed, 95% CI) | 2.74 [1.69, 4.43] |
| 2.2 Moxifloxacin replacing isoniazid | 2 | 1424 | Risk Ratio (M‐H, Fixed, 95% CI) | 4.89 [3.02, 7.92] |
| 3 Relapse: sensitivity analysis accounting for missing data Show forest plot | 3 | Risk Ratio (M‐H, Fixed, 95% CI) | Subtotals only | |
| 3.1 Modified‐ITT analysis | 3 | 2265 | Risk Ratio (M‐H, Fixed, 95% CI) | 3.56 [2.37, 5.37] |
| 3.2 Per‐protocol analysis | 3 | 2135 | Risk Ratio (M‐H, Fixed, 95% CI) | 3.79 [2.48, 5.78] |
| 3.3 Imputing missing data | 3 | 2524 | Risk Ratio (M‐H, Fixed, 95% CI) | 3.83 [2.58, 5.70] |
| 4 Death from any cause Show forest plot | 3 | 2760 | Risk Ratio (M‐H, Fixed, 95% CI) | 1.06 [0.65, 1.75] |
| 5 Treatment discontinuation Show forest plot | 3 | 2335 | Risk Ratio (M‐H, Fixed, 95% CI) | 1.12 [0.78, 1.61] |
| 6 Positive sputum culture/smear at 8 weeks Show forest plot | 3 | 2828 | Risk Ratio (M‐H, Random, 95% CI) | 0.49 [0.22, 1.13] |
| 6.1 Moxifloxacin replacing isoniazid or ethambutol in 4‐month ATT regimen | 2 | 2087 | Risk Ratio (M‐H, Random, 95% CI) | 0.74 [0.45, 1.20] |
| 6.2 Moxifloxacin augmenting standard 6‐month ATT regimen | 1 | 741 | Risk Ratio (M‐H, Random, 95% CI) | 0.24 [0.15, 0.39] |
| 7 Treatment failure Show forest plot | 3 | 2282 | Risk Ratio (M‐H, Fixed, 95% CI) | 0.71 [0.33, 1.52] |
| 8 Acquired drug resistance Show forest plot | 3 | 2282 | Risk Ratio (M‐H, Fixed, 95% CI) | 0.33 [0.08, 1.31] |
| 9 Serious adverse events Show forest plot | 4 | 3548 | Risk Ratio (M‐H, Fixed, 95% CI) | 0.97 [0.74, 1.27] |
| 9.1 Moxifloxacin replacing standard drugs in 4‐month ATT regimens | 3 | 2760 | Risk Ratio (M‐H, Fixed, 95% CI) | 0.96 [0.72, 1.26] |
| 9.2 Moxifloxacin augmenting standard 6‐month ATT regimens | 1 | 788 | Risk Ratio (M‐H, Fixed, 95% CI) | 1.17 [0.45, 3.06] |
| Outcome or subgroup title | No. of studies | No. of participants | Statistical method | Effect size |
| 1 Relapse Show forest plot | 2 | 1633 | Risk Ratio (M‐H, Fixed, 95% CI) | 2.11 [1.56, 2.84] |
| 2 Relapse: sensitivity analysis accounting for missing data Show forest plot | 2 | Risk Ratio (M‐H, Fixed, 95% CI) | Subtotals only | |
| 2.1 Modified‐ITT analysis | 2 | 1633 | Risk Ratio (M‐H, Fixed, 95% CI) | 2.11 [1.56, 2.84] |
| 2.2 Per‐protocol analysis | 2 | 1525 | Risk Ratio (M‐H, Fixed, 95% CI) | 2.11 [1.55, 2.87] |
| 2.3 Modified‐ITT analysis (all eligible participants ‐ imputing missing data) | 2 | 1851 | Risk Ratio (M‐H, Fixed, 95% CI) | 2.01 [1.53, 2.63] |
| 3 Death from any cause Show forest plot | 2 | 1886 | Risk Ratio (M‐H, Fixed, 95% CI) | 0.90 [0.53, 1.53] |
| 4 Treatment discontinuation Show forest plot | 2 | 1657 | Risk Ratio (M‐H, Fixed, 95% CI) | 0.70 [0.46, 1.08] |
| 5 Positive sputum culture at 8 weeks Show forest plot | 2 | 1818 | Risk Ratio (M‐H, Fixed, 95% CI) | 0.99 [0.80, 1.23] |
| 6 Treatment failure Show forest plot | 2 | 1657 | Risk Ratio (M‐H, Fixed, 95% CI) | 0.93 [0.51, 1.70] |
| 7 Acquired drug resistance Show forest plot | 1 | 301 | Risk Ratio (M‐H, Fixed, 95% CI) | 0.24 [0.01, 5.01] |
| 8 Serious adverse events Show forest plot | 2 | 1993 | Risk Ratio (M‐H, Fixed, 95% CI) | 1.02 [0.58, 1.77] |