Procedimientos de reducción broncoscópica del volumen pulmonar para la enfermedad pulmonar obstructiva crónica
Information
- DOI:
- https://doi.org/10.1002/14651858.CD012158.pub2Copy DOI

- Database:
-
- Cochrane Database of Systematic Reviews
- Version published:
-
- 23 February 2017see what's new
- Type:
-
- Intervention
- Stage:
-
- Review
- Cochrane Editorial Group:
-
Cochrane Airways Group
- Copyright:
-
- Copyright © 2017 The Cochrane Collaboration. Published by John Wiley & Sons, Ltd.
Article metrics
Altmetric:
Cited by:
Authors
Contributions of authors
JEM van Agteren: 'Risk of Bias' assessment, data extraction, data analysis, drafting of review, responsible for final version.
K Hnin: 'Risk of Bias', data extraction, editing of review.
D Grosser: clinical guidance, editing of the review.
KV Carson: RoB conflict resolution, input in protocol.
BJ Smith: supervision of review and editing of the review.
Sources of support
Internal sources
-
Support provided by the Queen Elizabeth Hospital, Respiratory Medicine Department, Australia.
External sources
-
No sources of support supplied
Declarations of interest
Dion Grosser has received payment to attend workshops and to provide education and proctoring for placement of endobronchial valves (Pulmonx) and has received flights and accommodation to attend an education session on implantation of coils (PneumRx). None of the other review authors are aware of any conflict of interest.
Acknowledgements
The Background and Methods sections of this protocol are based on a standard template used by the Cochrane Airways Group.
Chris Cates was the Editor for the protocol of this review and commented critically.
This project was supported by the National Institute for Health Research (NIHR) via Cochrane Infrastructure funding provided to the Cochrane Airways Group. The views and opinions expressed therein are those of the review authors and do not necessarily reflect those of the Systematic Reviews Programme, NIHR, NHS or the Department of Health.
Version history
| Published | Title | Stage | Authors | Version |
| 2017 Feb 23 | Bronchoscopic lung volume reduction procedures for chronic obstructive pulmonary disease | Review | Joseph EM van Agteren, Khin Hnin, Dion Grosser, Kristin V Carson, Brian J Smith | |
| 2016 Apr 19 | Bronchoscopic lung volume reduction procedures for chronic obstructive pulmonary disease | Protocol | Joseph EM van Agteren, Khin Hnin, Kristin V Carson, Dion Grosser, Brian J Smith | |
Differences between protocol and review
Due to the importance of participant selection and phenotyping, specifically for endobronchial valves, it was decided to report differences between the subgroup of 'collateral ventilation' for secondary outcomes.
Keywords
MeSH
Medical Subject Headings (MeSH) Keywords
Medical Subject Headings Check Words
Humans;
PICOs

Risk of bias graph: review authors' judgements about each risk of bias item presented as percentages across all included studies.

Risk of bias summary: review authors' judgements about each risk of bias item for each included study.
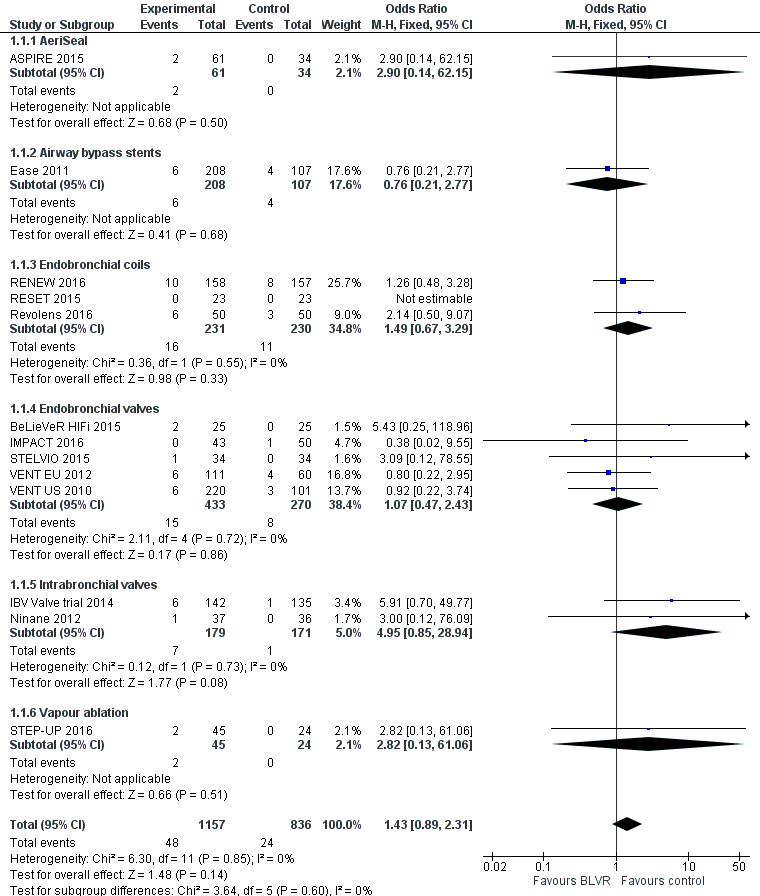
Forest plot of comparison: 1 BLVR to medical therapy, outcome: 1.1 Mortality (All methods, end of follow‐up).
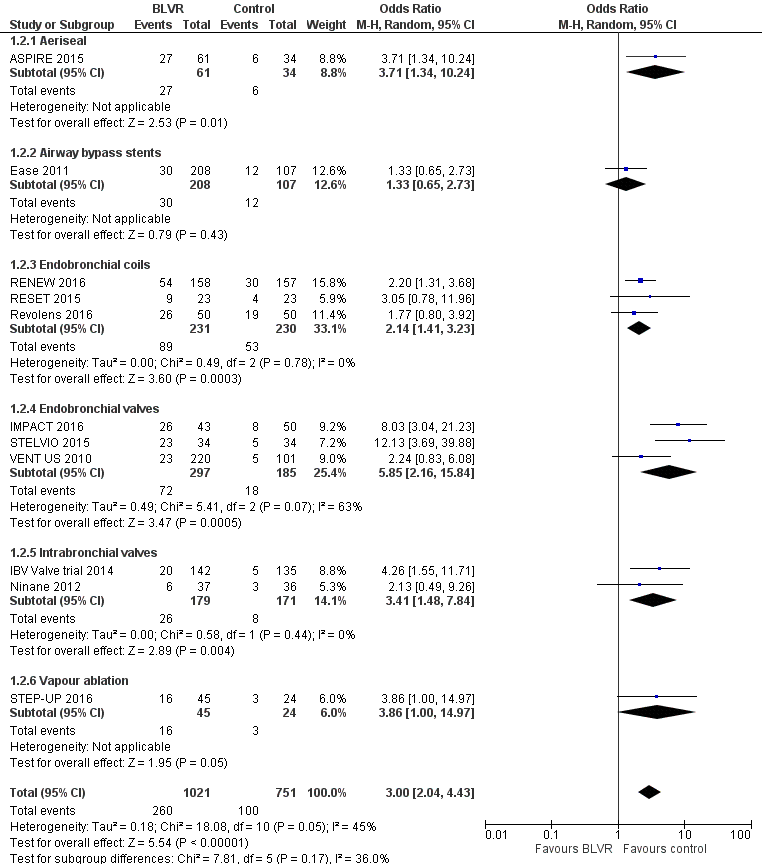
Forest plot of comparison: 1 BLVR to medical therapy, outcome: 1.2 Adverse Events (all methods, end of follow‐up).
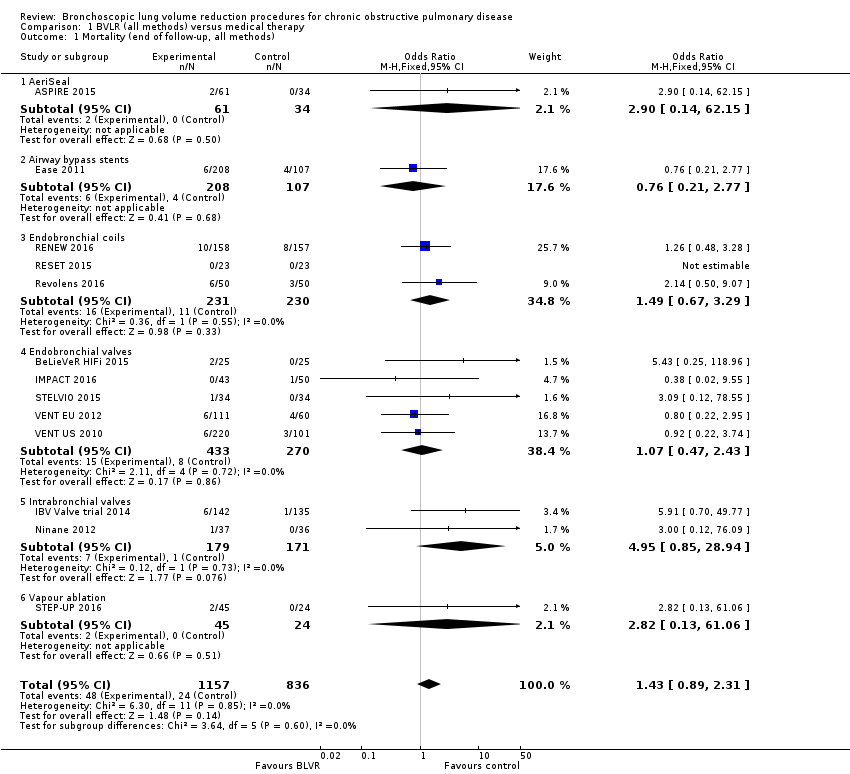
Comparison 1 BVLR (all methods) versus medical therapy, Outcome 1 Mortality (end of follow‐up, all methods).

Comparison 1 BVLR (all methods) versus medical therapy, Outcome 2 Adverse events (end of follow‐up, all methods).

Comparison 2 Endobronchial coils versus medical therapy, Outcome 1 Absolute % change in FEV1 (end of follow‐up, endobronchial coils).
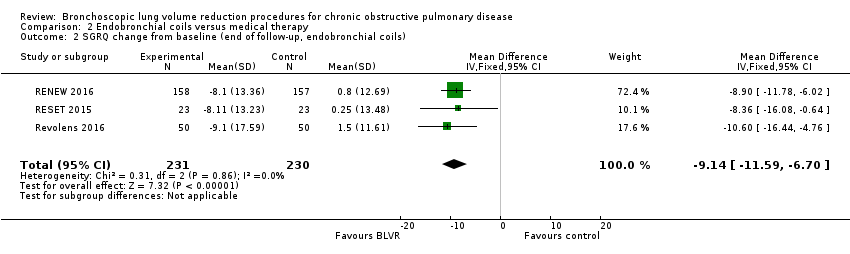
Comparison 2 Endobronchial coils versus medical therapy, Outcome 2 SGRQ change from baseline (end of follow‐up, endobronchial coils).
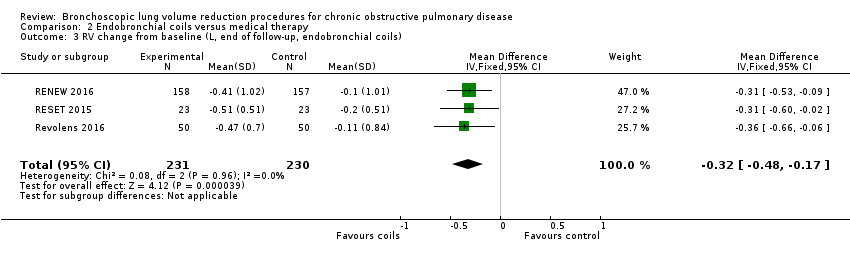
Comparison 2 Endobronchial coils versus medical therapy, Outcome 3 RV change from baseline (L, end of follow‐up, endobronchial coils).

Comparison 2 Endobronchial coils versus medical therapy, Outcome 4 TLC change from baseline (L, end of follow‐up, endobronchial coils).

Comparison 2 Endobronchial coils versus medical therapy, Outcome 5 RV/TLC change from baseline (end of follow‐up, endobronchial coils).

Comparison 2 Endobronchial coils versus medical therapy, Outcome 6 6MWD change from baseline (end of follow‐up, endobronchial coils).
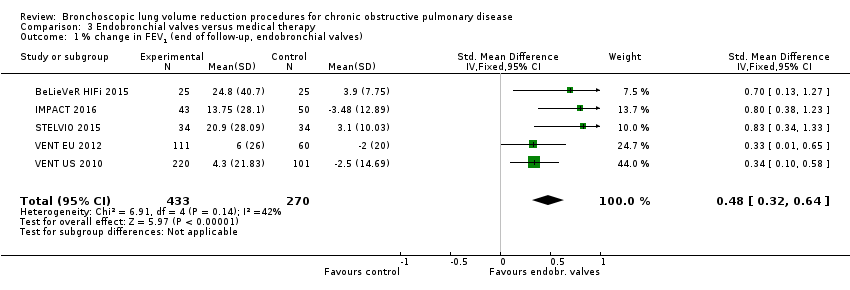
Comparison 3 Endobronchial valves versus medical therapy, Outcome 1 % change in FEV1 (end of follow‐up, endobronchial valves).

Comparison 3 Endobronchial valves versus medical therapy, Outcome 2 % change in FEV1 (stratified per follow‐up, endobronchial valves).

Comparison 3 Endobronchial valves versus medical therapy, Outcome 3 % change in FEV1 (stratified per disease distribution, endobronchial valves).
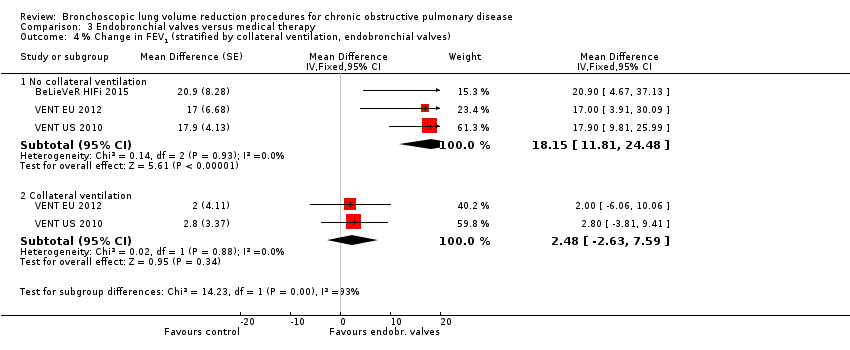
Comparison 3 Endobronchial valves versus medical therapy, Outcome 4 % Change in FEV1 (stratified by collateral ventilation, endobronchial valves).
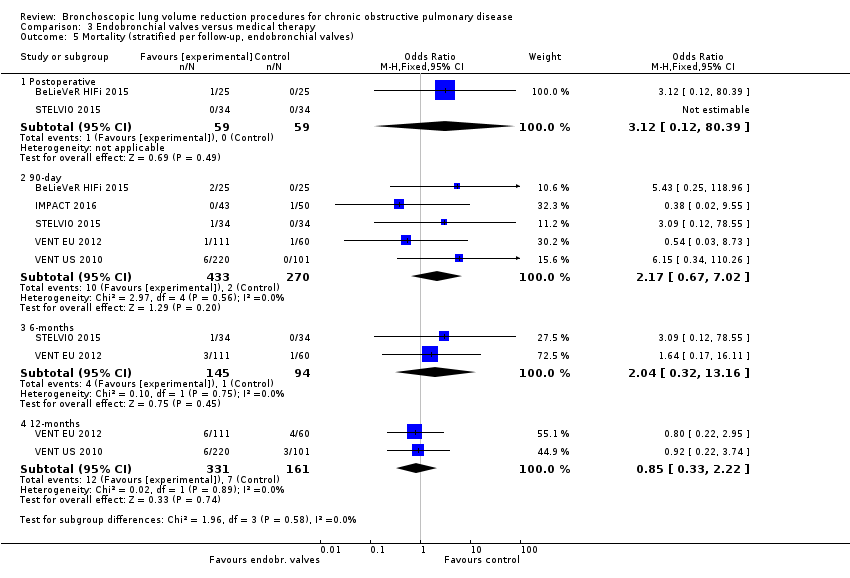
Comparison 3 Endobronchial valves versus medical therapy, Outcome 5 Mortality (stratified per follow‐up, endobronchial valves).
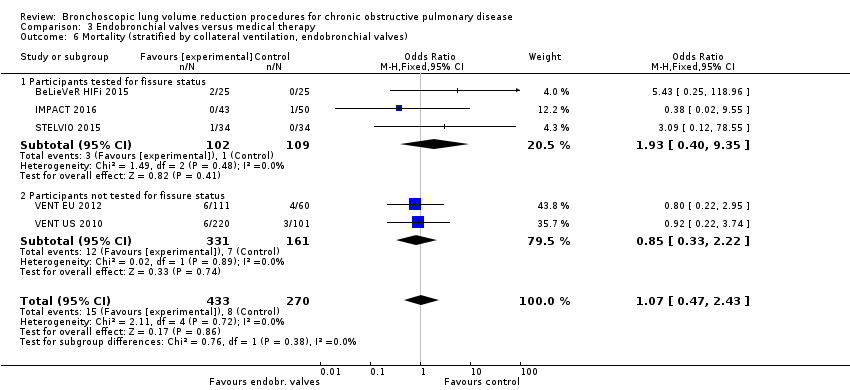
Comparison 3 Endobronchial valves versus medical therapy, Outcome 6 Mortality (stratified by collateral ventilation, endobronchial valves).

Comparison 3 Endobronchial valves versus medical therapy, Outcome 7 SGRQ change from baseline (end of follow‐up, endobronchial valves).

Comparison 3 Endobronchial valves versus medical therapy, Outcome 8 SGRQ change from baseline (stratified by follow‐up time, endobronchial valves).

Comparison 3 Endobronchial valves versus medical therapy, Outcome 9 SGRQ change from baseline (stratified by collateral ventilation, endobronchial valves).

Comparison 3 Endobronchial valves versus medical therapy, Outcome 10 RV change from baseline (L, end of follow‐up, endobronchial valves).

Comparison 3 Endobronchial valves versus medical therapy, Outcome 11 TLC change from baseline (L, end of follow‐up, endobronchial valves).

Comparison 3 Endobronchial valves versus medical therapy, Outcome 12 RV/TLC change from baseline (end of follow‐up, endobronchial valves).

Comparison 3 Endobronchial valves versus medical therapy, Outcome 13 6MWD change from baseline (end of follow‐up, endobronchial valves).
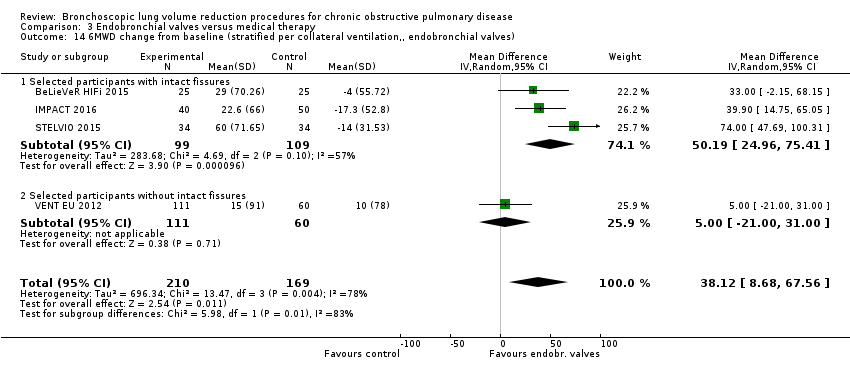
Comparison 3 Endobronchial valves versus medical therapy, Outcome 14 6MWD change from baseline (stratified per collateral ventilation,, endobronchial valves).

Comparison 4 Intrabronchial valves versus medical therapy, Outcome 1 SGRQ change from baseline (end of follow‐up, intrabronchial valves).
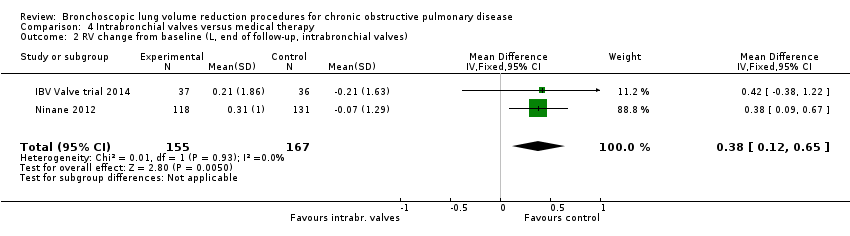
Comparison 4 Intrabronchial valves versus medical therapy, Outcome 2 RV change from baseline (L, end of follow‐up, intrabronchial valves).

Comparison 4 Intrabronchial valves versus medical therapy, Outcome 3 TLC change from baseline (L, end of follow‐up, intrabronchial valves).
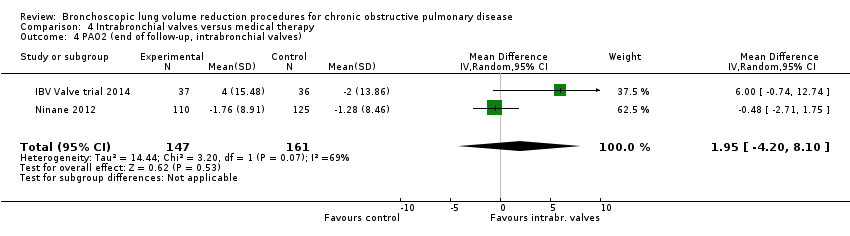
Comparison 4 Intrabronchial valves versus medical therapy, Outcome 4 PAO2 (end of follow‐up, intrabronchial valves).
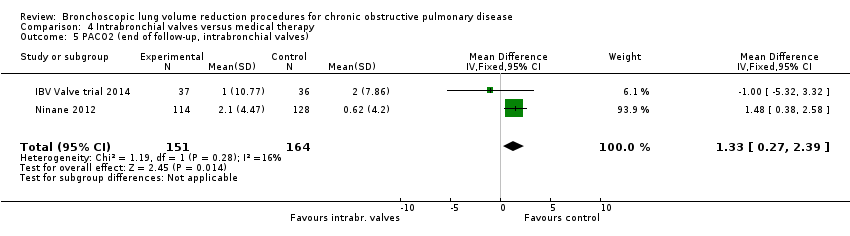
Comparison 4 Intrabronchial valves versus medical therapy, Outcome 5 PACO2 (end of follow‐up, intrabronchial valves).

Comparison 4 Intrabronchial valves versus medical therapy, Outcome 6 6MWD change from baseline (intrabronchial valves).
| AeriSeal + optimal medical care versus optimal medical care for the treatment of chronic obstructive pulmonary disease | ||||||
| Patient or population: Participants suffering from chronic obstructive pulmonary disease | ||||||
| Outcomes | Anticipated absolute effects* (95% CI or IQR) | Relative effect | № of participants | Quality of the evidence | Comments | |
| Risk with optimal medical care | Risk with AeriSeal | |||||
| % change from baseline in FEV1 | The median % change in FEV1 for optimal medical care was 1.3% (IQR ‐8.2 to 12.9%) | The median % change in FEV1 in the intervention group was 18.9% (IQR ‐0.7% to 41.9%) | ‐ | 34 | ⊕⊕⊝⊝ | |
| Mortality at end of follow‐up | 0 per 1,000 | 21 per 1,000 | OR 2.90 | 95 | ⊕⊕⊝⊝ | |
| Units SGRQ change from baseline | The median unit change in SGRQ for optimal medical care was ‐3 units (IQR ‐5 to 1 units) | The median unit change in SGRQ for the intervention group was ‐12 units (IQR ‐22 to ‐5 units) | ‐ | 34 | ⊕⊕⊝⊝ | |
| Change from baseline in lung function parameters other than FEV1 | No values reported | Not estimable | Not estimable | Not estimable | ||
| Meters change from baseline in 6MWD | The median meters 6MWD change from baseline was ‐22 meters (IQR ‐41.3 to 9.3 meters) | The median meters 6MWD change from baseline in the intervention group was 31 meters (IQR 0 to 41.3 meters) | ‐ | 34 | ⊕⊕⊝⊝ | |
| Adverse events at end of follow‐up | 176 per 1,000 | 443 per 1,000 | OR 3.71 | 95 | ⊕⊕⊕⊝ | Most common respiratory events were pneumonia, COPD exacerbations, post‐acute inflammatory response and pneumothorax. The post‐procedure adverse event rate requiring hospitalization was significantly higher in the treatment condition (44%) compared to the control (18%) condition, P = 0.0098. |
| Cost effectiveness end of follow‐up | No values reported | Not estimable | Not estimable | Not estimable | ||
| *The risk in the intervention group (and its 95% confidence interval) is based on the assumed risk in the comparison group and the relative effect of the intervention (and its 95% CI). | ||||||
| GRADE Working Group grades of evidence | ||||||
| 1 Downgraded 2 levels due to imprecision: very low participant numbers and very wide IQRs 2 Downgraded 2 levels due to imprecision: low participant numbers and very wide CIs 3 Downgraded 2 levels due to risk of performance and detection bias and imprecision: studies were not blinded and SGRQ was dependent on participants' subjective answering, very low participant numbers 4 Downgraded 2 levels due to imprecision and risk of performance bias: low participant numbers, the 6MWD was effort‐dependent and could be influenced in non‐blinded studies 5 Downgraded 1 levels due to imprecision: low participant numbers | ||||||
| Airway bypass stents versus sham bronchoscopy for the treatment of chronic obstructive pulmonary disease | ||||||
| Patient or population: Participants suffering from chronic obstructive pulmonary disease | ||||||
| Outcomes | Anticipated absolute effects* (95% CI) | Relative effect | № of participants | Quality of the evidence | Comments | |
| Risk with optimal medical care | Risk with bypass stents | |||||
| % Change from baseline in FEV1 | The mean % change in FEV1 for control was ‐1.1% (SD 3) | The mean % change in FEV1 in the intervention group was 0.95% higher (95% CI ‐0.16 to 2.06) | ‐ | 350 | ⊕⊕⊕⊕ | |
| Mortality at end of follow‐up | 37 per 1,000 | 29 per 1,000 | OR 0.76 | 350 | ⊕⊕⊕⊝ | |
| Units SGRQ at end of follow‐up | The mean units of SGRQ for control at end of follow‐up were 58 (SD 15) | The mean units of SGRQ for the intervention group at end of follow‐up was 2 units lower (95% CI ‐5.58 to 1.58) | ‐ | 350 | ⊕⊕⊕⊕ | The CI did not reach the MCID used in this review (‐7.1 units), meaning that, with the current state of the treatment, we do not expect the result to change; hence no downgrading of the evidence was performed. |
| Change from baseline in lung function parameters other than FEV1 | The mean L change in RV for control was ‐0.10 L (SD 0.6) | The mean L change in RV for the intervention group at end of follow‐up was 0.04 L more (95% CI ‐0.11 to 0.19) | ‐ | 350 | ⊕⊕⊕⊕ | The CI did not reach the MCID used in this review (0.43 L), meaning that, with the current state of the treatment, we do not expect the result to change; hence no downgrading of the evidence was performed. |
| The mean L change in FVC for control was 0.0L (SD 0.4 L) | The mean L change in FVC for intervention was 0.08 L fewer (95% CI ‐0.18 to 0.02) | ‐ | 350 | ⊕⊕⊕⊕ | ||
| Meters 6MWD at end of follow‐up | The mean 6MWD for control at end of follow‐up was 297 meters (SD 94) | The mean 6MWD for intervention at end of follow‐up was 16.00 meters fewer (95% CI ‐39.17 to 7.17) | ‐ | 350 | ⊕⊕⊕⊝ | |
| Adverse events at end of follow‐up | 112 per 1,000 | 144 per 1,000 | OR 1.33 | 315 | ⊕⊕⊕⊝ | Serious adverse events were reported in 3.4% (n = 7) participants in the treatment group compared to none in the sham control group. Pneumothorax (3 in treatment versus 1 in control), haemoptysis (1 in treatment versus 0 in control) and COPD exacerbations (33 in treatment versus 9 in control) were more frequent in treatment versus sham control. |
| Cost effectiveness | Not reported | not estimable | ||||
| *The risk in the intervention group (and its 95% confidence interval) is based on the assumed risk in the comparison group and the relative effect of the intervention (and its 95% CI). | ||||||
| GRADE Working Group grades of evidence | ||||||
| 1Downgraded 1 level for imprecision: the upper end of CI indicates more than 2.7 times the odds of events and lower CI is below 1. 2Downgraded 1 level for imprecision: the lower end of CI indicates crosses the MCID used for this outcome (26 meters). 3Downgraded 1 level for imprecision: the upper end of CI indicates more than 2.7 times the odds of events and lower CI is below 1. | ||||||
| Endobronchial coils + optimal medical care versus optimal medical care for the treatment of chronic obstructive pulmonary disease | ||||||
| Patient or population: Participants suffering from chronic obstructive pulmonary disease | ||||||
| Outcomes | Anticipated absolute effects* (95% CI or SD) | Relative effect | № of participants | Quality of the evidence | Comments | |
| Risk with optimal medical care | Risk with endobronchial coils | |||||
| % change from baseline in FEV1 | The mean % change in FEV1 for optimal medical care ranged between ‐3.0% and 3.6% | The mean change in FEV1 in the intervention group was 10.88 more (95% CI, 5.20 to 16.55) | ‐ | 146 | ⊕⊕⊕⊝ | |
| Mortality at end of follow‐up | 48 per 1,000 | 70 per 1,000 | OR 1.49 | 461 | ⊕⊕⊕⊝ | |
| Units SGRQ change from baseline | The mean units SGRQ change for optimal medical care ranged between 0.25 and 1.5 | The mean SGRQ change in the intervention group was 9.14 units fewer (95% CI, ‐11.59 to ‐6.70) | ‐ | 461 | ⊕⊕⊕⊝ | |
| Change from baseline in lung function parameters other than FEV1 | The mean L change in RV for optimal medical care ranged between ‐0.2 L and ‐0.1 L | The mean RV change in the intervention group was 0.32 L fewer (95% CI, ‐0.48 to ‐0.17 L) | ‐ | 461 | ⊕⊕⊕⊕ | |
| The mean L change in TLC for optimal medical care was ‐0.09 L | The mean TLC change in the intervention group was 0.19 L fewer (95% CI, ‐0.43 to ‐0.06) | 146 | ⊕⊕⊕⊝ | |||
| The mean change in RV/TLC for optimal medical care ranged between ‐0.5 to 0 | The mean change in RV/TLC in the intervention group was 3.74 fewer (95% CI ‐5.16 to ‐2.33) | 415 (2 RCTs) | ⊕⊕⊕⊕ | |||
| Meters change from baseline in 6MWD | The mean 6MWD change from baseline ranged between ‐23 meters and ‐3.2 meters | The mean 6MWD change from baseline in the intervention group was 30.85 meters more (‐1.05 to 62.76 more) | ‐ | 461 | ⊕⊕⊝⊝ | |
| Adverse events at end of follow‐up | 230 per 1,000 | 391 per 1,000 | OR 2.14 | 461 | ⊕⊕⊕⊕ | Overall rates of adverse events were higher in the treatment condition compared to control. Lower respiratory tract infections, COPD exacerbations, pneumonia and pneumothorax were the most frequent adverse events. |
| Cost effectiveness at end of follow‐up | The mean costs in USD at end of follow‐up for control was $5,912.00 (SD 3,529.00) | The mean cost at end of follow‐up in the intervention group was $47,908.00 higher ($47,879.00 to $48,073.00) | ⊕⊕⊕⊝ | |||
| *The risk in the intervention group (and its 95% confidence interval) is based on the assumed risk in the comparison group and the relative effect of the intervention (and its 95% CI). | ||||||
| GRADE Working Group grades of evidence | ||||||
| 1 Downgraded 1 level due to imprecision: low participant numbers 2 Downgraded 1 level due to imprecision: the upper end of CI indicated 3.3 times the odds of death 3 Downgraded 1 level due to risk of performance and detection bias: 3 out of 4 studies were not blinded and SGRQ was dependent on participants' subjective answering 4 Downgraded 1 level due to risk of performance error and imprecision: low participant numbers 5 Downgraded 2 levels due to risk of performance bias and inconsistency in results: high heterogeneity and the 6MWD was effort‐dependent and could be influenced in non‐blinded studies 6 Downgraded 1 level due to imprecision: low participant numbers | ||||||
| Endobronchial valves + optimal medical care versus optimal medical care for the treatment of chronic obstructive pulmonary disease | ||||||
| Patient or population: Participants suffering from chronic obstructive pulmonary disease | ||||||
| Outcomes | Anticipated absolute effects* (95% CI) | Relative effect | № of participants | Quality of the evidence | Comments | |
| Risk with optimal medical care | Risk with endobronchial valves | |||||
| % change from baseline in FEV1 | The mean % change in FEV1 for optimal medical care ranged between ‐3.5% and 3.9% | The standardized mean difference in FEV1 in the intervention group was 0.48 (95% CI, 0.32 to 0.64) | ‐ | 703 | ⊕⊕⊝⊝ | |
| Mortality at end of follow‐up | 30 per 1,000 | 35 per 1,000 | OR 1.07 | 703 | ⊕⊕⊕⊝ | |
| Units of SGRQ change from baseline | The mean units of SGRQ change for optimal medical care ranged between ‐3.7 units and 1 unit | The mean SGRQ change in the intervention group was 7.29 units fewer (95% CI, ‐11.12 to ‐3.45 units) | ‐ | 695 | ⊕⊕⊝⊝ | |
| Change from baseline in lung function parameters other than FEV1 | The mean L change in RV for optimal medical care ranged between ‐0.13 L and 0.05 L | The mean RV change in the intervention group was 0.58 L fewer (95% CI, ‐0.77 to ‐0.39) | ‐ | 200 | ⊕⊕⊕⊝ | |
| The mean L change in TLC for optimal medical care ranged between ‐0.12 L and 0.002 L | The mean TLC change in the intervention group was 0.34 L fewer (95% CI, ‐0.46 to ‐0.23) | ‐ | 107 | ⊕⊕⊕⊝ | ||
| The mean change in RV/TLC for optimal medical care ranged between ‐0.64 and ‐0.4 | The mean change in RV/TLC in the intervention group was 5.76 fewer (95% CI ‐10.45 to ‐1.06) | ‐ | 118 (2 RCTs) | ⊕⊕⊝⊝ | ||
| Meters change from baseline in 6MWD | The mean 6MWD change from baseline ranged between ‐17.3 and 10 meters | The mean 6MWD change from baseline in the intervention group was 38.12 meters more (8.68 more to 67.56 more) | ‐ | 379 | ⊕⊕⊝⊝ | |
| Adverse events at end of follow‐up | 97 per 1,000 | 387 per 1,000 | OR 5.85 | 482 | ⊕⊕⊕⊕ | Pneumonia distal to the valves was the most common adverse event. Pneumothorax and COPD exacerbations were reported as well. Overall, pneumothorax was associated with higher clinical response. Valve removal or replacement or both were relatively common. |
| Cost‐ effectiveness | The mean modelled costs for control were EUR 15,432 at 10 years (mean QALY = 4.02) | The mean modelled costs for control were EUR 25,857 at 10 years (mean QALY = 4.43) | ⊕⊕⊕⊝ | |||
| *The risk in the intervention group (and its 95% confidence interval) is based on the assumed risk in the comparison group and the relative effect of the intervention (and its 95% CI). | ||||||
| GRADE Working Group grades of evidence | ||||||
| 1 Downgraded 2 levels due to inconsistency in results and imprecision: high heterogeneity in results and imprecision due to differences in participant‐selection criteria 2 Downgraded 1 level for imprecision: the upper end of CI indicated 2.4 times the odds of death. 3 Downgraded 2 levels due to inconsistency in results and risk of performance and detection bias: high heterogeneity in results and four studies were not blinded (SGRQ is dependent on participants' subjective answering). 4 Downgraded 1 level due to imprecision: low participant numbers 5 Downgraded 1 level due to imprecision: low participant numbers 6 Downgraded 2 levels due to inconsistency in results and imprecision: high heterogeneity in results and low participant numbers 7 Downgraded due to risk of performance bias and inconsistency in results: the 6MWD was effort‐dependent and could be influenced in non‐blinded studies and there was high heterogeneity in results 8 Downgraded 1 level due to imprecision: low participant numbers | ||||||
| Intrabronchial valves versus sham bronchoscopy for the treatment of chronic obstructive pulmonary disease | ||||||
| Patient or population: Participants suffering from chronic obstructive pulmonary disease | ||||||
| Outcomes | Anticipated absolute effects* (95% CI) | Relative effect | № of participants | Quality of the evidence | Comments | |
| Risk with optimal medical care | Risk with intrabronchial valves | |||||
| % change from baseline in FEV1 | The mean % change in FEV1 for optimal medical care was 0.04 (SD 5.74) | The mean change in FEV1 in the intervention group was ‐2.15 less (95% CI, ‐3.47 to ‐0.83) | ‐ | 272 | ⊕⊕⊕⊝ | |
| Mortality at end of follow‐up | 6 per 1,000 | 28 per 1,000 | OR 4.95 | 350 | ⊕⊕⊕⊝ | |
| Units of SGRQ change from baseline | The mean units of SGRQ change for optimal medical care ranged between ‐1.41 units and ‐3.6 units | The mean SGRQ change in the intervention group was 2.64 units more (95% CI, ‐0.28 to 5.56) | ‐ | 350 | ⊕⊕⊕⊕ | The CI did not reach the MCID used in the review (‐7.1 units), meaning that with the selected treatment strategy (partial bilateral) we did not expect the result to change; hence, no downgrading of the evidence was performed. |
| Change from baseline in lung function parameters other than FEV1 | The mean L change in RV for optimal medical care ranged between ‐0.21 L and 0.07 L | The mean RV change in the intervention group was 0.38 L more (95% CI, 0.12 to 0.65) | ‐ | 312 | ⊕⊕⊕⊕ | |
| The mean L change in TLC for optimal medical care ranged between ‐0.09 L and 0.15 L | The mean TLC change in the intervention group was 0.14 L more (95% CI, ‐0.12 to 0.39) | 312 | ⊕⊕⊕⊝ | |||
| Meters change from baseline in 6MWD | The mean 6MWD change from baseline ranged between ‐3.4 m and 7 m | The mean 6MWD change from baseline in the intervention group was 19.54 meters less (‐37.11 less to ‐1.98 less) | ‐ | 316 | ⊕⊕⊕⊝ | |
| Adverse events at end of follow‐up | 47 per 1,000 | 143 per 1,000 | OR 3.41 | 350 | ⊕⊕⊕⊕ | Most occurring adverse events were COPD exacerbations, respiratory failure, pneumothorax and pneumonia. |
| Cost‐ effectiveness | Not reported | not estimable | ||||
| *The risk in the intervention group (and its 95% confidence interval) is based on the assumed risk in the comparison group and the relative effect of the intervention (and its 95% CI). | ||||||
| GRADE Working Group grades of evidence | ||||||
| 1Downgraded 1 level due to imprecision: low participant numbers 2 Downgraded 1 level for imprecision: the upper end of CI indicated almost 29 times the odds of death. 3 Downgraded 1 level for imprecision: the 95% CI of the intervention group indicated clinically meaningful results 4 Downgraded 1 level for imprecision: high confidence intervals | ||||||
| Vapour ablation versus optimal medical therapy for the treatment of chronic obstructive pulmonary disease | ||||||
| Patient or population: Participants suffering from chronic obstructive pulmonary disease | ||||||
| Outcomes | Anticipated absolute effects* (95% CI) | Relative effect | № of participants | Quality of the evidence | Comments | |
| Risk with optimal medical care | Risk with vapour ablation | |||||
| % change from baseline in FEV1 | The mean % change in FEV1 for optimal medical care was ‐3.7 (SD 11.1) | The mean change in FEV1 in the intervention group was 14.7% more (95% CI, 7.98 to 21.42) | ‐ | 64 | ⊕⊕⊝⊝ | |
| Mortality at end of follow‐up | 0 per 1,000 | 44 per 1,000 | OR 2.82 (95% CI 0.13 to 61.06) | 69 | ⊕⊕⊝⊝ | |
| Units of SGRQ change from baseline | The mean units of SGRQ change for optimal medical care was 0 units (SD 9.8) | The mean SGRQ change in the intervention group was 9.70 units fewer (95% CI, ‐15.62 to ‐3.78) | ‐ | 65 | ⊕⊕⊝⊝ | |
| Lung function parameters other than FEV1 | The absolute between group difference RV in L at end of follow‐up was ‐0.3 L (95% CI ‐0.54 to ‐0.06) | ‐ | 69 | ⊕⊕⊕⊝ | ||
| The absolute between group difference TLC in L at end of follow‐up was ‐0.08 L (95% CI ‐0.31 to 0.16) | 69 | ⊕⊕⊕⊝ | ||||
| Meters at end of follow‐up in 6MWD | The absolute between group difference 6MWD in meters at end of follow‐up was 30.5 m (95% CI ‐1.5 to 62.4) | ‐ | 69 | ⊕⊕⊝⊝ | ||
| Adverse events at end of follow‐up | 125 per 1,000 | 355 per 1,000 | OR 3.86 | 69 | ⊕⊕⊕⊝ | COPD exacerbations, pneumonia or pneumonitis occurred more often in the treatment group compared to the control group. There were no cases of respiratory failure or ICU admission. All but one adverse events could be resolved by standard care. |
| Cost effectiveness | Not reported | not estimable | ||||
| *The risk in the intervention group (and its 95% confidence interval) is based on the assumed risk in the comparison group and the relative effect of the intervention (and its 95% CI). | ||||||
| GRADE Working Group grades of evidence | ||||||
| 1 Downgraded 1 level due to imprecision: low participant numbers 2 Downgraded 2 levels due to imprecision: low participant numbers and high CI. Upper bound indicated 61 times the odds of death 3 Downgraded 2 levels due to imprecision and risk of performance and detection bias: low participant numbers and study was not blinded: SGRQ was dependent on participants' subjective answering 4 Downgraded 1 level due to imprecision: low participant numbers 5 Downgraded 1 level due to imprecision: low participant numbers 6 Downgraded 2 levels due to imprecision and risk of performance bias: low participant numbers and the 6MWD was effort‐dependent: can be influenced in non‐blinded studies. 7 Downgraded 1 level due to imprecision: low participant number | ||||||
| Outcome or subgroup title | No. of studies | No. of participants | Statistical method | Effect size |
| 1 Mortality (end of follow‐up, all methods) Show forest plot | 13 | 1993 | Odds Ratio (M‐H, Fixed, 95% CI) | 1.43 [0.89, 2.31] |
| 1.1 AeriSeal | 1 | 95 | Odds Ratio (M‐H, Fixed, 95% CI) | 2.90 [0.14, 62.15] |
| 1.2 Airway bypass stents | 1 | 315 | Odds Ratio (M‐H, Fixed, 95% CI) | 0.76 [0.21, 2.77] |
| 1.3 Endobronchial coils | 3 | 461 | Odds Ratio (M‐H, Fixed, 95% CI) | 1.49 [0.67, 3.29] |
| 1.4 Endobronchial valves | 5 | 703 | Odds Ratio (M‐H, Fixed, 95% CI) | 1.07 [0.47, 2.43] |
| 1.5 Intrabronchial valves | 2 | 350 | Odds Ratio (M‐H, Fixed, 95% CI) | 4.95 [0.85, 28.94] |
| 1.6 Vapour ablation | 1 | 69 | Odds Ratio (M‐H, Fixed, 95% CI) | 2.82 [0.13, 61.06] |
| 2 Adverse events (end of follow‐up, all methods) Show forest plot | 11 | 1772 | Odds Ratio (M‐H, Random, 95% CI) | 3.00 [2.04, 4.43] |
| 2.1 Aeriseal | 1 | 95 | Odds Ratio (M‐H, Random, 95% CI) | 3.71 [1.34, 10.24] |
| 2.2 Airway bypass stents | 1 | 315 | Odds Ratio (M‐H, Random, 95% CI) | 1.33 [0.65, 2.73] |
| 2.3 Endobronchial coils | 3 | 461 | Odds Ratio (M‐H, Random, 95% CI) | 2.14 [1.41, 3.23] |
| 2.4 Endobronchial valves | 3 | 482 | Odds Ratio (M‐H, Random, 95% CI) | 5.85 [2.16, 15.84] |
| 2.5 Intrabronchial valves | 2 | 350 | Odds Ratio (M‐H, Random, 95% CI) | 3.41 [1.48, 7.84] |
| 2.6 Vapour ablation | 1 | 69 | Odds Ratio (M‐H, Random, 95% CI) | 3.86 [1.00, 14.97] |
| Outcome or subgroup title | No. of studies | No. of participants | Statistical method | Effect size |
| 1 Absolute % change in FEV1 (end of follow‐up, endobronchial coils) Show forest plot | 2 | 146 | Mean Difference (IV, Fixed, 95% CI) | 10.88 [5.21, 16.54] |
| 2 SGRQ change from baseline (end of follow‐up, endobronchial coils) Show forest plot | 3 | 461 | Mean Difference (IV, Fixed, 95% CI) | ‐9.14 [‐11.59, ‐6.70] |
| 3 RV change from baseline (L, end of follow‐up, endobronchial coils) Show forest plot | 3 | 461 | Mean Difference (IV, Fixed, 95% CI) | ‐0.32 [‐0.48, ‐0.17] |
| 4 TLC change from baseline (L, end of follow‐up, endobronchial coils) Show forest plot | 2 | Mean Difference (IV, Fixed, 95% CI) | Subtotals only | |
| 5 RV/TLC change from baseline (end of follow‐up, endobronchial coils) Show forest plot | 2 | 415 | Mean Difference (IV, Fixed, 95% CI) | ‐3.74 [‐5.16, ‐2.33] |
| 6 6MWD change from baseline (end of follow‐up, endobronchial coils) Show forest plot | 3 | 461 | Mean Difference (IV, Random, 95% CI) | 30.85 [‐1.05, 62.76] |
| Outcome or subgroup title | No. of studies | No. of participants | Statistical method | Effect size |
| 1 % change in FEV1 (end of follow‐up, endobronchial valves) Show forest plot | 5 | 703 | Std. Mean Difference (IV, Fixed, 95% CI) | 0.48 [0.32, 0.64] |
| 2 % change in FEV1 (stratified per follow‐up, endobronchial valves) Show forest plot | 5 | Std. Mean Difference (IV, Fixed, 95% CI) | Subtotals only | |
| 2.1 90‐day | 2 | 143 | Std. Mean Difference (IV, Fixed, 95% CI) | 0.77 [0.43, 1.11] |
| 2.2 6‐Month | 3 | 560 | Std. Mean Difference (IV, Fixed, 95% CI) | 0.40 [0.22, 0.58] |
| 2.3 12‐month | 1 | 171 | Std. Mean Difference (IV, Fixed, 95% CI) | 0.33 [0.01, 0.65] |
| 3 % change in FEV1 (stratified per disease distribution, endobronchial valves) Show forest plot | 2 | Mean Difference (Fixed, 95% CI) | 16.36 [9.02, 23.70] | |
| 4 % Change in FEV1 (stratified by collateral ventilation, endobronchial valves) Show forest plot | 3 | Mean Difference (Fixed, 95% CI) | Subtotals only | |
| 4.1 No collateral ventilation | 3 | Mean Difference (Fixed, 95% CI) | 18.15 [11.81, 24.48] | |
| 4.2 Collateral ventilation | 2 | Mean Difference (Fixed, 95% CI) | 2.48 [‐2.63, 7.59] | |
| 5 Mortality (stratified per follow‐up, endobronchial valves) Show forest plot | 5 | Odds Ratio (M‐H, Fixed, 95% CI) | Subtotals only | |
| 5.1 Postoperative | 2 | 118 | Odds Ratio (M‐H, Fixed, 95% CI) | 3.12 [0.12, 80.39] |
| 5.2 90‐day | 5 | 703 | Odds Ratio (M‐H, Fixed, 95% CI) | 2.17 [0.67, 7.02] |
| 5.3 6‐months | 2 | 239 | Odds Ratio (M‐H, Fixed, 95% CI) | 2.04 [0.32, 13.16] |
| 5.4 12‐months | 2 | 492 | Odds Ratio (M‐H, Fixed, 95% CI) | 0.85 [0.33, 2.22] |
| 6 Mortality (stratified by collateral ventilation, endobronchial valves) Show forest plot | 5 | 703 | Odds Ratio (M‐H, Fixed, 95% CI) | 1.07 [0.47, 2.43] |
| 6.1 Participants tested for fissure status | 3 | 211 | Odds Ratio (M‐H, Fixed, 95% CI) | 1.93 [0.40, 9.35] |
| 6.2 Participants not tested for fissure status | 2 | 492 | Odds Ratio (M‐H, Fixed, 95% CI) | 0.85 [0.33, 2.22] |
| 7 SGRQ change from baseline (end of follow‐up, endobronchial valves) Show forest plot | 5 | 695 | Mean Difference (IV, Random, 95% CI) | ‐7.29 [‐11.12, ‐3.45] |
| 8 SGRQ change from baseline (stratified by follow‐up time, endobronchial valves) Show forest plot | 5 | Mean Difference (IV, Random, 95% CI) | Subtotals only | |
| 8.1 90‐day | 2 | 135 | Mean Difference (IV, Random, 95% CI) | ‐8.75 [‐12.76, ‐4.74] |
| 8.2 6‐month | 3 | 560 | Mean Difference (IV, Random, 95% CI) | ‐7.09 [‐12.59, ‐1.60] |
| 8.3 12‐month | 2 | 492 | Mean Difference (IV, Random, 95% CI) | ‐4.05 [‐6.51, ‐1.59] |
| 9 SGRQ change from baseline (stratified by collateral ventilation, endobronchial valves) Show forest plot | 5 | 694 | Mean Difference (IV, Fixed, 95% CI) | ‐5.38 [‐7.38, ‐3.38] |
| 9.1 Participants with intact fissures | 4 | 266 | Mean Difference (IV, Fixed, 95% CI) | ‐9.03 [‐12.07, ‐5.98] |
| 9.2 participants without intact fissures | 1 | 107 | Mean Difference (IV, Fixed, 95% CI) | 0.0 [‐5.48, 5.48] |
| 9.3 Unable to determine fissure status | 1 | 321 | Mean Difference (IV, Fixed, 95% CI) | ‐3.4 [‐6.43, ‐0.37] |
| 10 RV change from baseline (L, end of follow‐up, endobronchial valves) Show forest plot | 3 | 200 | Mean Difference (IV, Fixed, 95% CI) | ‐0.58 [‐0.77, ‐0.39] |
| 11 TLC change from baseline (L, end of follow‐up, endobronchial valves) Show forest plot | 2 | 107 | Mean Difference (IV, Fixed, 95% CI) | ‐0.34 [‐0.46, ‐0.23] |
| 12 RV/TLC change from baseline (end of follow‐up, endobronchial valves) Show forest plot | 2 | 118 | Mean Difference (IV, Random, 95% CI) | ‐5.76 [‐10.45, ‐1.06] |
| 13 6MWD change from baseline (end of follow‐up, endobronchial valves) Show forest plot | 4 | 379 | Mean Difference (IV, Random, 95% CI) | 38.12 [8.68, 67.56] |
| 14 6MWD change from baseline (stratified per collateral ventilation,, endobronchial valves) Show forest plot | 4 | 379 | Mean Difference (IV, Random, 95% CI) | 38.12 [8.68, 67.56] |
| 14.1 Selected participants with intact fissures | 3 | 208 | Mean Difference (IV, Random, 95% CI) | 50.19 [24.96, 75.41] |
| 14.2 Selected participants without intact fissures | 1 | 171 | Mean Difference (IV, Random, 95% CI) | 5.0 [‐21.00, 31.00] |
| Outcome or subgroup title | No. of studies | No. of participants | Statistical method | Effect size |
| 1 SGRQ change from baseline (end of follow‐up, intrabronchial valves) Show forest plot | 2 | 350 | Mean Difference (IV, Fixed, 95% CI) | 2.64 [‐0.28, 5.56] |
| 2 RV change from baseline (L, end of follow‐up, intrabronchial valves) Show forest plot | 2 | 322 | Mean Difference (IV, Fixed, 95% CI) | 0.38 [0.12, 0.65] |
| 3 TLC change from baseline (L, end of follow‐up, intrabronchial valves) Show forest plot | 2 | 322 | Mean Difference (IV, Fixed, 95% CI) | 0.14 [‐0.12, 0.39] |
| 4 PAO2 (end of follow‐up, intrabronchial valves) Show forest plot | 2 | 308 | Mean Difference (IV, Random, 95% CI) | 1.95 [‐4.20, 8.10] |
| 5 PACO2 (end of follow‐up, intrabronchial valves) Show forest plot | 2 | 315 | Mean Difference (IV, Fixed, 95% CI) | 1.33 [0.27, 2.39] |
| 6 6MWD change from baseline (intrabronchial valves) Show forest plot | 2 | 326 | Mean Difference (IV, Fixed, 95% CI) | ‐19.54 [‐37.11, ‐1.98] |