| Aspirin 1000 mg compared with placebo for episodic tension‐type headache |
| Patient or population: adults with episodic tension‐type headache Settings: community Intervention: aspirin 1000 mg Comparison: placebo |
| Pain‐free at 2 hours | No data | No data | ‐ | ‐ | Very low | No data |
| Pain‐free at other time points (1, 4, 24 hours) | No data | No data | ‐ | ‐ | Very low | No data |
| Pain‐free or mild pain at 2 hours | 61/112 | 78/103 | Not calculated | 1 study, 215 participants, 139 events | Very low | Downgraded three levels due to sparse data: single study with 215 participants in comparison |
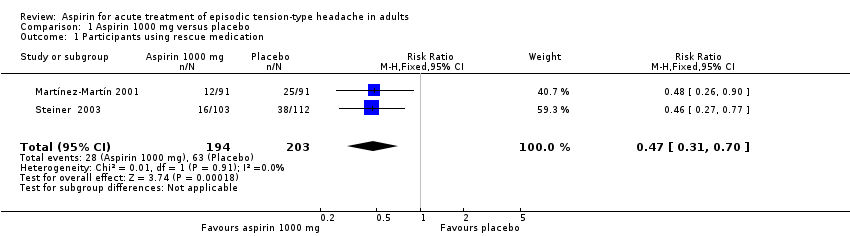
| Use of rescue medication | 310 in 1000 | 140 in 1000 | RR 0.47 (0.31 to 0.70) NNTp 6.0 (4.1 to 12) | 2 studies, 397 participants, 91 events | Low | Downgraded two levels due to sparse data: small number of studies, participants and events |
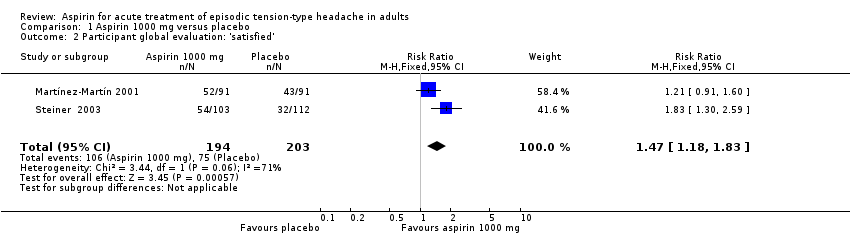
| Patient Global Evaluation at end of study | 370 in 1000 | 550 in 1000 | RR 1.5 (1.2 to 1.8) NNT 5.7 (3.7 to 12) | 2 studies, 397 participants, 181 events | Very low | Downgraded three levels due to sparse data: small number of studies, participants, differences in scales and timing for the outcome, and post‐hoc nature of the analysis |
| Any adverse event | 140 in 1000 | 160 in 1000 | RR 1.1 (0.75 to 1.5) NNH not calculated | 3 studies, 723 participants, 107 events | Low | Downgraded two levels due to sparse data: small number of studies and events |
| Specific adverse events | Inconsistently reported and too few events for analysis Included gastrointestinal upset or dyspepsia, nausea, dizziness, and somnolence | ‐ | 4 studies, 767 participants | Very low | Downgraded three levels due to sparse data: small number of studies, few events, inconsistent reporting |
| Serious adverse events | No events reported | No events reported | ‐ | 4 studies, 767 participants, no events | Very low | Downgraded three levels due to sparse data: small number of studies and no events |
| CI: confidence interval; NNH: number needed to treat for one additional harmful outcome; NNT: number needed to treat for one additional beneficial outcome; NNTp: number needed to treat to prevent one outcome; RR: risk ratio. |
| GRADE Working Group grades of evidence (EPOC 2015). High: this research provides a very good indication of the likely effect. The likelihood that the effect will be substantially different† is low. Moderate: this research provides a good indication of the likely effect. The likelihood that the effect will be substantially different† is moderate. Low: this research provides some indication of the likely effect. However, the likelihood that it will be substantially different† is high. Very low: this research does not provide a reliable indication of the likely effect. The likelihood that the effect will be substantially different† is very high. † Substantially different: a large enough difference that it might affect a decision. |