Interventions for obtaining and maintaining employment in adults with severe mental illness, a network meta‐analysis
Information
- DOI:
- https://doi.org/10.1002/14651858.CD011867.pub2Copy DOI

- Database:
-
- Cochrane Database of Systematic Reviews
- Version published:
-
- 12 September 2017see what's new
- Type:
-
- Intervention
- Stage:
-
- Review
- Cochrane Editorial Group:
-
Cochrane Work Group
- Copyright:
-
- Copyright © 2017 The Cochrane Collaboration. Published by John Wiley & Sons, Ltd.
Article metrics
Altmetric:
Cited by:
Authors
Contributions of authors
Conceiving the protocol/review: YS, FS
Designing the protocol/review: YS, FS, AO
Co‐ordinating the protocol/review: FS
Designing search strategies: YS, FS
Writing the protocol/review: YS, FS
Providing general advice on the protocol/review: JA, MC, JM
Sources of support
Internal sources
-
No sources of support supplied
External sources
-
Instituut Gak, Netherlands.
Amsterdam Public Health Research Institute was subsidised to conduct this Cochrane review as part of a larger research project regarding work and severe mental illness.
Declarations of interest
Yvonne Suijkerbuijk: None known.
Joost van Mechelen: None known.
Anneli Ojajärvi: None known.
Johannes Anema: I am a consultant for Evalua Nederland BV, that sells a health checklist to large employers and insurance companies to improve work ability and reduce future work disability. I also own Evalua Nederland BV stocks. I regularly receive travel and accommodation costs and sometimes speaker fees to present research results, including those of this review. I supervise a PhD student funded by a grant from Instituut GAK. I have also received a grant and travel support from Instituut GAK. I am an editor of the Handbook of Work Disability that includes part of the review results. I hold a chair (0.4 FTE) endowed by the Dutch Workers Compensation board.
Marc Corbiere: None known.
Frederieke G Schaafsma: None known.
Acknowledgements
We thank Kaisa Neuvonen, Cochrane Work Information Specialist, for developing the search strategy. We also thank Jos Verbeek, co‐ordinating Editor, Cochrane Work, for his useful comments and contribution to the data‐analysis. We thank Denise Mitchell and Jani Ruotsalainen for copy editing the text.
Version history
| Published | Title | Stage | Authors | Version |
| 2017 Sep 12 | Interventions for obtaining and maintaining employment in adults with severe mental illness, a network meta‐analysis | Review | Yvonne B Suijkerbuijk, Frederieke G Schaafsma, Joost C van Mechelen, Anneli Ojajärvi, Marc Corbière, Johannes R Anema | |
| 2015 Sep 11 | Interventions for obtaining and maintaining employment in adults with severe mental illness, a network meta‐analysis | Protocol | Yvonne B Suijkerbuijk, Jos H Verbeek, Joost van Mechelen, Anneli Ojajärvi, Johannes R Anema, Marc Corbiere, Frederieke G Schaafsma | |
Differences between protocol and review
We improved the search strategy compared to the version described in the protocol (Suijkerbuijk 2015). We will use this new strategy also for the first update of this review in the future.
We used the outcomes hospital admissions and drop outs as adverse events instead of drop outs alone.
We used Tau² to assess heterogeneity for the network meta‐analysis.
We used the approach described by Salanti 2014 for grading the quality of evidence.
Instead of calculating the NNTB we calculated the corresponding risks of the interventions.
Keywords
MeSH
Medical Subject Headings (MeSH) Keywords
Medical Subject Headings Check Words
Adult; Humans;
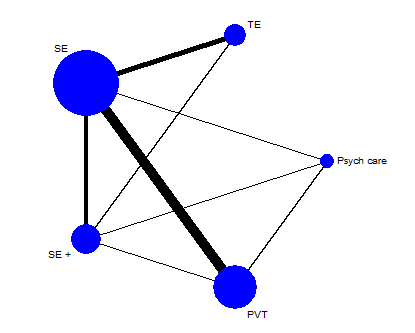
Network plot of direct comparisons of intervention main groups (long‐term follow‐up). Psych care: psychiatric care only; PVT: prevocational training; SE: supported employment; SE+: augmented supported employment; TE: transitional employment
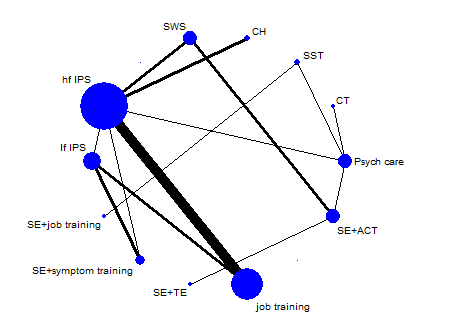
Network plot of direct comparisons of intervention subgroups (long‐term follow‐up). CH: Clubhouse; CT: cognitive training; hf IPS: high‐fidelity Individual Placement and Support; job : job‐related skills training; lf IPS: low‐fidelity Individual Placement and Support; Psych care: psychiatric care only; SE + ACT: supported employment + assertive community treatment; SE + job: supported employment + job‐related skills training; SE + symp: supported employment + symptom‐related skills training; SE + TE: supported employment + transitional employment; SST: social skills training; SWS: sheltered workshops

Risk of bias summary: review authors' judgements about each risk of bias item for each included study.

Risk of bias graph: review authors' judgements about each risk of bias item presented as percentages across all included studies.

Network meta‐analysis estimates of intervention benefit.
CI: confidence interval; Psych care: psychiatric care only; PVT: prevocational employment; RR: risk ratio; SE: supported employment; SE+: augmented supported employment; TE: transitional employment;
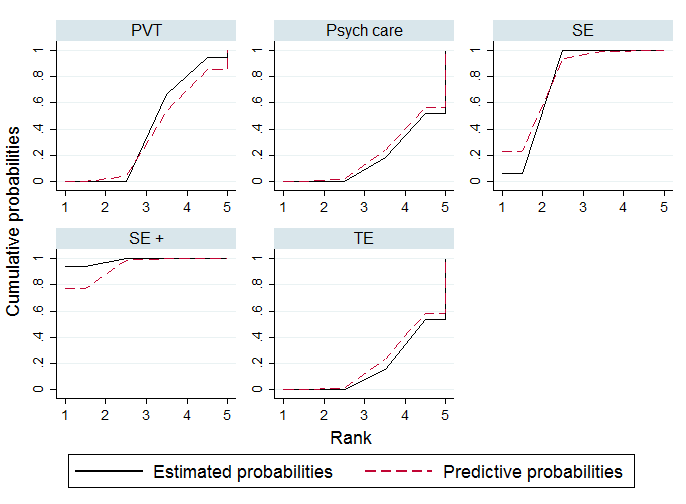
Plots of the surface under the cumulative ranking curves (SUCRAs) for the interventions included in the network (long‐term follow‐up).
PVT: prevocational training; Psych care: psychiatric care only; SE: supported employment; SE+: augmented supported employment; TE: transitional employment

Effectiveness of intervention subgroups in obtaining competitive employment (long‐term follow‐up).
CH: Clubhouse; CI: confidence interval; CT: cognitive training; hf IPS: high‐fidelity Individual Placement and Support; job training: job‐related skills training; lf IPS: low‐fidelity Individual Placement and Support;Psych care only: psychiatric care only; RR: risk ratio; SE + ACT: supported employment + assertive community treatment; SE + job: supported employment + job‐related skills training; SE + symp: supported employment + symptom‐related skills training; SE + TE: supported employment + transitional employment; SST: social skills training; SWS: sheltered workshops
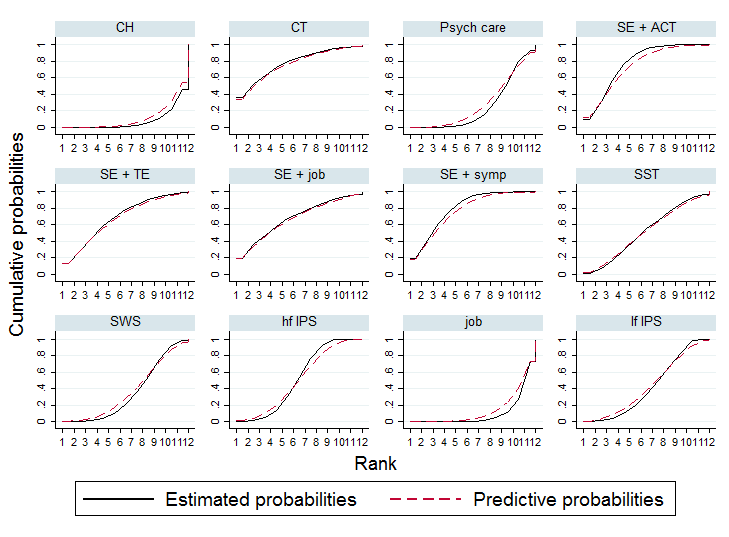
Plots of the surface under the cumulative ranking curves (SUCRAs) for the interventions subgroups included in the network (long‐term follow‐up)
CH: Clubhouse; CT: cognitive training; hf IPS: high‐fidelity Individual Placement and Support; job: job‐related skills training; lf IPS: low‐fidelity Individual Placement and Support;Psych care: psychiatric care only; SE + ACT: supported employment + assertive community treatment; SE + job: supported employment + job‐related skills training; SE + symp: supported employment + symptom‐related skills training; SE + TE: supported employment + transitional employment; SST: social skills training; SWS: sheltered workshops

Inconsistency plots for long‐term follow‐up and loop‐specific heterogeneity estimates.
PVT: prevocational training; Psych care: psychiatric care only; ROR: risk odds ratio; SE: supported employment; SE+: augmented supported employment; TE: transitional employment
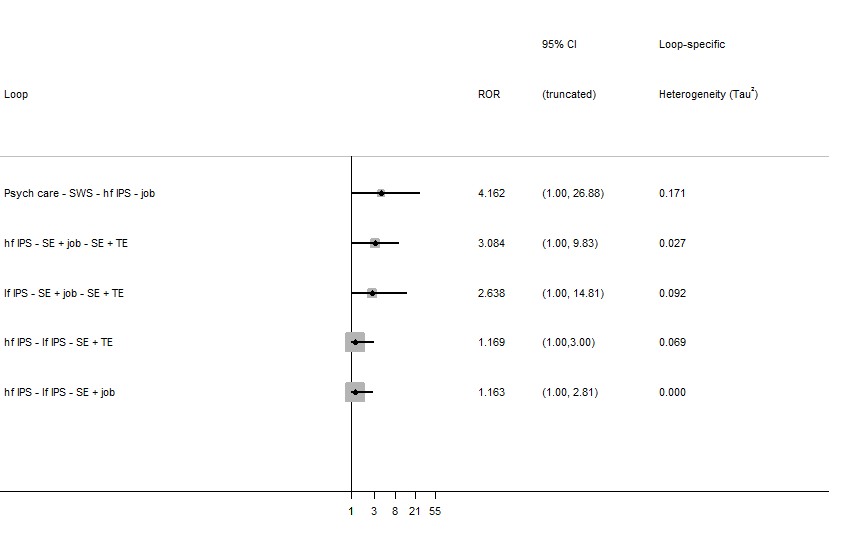
Loop‐specific inconsistency in intervention subgroup network (long‐term follow‐up). hf IPS: high‐fidelity Individual Placement and Support; job: job‐related skills training; lf IPS: low‐fidelity Individual Placement and Support;Psych care: psychiatric care only; SE: supported employment;TE: transitional employment; SWS: sheltered workshops

Study limitations distribution for each network estimate for pairwise comparisons. Calculations are based on the contributions of direct evidence to the network estimates. The colours represent the risk of bias. PVT: prevocational training; Psych care: psychiatric care only; SE: supported employment; SE+: augmented supported employment; TE: transitional employment

Contribution matrix: Percentage contribution of each direct estimate to the NMA estimates. PVT: prevocational training; Psych care: psychiatric care only; SE: supported employment; SE+: augmented supported employment; TE: transitional employment

Comparison‐adjusted funnel plot for the network of intervention for obtaining competitive employment for people with severe mental illness (long‐term follow‐up). The black line represents the null hypothesis that the study‐specific effect sizes do not differ from the respective comparison‐specific pooled effect estimates. The blue line is the regression line. The interventions are ordered based on their focus on competitive job search. Missing small studies on the right side of the zero line (means ratio of RR > 1) suggests that small studies tend to exaggerate the effectiveness of interventions with more focus on competitive job search. PVT: prevocational training; Psych care: psychiatric care only; RR: risk ratio; SE: supported employment; SE+: augmented supported employment; TE: transitional employment

Comparison 1 Any intervention to improve obtaining employment compared to another intervention in adults with severe mental illness, Outcome 1 Obtaining competitive employment, short‐term follow‐up (≤ 1 year).

Comparison 1 Any intervention to improve obtaining employment compared to another intervention in adults with severe mental illness, Outcome 2 Obtaining competitive employment, long‐term follow‐up (> 1 year).

Comparison 2 Any intervention to improve maintaining employment compared to another intervention in adults with severe mental illness, Outcome 1 Weeks in competitive employment, short‐term follow‐up (≤ 1 year).

Comparison 2 Any intervention to improve maintaining employment compared to another intervention in adults with severe mental illness, Outcome 2 Weeks in competitive employment, long‐term follow‐up (> 1 year).
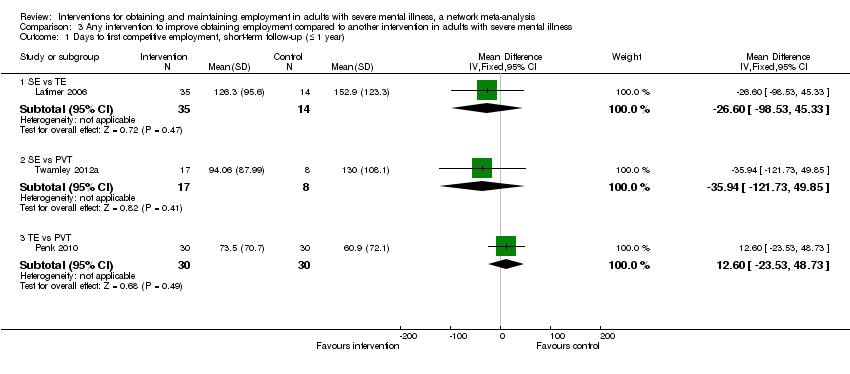
Comparison 3 Any intervention to improve obtaining employment compared to another intervention in adults with severe mental illness, Outcome 1 Days to first competitive employment, short‐term follow‐up (≤ 1 year).

Comparison 3 Any intervention to improve obtaining employment compared to another intervention in adults with severe mental illness, Outcome 2 Days to first competitive employment, long‐term follow‐up (> 1 year).

Comparison 4 Any intervention to improve obtaining employment compared to another intervention in adults with severe mental illness, Outcome 1 Obtaining non‐competitive employment, short‐term follow‐up (≤ 1 year).
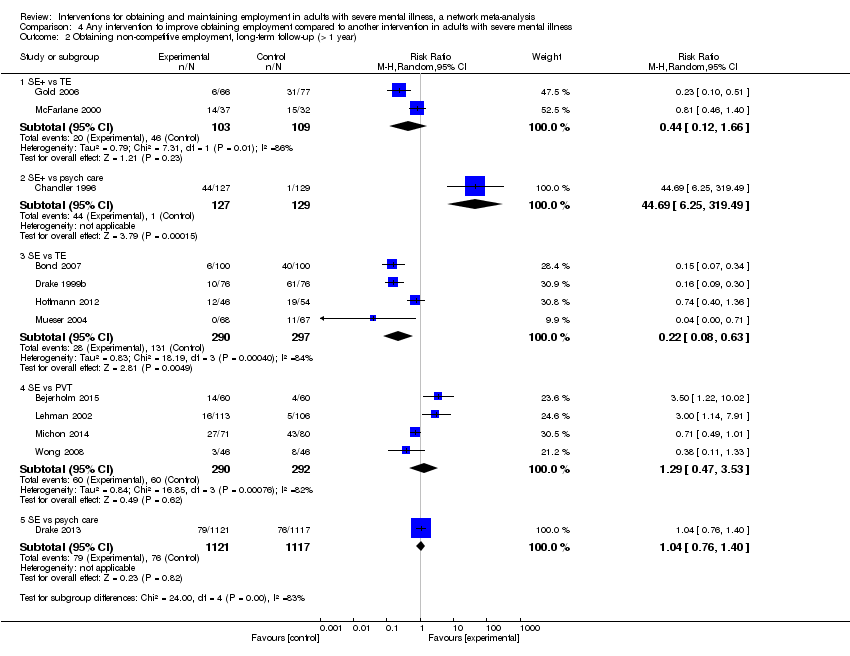
Comparison 4 Any intervention to improve obtaining employment compared to another intervention in adults with severe mental illness, Outcome 2 Obtaining non‐competitive employment, long‐term follow‐up (> 1 year).
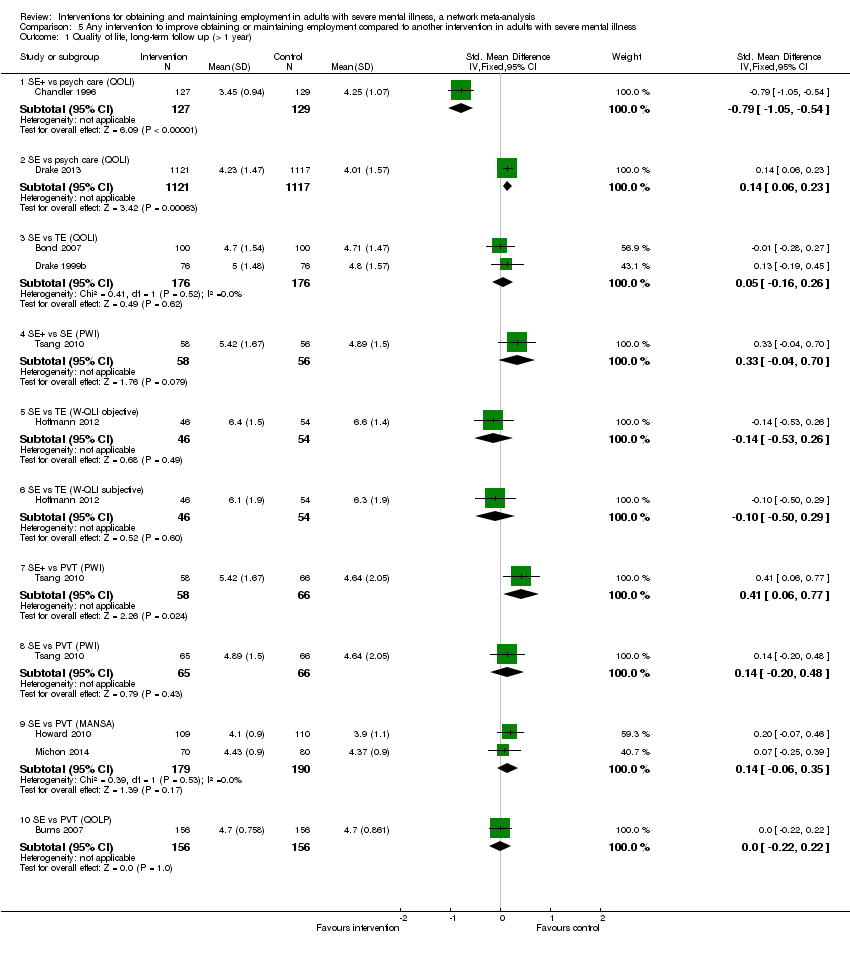
Comparison 5 Any intervention to improve obtaining or maintaining employment compared to another intervention in adults with severe mental illness, Outcome 1 Quality of life, long‐term follow up (> 1 year).

Comparison 6 Any intervention to improve obtaining or maintaining employment compared to another intervention in adults with severe mental illness, Outcome 1 Mental health long‐term follow‐up (> 1 year).

Comparison 7 Any intervention to improve obtaining or maintaining employment compared to another intervention in adults with severe mental illness, Outcome 1 Dropouts, short‐term follow‐up (≤ 1 year).

Comparison 7 Any intervention to improve obtaining or maintaining employment compared to another intervention in adults with severe mental illness, Outcome 2 Dropouts, long‐term follow‐up (> 1 year).

Comparison 8 Any intervention to improve obtaining or maintaining employment compared to another intervention in adults with severe mental illness, Outcome 1 Hospital admissions, short‐term follow‐up (≤ 1 year).

Comparison 8 Any intervention to improve obtaining or maintaining employment compared to another intervention in adults with severe mental illness, Outcome 2 Hospital admissions, long‐term follow‐up (> 1 year).
| Patient or population: adults with severe mental illness Settings: (community) psychiatric care/mental health services Interventions/comparisons: interventions for obtaining competitive employment: augmented supported employment, supported employment. pre‐vocational training, transitional employment, psychiatric care only | ||||||
| Comparison | Illustrative comparative risksa (95% CI) | Relative effect | SUCRA | No of participants | Quality of the evidence | |
| Assumed likelihood with control intervention | Corresponding likelihood with intervention | |||||
| Outcome: Number of participants who obtained competitive employment (follow up > 1 year) | ||||||
| Augmented supported employment vs. psychiatric care only | 187 per 1000 (18.7%) | 712 per 1000 (372 to 1366) | RR 3.81 (1.99 to 7.31) | 98.5% | 256 (1 study) | ⊕⊕⊕⊝ |
| Supported employment vs. psychiatric care only | 187 per 1000 (18.7%) | 509 per 1000 (290 to 890) | RR 2.72 (1.55 to 4.76) | 76.5% | 2238 (1 study) | ⊕⊕⊝⊝ |
| Pre‐vocational training vs. psychiatric care only | 187 per 1000 (18.7%) | 236 per 1000 (136 to 410) | RR 1.26 (0.73 to 2.19) | 40.3% | 161 (2 studies) | ⊕⊝⊝⊝ |
| Transitional employment vs. psychiatric care only | 187 per 1000 (18.7%) | 187 per 1000 (95 to 367) | RR 1.00 (0.51 to 1.96) | 17.2% | 0 | ⊕⊕⊝⊝ |
| Augmented supported employment vs. transitional employment | 223 per 1000 (22.3%) | 845 per 1000 (522 to 1369) | RR 3.79 (2.34 to 6.14) | 212 (2 studies) | ⊕⊕⊝⊝ | |
| Supported employment vs. transitional employment | 223 per 1000 (22.3%) | 604 per 1000 (401 to905) | RR 2.71 (1.80 to 4.06) | 87 (4 studies) | ⊕⊕⊕⊝ | |
| Pre‐vocational training vs. transitional employment | 223 per 1000 (22.3%) | 281 per 1000 172 to 457) | RR 1.26 (0.77 to 2.05) | 0 | ⊕⊕⊝⊝ | |
| Augmented supported employment vs. pre‐vocational training | 263 per 1000 (26.3%) | 794 per 1000 (494 to 1280) | RR 3.02 (1.88 to 4.87) | 193 (2 studies) | ⊕⊕⊝⊝ | |
| Supported employment vs prevocational training | 263 per 1000 (26.3%) | 568 per 1000 (419 to 771) | RR 2.16 (1.59 to 2.93) | 1569 (9 studies) | ⊕⊝⊝⊝ | |
| Augmented supported employment vs supported employment only | 457 per 1000 (45.7%) | 640 per 1000 420 to 978) | RR 1.40 (0.92 to 2.14) | 205 (3 studies) | ⊕⊕⊝⊝ | |
| GRADE Working Group grades of evidence | ||||||
| a The corresponding likelihood of obtaining employment with intervention (and its 95% CI) is based on the assumed likelihood with the control intervention (= median likelihood across studies) and the relative effect of the intervention (and its 95% CI). c We did not downgrade because of reporting bias as insufficient studies contributed to network treatment estimates to allow us to draw meaningful conclusions. 1 We downgraded one level due to study limitations (majority moderate risk of bias studies). 2 We downgraded one level due to study limitations (majority moderate risk of bias studies) and one level due to inconsistency (predictive interval for intervention effect includes effect that would have different interpretation and loop inconsistency). 3 We downgraded one level due to study limitations (majority moderate risk of bias studies), one level because of inconsistency (predictive interval for intervention effect includes effect that would have different interpretations) and one level for imprecision (CIs include values favouring either intervention). 4 We downgraded one level due to study limitations (majority moderate risk of bias studies) and one level because of imprecision (CIs include values favouring either intervention). 5 We downgraded two levels due to study limitations (majority high risk of bias studies). 6 We downgraded one level due to study limitations (majority moderate risk of bias studies). 7 We downgraded one level due to study limitations (majority moderate risk of bias studies) and one level because of imprecision (confidence intervals include values favouring either intervention). 8 We downgraded one level due to study limitations (majority moderate risk of bias studies) and one level because ofinconsistency (moderate level of heterogeneity). 9 We downgraded one level due to study limitations (majority moderate risk of bias studies), one level due to inconsistency (predictive interval for intervention effect includes effect that would have different interpretation and loop inconsistency) and one level because of detected publication bias (small study effects). 10 We downgraded one level due to study limitations (majority moderate risk of bias studies) and one level because of imprecision (confidence intervals include values favouring either intervention). | ||||||
| Study | Country | Follow‐upa | N | Mean age | Male participants | Diagnosis (majority) | Working history (majority) |
| China | short | 90 | 36 | 63% | Psychotic disorder | yes | |
| USA | short | 212 | N/A | 60% | Psychotic disorder | N/A | |
| USA | short | 50 | 46 | N/A | Psychotic disorder | yes | |
| Sweden | long | 120 | 38 | 56% | Psychotic disorder | yes | |
| USA | short | 122 | 36 | 64% | Psychotic disorder | yes | |
| USA | long | 131 | 25 | 69% | Psychotic disorder | yes | |
| USA | short | 86 | 35 | 51% | Psychotic disorder | yes | |
| USA | long | 200 | 39 | 64% | Psychotic disorder | no | |
| USA | short | 90 | 44 | 79% | Psychotic disorder | yes | |
| Europe (UK, Italy, Germany, Netherlands, Bulgaria, Switzerland) | long | 312 | 38 | 60% | Psychotic disorder | yes | |
| UK | long | 123 | 38 | 59% | Psychotic disorder | yes | |
| USA | long | 256 | N/A | 43% | Psychotic disorder | N/A | |
| UK | short | 159 | 24 | 73% | Psychotic disorder | yes | |
| USA | short | 132 | 25 | 53% | Psychotic disorder | N/A | |
| USA | long | 143 | 37 | 48% | Psychotic disorder | N/A | |
| USA | long | 152 | 39 | 39% | Psychotic disorder | N/A | |
| USA | long | 2238 | 44 | 47% | Affective disorder | N/A | |
| USA | short | 21 | 46 | 95% | Affective disorder + substance dependence | yes | |
| USA | short | 100 | 46 | 99% | Affective disorder + substance dependence | yes | |
| USA | long | 58 | 26 | 69% | Psychotic disorder | N/A | |
| USA | short | 34 | 19 | 67% | N/A | no | |
| USA | long | 143 | N/A | 38% | Psychotic disorder | yes | |
| Switzerland | long | 100 | 34 | 65% | Affective disorder | yes | |
| UK | long | 219 | 38 | 67% | Psychotic disorder | yes | |
| Australia | short | 41 | 21 | 81% | Psychotic disorder | yes | |
| Australia | short | 146 | 20 | 67% | Psychotic disorder | yes | |
| Canada | short | 150 | 40 | 62% | Psychotic disorder | yes | |
| Canada | short | 24 | 32 | 71% | Psychotic disorder | N/A | |
| USA | long | 219 | 42 | 57% | Psychotic disorder | yes | |
| USA | long | 68 | 30 | 65% | Psychotic disorder | N/A | |
| USA | long | 69 | 33 | 70% | Psychotic disorder | N/A | |
| USA | long | 48 | 38 | 55% | Psychotic disorder | yes | |
| USA | long | 34 | 44 | 59% | Psychotic disorder | yes | |
| Netherlands | long | 151 | 35 | 74% | Psychotic disorder | yes | |
| USA | long | 135 | 41 | 61% | Psychotic disorder | yes | |
| USA | long | 69 | 25 | 67% | Psychotic disorder | N/A | |
| UK | short | 1037 | N/A | 55% | Psychotic disorder | yes | |
| Japan | short | 37 | 41 | 49% | N/A | yes | |
| USA | short | 89 | 45 | 100% | Affective disorder +substance abuse/dependence | yes | |
| USA | long | 177 | 38 | 55% | Psychotic disorder | yes | |
| China | short | 97 | 36 | 62% | Psychotic disorder | yes | |
| China | long | 189 | 35 | 49% | Psychotic disorder | yes | |
| USA | short | 58 | 51 | 64% | Psychotic disorder | yes | |
| Switzerland | long | 183 | 43 | 47% | Affective disorder | yes | |
| Australia | short | 208 | 32 | 69% | Psychotic disorder | N/A | |
| USA | short | 28 | N/A | 96% | Psychotic disorder | N/A | |
| China | long | 92 | 34 | 60% | Psychotic disorder | N/A | |
| China | long | 103 | 38.6 | 47% | Psychotic disorder | N/A | |
| aFollow‐up: short ≤ 1 year; long > 1 year. bSecondary outcomes: 1 = maintaining employment | |||||||
| Study | Comparison intervention main group | Comparison intervention subgroups | Secondary outcomesb | Included in meta‐analysis | Included in network met‐analysis |
| SE+ vs SE+ | SE+ symp vs SE+ symp | 1, 4, 5, 6 | no | no | |
| TE vs psych care | CT vs psych care | 7 | yes | no | |
| TE vs psych care | SWS vs psych care | 2, 7, 6 | yes | no | |
| SE vs PVT | hf IPS vs job skills training | 1, 2, 3,5 6, | yes | yes | |
| PVT vs psych care | Job skills training vs psych care | 2, 6 | yes | no | |
| TE vs TE | Not classified CH accelerated vs gradual | 2, 6, 7 | no | no | |
| SE+ vs SE | SE+job skills training vs lfIPS | 1, 2, 7 | yes | no | |
| SE vs TE | hf IPS vs CH | 1,2,3,4,5,6 | yes | yes | |
| SE vs PVT | hf IPS vs job skills training | 1, 2,, 6, 7 | yes | no | |
| SE vs PVT | hf IPS vs job skills training | 1, 3, 4, 5, 6, 7 | yes | yes | |
| SE vs SE | hf IPS vs lf IPS | 1, 3, 4,5, 6, 7, | no | yes (sub) | |
| SE+ vs psych care | SE+ACT vs ACT | 2, 5, 6, 7 | yes | no | |
| SE+ vs SE | SE+motivational interviewing vs hf IPS | 1, 2, 6 | yes | no | |
| TE vs psych care | CH vs psych care care | , 6, 7 | yes | no | |
| SE vs PVT | lf IPS vs job skills training | 4, 5, 6 | yes | yes | |
| SE vs TE | hf IPS vs SWS | 2, 3, 4, 5, 6 | yes | yes | |
| SE vs psych | hf IPS vs psych | 1, 2, 4, 5, 6 | yes | yes | |
| SE+ vs SE+ | unclassified SE+TE+contingency management vs SE+TE | 1, 6 | no | no | |
| SE+ vs SE+ | unclassified SE+TE+contingency management vs SE+TE | 1 | no | no | |
| PVT vs psych care | CT vs psych care | 4, 6 | yes | yes | |
| SE vs TE | lf IPS vs SWS | 1 | yes | no | |
| SE vs TE | hf IPS vs SWS | 1,2,3,4,5,6 | yes | yes | |
| SE vs TE | hf IPS vs SWS | 1, 2, 3, 4, 5, 6 | yes | yes | |
| SE vs PVT | hf IPS vs job skills training | 4, , 5, 6, 7 | yes | yes | |
| SE vs psych | hf IPS vs psych | 1, 6 | yes | no | |
| SE vs psych | hf IPS vs psych | 6 | yes | no | |
| SE vs TE | hf IPS vs SWS | 1, 2, 3, 6 | yes | no | |
| SE+ vs SE | SE+symp vs hfIPS | 1, 2 | yes | no | |
| SE vs PVT | hf IPS vs job skills training | 2, 6 | yes | yes | |
| Psych care vs psych care | Not classified ACT+multifamily groups vs ACT+crisis family intervention | 2, 4 | no | no | |
| SE+ vs TE | ACT+SE vs SWS | 1, 2 | yes | yes | |
| SE+ vs SE | SE+symp vs lf IPS | 1, 4, 7, 6 | yes | yes | |
| SE+ vs SE | SE+symp vs lf IPS | 1, 4 | yes | yes | |
| SE vs PVT | hf IPS vs job skills training | 1, 2, 3, 4, 5, 6, 7 | yes | yes | |
| SE vs TE | hf IPS vs CH | 1, 2, 3, 4, 6 | yes | yes | |
| SE+ vs PVT | SE+job vs SST | 6 | yes | yes | |
| SE vs psych care | lf IPS vs psych care | 2, 6, 7 | yes | no | |
| SE vs PVT | hf IPS vs job skills training | 1, 2, 6 | yes | no | |
| TE vs PVT | SWS vs job skills training | 1, 2, 3, 6 | yes | no | |
| SE+ vs SE+ | ACT+SE vs SE+TE | 1, 6 | yes | yes(sub) | |
| PVT vs psych care | SST vs psych care | none | yes | no | |
| SE+ vs SE vs PVT | SE+symp vs hf IPS vs job skills training | 1, 5, 6 | yes | yes | |
| SE vs PVT | hf IPS vs job skills training | 1, 2, 3, 6 | yes | no | |
| SE vs PVT | lf IPS vs job skills training | 6 | yes | yes | |
| SE vs SE | lf IPS vs hfIPS | 1, 6 | no | no | |
| TE vs psych care | SWS vs psych care | 1, 2, 7 | yes | no | |
| SE vs PVT | hf IPS vs job skills training | 1, 2, 3, 6 | yes | yes | |
| PVT vs psych care | SST vs psych care | 4, 6, 7 | yes | yes | |
| (sub) = included in subgroup network meta‐analysis only. ACT: assertive community treatment | |||||
| SE+ | ||||
| 1.40 (0.92 to 2.14) | SE | |||
| 3.02 (1.88 to 4.87) | 2.16 (1.59 to 2.93) | PVT | ||
| 3.79 (2.34 to 6.14) | 2.71 (1.80 to 4.06) | 1.26 (0.77 to 2.05) | TE | |
| 3.81 (1.99 to 7.31) | 2.72 (1.55 to 4.76) | 1.26 (0.73 to 2.19) | 1.00 (0.51 to 1.96) | Psych care |
| Network meta‐analysis estimates of intervention effect (RR with 95% CI). The column intervention is compared with the row intervention. RR > 1 favours the column intervention. | ||||
| Psych care: psychiatric care only | ||||
| Intervention | SUCRA | mean rank |
| SE+ | 98.5 | 1.1 |
| SE | 76.5 | 1.9 |
| PVT | 40.3 | 3.4 |
| TE | 17.2 | 4.3 |
| Psychiatric care only | 17.5 | 4.3 |
| SUCRA = surface under the cumulative ranking curve | ||
| SE + job | |||||||||||
| 0.82 (0.09 to 7.17) | SE + symp | ||||||||||
| 1.03 (0.10 to 11.00) | 1.26 (0.22 to 7.04) | SE + TE | |||||||||
| 0.89 (0.11 to 7.18) | 1.08 (0.29 to 4.04) | 0.86 (0.28 to 2.63) | SE + ACT | ||||||||
| 1.73 (0.23 to 12.82) | 2.10 (0.93 to 4.76) | 1.67 (0.37 to 7.63) | 1.94 (0.69 to 5.44) | hf IPS | |||||||
| 2.08 (0.25 to 17.21) | 2.53 (1.14 to 5.63) | 2.02 (0.38 to 10.58) | 2.34 (0.68 to 7.99) | 1.20 (0.62 to 2.35) | lf IPS | ||||||
| 5.46 (0.63 to 47.60) | 6.64 (2.09 to 21.16) | 5.29 (0.94 to 29.68) | 6.14 (1.64 to 22.89) | 3.16 (1.39 to 7.18) | 2.63 (0.91 to 7.58) | CH | |||||
| 2.38 (0.30 to 18.92) | 2.89 (0.91 to 9.16) | 2.30 (0.58 to 9.09) | 2.67 (1.19 to 5.96) | 1.37 (0.61 to 3.09) | 1.14 (0.40 to 3.27) | 0.44 (0.14 to 1.38) | SWS | ||||
| 4.62 (0.59 to 35.99) | 5.62 (2.44 to 12.95) | 4.47 (0.92 to 21.76) | 5.19 (1.69 to 15.95) | 2.67 (1.70 to 4.20) | 2.22 (1.17 to 4.23) | 0.85 (0.33 to 2.16) | 1.94 (0.77 to 4.89) | Job | |||
| 1.63 (0.44 to 6.08) | 1.98 (0.36 to 11.06) | 1.58 (0.22 to 11.27) | 1.83 (0.36 to 9.25) | 0.94 (0.21 to 4.27) | 0.78 (0.15 to 4.09) | 0.30 (0.05 to 1.66) | 0.69 (0.14 to 3.41) | 0.35 (0.07 to 1.70) | SST | ||
| 0.68 (0.06 to 8.42) | 0.83 (0.09 to 7.35) | 0.66 (0.06 to 7.14) | 0.77 (0.09 to 6.28) | 0.39 (0.05 to 2.98) | 0.33 (0.04 to 2.76) | 0.12 (0.01 to 1.11) | 0.29 (0.04 to 2.32) | 0.15 (0.02 to 1.17) | 0.42 (0.05 to 3.56) | CT | |
| 2.97 (0.51 to 17.40) | 3.61 (1.03 to 12.63) | 2.88 (0.60 to 13.87) | 3.34 (1.10 to 10.13) | 1.72 (0.67 to 4.42) | 1.43 (0.45 to 4.55) | 0.54 (0.16 to 1.90) | 1.25 (0.42 to 3.71) | 0.64 (0.23 to 1.83) | 1.82 (0.56 to 5.93) | 4.35 (0.73 to 25.98) | Psych care |
| Network meta‐analysis estimates of intervention effect (RR, 95% CI). The column intervention is compared with the row intervention. RR > 1 favours the column intervention. | |||||||||||
| CH: Clubhouse | |||||||||||
| Intervention | SUCRA | mean rank |
| SE + symp | 80.3 | 3.2 |
| CT | 78.4 | 3.4 |
| SE + ACT | 77.8 | 3.4 |
| SE + TE | 69 | 4.4 |
| SE + job | 68.4 | 4.5 |
| Hf IPS | 51.9 | 6.3 |
| SST | 51.8 | 6.3 |
| lf IPS | 42.4 | 7.3 |
| SWS | 35.8 | 8.1 |
| Psychcare | 25.8 | 9.2 |
| Job | 10.6 | 10.8 |
| CH | 7.9 | 11.1 |
| SUCRA = surface under the cumulative ranking curve | ||
| Comparison | evidence | confidence | reasons for downgrading |
| SE + vs psych care | mixed | moderate | study limitationsa |
| SE vs psych care | indirect | low | study limitationsa;inconsistencyb,c |
| PVT vs psych care | mixed | very low | study limitationsa; inconsistencyb;imprecisiond |
| TE vs psych care | indirect | low | study limitationsa; imprecisiond |
| SE + vs TE | mixed | low | study limitationse |
| SE vs TE | mixed | moderate | study limitationsa |
| PVT vs TE | indirect | low | study limitationsa; imprecisiond |
| SE + vs PVT | mixed | low | study limitationsa inconsistencyf |
| SE vs PVT | mixed | very low | study limitationsa; inconsistencyb,c; publication biasg |
| SE + vs SE | mixed | low | study limitationsa; imprecisiond |
| Ranking | very low | study limitationsa; inconsistencyh; publication biasg | |
| a Dominated by evidence at high or moderate risk of bias. c Moderate level of heterogeneity. e Dominated by evidence at high risk of bias. f Loop inconsistency ROR 3.156 (95% CI 1.46 to 6.84). g Evidence for small study effects. h Evidence for inconsistency in the network (P = 0.001). psych care: psychiatric care only | |||
| Outcome or subgroup title | No. of studies | No. of participants | Statistical method | Effect size |
| 1 Obtaining competitive employment, short‐term follow‐up (≤ 1 year) Show forest plot | 18 | Risk Ratio (M‐H, Random, 95% CI) | Subtotals only | |
| 1.1 SE vs psych care | 3 | 1087 | Risk Ratio (M‐H, Random, 95% CI) | 1.79 [0.94, 3.40] |
| 1.2 PVT vs psych care | 2 | 171 | Risk Ratio (M‐H, Random, 95% CI) | 8.96 [1.77, 45.51] |
| 1.3 TE vs psych care | 4 | 422 | Risk Ratio (M‐H, Random, 95% CI) | 1.13 [0.88, 1.45] |
| 1.4 SE vs TE | 3 | 231 | Risk Ratio (M‐H, Random, 95% CI) | 3.49 [1.77, 6.89] |
| 1.5 SE vs PVT | 2 | 148 | Risk Ratio (M‐H, Random, 95% CI) | 2.52 [1.21, 5.24] |
| 1.6 TE vs PVT | 1 | 89 | Risk Ratio (M‐H, Random, 95% CI) | 0.78 [0.59, 1.04] |
| 1.7 SE+ vs SE | 3 | 143 | Risk Ratio (M‐H, Random, 95% CI) | 0.91 [0.37, 2.25] |
| 2 Obtaining competitive employment, long‐term follow‐up (> 1 year) Show forest plot | 22 | Risk Ratio (M‐H, Random, 95% CI) | Subtotals only | |
| 2.1 SE+ vs psych care | 1 | 256 | Risk Ratio (M‐H, Random, 95% CI) | 4.32 [1.49, 12.48] |
| 2.2 SE vs psych care | 1 | 2238 | Risk Ratio (M‐H, Random, 95% CI) | 1.51 [1.36, 1.68] |
| 2.3 PVT vs psych care | 2 | 161 | Risk Ratio (M‐H, Random, 95% CI) | 2.19 [1.07, 4.46] |
| 2.4 SE+ vs TE | 2 | 212 | Risk Ratio (M‐H, Random, 95% CI) | 2.45 [1.69, 3.55] |
| 2.5 SE vs TE | 4 | 587 | Risk Ratio (M‐H, Random, 95% CI) | 3.28 [2.13, 5.04] |
| 2.6 SE+ vs PVT | 2 | 193 | Risk Ratio (M‐H, Random, 95% CI) | 5.42 [1.08, 27.11] |
| 2.7 SE vs PVT | 9 | 1570 | Risk Ratio (M‐H, Random, 95% CI) | 2.31 [1.85, 2.89] |
| 2.8 SE+ vs SE | 3 | 205 | Risk Ratio (M‐H, Random, 95% CI) | 1.94 [1.03, 3.65] |
| Outcome or subgroup title | No. of studies | No. of participants | Statistical method | Effect size |
| 1 Weeks in competitive employment, short‐term follow‐up (≤ 1 year) Show forest plot | 8 | Mean Difference (IV, Random, 95% CI) | Subtotals only | |
| 1.1 SE+ vs SE | 1 | 32 | Mean Difference (IV, Random, 95% CI) | ‐1.46 [‐3.38, 0.46] |
| 1.2 SE vs TE | 2 | 187 | Mean Difference (IV, Random, 95% CI) | 4.18 [1.27, 7.09] |
| 1.3 SE vs PVT | 1 | 58 | Mean Difference (IV, Random, 95% CI) | 6.89 [1.26, 12.52] |
| 1.4 SE vs psych care | 2 | 131 | Mean Difference (IV, Random, 95% CI) | 4.87 [0.37, 9.37] |
| 1.5 TE vs PVT | 1 | 60 | Mean Difference (IV, Random, 95% CI) | 6.70 [‐1.76, 15.16] |
| 1.6 TE vs psych care | 1 | 10 | Mean Difference (IV, Random, 95% CI) | ‐4.39 [‐17.75, 8.97] |
| 2 Weeks in competitive employment, long‐term follow‐up (> 1 year) Show forest plot | 11 | Mean Difference (IV, Random, 95% CI) | Subtotals only | |
| 2.1 SE+ vs SE | 3 | 154 | Mean Difference (IV, Random, 95% CI) | 10.09 [0.32, 19.85] |
| 2.2 SE+ vs PVT | 1 | 47 | Mean Difference (IV, Random, 95% CI) | 22.79 [15.96, 29.62] |
| 2.3 SE vs TE | 4 | 587 | Mean Difference (IV, Random, 95% CI) | 17.36 [11.53, 23.18] |
| 2.4 SE vs PVT | 5 | 390 | Mean Difference (IV, Random, 95% CI) | 11.56 [5.99, 17.13] |
| Outcome or subgroup title | No. of studies | No. of participants | Statistical method | Effect size |
| 1 Days to first competitive employment, short‐term follow‐up (≤ 1 year) Show forest plot | 3 | Mean Difference (IV, Fixed, 95% CI) | Subtotals only | |
| 1.1 SE vs TE | 1 | 49 | Mean Difference (IV, Fixed, 95% CI) | ‐26.60 [‐98.53, 45.33] |
| 1.2 SE vs PVT | 1 | 25 | Mean Difference (IV, Fixed, 95% CI) | ‐35.94 [‐121.73, 49.85] |
| 1.3 TE vs PVT | 1 | 60 | Mean Difference (IV, Fixed, 95% CI) | 12.60 [‐23.53, 48.73] |
| 2 Days to first competitive employment, long‐term follow‐up (> 1 year) Show forest plot | 6 | Mean Difference (IV, Fixed, 95% CI) | Subtotals only | |
| 2.1 SE+ vs TE | 1 | 62 | Mean Difference (IV, Fixed, 95% CI) | ‐142.80 [‐238.70, ‐46.90] |
| 2.2 SE vs TE | 3 | 205 | Mean Difference (IV, Fixed, 95% CI) | ‐64.86 [‐115.95, ‐13.77] |
| 2.3 SE vs PVT | 2 | 96 | Mean Difference (IV, Fixed, 95% CI) | ‐35.01 [‐105.21, 35.19] |
| Outcome or subgroup title | No. of studies | No. of participants | Statistical method | Effect size |
| 1 Obtaining non‐competitive employment, short‐term follow‐up (≤ 1 year) Show forest plot | 11 | Risk Ratio (M‐H, Random, 95% CI) | Subtotals only | |
| 1.1 SE+ vs SE | 2 | 57 | Risk Ratio (M‐H, Random, 95% CI) | 1.59 [0.15, 17.22] |
| 1.2 SE vs TE | 2 | 187 | Risk Ratio (M‐H, Random, 95% CI) | 1.10 [0.18, 6.84] |
| 1.3 SE vs PVT | 2 | 148 | Risk Ratio (M‐H, Random, 95% CI) | 0.89 [0.39, 2.06] |
| 1.4 SE vs psych care | 1 | 900 | Risk Ratio (M‐H, Random, 95% CI) | 1.10 [0.61, 2.00] |
| 1.5 TE vs PVT | 1 | 89 | Risk Ratio (M‐H, Random, 95% CI) | 3.82 [2.24, 6.53] |
| 1.6 TE vs psych care | 2 | 78 | Risk Ratio (M‐H, Random, 95% CI) | 4.27 [0.00, 4883.69] |
| 1.7 PVT vs psych care | 1 | 122 | Risk Ratio (M‐H, Random, 95% CI) | 3.0 [0.12, 72.23] |
| 2 Obtaining non‐competitive employment, long‐term follow‐up (> 1 year) Show forest plot | 12 | Risk Ratio (M‐H, Random, 95% CI) | Subtotals only | |
| 2.1 SE+ vs TE | 2 | 212 | Risk Ratio (M‐H, Random, 95% CI) | 0.44 [0.12, 1.66] |
| 2.2 SE+ vs psych care | 1 | 256 | Risk Ratio (M‐H, Random, 95% CI) | 44.69 [6.25, 319.49] |
| 2.3 SE vs TE | 4 | 587 | Risk Ratio (M‐H, Random, 95% CI) | 0.22 [0.08, 0.63] |
| 2.4 SE vs PVT | 4 | 582 | Risk Ratio (M‐H, Random, 95% CI) | 1.29 [0.47, 3.53] |
| 2.5 SE vs psych care | 1 | 2238 | Risk Ratio (M‐H, Random, 95% CI) | 1.04 [0.76, 1.40] |
| Outcome or subgroup title | No. of studies | No. of participants | Statistical method | Effect size |
| 1 Quality of life, long‐term follow up (> 1 year) Show forest plot | 9 | Std. Mean Difference (IV, Fixed, 95% CI) | Subtotals only | |
| 1.1 SE+ vs psych care (QOLI) | 1 | 256 | Std. Mean Difference (IV, Fixed, 95% CI) | ‐0.79 [‐1.05, ‐0.54] |
| 1.2 SE vs psych care (QOLI) | 1 | 2238 | Std. Mean Difference (IV, Fixed, 95% CI) | 0.14 [0.06, 0.23] |
| 1.3 SE vs TE (QOLI) | 2 | 352 | Std. Mean Difference (IV, Fixed, 95% CI) | 0.05 [‐0.16, 0.26] |
| 1.4 SE+ vs SE (PWI) | 1 | 114 | Std. Mean Difference (IV, Fixed, 95% CI) | 0.33 [‐0.04, 0.70] |
| 1.5 SE vs TE (W‐QLI objective) | 1 | 100 | Std. Mean Difference (IV, Fixed, 95% CI) | ‐0.14 [‐0.53, 0.26] |
| 1.6 SE vs TE (W‐QLI subjective) | 1 | 100 | Std. Mean Difference (IV, Fixed, 95% CI) | ‐0.10 [‐0.50, 0.29] |
| 1.7 SE+ vs PVT (PWI) | 1 | 124 | Std. Mean Difference (IV, Fixed, 95% CI) | 0.41 [0.06, 0.77] |
| 1.8 SE vs PVT (PWI) | 1 | 131 | Std. Mean Difference (IV, Fixed, 95% CI) | 0.14 [‐0.20, 0.48] |
| 1.9 SE vs PVT (MANSA) | 2 | 369 | Std. Mean Difference (IV, Fixed, 95% CI) | 0.14 [‐0.06, 0.35] |
| 1.10 SE vs PVT (QOLP) | 1 | 312 | Std. Mean Difference (IV, Fixed, 95% CI) | 0.0 [‐0.22, 0.22] |
| Outcome or subgroup title | No. of studies | No. of participants | Statistical method | Effect size |
| 1 Mental health long‐term follow‐up (> 1 year) Show forest plot | 7 | Mean Difference (IV, Random, 95% CI) | Subtotals only | |
| 1.1 SE vs psych care (SFHS) | 1 | 2238 | Mean Difference (IV, Random, 95% CI) | 2.88 [1.78, 3.98] |
| 1.2 PVT vs psych care (PANSS positive symptoms) | 1 | 103 | Mean Difference (IV, Random, 95% CI) | ‐2.48 [‐3.95, ‐1.01] |
| 1.3 PVT vs psych care (PANSS negative symptoms) | 1 | 103 | Mean Difference (IV, Random, 95% CI) | ‐1.61 [‐2.99, ‐0.23] |
| 1.4 PVT vs psych care (PANSS general symptoms) | 1 | 103 | Mean Difference (IV, Random, 95% CI) | ‐1.86 [‐3.09, ‐0.63] |
| 1.5 PVT vs psych care (composite index, multiple scales) | 1 | 58 | Mean Difference (IV, Random, 95% CI) | ‐7.09 [‐326.22, 312.04] |
| 1.6 SE vs TE (PANSS positive symptoms) | 1 | 200 | Mean Difference (IV, Random, 95% CI) | ‐0.02 [‐1.71, 1.67] |
| 1.7 SE vs TE (PANSS negative symptoms) | 1 | 200 | Mean Difference (IV, Random, 95% CI) | ‐0.80 [‐2.79, 1.19] |
| 1.8 SE vs TE (PANSS general psychopathology) | 1 | 200 | Mean Difference (IV, Random, 95% CI) | ‐2.69 [‐7.58, 2.20] |
| 1.9 SE vs TE (BPRS) | 1 | 152 | Mean Difference (IV, Random, 95% CI) | ‐1.90 [‐5.69, 1.89] |
| 1.10 SE vs PVT (HADS anxiety) | 1 | 312 | Mean Difference (IV, Random, 95% CI) | 0.10 [‐0.88, 1.08] |
| 1.11 SE vs PVT (HADS depression) | 1 | 312 | Mean Difference (IV, Random, 95% CI) | ‐0.10 [‐1.08, 0.88] |
| 1.12 SE vs PVT (MHI) | 1 | 150 | Mean Difference (IV, Random, 95% CI) | ‐1.00 [‐8.63, 2.63] |
| 1.13 SE vs PVT (PANSS positive symptoms) | 1 | 312 | Mean Difference (IV, Random, 95% CI) | 0.10 [‐0.93, 1.13] |
| 1.14 SE vs PVT (PANSS negative symptoms) | 1 | 312 | Mean Difference (IV, Random, 95% CI) | ‐0.20 [‐1.38, 0.98] |
| 1.15 SE vs PVT (PANSS general psychopathology) | 1 | 312 | Mean Difference (IV, Random, 95% CI) | 0.40 [‐1.34, 2.14] |
| Outcome or subgroup title | No. of studies | No. of participants | Statistical method | Effect size |
| 1 Dropouts, short‐term follow‐up (≤ 1 year) Show forest plot | 13 | Risk Ratio (M‐H, Fixed, 95% CI) | Subtotals only | |
| 1.1 SE vs psych care | 3 | 1087 | Risk Ratio (M‐H, Fixed, 95% CI) | 0.67 [0.41, 1.10] |
| 1.2 PVT vs psych care | 1 | 122 | Risk Ratio (M‐H, Fixed, 95% CI) | 5.0 [0.25, 102.04] |
| 1.3 TE vs psych care | 2 | 182 | Risk Ratio (M‐H, Fixed, 95% CI) | 0.67 [0.43, 1.06] |
| 1.4 SE vs TE | 2 | 187 | Risk Ratio (M‐H, Fixed, 95% CI) | 1.78 [0.84, 3.77] |
| 1.5 SE vs PVT | 2 | 148 | Risk Ratio (M‐H, Fixed, 95% CI) | 1.36 [0.56, 3.30] |
| 1.6 TE vs PVT | 1 | 89 | Risk Ratio (M‐H, Fixed, 95% CI) | 3.92 [0.19, 79.40] |
| 1.7 SE+ vs SE | 2 | 119 | Risk Ratio (M‐H, Fixed, 95% CI) | 0.85 [0.43, 1.67] |
| 2 Dropouts, long‐term follow‐up (> 1 year) Show forest plot | 19 | Risk Ratio (M‐H, Fixed, 95% CI) | Subtotals only | |
| 2.1 SE+ vs psych care | 1 | 256 | Risk Ratio (M‐H, Fixed, 95% CI) | 0.74 [0.50, 1.08] |
| 2.2 SE vs psych care | 1 | 2238 | Risk Ratio (M‐H, Fixed, 95% CI) | 1.09 [0.78, 1.52] |
| 2.3 PVT vs psych care | 2 | 161 | Risk Ratio (M‐H, Fixed, 95% CI) | 0.99 [0.45, 2.19] |
| 2.4 SE+ vs SE | 1 | 123 | Risk Ratio (M‐H, Fixed, 95% CI) | 0.65 [0.37, 1.14] |
| 2.5 SE+ vs TE | 1 | 143 | Risk Ratio (M‐H, Fixed, 95% CI) | 0.61 [0.33, 1.13] |
| 2.6 SE vs TE | 4 | 587 | Risk Ratio (M‐H, Fixed, 95% CI) | 1.92 [0.89, 4.15] |
| 2.7 SE+ vs PVT | 2 | 193 | Risk Ratio (M‐H, Fixed, 95% CI) | 0.99 [0.59, 1.64] |
| 2.8 SE vs PVT | 9 | 1569 | Risk Ratio (M‐H, Fixed, 95% CI) | 0.95 [0.80, 1.13] |
| Outcome or subgroup title | No. of studies | No. of participants | Statistical method | Effect size |
| 1 Hospital admissions, short‐term follow‐up (≤ 1 year) Show forest plot | 6 | Risk Ratio (M‐H, Random, 95% CI) | Subtotals only | |
| 1.1 SE vs psych care | 1 | 900 | Risk Ratio (M‐H, Random, 95% CI) | 1.13 [0.74, 1.73] |
| 1.2 TE vs psych care | 4 | 422 | Risk Ratio (M‐H, Random, 95% CI) | 0.59 [0.30, 1.15] |
| 1.3 SE vs PVT | 1 | 90 | Risk Ratio (M‐H, Random, 95% CI) | 1.24 [0.76, 2.01] |
| 2 Hospital admissions, long‐term follow‐up (> 1 year) Show forest plot | 6 | Risk Ratio (M‐H, Random, 95% CI) | Subtotals only | |
| 2.1 SE+ vs psych care | 1 | 256 | Risk Ratio (M‐H, Random, 95% CI) | 1.11 [0.73, 1.70] |
| 2.2 PVT vs psych care | 1 | 103 | Risk Ratio (M‐H, Random, 95% CI) | 0.26 [0.11, 0.65] |
| 2.3 SE+ vs TE | 1 | 143 | Risk Ratio (M‐H, Random, 95% CI) | 0.94 [0.55, 1.63] |
| 2.4 SE vs PVT | 3 | 681 | Risk Ratio (M‐H, Random, 95% CI) | 0.93 [0.60, 1.45] |