Antidepresan untuk rawatan kemurungan bagi orang yang menghidap kanser
Information
- DOI:
- https://doi.org/10.1002/14651858.CD011006.pub3Copy DOI

- Database:
-
- Cochrane Database of Systematic Reviews
- Version published:
-
- 23 April 2018see what's new
- Type:
-
- Intervention
- Stage:
-
- Review
- Cochrane Editorial Group:
-
Cochrane Gynaecological, Neuro-oncology and Orphan Cancer Group
- Copyright:
-
- Copyright © 2018 The Cochrane Collaboration. Published by John Wiley & Sons, Ltd.
Article metrics
Altmetric:
Cited by:
Authors
Contributions of authors
GO, CB and MH planned the study. GO and FM retrieved and selected the studies, extracted the data and performed the quality assessment. GO and CB ran the analysis. GO drafted the manuscript, which was critically revised by FM, SD, CB and MH.
Sources of support
Internal sources
-
Department of Public Health and Community Medicine, Section of Psychiatry, University of Verona, Italy.
CB receives salary support from the University of Verona. GO is a PhD student and receives salary support in the form of a public grant from the Italian Ministry of Health.
-
Department of Psychological Medicine, The Institute of Psychiatry, King's College London, UK.
MH and FM receive salary support from the National Institute for Health Research (NIHR) Mental Health Biomedical Research Centre at South London and Maudsley NHS Foundation Trust and King’s College London.
-
Département Interdisciplinaire de Soins de Support, Gustave Roussy, France.
SD receives salary support from the Institute Gustave Roussy, Paris.
External sources
-
No sources of support supplied
Declarations of interest
Giovanni Ostuzzi ‐ nothing to declare
Faith Matcham ‐ nothing to declare
Sarah Dauchy ‐ nothing to declare
Corrado Barbui ‐ nothing to declare
Matthew Hotopf ‐ nothing to declare
Sarah Dauchy conducted a multi‐centre trial of participants with cancer and depressive symptoms that compared the efficacy of escitalopram versus placebo. This trial was supported financially by the Institut Gustave‐Roussy and Lundbeck. To prevent bias the author was not involved in assessing the eligibility of the study, or in the extraction of data and quality assessment.
Acknowledgements
The authors thank Robin Grant and Alasdair Rooney for their clinical expertise, Gail Quinn and Clare Jess (Managing Editors), Tracey Harrison (Assistant Managing Editor), Joanne Platt (Cochrane Information Specialist) from Cochrane Gynaecological, Neuro‐oncology and Orphan Cancers. They also thank Dr Chin‐Kuo Chan (BPH, MS, PHD, King's College London) and Dr Irina Telegina (MD, Astrakhan State Medical Academy) for having kindly provided their help with translating from Chinese and from Russian respectively.
This project was supported by the National Institute for Health Research (NIHR), via Cochrane Infrastructure to the Cochrane Gynaecological, Neuro‐oncology and Orphan Cancers Group. The views and opinions expressed therein are those of the authors and do not necessarily reflect those of the Systematic Reviews Programme, NIHR, National Health Service or the Department of Health.
Version history
| Published | Title | Stage | Authors | Version |
| 2023 Mar 31 | Antidepressants for the treatment of depression in people with cancer | Review | Giovanni Vita, Beatrice Compri, Faith Matcham, Corrado Barbui, Giovanni Ostuzzi | |
| 2018 Apr 23 | Antidepressants for the treatment of depression in people with cancer | Review | Giovanni Ostuzzi, Faith Matcham, Sarah Dauchy, Corrado Barbui, Matthew Hotopf | |
| 2015 Jun 01 | Antidepressants for the treatment of depression in people with cancer | Review | Giovanni Ostuzzi, Faith Matcham, Sarah Dauchy, Corrado Barbui, Matthew Hotopf | |
| 2014 Mar 05 | Antidepressants for the treatment of depression in patients with cancer | Protocol | Giovanni Ostuzzi, Faith Matcham, Sarah Dauchy, Corrado Barbui, Matthew Hotopf | |
Differences between protocol and review
We amended the Selection of studies paragraph to report that only the Endnote software was used.
In the paragraph Subgroup analysis and investigation of heterogeneity we clarified that the subgroup analyses were performed only for the primary outcome. We further specified which subgroups were considered.
We updated the section Description of the intervention with a brief discussion of a recent review and meta‐analysis (Riblet 2014).
In the section Objectives we replaced the term 'people' with 'adults (aged 18 years or older)'.
In the section Data extraction and management we made clear that the endpoint response rate and dropout rate were calculated on a strict intention‐to‐treat (ITT) basis.
In the section Measures of treatment effect we described which measures for the continuous and dichotomous outcomes were retrieved for the analyses. We moved the methodology for pooling these data from this section to the Data synthesis section, where we also specified the use of the Mantel‐Haenszel methods for the analysis.
We moved the discussion on multiple intervention groups from the section Unit of analysis issues to the Data synthesis section.
In the Data synthesis section we removed the list of comparisons performed, namely antidepressants versus placebo and antidepressants versus antidepressants, as it was already reported in the paragraph Types of interventions. In this section we added a more detailed description on how data were managed and entered in the analysis, including the use of a random‐effects model.
Keywords
MeSH
Medical Subject Headings (MeSH) Keywords
- Adjustment Disorders [*drug therapy];
- Antidepressive Agents [*therapeutic use];
- Antidepressive Agents, Tricyclic [therapeutic use];
- Depression [*drug therapy];
- Depressive Disorder [*drug therapy];
- Depressive Disorder, Major [drug therapy];
- Dysthymic Disorder [drug therapy];
- Neoplasms [*psychology];
- Randomized Controlled Trials as Topic;
- Selective Serotonin Reuptake Inhibitors [therapeutic use];
Medical Subject Headings Check Words
Adult; Humans;
PICOs


'Risk of bias' graph: review authors' judgements about each risk of bias item presented as percentages across all included studies.

'Risk of bias' summary: review authors' judgements about each risk of bias item for each included study.
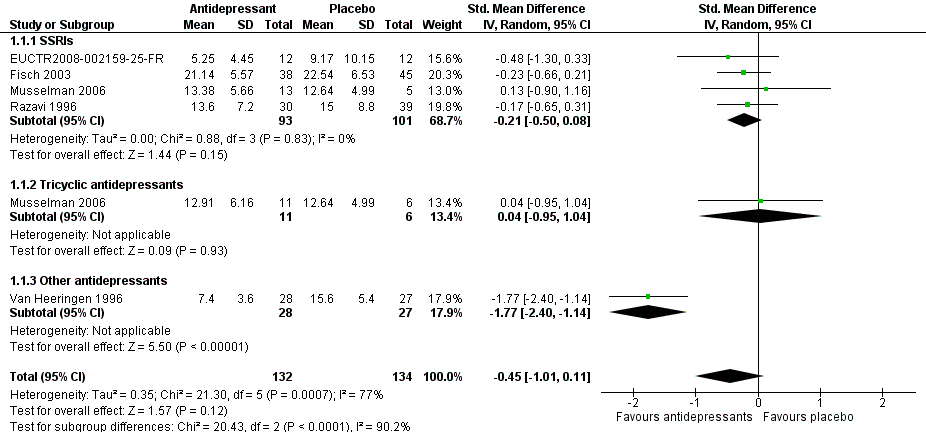
Forest plot of comparison: 1 Depression: efficacy at 6‐12 weeks (continuous outcome), outcome: 1.1 Antidepressants versus placebo.
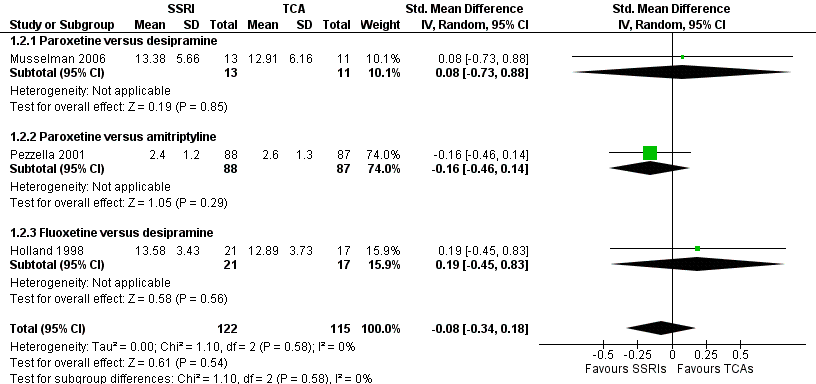
Forest plot of comparison: 1 Depression: efficacy at 6‐12 weeks (continuous outcome), outcome: 1.2 Antidepressants versus Antidepressants.

Comparison 1 Depression: efficacy as a continuous outcome at 6 to 12 weeks, Outcome 1 Antidepressants versus placebo.

Comparison 1 Depression: efficacy as a continuous outcome at 6 to 12 weeks, Outcome 2 Antidepressants versus antidepressants.
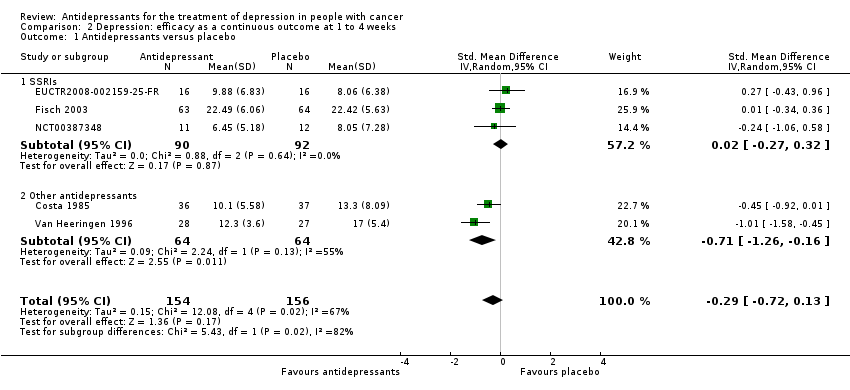
Comparison 2 Depression: efficacy as a continuous outcome at 1 to 4 weeks, Outcome 1 Antidepressants versus placebo.

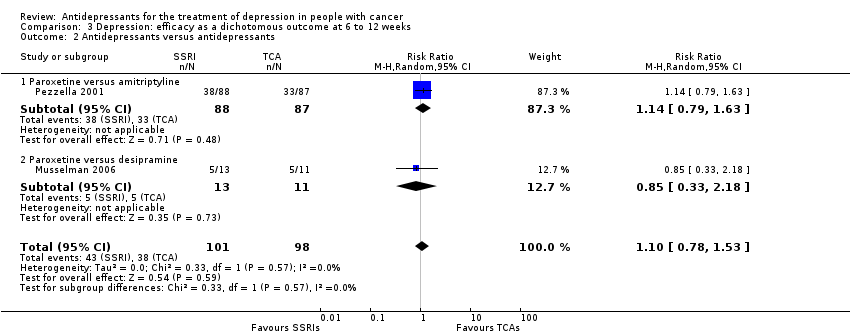
Comparison 3 Depression: efficacy as a dichotomous outcome at 6 to 12 weeks, Outcome 1 Antidepressants versus placebo.
Comparison 3 Depression: efficacy as a dichotomous outcome at 6 to 12 weeks, Outcome 2 Antidepressants versus antidepressants.

Comparison 4 Social adjustment at 6 to 12 weeks, Outcome 1 Antidepressants versus antidepressants.

Comparison 5 Quality of life at 6 to 12 weeks, Outcome 1 Antidepressants versus placebo.

Comparison 5 Quality of life at 6 to 12 weeks, Outcome 2 Antidepressants versus antidepressants.

Comparison 6 Dropouts due to inefficacy, Outcome 1 Antidepressants versus placebo.

Comparison 6 Dropouts due to inefficacy, Outcome 2 Antidepressants versus antidepressants.
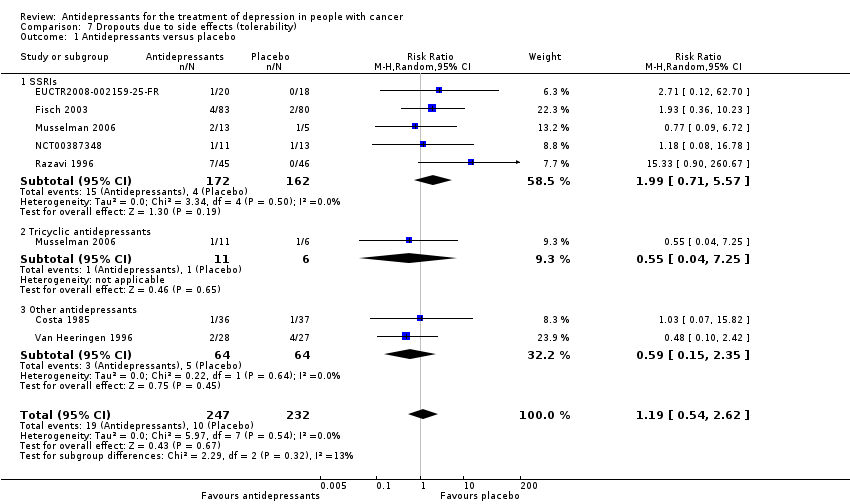
Comparison 7 Dropouts due to side effects (tolerability), Outcome 1 Antidepressants versus placebo.
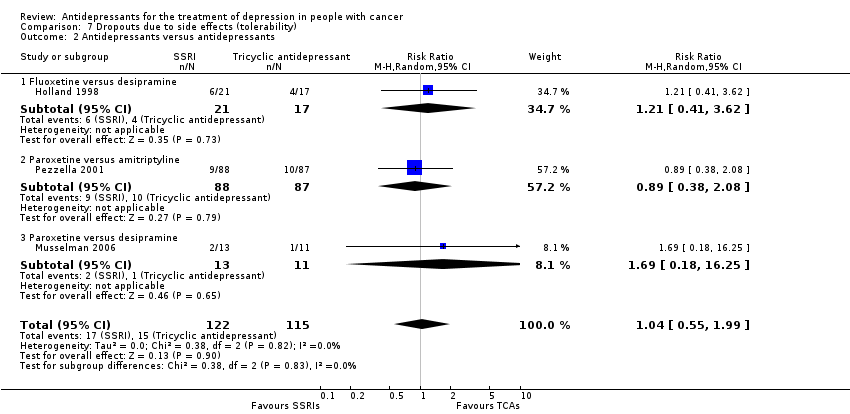
Comparison 7 Dropouts due to side effects (tolerability), Outcome 2 Antidepressants versus antidepressants.

Comparison 8 Dropouts due to any cause (acceptability), Outcome 1 Antidepressants versus placebo.
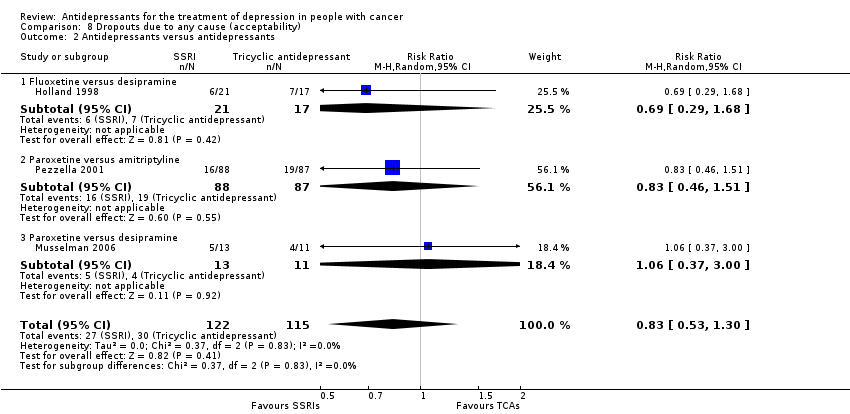
Comparison 8 Dropouts due to any cause (acceptability), Outcome 2 Antidepressants versus antidepressants.

Comparison 9 Subgroup analysis: psychiatric diagnosis, Outcome 1 Antidepressants versus placebo.

Comparison 9 Subgroup analysis: psychiatric diagnosis, Outcome 2 Antidepressants versus antidepressants.

Comparison 10 Subgroup analysis: cancer site, Outcome 1 Antidepressants versus placebo.
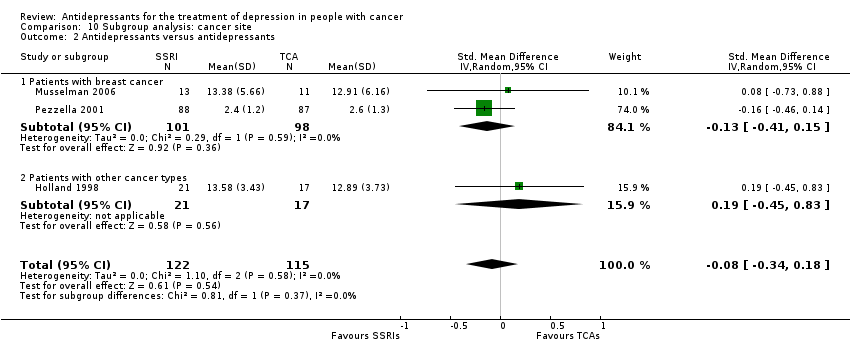
Comparison 10 Subgroup analysis: cancer site, Outcome 2 Antidepressants versus antidepressants.

Comparison 11 Subgroup analysis: cancer stage, Outcome 1 Antidepressants versus placebo.

Comparison 11 Subgroup analysis: cancer stage, Outcome 2 Antidepressants versus antidepressants.

Comparison 12 Sensitivity analysis: excluding trials that did not employ depressive symptoms as their primary outcome, Outcome 1 Antidepressants versus placebo.

Comparison 13 Sensitivity analysis: excluding trials with imputed data, Outcome 1 Antidepressants versus placebo.
| Antidepressants compared to placebo for patients with cancer and depression | ||||||
| Patient or population: adults with cancer and depression | ||||||
| Outcomes | Illustrative comparative risks* (95% CI) | Relative effect | No of participants | Certainity (quality) of the evidence | Comments | |
| Assumed risk | Corresponding risk | |||||
| Placebo | Antidepressants | |||||
| Efficacy as a continuous outcome | The mean efficacy as a continuous outcome (SMD) in the intervention groups was | 266 | ⊕⊝⊝⊝ | |||
| Efficacy as a dichotomous outcome | 358 per 1000 | 294 per 1000 | RR 0.82 | 417 | ⊕⊝⊝⊝ | |
| Dropouts due to any cause (acceptability) | 215 per 1000 | 187 per 1000 | RR 0.85 | 479 | ⊕⊝⊝⊝ | |
| *The basis for the assumed risk (e.g. the median control group risk across studies) is provided in footnotes. The corresponding risk (and its 95% confidence interval) is based on the assumed risk in the comparison group and the relative effect of the intervention (and its 95% CI). | ||||||
| GRADE Working Group grades of evidence | ||||||
| 1 Downgraded as no studies described the outcome assessment as masked. This should be considered a major limitation, which is likely to result in a biased assessment of the intervention effect. | ||||||
| SSRIs compared to TCAs for patients with cancer and depression | ||||||
| Patient or population: patients with cancer and depression | ||||||
| Outcomes | Illustrative comparative risks* (95% CI) | Relative effect | No of participants | Certainty (Quality) of the evidence | Comments | |
| Assumed risk | Corresponding risk | |||||
| TCAs | SSRIs | |||||
| Efficacy as a continuous outcome | The mean efficacy as a continuous outcome (SMD) in the intervention groups was | 237 | ⊕⊝⊝⊝ | |||
| Efficacy as a dichotomous outcome | Study population | RR 1.10 (0.78 to 1.53 | 199 | ⊕⊝⊝⊝ | ||
| 388 per 1000 | 454 per 1000 | |||||
| Dropouts due to any cause (acceptability) | Study population | RR 0.83 | 237 | ⊕⊝⊝⊝ | ||
| 261 per 1000 | 217 per 1000 | |||||
| *The basis for the assumed risk (e.g. the median control group risk across studies) is provided in footnotes. The corresponding risk (and its 95% confidence interval) is based on the assumed risk in the comparison group and the relative effect of the intervention (and its 95% CI). | ||||||
| GRADE Working Group grades of evidence | ||||||
| 1 Downgraded as no studies described the outcome assessment as masked. This should be considered a major limitation, which is likely to result in a biased assessment of the intervention effect. | ||||||
| Outcome or subgroup title | No. of studies | No. of participants | Statistical method | Effect size |
| 1 Antidepressants versus placebo Show forest plot | 5 | 266 | Std. Mean Difference (IV, Random, 95% CI) | ‐0.45 [‐1.01, 0.11] |
| 1.1 SSRIs | 4 | 194 | Std. Mean Difference (IV, Random, 95% CI) | ‐0.21 [‐0.50, 0.08] |
| 1.2 Tricyclic antidepressants | 1 | 17 | Std. Mean Difference (IV, Random, 95% CI) | 0.04 [‐0.95, 1.04] |
| 1.3 Other antidepressants | 1 | 55 | Std. Mean Difference (IV, Random, 95% CI) | ‐1.77 [‐2.40, ‐1.14] |
| 2 Antidepressants versus antidepressants Show forest plot | 3 | 237 | Std. Mean Difference (IV, Random, 95% CI) | ‐0.08 [‐0.34, 0.18] |
| 2.1 Paroxetine versus desipramine | 1 | 24 | Std. Mean Difference (IV, Random, 95% CI) | 0.08 [‐0.73, 0.88] |
| 2.2 Paroxetine versus amitriptyline | 1 | 175 | Std. Mean Difference (IV, Random, 95% CI) | ‐0.16 [‐0.46, 0.14] |
| 2.3 Fluoxetine versus desipramine | 1 | 38 | Std. Mean Difference (IV, Random, 95% CI) | 0.19 [‐0.45, 0.83] |
| Outcome or subgroup title | No. of studies | No. of participants | Statistical method | Effect size |
| 1 Antidepressants versus placebo Show forest plot | 5 | 310 | Std. Mean Difference (IV, Random, 95% CI) | ‐0.29 [‐0.72, 0.13] |
| 1.1 SSRIs | 3 | 182 | Std. Mean Difference (IV, Random, 95% CI) | 0.02 [‐0.27, 0.32] |
| 1.2 Other antidepressants | 2 | 128 | Std. Mean Difference (IV, Random, 95% CI) | ‐0.71 [‐1.26, ‐0.16] |
| Outcome or subgroup title | No. of studies | No. of participants | Statistical method | Effect size |
| 1 Antidepressants versus placebo Show forest plot | 5 | 417 | Risk Ratio (M‐H, Random, 95% CI) | 0.82 [0.62, 1.08] |
| 1.1 SSRIs | 3 | 272 | Risk Ratio (M‐H, Random, 95% CI) | 0.94 [0.79, 1.11] |
| 1.2 Tricyclic antidepressants | 1 | 17 | Risk Ratio (M‐H, Random, 95% CI) | 1.09 [0.42, 2.86] |
| 1.3 Other antidepressants | 2 | 128 | Risk Ratio (M‐H, Random, 95% CI) | 0.47 [0.30, 0.75] |
| 2 Antidepressants versus antidepressants Show forest plot | 2 | 199 | Risk Ratio (M‐H, Random, 95% CI) | 1.10 [0.78, 1.53] |
| 2.1 Paroxetine versus amitriptyline | 1 | 175 | Risk Ratio (M‐H, Random, 95% CI) | 1.14 [0.79, 1.63] |
| 2.2 Paroxetine versus desipramine | 1 | 24 | Risk Ratio (M‐H, Random, 95% CI) | 0.85 [0.33, 2.18] |
| Outcome or subgroup title | No. of studies | No. of participants | Statistical method | Effect size |
| 1 Antidepressants versus antidepressants Show forest plot | 1 | 175 | Mean Difference (IV, Random, 95% CI) | 0.10 [‐0.38, 0.58] |
| 1.1 Paroxetine versus amitriptyline | 1 | 175 | Mean Difference (IV, Random, 95% CI) | 0.10 [‐0.38, 0.58] |
| Outcome or subgroup title | No. of studies | No. of participants | Statistical method | Effect size |
| 1 Antidepressants versus placebo Show forest plot | 2 | 152 | Std. Mean Difference (IV, Random, 95% CI) | 0.05 [‐0.27, 0.37] |
| 1.1 SSRIs | 2 | 152 | Std. Mean Difference (IV, Random, 95% CI) | 0.05 [‐0.27, 0.37] |
| 2 Antidepressants versus antidepressants Show forest plot | 1 | 153 | Mean Difference (IV, Random, 95% CI) | 6.5 [0.21, 12.79] |
| 2.1 Paroxetine versus amitriptyline | 1 | 153 | Mean Difference (IV, Random, 95% CI) | 6.5 [0.21, 12.79] |
| Outcome or subgroup title | No. of studies | No. of participants | Statistical method | Effect size |
| 1 Antidepressants versus placebo Show forest plot | 6 | 455 | Risk Ratio (M‐H, Random, 95% CI) | 0.41 [0.13, 1.32] |
| 1.1 SSRIs | 4 | 310 | Risk Ratio (M‐H, Random, 95% CI) | 0.87 [0.10, 7.31] |
| 1.2 Tricyclic antidepressants | 1 | 17 | Risk Ratio (M‐H, Random, 95% CI) | 2.92 [0.16, 52.47] |
| 1.3 Other antidepressants | 2 | 128 | Risk Ratio (M‐H, Random, 95% CI) | 0.18 [0.05, 0.65] |
| 2 Antidepressants versus antidepressants Show forest plot | 3 | 237 | Risk Ratio (M‐H, Random, 95% CI) | 0.85 [0.14, 5.06] |
| 2.1 Fluoxetine versus desipramine | 1 | 38 | Risk Ratio (M‐H, Random, 95% CI) | 0.0 [0.0, 0.0] |
| 2.2 Paroxetine versus amitriptyline | 1 | 175 | Risk Ratio (M‐H, Random, 95% CI) | 0.0 [0.0, 0.0] |
| 2.3 Paroxetine versus desipramine | 1 | 24 | Risk Ratio (M‐H, Random, 95% CI) | 0.85 [0.14, 5.06] |
| Outcome or subgroup title | No. of studies | No. of participants | Statistical method | Effect size |
| 1 Antidepressants versus placebo Show forest plot | 7 | 479 | Risk Ratio (M‐H, Random, 95% CI) | 1.19 [0.54, 2.62] |
| 1.1 SSRIs | 5 | 334 | Risk Ratio (M‐H, Random, 95% CI) | 1.99 [0.71, 5.57] |
| 1.2 Tricyclic antidepressants | 1 | 17 | Risk Ratio (M‐H, Random, 95% CI) | 0.55 [0.04, 7.25] |
| 1.3 Other antidepressants | 2 | 128 | Risk Ratio (M‐H, Random, 95% CI) | 0.59 [0.15, 2.35] |
| 2 Antidepressants versus antidepressants Show forest plot | 3 | 237 | Risk Ratio (M‐H, Random, 95% CI) | 1.04 [0.55, 1.99] |
| 2.1 Fluoxetine versus desipramine | 1 | 38 | Risk Ratio (M‐H, Random, 95% CI) | 1.21 [0.41, 3.62] |
| 2.2 Paroxetine versus amitriptyline | 1 | 175 | Risk Ratio (M‐H, Random, 95% CI) | 0.89 [0.38, 2.08] |
| 2.3 Paroxetine versus desipramine | 1 | 24 | Risk Ratio (M‐H, Random, 95% CI) | 1.69 [0.18, 16.25] |
| Outcome or subgroup title | No. of studies | No. of participants | Statistical method | Effect size |
| 1 Antidepressants versus placebo Show forest plot | 7 | 479 | Risk Ratio (M‐H, Random, 95% CI) | 0.85 [0.52, 1.38] |
| 1.1 SSRIs | 5 | 334 | Risk Ratio (M‐H, Random, 95% CI) | 1.37 [0.84, 2.24] |
| 1.2 Tricyclic antidepressants | 1 | 17 | Risk Ratio (M‐H, Random, 95% CI) | 0.73 [0.24, 2.23] |
| 1.3 Other antidepressants | 2 | 128 | Risk Ratio (M‐H, Random, 95% CI) | 0.43 [0.25, 0.75] |
| 2 Antidepressants versus antidepressants Show forest plot | 3 | 237 | Risk Ratio (M‐H, Random, 95% CI) | 0.83 [0.53, 1.30] |
| 2.1 Fluoxetine versus desipramine | 1 | 38 | Risk Ratio (M‐H, Random, 95% CI) | 0.69 [0.29, 1.68] |
| 2.2 Paroxetine versus amitriptyline | 1 | 175 | Risk Ratio (M‐H, Random, 95% CI) | 0.83 [0.46, 1.51] |
| 2.3 Paroxetine versus desipramine | 1 | 24 | Risk Ratio (M‐H, Random, 95% CI) | 1.06 [0.37, 3.00] |
| Outcome or subgroup title | No. of studies | No. of participants | Statistical method | Effect size |
| 1 Antidepressants versus placebo Show forest plot | 4 | 197 | Std. Mean Difference (IV, Random, 95% CI) | ‐0.51 [‐1.23, 0.21] |
| 1.1 Patients with major depressive disorder | 2 | 90 | Std. Mean Difference (IV, Random, 95% CI) | ‐0.58 [‐1.94, 0.78] |
| 1.2 Patients with adjustment disorder, dysthymic disorder, depressive symptoms | 2 | 107 | Std. Mean Difference (IV, Random, 95% CI) | ‐0.28 [‐0.67, 0.10] |
| 2 Antidepressants versus antidepressants Show forest plot | 2 | 199 | Std. Mean Difference (IV, Random, 95% CI) | ‐0.13 [‐0.41, 0.15] |
| 2.1 Patients with major depressive disorder | 2 | 199 | Std. Mean Difference (IV, Random, 95% CI) | ‐0.13 [‐0.41, 0.15] |
| 2.2 Patients with adjustment disorder, dysthymic disorder, depressive symptoms | 0 | 0 | Std. Mean Difference (IV, Random, 95% CI) | 0.0 [0.0, 0.0] |
| Outcome or subgroup title | No. of studies | No. of participants | Statistical method | Effect size |
| 1 Antidepressants versus placebo Show forest plot | 5 | 266 | Std. Mean Difference (IV, Random, 95% CI) | ‐0.45 [‐1.01, 0.11] |
| 1.1 Patients with breast cancer | 2 | 90 | Std. Mean Difference (IV, Random, 95% CI) | ‐0.58 [‐1.94, 0.78] |
| 1.2 Patients with other cancer types | 3 | 176 | Std. Mean Difference (IV, Random, 95% CI) | ‐0.24 [‐0.54, 0.06] |
| 2 Antidepressants versus antidepressants Show forest plot | 3 | 237 | Std. Mean Difference (IV, Random, 95% CI) | ‐0.08 [‐0.34, 0.18] |
| 2.1 Patients with breast cancer | 2 | 199 | Std. Mean Difference (IV, Random, 95% CI) | ‐0.13 [‐0.41, 0.15] |
| 2.2 Patients with other cancer types | 1 | 38 | Std. Mean Difference (IV, Random, 95% CI) | 0.19 [‐0.45, 0.83] |
| Outcome or subgroup title | No. of studies | No. of participants | Statistical method | Effect size |
| 1 Antidepressants versus placebo Show forest plot | 2 | 93 | Std. Mean Difference (IV, Random, 95% CI) | ‐0.25 [‐0.66, 0.16] |
| 1.1 Patients with an early stage cancer | 1 | 69 | Std. Mean Difference (IV, Random, 95% CI) | ‐0.17 [‐0.65, 0.31] |
| 1.2 Patients with a late stage cancer | 1 | 24 | Std. Mean Difference (IV, Random, 95% CI) | ‐0.48 [‐1.30, 0.33] |
| 2 Antidepressants versus antidepressants Show forest plot | 1 | 38 | Mean Difference (IV, Random, 95% CI) | 0.69 [‐1.61, 2.99] |
| 2.1 Patients with an early stage cancer | 1 | 38 | Mean Difference (IV, Random, 95% CI) | 0.69 [‐1.61, 2.99] |
| 2.2 Patients with a late stage cancer | 0 | 0 | Mean Difference (IV, Random, 95% CI) | 0.0 [0.0, 0.0] |
| Outcome or subgroup title | No. of studies | No. of participants | Statistical method | Effect size |
| 1 Antidepressants versus placebo Show forest plot | 4 | 183 | Std. Mean Difference (IV, Random, 95% CI) | ‐0.49 [‐1.23, 0.25] |
| 1.1 SSRIs | 3 | 111 | Std. Mean Difference (IV, Random, 95% CI) | ‐0.20 [‐0.58, 0.18] |
| 1.2 Tricyclic antidepressants | 1 | 17 | Std. Mean Difference (IV, Random, 95% CI) | 0.04 [‐0.95, 1.04] |
| 1.3 Other antidepressants | 1 | 55 | Std. Mean Difference (IV, Random, 95% CI) | ‐1.77 [‐2.40, ‐1.14] |
| Outcome or subgroup title | No. of studies | No. of participants | Statistical method | Effect size |
| 1 Antidepressants versus placebo Show forest plot | 4 | 231 | Std. Mean Difference (IV, Random, 95% CI) | ‐0.64 [‐1.35, 0.06] |
| 1.1 SSRIs | 3 | 176 | Std. Mean Difference (IV, Random, 95% CI) | ‐0.24 [‐0.54, 0.06] |
| 1.2 Tricyclic antidepressants | 0 | 0 | Std. Mean Difference (IV, Random, 95% CI) | 0.0 [0.0, 0.0] |
| 1.3 Other antidepressants | 1 | 55 | Std. Mean Difference (IV, Random, 95% CI) | ‐1.77 [‐2.40, ‐1.14] |