Comparison of different platelet count thresholds to guide administration of prophylactic platelet transfusion for preventing bleeding in people with haematological disorders after myelosuppressive chemotherapy or stem cell transplantation
Abstract
Background
Platelet transfusions are used in modern clinical practice to prevent and treat bleeding in people who are thrombocytopenic due to bone marrow failure. Although considerable advances have been made in platelet transfusion therapy in the last 40 years, some areas continue to provoke debate, especially concerning the use of prophylactic platelet transfusions for the prevention of thrombocytopenic bleeding.
This is an update of a Cochrane review first published in 2004, and previously updated in 2012 that addressed four separate questions: prophylactic versus therapeutic‐only platelet transfusion policy; prophylactic platelet transfusion threshold; prophylactic platelet transfusion dose; and platelet transfusions compared to alternative treatments. This review has now been split into four smaller reviews looking at these questions individually; this review compares prophylactic platelet transfusion thresholds.
Objectives
To determine whether different platelet transfusion thresholds for administration of prophylactic platelet transfusions (platelet transfusions given to prevent bleeding) affect the efficacy and safety of prophylactic platelet transfusions in preventing bleeding in people with haematological disorders undergoing myelosuppressive chemotherapy or haematopoietic stem cell transplantation (HSCT).
Search methods
We searched for randomised controlled trials (RCTs) in the Cochrane Central Register of Controlled Trials (CENTRAL) (Cochrane Library 2015, Issue 6, 23 July 2015), MEDLINE (from 1946), Embase (from 1974), CINAHL (from 1937), the Transfusion Evidence Library (from 1950), and ongoing trial databases to 23 July 2015.
Selection criteria
We included RCTs involving transfusions of platelet concentrates, prepared either from individual units of whole blood or by apheresis, and given to prevent bleeding in people with haematological disorders (receiving myelosuppressive chemotherapy or undergoing HSCT) that compared different thresholds for administration of prophylactic platelet transfusions (low trigger (5 x 10⁹/L); standard trigger (10 x 109/L); higher trigger (20 x 109/L, 30 x 109/L, 50 x 109/L); or alternative platelet trigger (for example platelet mass)).
Data collection and analysis
We used the standard methodological procedures expected by Cochrane.
Main results
Three trials met our predefined inclusion criteria and were included for analysis in the review (499 participants). All three trials compared a standard trigger (10 x 109/L) versus a higher trigger (20 x 109/L or 30 x 109/L). None of the trials compared a low trigger versus a standard trigger or an alternative platelet trigger. The trials were conducted between 1991 and 2001 and enrolled participants from fairly comparable patient populations.
The original review contained four trials (658 participants); in the previous update of this review we excluded one trial (159 participants) because fewer than 80% of participants had a haematological disorder. We identified no new trials in this update of the review.
Overall, the methodological quality of the studies was low across different outcomes according to GRADE methodology. None of the included studies were at low risk of bias in every domain, and all the included studies had some threats to validity.
Three studies reported the number of participants with at least one clinically significant bleeding episode within 30 days from the start of the study. There was no evidence of a difference in the number of participants with a clinically significant bleeding episode between the standard and higher trigger groups (three studies; 499 participants; risk ratio (RR) 1.35, 95% confidence interval (CI) 0.95 to 1.90; low‐quality evidence).
One study reported the number of days with a clinically significant bleeding event (adjusted for repeated measures). There was no evidence of a difference in the number of days of bleeding per participant between the standard and higher trigger groups (one study; 255 participants; relative proportion of days with World Health Organization Grade 2 or worse bleeding (RR 1.71, 95% CI 0.84 to 3.48, P = 0.162; authors' own results; low‐quality evidence).
Two studies reported the number of participants with severe or life‐threatening bleeding. There was no evidence of any difference in the number of participants with severe or life‐threatening bleeding between a standard trigger level and a higher trigger level (two studies; 421 participants; RR 0.99, 95% CI 0.52 to 1.88; low‐quality evidence).
Only one study reported the time to first bleeding episode. There was no evidence of any difference in the time to the first bleeding episode between a standard trigger level and a higher trigger level (one study; 255 participants; hazard ratio 1.11, 95% CI 0.64 to 1.91; low‐quality evidence).
Only one study reported on all‐cause mortality within 30 days from the start of the study. There was no evidence of any difference in all‐cause mortality between standard and higher trigger groups (one study; 255 participants; RR 1.78, 95% CI 0.83 to 3.81; low‐quality evidence).
Three studies reported on the number of platelet transfusions per participant. Two studies reported on the mean number of platelet transfusions per participant. There was a significant reduction in the number of platelet transfusions per participant in the standard trigger group (two studies, mean difference ‐2.09, 95% CI ‐3.20 to ‐0.99; low‐quality evidence).
One study reported on the number of transfusion reactions. There was no evidence to demonstrate any difference in transfusion reactions between the standard and higher trigger groups (one study; 79 participants; RR 0.07, 95% CI 0.00 to 1.09).
None of the studies reported on quality of life.
Authors' conclusions
In people with haematological disorders who are thrombocytopenic due to myelosuppressive chemotherapy or HSCT, we found low‐quality evidence that a standard trigger level (10 x 109/L) is associated with no increase in the risk of bleeding when compared to a higher trigger level (20 x 109/L or 30 x 109/L). There was low‐quality evidence that a standard trigger level is associated with a decreased number of transfusion episodes when compared to a higher trigger level (20 x 109/L or 30 x 109/L).
Findings from this review were based on three studies and 499 participants. Without further evidence, it is reasonable to continue with the current practice of administering prophylactic platelet transfusions using the standard trigger level (10 x 109/L) in the absence of other risk factors for bleeding.
PICOs
Plain language summary
Platelet transfusions are used to prevent bleeding in people with low platelet counts due to treatment‐induced bone marrow failure
Review question
We evaluated the evidence about whether platelet transfusions given to prevent bleeding in people with lower platelet counts (for example 5 x 10⁹/L or below) were as effective and safe as the current standard (10 x 109/L or below), or whether higher platelet count levels (20 x 109/L or below, 30 x 109/L or below, or 50 x 109/L or below) were safer than the current standard (10 x 109/L or below). Our target population was people with blood cancers (for example leukaemia, lymphoma, myeloma) who were receiving intensive (myelosuppressive) chemotherapy treatments or stem cell transplantation.
Background
People with blood cancers may have low platelet counts due to their underlying cancer. Blood cancers may be treated with chemotherapy and stem cell transplantation, and these treatments can cause low platelet counts. Platelet transfusions may be given to prevent bleeding when the platelet count falls below a prespecified threshold platelet count (for example 10 x 109/L), or may be given to treat bleeding (such as a prolonged nosebleed or multiple bruises). Giving platelet transfusions at a lower prespecified threshold platelet count may increase the chance that bleeding will occur, which may be harmful, whereas giving platelet transfusions at a higher prespecified threshold platelet count may mean that people receive unnecessary platelet transfusions. Platelet transfusions can have adverse effects and have cost and resource implications for health services, so unnecessary transfusions should be avoided.
Study characteristics
The evidence is current to July 2015. We found no new studies in this update of the review. This review identified three randomised controlled trials that compared giving platelet transfusions to prevent bleeding when the platelet count is 10 x 109/L (the current standard) or below versus giving platelet transfusions to prevent bleeding at higher platelet count levels (20 x 109/L or below or 30 x 109/L or below). None of the studies compared a lower trigger or alternative trigger to the current standard. These trials were conducted between 1991 and 2001 and included 499 participants. Two trials included adults with leukaemia who were receiving chemotherapy. One trial included children and adults receiving a stem cell transplant.
Two of the three studies reported sources of funding. Neither of the studies that reported funding sources were industry sponsored.
Key results
Giving platelet transfusions to people with low platelet counts due to blood cancers or their treatment to prevent bleeding when the platelet count was 10 x 109/L or below did not increase the risk of bleeding compared to giving a platelet transfusion at higher platelet counts (20 x 109/L or below or 30 x 109/L or below).
Giving platelet transfusions to prevent bleeding only when the platelet count was 10 x 109/L or below resulted in a reduction in the number of platelets given. We found no evidence to demonstrate that giving a platelet transfusion when the platelet count was 10 x 109/L or below decreased the number of transfusion reactions compared to giving platelet transfusions at higher platelet counts (20 x 109/L or below or 30 x 109/L or below).
None of the three studies reported any quality of life outcomes.
Findings from this review were based on three studies and 499 participants. Without further evidence, it is reasonable to continue using platelet transfusions to prevent bleeding based on the current standard transfusion threshold (10 x 109/L).
Quality of the evidence
The evidence for most of the findings was of low quality. This was because participants and their doctors knew which study arm the participant had been allocated to, and also the estimate of the treatment effect was imprecise.
Authors' conclusions
Summary of findings
| Prophylactic platelet transfusion at threshold of 10,000 compared to higher transfusion threshold (20,000 or 30,000) for prevention of haemorrhage after chemotherapy and stem cell transplantation | ||||||
| Patient or population: People with a haematological disorder | ||||||
| Outcomes | Illustrative comparative risks* (95% CI) | Relative effect | No of Participants | Quality of the evidence | Comments | |
| Assumed risk | Corresponding risk | |||||
| Higher transfusion threshold (20 x 109/L or 30 x 109/L) | Prophylactic platelet transfusion at threshold of 10 x 109/L | |||||
| Numbers of participants with at least 1 clinically significant bleeding event up to 30 days from study entry | 177 per 1000 | 239 per 1000 | RR 1.35 | 499 | ⊕⊕⊝⊝ | The definition of clinically significant bleeding varied between studies, because there were differences in the way bleeding was graded |
| Number of days on which clinically significant bleeding occurred per participant up to 30 days from study entry | Not estimable3 | Not estimable3 | Not estimable3 | 255 (1 study) | ⊕⊕⊝⊝ | ‐ |
| Number of participants with WHO Grade 3 or 4 bleeding up to 30 days from study entry | 82 per 1000 | 81 per 1000 (43 to 154) | RR 0.99 (0.52 to 1.88) | 421 (2 studies) | ⊕⊕⊝⊝ | ‐ |
| Time to first bleeding episode (days) | ‐ | ‐ | HR 1.11 (0.64 to 1.91) | 255 (1 study) | ⊕⊕⊝⊝ | ‐ |
| Number of platelet transfusions per participant up to 30 days from study entry | The mean number of platelet transfusions per participant in the 10 x 109/L group was | ‐ | 333 | ⊕⊕⊝⊝ | ‐ | |
| Mortality from all causes up to 30 days from study entry | 75 per 1000 | 134 per 1000 (62 to 286) | RR 1.78 (0.83 to 3.81) | 255 (1 study) | ⊕⊕⊝⊝ | ‐ |
| Quality of life ‐ not reported | Not estimable | Not estimable | Not estimable | ‐ | See comment | None of the studies reported quality of life |
| *The basis for the assumed risk (e.g. the median control group risk across studies) is provided in footnotes. The corresponding risk (and its 95% confidence interval) is based on the assumed risk in the comparison group and the relative effect of the intervention (and its 95% CI). | ||||||
| GRADE Working Group grades of evidence | ||||||
| 1The number of participants from all three studies may not be large enough to detect a clinically significant difference. The confidence intervals are wide, and therefore there is uncertainty about the result. The level of evidence was downgraded by 1 due to imprecision. 2All of the studies were at high risk of bias due to lack of blinding and more protocol deviations in the standard‐trigger arm (10 x 109/L). The Rebulla study did not perform an intention‐to‐treat analysis and excluded 2 participants who died within 24 hours of entering the study. The level of evidence was downgraded by 1 due to risk of bias. 3The authors of Rebulla 1997 reported a relative proportion of days with WHO Grade 2 or worse bleeding of 1.71 (95% CI 0.84 to 3.48) for the standard versus higher transfusion trigger arms. A permutation test for the comparison of these proportions gives a P value of 0.162, and therefore no significant difference between study arms was found. These results are the authors' own results. | ||||||
Background
Description of the condition
Haematological malignancies account for between 8% and 9% of all new cancers reported in the United Kingdom and United States (CDC 2012; ONS 2012), and their incidence is increasing (11% to 14% increase in new cases of lymphoma and myeloma between 1991 to 2001 and 2008 to 2010, respectively) (Cancer Research UK 2013). The prevalence of these disorders is also increasing due to increased survival rates (Coleman 2004; Rachet 2009), which are the result of the introduction of intensive chemotherapy treatments and use of stem cell transplantation (Burnett 2011; Fielding 2007; Patel 2009). Over 50,000 haematopoietic stem cell transplants (HSCT) are carried out annually worldwide and are used to treat both malignant and non‐malignant haematological disorders (Gratwohl 2010). Autologous HSCT is the most common type of HSCT (57% to 59%) (Gratwohl 2010; Passweg 2012). However, chemotherapy or stem cell transplantation can lead to prolonged periods of severe thrombocytopenia (De la Serna 2008; Heddle 2009a; Rysler 2010; Stanworth 2013; Wandt 2012).
Platelet transfusions are used in modern clinical practice to prevent and treat bleeding in thrombocytopenic patients with bone marrow failure secondary to chemotherapy or stem cell transplantation. The ready availability of platelet concentrates has undoubtedly made a major contribution in allowing the development of intensive treatment regimens for haematological disorders (malignant and non‐malignant) and other malignancies. The first demonstration of the effectiveness of platelet transfusions was performed in 1910 (Duke 1910). However, it was not until the 1970s and 1980s that the use of platelet transfusions became standard treatment for thrombocytopenic patients with bone marrow failure (Blajchman 2008). Alongside changes in supportive care, the routine use of platelet transfusions in people with haematological disorders since that time has led to a marked decrease in the number of haemorrhagic deaths associated with thrombocytopenia (Slichter 1980). This has resulted in a considerable increase in the demand for platelet concentrates. Currently, platelet concentrates are the second most frequently used blood component. Administration of platelet transfusions to people with haematological disorders now constitutes a significant proportion (up to 67%) of all platelets issued (Cameron 2007; Greeno 2007; Pendry 2011), and the majority of these (69%) are given to prevent bleeding (Estcourt 2012b).
People can become refractory to platelet transfusions. In an analysis of the TRAP 1997 study data, there was a progressive decrease in the post‐transfusion platelet count increments and time interval between transfusions as the number of preceding transfusions increased (Slichter 2005). This effect was seen irrespective of whether or not participants had developed detectable human leukocyte antigen (HLA) antibodies (Slichter 2005).
Platelet transfusions are also associated with adverse events. Mild to moderate reactions to platelet transfusions include rigors, fever, and urticaria (Heddle 2009b). Although these reactions are not life‐threatening, they can be extremely distressing for the patient. Rarer but more serious sequelae include anaphylaxis, transfusion‐transmitted infections, transfusion‐related acute lung injury, and immunomodulatory effects (Benson 2009; Blumberg 2009; Bolton‐Maggs 2012; Heddle 2009b; Knowles 2011; Pearce 2011; Popovsky 1985; Silliman 2003; Taylor 2010).
Any strategy that can safely decrease the need for prophylactic platelet transfusions in people with haematological malignancies will have significant logistical and financial implications as well as decreasing patients’ exposure to the risks of transfusion.
Description of the intervention
Platelet transfusions have an obvious beneficial effect in the management of active bleeding in people with haematological malignancy and severe thrombocytopenia. However, questions still remain about how this limited resource should be used to prevent severe and life‐threatening bleeding (Estcourt 2011). Prophylactic platelet transfusions for people with chemotherapy‐induced thrombocytopenia became standard practice following the publication of several small randomised controlled trials (RCTs) in the late 1970s and early 1980s (Higby 1974; Murphy 1982; Solomon 1978).
Prophylactic platelet transfusion threshold
Prophylactic platelet transfusions are typically given when blood platelet counts fall below a given trigger level. Studies have compared different platelet count thresholds to trigger the administration of prophylactic platelet transfusions. The current consensus is that people should receive a platelet transfusion when the platelet count is less than 10 x 109/L, unless there are other risk factors for bleeding such as sepsis, concurrent use of antibiotics, or other abnormalities of haemostasis (BCSH 2003; BCSH 2004; Board 2009; NBA 2012; Schiffer 2001; Slichter 2007; Tinmouth 2007). The experimental interventions were higher or lower platelet transfusion thresholds.
The previous review raised the issue that a platelet count of 10 x 109/L may not be equivalent to 20 x 109/L as previously thought (Estcourt 2012a).
How the intervention might work
Prophylactic platelet threshold
The morning platelet count has traditionally been used to indicate when a patient requires prophylactic platelet transfusions. It became standard practice to transfuse platelets at platelet counts below 20 x 109/L, in an attempt to prevent bleeding (Beutler 1993). This practice was partly based on the findings of non‐randomised studies that showed that gross haemorrhage (haematuria, haematemesis, and melaena) was present at platelet counts below 5 x 10⁹/L more frequently than when the platelet count was between 5 x 10⁹/L and 100 x 109/L (Gaydos 1962; Slichter 1978). However, these studies did not clearly support the use of a threshold for prophylactic platelet transfusion of 20 x 109/L, nor was any threshold effect seen (Gaydos 1962; Slichter 1978). A similar pattern of increased bleeding at platelet counts ≤ 5 x 10⁹/L was also seen in two recent RCTs (Slichter 2010; Wandt 2012).
The routine use of platelet transfusions in people with haematological malignancies from the 1970s resulted in a decreased mortality rate due to bleeding (less than 1% of patients) (Slichter 1980). Despite the lack of evidence, the widespread use of a threshold platelet count of 20 x 109/L for prophylactic platelet transfusions led to a marked growth in the demand for platelet concentrates (Sullivan 2002). This increased demand stimulated research to address whether the threshold could be safely lowered to 10 x 109/L (Rebulla 1997, reviewed in Stanworth 2004). The consensus formulated from these trials was that people should receive a platelet transfusion when the platelet count is < 10 x 109/L, unless there are other risk factors for bleeding such as sepsis, concurrent use of antibiotics, or other abnormalities of haemostasis (BCSH 2003; BCSH 2004; Board 2009; NBA 2012; Schiffer 2001; Slichter 2007; Tinmouth 2007), when the threshold should be raised.
There have been calls for a further reduction in the threshold to 5 x 10⁹/L because of the previously mentioned evidence for an increased rate of bleeding at a platelet count of ≤ 5 x 10⁹/L (BCSH 2003; Gmür 1991). However, a major concern in doing this is the reported inaccuracy of current automated counters when the platelet count is very low (Harrison 2001). This was well demonstrated in a large multi‐centre study of platelet analyser accuracy when measuring platelet counts < 20 x 109/L (Segal 2005).
Platelet mass has been used as a transfusion trigger for neonatal platelet transfusions (Gerday 2009). Different platelet count thresholds have been the only known trigger used in people with a haematological disorder.
Assessment of bleeding
A bleeding assessment has been seen as a more clinically relevant measure of the effect of platelet transfusions than surrogate markers such as the platelet increment.
Any review that uses bleeding as a primary outcome measure needs to assess the way that the trials have recorded bleeding. Unfortunately, the way bleeding has been recorded and assessed has varied markedly between trials (Cook 2004; Estcourt 2013; Heddle 2003).
Retrospective analysis of bleeding leads to a risk of bias because bleeding events may be missed, and only more severe bleeding is likely to have been documented. Prospective bleeding assessment forms provide more information and are less likely to miss bleeding events. However, different assessors may grade the same bleed differently, and it is very difficult to blind the assessor to the intervention.
The majority of trials have used the WHO system, or a modification of it, for grading bleeding (Estcourt 2013; Koreth 2004; WHO 1979). One limitation of all the scoring systems based on the WHO system is that the categories are relatively broad and subjective, meaning that a small change in a participant's bleeding risk may not be detected. Another limitation is that the modified WHO categories are partially defined by whether a bleeding participant requires a blood transfusion. The threshold for intervention may vary between clinicians and institutions, and so the same level of bleeding may be graded differently in different institutions.
The definition of what constitutes clinically significant bleeding has varied between studies. Although the majority of more recent platelet transfusion studies have classified it as WHO Grade 2 or above (Heddle 2009a; Slichter 2010; Stanworth 2010; Wandt 2012), in the past there has been greater heterogeneity (Cook 2004; Estcourt 2013; Koreth 2004). The difficulties of assessing and grading bleeding may limit the ability to compare results between studies, and this needs to be kept in mind when reviewing the evidence for the effectiveness of prophylactic platelet transfusions at different doses.
Why it is important to do this review
Although considerable advances have been made in platelet transfusion therapy in the last 40 years, 3 major areas continue to provoke debate.
-
Firstly, what is the optimal prophylactic platelet dose to prevent thrombocytopenic bleeding?
-
Secondly, which threshold should be used to trigger the transfusion of prophylactic platelets?
-
Thirdly, are prophylactic platelet transfusions superior to therapeutic platelet transfusions for the prevention or control of life‐threatening thrombocytopenic bleeding?
The initial formulation of this Cochrane review attempted to answer these questions, but the evidence at the time was insufficient for us to draw any definitive conclusions (Stanworth 2004). This review was updated (Estcourt 2012a). For clarity and simplicity, we have now split the review to answer each question separately.
This review focuses solely on the second question: Which threshold should be used to trigger the transfusion of prophylactic platelets?
Avoiding the need for unnecessary prophylactic platelet transfusions in people with haematological disorders will have significant logistical and financial implications for national health services as well as decreasing patients' exposure to the risks of transfusion. These factors are perhaps even more important in the development of platelet transfusion strategies in low‐income countries, where access to blood components is much more limited than in high‐income countries (Verma 2009).
This review did not assess the evidence for the answers to the other two questions, as these are the focus of separate Cochrane reviews, nor did it assess the use of alternative agents instead of prophylactic platelet transfusions because this is the focus of another review.
This review did not assess whether there are any differences in the efficacy of apheresis versus whole‐blood derived platelet products, the efficacy of pathogen‐reduced platelet components, the efficacy of human leukocyte antigen (HLA)‐matched versus random‐donor platelets, or differences between ABO identical and ABO non‐identical platelet transfusions, as recent systematic reviews have covered these topics (Butler 2013; Heddle 2008; Pavenski 2013; Shehata 2009).
Objectives
To determine whether different platelet transfusion thresholds for administration of prophylactic platelet transfusions (platelet transfusions given to prevent bleeding) affect the efficacy and safety of prophylactic platelet transfusions in preventing bleeding in people with haematological disorders undergoing myelosuppressive chemotherapy or haematopoietic stem cell transplantation (HSCT).
Methods
Criteria for considering studies for this review
Types of studies
We included randomised controlled trials (RCTs) in this review irrespective of language or publication status.
Types of participants
People with haematological disorders receiving treatment with myelosuppressive chemotherapy or stem cell transplantation, or both. We included people of all ages, in both inpatient and outpatient clinical settings. If trials consisted of mixed populations of patients (for example people with diagnoses of solid tumours), we used only data from the haematological subgroups. If subgroup data for haematological patients were not provided (after contacting the authors of the trial), we excluded the trial if fewer than 80% of participants had a haematological disorder. We excluded any participants who were not being treated with intensive chemotherapy or a stem cell transplant. We included participants with non‐malignant haematological disorders (for example aplastic anaemia, congenital bone marrow failure syndromes) who were being treated with an allogeneic stem cell transplant. These participants would be expected to be thrombocytopenic during pre‐transplant conditioning therapy and during the transplantation period, requiring platelet transfusion support.
Types of interventions
Participants received transfusions of platelet concentrates, prepared either from individual units of whole blood or by apheresis, and given prophylactically to prevent bleeding. Prophylactic platelet transfusions are typically given when blood platelet counts fall below a given trigger level. There was no restriction on dose or frequency of platelet transfusion or the type of platelet component, but we took this information into account in the analysis, where available.
We included the following comparisons:
-
Lower platelet count threshold (5 x 10⁹/L) versus standard platelet transfusion threshold (10 x 109/L).
-
Higher platelet count threshold (20 x 109/L, 30 x 109/L, or 50 x 109/L) versus standard platelet transfusion threshold (10 x 109/L).
-
Different platelet count thresholds (5 x 10⁹/L, 20 x 109/L, 30 x 109/L, or 50 x 109/L) that do not include a comparison against the standard platelet transfusion threshold (10 x 109/L).
-
Alternative thresholds to guide prophylactic platelet transfusions (e.g. platelet mass, immature platelet fraction, absolute immature platelet number). As there are currently no standard thresholds used for these alternative platelet measures, we planned to use the study's own thresholds for these alternative measures.
Types of outcome measures
Primary outcomes
Number and severity of bleeding episodes during the first 30 days of the study:
-
The number of participants with at least one bleeding episode.
-
The total number of days on which bleeding occurred.
-
Number of participants with at least one episode of severe or life‐threatening haemorrhage.
-
Time to first bleeding episode from the start of study.
Secondary outcomes
-
Mortality (all‐causes, secondary to bleeding, and secondary to infection) within 30 and 90 days from the start of the study.
-
Number of platelet transfusions per participant and number of platelet components per participant within 30 days from the start of the study.
-
Number of red cell transfusions per participant and number of red cell components per participant within 30 days from the start of the study.
-
Platelet transfusion interval within 30 days from the start of the study.
-
Proportion of participants requiring additional interventions to stop bleeding (surgical, medical e.g. tranexamic acid, other blood products e.g. fresh frozen plasma (FFP), cryoprecipitate).
-
Overall survival within 30, 90, and 180 days from the start of the study.
-
Proportion of participants achieving complete remission within 30 and 90 days from the start of the study.
-
Total time in hospital within 30 days from the start of the study.
-
Adverse effects of treatments (transfusion reactions, thromboembolism, transfusion‐transmitted infection, development of platelet antibodies, development of platelet refractoriness) within 30 days from the start of the study.
-
Quality of life, as defined by the individual studies.
We expressed all primary and secondary outcomes in the formats defined in the Measures of treatment effect section of this protocol if data were available, except for two of our outcomes that we planned to be only narrative reports.
These were:
-
Platelet transfusion interval, as it can be calculated in many different ways and it was unlikely that the exact methodology would be reported sufficiently to allow us to combine the data.
-
Assessment of quality of life (QoL). We planned to use the study's own measure, as there is no definitive patient‐reported outcome measure for this patient group (Estcourt 2014e).
However, none of the included studies reported either of these outcomes.
Search methods for identification of studies
The Systematic Review Initiative (SRI) Information Specialist (CD) formulated new search strategies in collaboration with the Cochrane Haematological Malignancies Review Group based on those used in previous versions of this review (Estcourt 2012a; Stanworth 2004).
Electronic searches
Bibliographic databases
We searched for RCTs in the following databases:
-
Cochrane Central Register of Controlled Trials (CENTRAL) (Cochrane Library 2015, Issue 6, 23 July 2015) (Appendix 1)
-
MEDLINE (OvidSP, 1946 to 23 July 2015) (Appendix 2)
-
PubMed (epublications only to 23 July 2015) (Appendix 3)
-
Embase (OvidSp, 1974 to the 23 July 2015) (Appendix 4)
-
CINAHL (EBSCOhost, 1937 to 23 July 2015) (Appendix 5)
-
UKBTS/SRI Transfusion Evidence Library (www.transfusionevidencelibrary.com) (1950 to 23 July 2015) (Appendix 6)
-
Web of Science: Conference Proceedings Citation Index‐Science (CPCI‐S) (Thomson Reuters, 1990 to 23 July 2015) (Appendix 7)
-
LILACS (BIREME/PAHO/WHO, 1982 to to 23 July 2015) (Appendix 8)
-
IndMed (ICMR‐NIC, 1985 to 23 July 2015) (Appendix 9)
-
KoreaMed (KAMJE, 1997 to 23 July 2015) (Appendix 10)
-
PakMediNet (2001 to 23 July 2015) (Appendix 10)
We updated searches from the original search in January 2002, Stanworth 2004, and the updated search on 10 November 2011 (Estcourt 2012a). We combined searches in MEDLINE, Embase, and CINAHL with adaptations of the Cochrane RCT search filters, as detailed in the Cochrane Handbook for Systematic Reviews of Interventions (Lefebvre 2011). We did not limit searches by language or publication status.
Databases of ongoing trials
We also searched ClinicalTrials.gov (http://clinicaltrials.gov/ct2/search) (Appendix 11), the WHO International Clinical Trials Registry (ICTRP) (http://apps.who.int/trialsearch/) (Appendix 11), the ISRCTN Register (http://www.controlled‐trials.com/isrctn/) (Appendix 12), the EU Clinical Trials Register (https://www.clinicaltrialsregister.eu/ctr‐search) (Appendix 12), and the Hong Kong Clinical Trials Register (http://www.hkclinicaltrials.com/) (Appendix 13) in order to identify ongoing trials to 23 July 2015.
All new search strategies are presented as indicated in Appendices 1 to 13. Search strategies for both the original (2002) and update (2011) searches are presented in Appendix 14.
Searching other resources
We augmented database searching with the following.
Handsearching of reference lists
We checked references of all included trials, relevant review articles, and current treatment guidelines for further literature. We limited these searches to the 'first generation' reference lists.
Personal contacts
We contacted authors of relevant studies, study groups, and experts worldwide known to be active in the field for unpublished material or further information on ongoing studies.
Data collection and analysis
Selection of studies
We updated the selection of studies from the selection of studies performed for the previous version of this review (Estcourt 2012a).
Two out of three independent review authors (LE, PB, and CD) initially screened all electronically derived citations and abstracts of papers identified by the review search strategy for relevance. We excluded studies clearly irrelevant at this stage.
Two independent review authors (LE, PB) then formally assessed the full texts of all potentially relevant trials for eligibility against the criteria outlined above. We resolved all disagreements by discussion without the need to consult a third review author (SS). We sought further information from study authors if an article contained insufficient data to make a decision about eligibility. We designed a study eligibility form for trials of platelet transfusion to help in the assessment of relevance, which included ascertaining whether the participants had haematological disorders and whether the two groups could be defined in the trial on the basis of differences in use of prophylactic platelet transfusion doses. We recorded the reasons why potentially relevant studies failed to meet the eligibility criteria.
Data extraction and management
We updated the data extraction from the data extraction performed for the previous version of this review, Estcourt 2012a, to include new review outcomes that were not part of the previous review (for example platelet transfusion interval, quality of life). We identified no new studies in this updated review.
Two review authors (LE, SS) conducted data extraction according to the guidelines proposed by The Cochrane Collaboration (Higgins 2011a). Any disagreements between the review authors were resolved by consensus. The review authors were not blinded to names of authors, institutions, journals, or the outcomes of the trials. The data extraction forms had been piloted in the previous version of this review (Estcourt 2012a). Due to minor changes in the format, we piloted the forms on a further study; thereafter the two review authors (LE, SS) independently extracted data for all the studies. We extracted the following data.
General information
Review author's name, date of data extraction, study ID, first author of study, author's contact address (if available), citation of paper, objectives of the trial.
Trial details
Trial design, location, setting, sample size, power calculation, treatment allocation, randomisation, blinding, inclusion and exclusion criteria, reasons for exclusion, comparability of groups, length of follow‐up, stratification, stopping rules described, statistical analysis, results, conclusion, and funding.
Characteristics of participants
Age, gender, ethnicity, total number recruited, total number randomised, total number analysed, types of haematological disease, lost to follow‐up numbers, dropouts (percentage in each arm) with reasons, protocol violations, previous treatments, current treatment, prognostic factors.
Interventions
Experimental and control interventions, type of platelet given, timing of intervention, dosage of platelet given, compliance to interventions, additional interventions given especially in relation to red cell transfusions, any differences between interventions.
Assessment of bias
Sequence generation, allocation concealment, blinding (participants, personnel, and outcome assessors), incomplete outcome data, selective outcome reporting, other sources of bias.
Outcomes measured
Number and severity of bleeding episodes. Mortality (all causes), and mortality due to bleeding. Overall survival. Proportion of participants achieving complete remission. Time in hospital. Number of platelet transfusions and platelet components. Number of red cell transfusions and red cell components. Platelet transfusion interval. Proportion of participants requiring additional interventions to stop bleeding (surgical, medical such as tranexamic acid, other blood products such as fresh frozen plasma (FFP), cryoprecipitate). Quality of life. Adverse effects of treatments (for example transfusion reactions, thromboembolism, transfusion‐transmitted infection, development of platelet antibodies or platelet refractoriness).
We used both full‐text versions and abstracts to retrieve the data. We extracted publications reporting on more than one trial using one data extraction form for each trial. We extracted trials reported in more than one publication on one form only. When these sources provided insufficient information, we contacted the authors and study groups for additional details.
One review author performed data entry into software, which a second review author checked for accuracy.
Assessment of risk of bias in included studies
We updated the 'Risk of bias' assessment to include study funding from the 'Risk of bias' assessment performed for the previous version of this review (Estcourt 2012a).
The assessment included information about the design, conduct, and analysis of the trial. We evaluated each criterion on a three‐point scale: low risk of bias, high risk of bias, or unclear (Higgins 2011c). To assess risk of bias, we addressed the following questions in the 'Risk of bias' table for each included study:
-
Was the allocation sequence adequately generated?
-
Was allocation adequately concealed?
-
Was knowledge of the allocated intervention adequately prevented during the study (including an assessment of blinding of participants, personnel, and outcome assessors)?
-
Were incomplete outcome data adequately addressed (for every outcome separately)?
-
Are reports of the study free of selective outcome reporting?
-
Was the study apparently free of other problems that could put it at risk of bias? This included assessing whether protocol deviation was balanced between treatment arms.
Measures of treatment effect
For dichotomous outcomes, we recorded the number of outcomes in the treatment and control groups and estimated the treatment effect measures across individual studies as the relative effect measures (risk ratio with 95% confidence intervals (CIs)).
For continuous outcomes, we recorded the mean and standard deviations. For continuous outcomes measured using the same scale, the effect measure was the mean difference with 95% CIs, or the standardised mean difference for outcomes measured using different scales. For time‐to‐event outcomes, we extracted the hazard ratio from published data according to Parmar 1998 and Tierney 2007.
We did not report the number needed to treat to benefit with CIs and the number needed to treat to harm with CIs because there were no differences between any of the bleeding outcomes.
If we could not report the available data in any of the formats described above, we performed a narrative report.
Unit of analysis issues
We did not prespecify in the protocol how we would deal with any unit of analysis issues. There was a unit of analysis issue for this review for the total number of days of bleeding. We only reported the number of days of bleeding if it had been reported per participant or if an appropriate analysis had been performed by the authors to account for repeated measures. In this review, the Rebulla 1997 authors used a permutation analysis to take into account the repeated events data (Freedman 1989). All other studies had not taken into account unit of analysis issues with this outcome and data were not reported.
Dealing with missing data
We dealt with missing data according to the recommendations in the Cochrane Handbook for Systematic Reviews of Interventions (Higgins 2011b). We contacted four authors to obtain information that was missing or unclear in the published report. Two authors supplied missing data (Heckman 1997; Rebulla 1997).
In trials that included people with haematological disorders as well as people with solid tumours or non‐malignant haematological disorders, we extracted data for the malignant haematology subgroup from the general trial data. We could not do this in one study (Zumberg 2002); we contacted the authors, but they no longer had access to the original data, and the original reports did not provide subgroup data. We therefore excluded this study from the review.
Within an outcome, the preferred analysis was an intention‐to‐treat analysis. When data were missing, we recorded the number of participants lost to follow‐up for each trial.
Assessment of heterogeneity
If we considered studies to be sufficiently homogenous in their study design, we conducted a meta‐analysis and assessed the statistical heterogeneity (Deeks 2011). We assessed statistical heterogeneity of treatment effects between trials using a Chi2 test with a significance level at P < 0.1. We used the I2 statistic to quantify heterogeneity (I2 > 50% moderate heterogeneity, I2 > 80% considerable heterogeneity). We explored potential causes of heterogeneity by sensitivity and subgroup analyses where possible.
Assessment of reporting biases
We did not perform a formal assessment of potential publication bias (small‐trial bias) because we included only three studies in this review (Sterne 2011).
Data synthesis
We performed analyses according to the recommendations of The Cochrane Collaboration (Deeks 2011). We used aggregated data for analysis. For statistical analysis, we entered data into Review Manager 5.3.
Where meta‐analysis was feasible, we used the fixed‐effect model for pooling the data. We used the Mantel‐Haenszel method for dichotomous outcomes, and the inverse‐variance method for continuous outcomes. We used the generic inverse‐variance method for time‐to‐event outcomes.
We used the random‐effects model for sensitivity analyses as part of the exploration of heterogeneity. If we found heterogeneity, as expressed by the I2, to be above 50%, we reported both the fixed‐effect and random‐effects models. If we found heterogeneity to be above 80%, we did not perform a meta‐analysis and commented on results as a narrative.
Summary of findings tables
We used GRADE 2014 to create 'Summary of findings' tables as suggested in the Cochrane Handbook for Systematic Reviews of Interventions (Schünemann 2011). This included the number and severity of bleeding episodes within 30 days from the start of the study (number of participants with at least one bleeding episode; number of days on which bleeding occurred; number of participants with severe or life‐threatening bleeding; time to first bleeding episode), number of platelet transfusions within 30 days from the start of the study, 30‐day mortality, and quality of life.
Subgroup analysis and investigation of heterogeneity
We considered performing subgroup analysis on the following characteristics, if appropriate:
-
Presence of fever (> 38°C).
-
Underlying disease.
-
Type of treatment (autologous haematopoietic stem cell transplantation (HSCT), allogeneic HSCT, or chemotherapy alone).
-
Age of the participant (paediatric, adults, older adults (> 60 years)).
We did not perform two subgroup analyses due to lack of data; these were presence of fever and type of treatment.
We did not perform meta‐regression because no subgroup contained more than 10 studies (Deeks 2011). We commented on differences between subgroups as a narrative.
Investigation of heterogeneity between studies also included, if appropriate:
-
Age of the study (as the type of platelet component has changed over the last 40 years).
-
Different platelet component doses.
We did not assess age of study as a reason for heterogeneity, as all studies recruited participants between 1991 and 2001.
Sensitivity analysis
We had intended to assess the robustness of our findings by the following two sensitivity analyses:
-
Including only those trials at low risk of bias.
-
Including only those trials in which 20% of participants or less were lost to follow‐up.
All trials were at risk of bias because none of the three included RCTs blinded investigators to the intervention.
None of the three included trials had more than 20% of participants lost to follow‐up.
We therefore did not perform these two pre‐planned sensitivity analyses.
Results
Description of studies
See Characteristics of included studies and Characteristics of excluded studies; there were no ongoing studies.
Results of the search
See PRISMA flow diagram (Figure 1).

Study flow diagram.
The original search (conducted January 2002) identified a total of 3196 potentially relevant records. There were 2380 records after duplicates were removed, and 2343 records were excluded on the basis of the abstract. The original systematic review identified 37 studies that appeared relevant on the basis of their full text or abstract using the original inclusion/exclusion criteria (Stanworth 2004).This was performed by one review author.
The updated search for the previous review (conducted November 2011) identified a total of 2622 potentially relevant records. There were 2054 records after duplicates were removed, and two review authors excluded 1865 records on the basis of the abstract. We retrieved 152 full‐text articles for relevance. Two review authors (LE, SS) reviewed these full‐text articles and those from the original review (a total of 189 records) (Estcourt 2012a).
The latest update of the search (conducted 23 July 2015) identified a total of 4923 potentially relevant records. There were 3925 records after duplicates were removed. Two review authors (LE, SS) were able to exclude 3896 records on the basis of the abstract. Two review authors (LE, SS) retrieved for relevance and reviewed 29 full‐text articles.
Included studies
See Characteristics of included studies for full details of each study.
Ongoing studies
This update of the review identified no ongoing studies that were eligible for inclusion.
Studies contributing to the main outcome
The three RCTs (9 publications) were published between 1997 and 2005. There were six secondary citations of included studies (cited as secondary references for the relevant included studies).
There were no new studies. The three included studies, Diedrich 2005, Heckman 1997, and Rebulla 1997, were identified in the previous version of this review (Estcourt 2012a). One study that had been included in the original review, Stanworth 2004, was excluded in the previous version of this review, Estcourt 2012a, because fewer than 80% of participants had a haematological disorder, and no subgroup data could be identified (Zumberg 2002).
The three included RCTs were distributed across the review's four subcategories as follows:
-
No studies compared a lower platelet count threshold (5 x 10⁹/L) versus a standard platelet transfusion threshold (10 x 109/L).
-
All three studies compared a standard platelet transfusion threshold (10 x 109/L) versus a higher platelet count threshold (20 x 109/L, 30 x 109/L, or 50 x 109/L).
-
No studies compared different platelet count thresholds (5 x 10⁹/L, 20 x 109/L, 30 x 109/L, or 50 x 109/L) that did not include a comparison against the standard platelet transfusion threshold (10 x 109/L).
-
No studies compared alternative thresholds to guide prophylactic platelet transfusions (e.g. platelet mass, immature platelet fraction, absolute immature platelet number).
This review therefore only discussed the subcategory that compared a standard platelet transfusion threshold (10 x 109/L) versus a higher platelet count threshold (20 x 109/L, 30 x 109/L, or 50 x 109/L).
See Table 1 for study characteristics including: number and type of participants; type of intervention (actual thresholds used); duration of study; dose of platelet component; type of platelet product; and primary outcome.
| Study | Type of participants | Number of participants | Intervention | Platelet component dose | Duration of study | Type of platelet component | Primary outcome |
| All ages undergoing | 166 | Prophylactic plt transfusion if plt count < 10 x 109/L | Average yield (mean ± SD) 4.10 x 10¹¹ ± 0.2 x 10¹¹ (buffy coat) 3.80 x 10¹¹ ± 0.2 x 10¹¹ (apheresis) | Maximum duration of observation was 37 days (7 days pre‐HSCT and 30 days post‐HSCT). No information available on the number of participants who died or were lost to follow‐up | Leucodepleted, ABO ‐matched, irradiated | Number of platelet transfusions | |
| Adults with acute leukaemia | 82 | Prophylactic plt transfusion if plt count ≤ 10 x 109/L versus prophylactic plt transfusion if plt count ≤ 20 x 109/L | 1 apheresis unit. Average yield each study year (number of transfusions) 4.9 x 10¹¹ 1991 (n = 502) 4.5 x10¹¹ 1992 (n = 418) 4.7 x 10¹¹ 1993 (n = 399) 4.0 x 10¹¹ 1994 (n = 400) 4.3 x 10¹¹ 1995 (n = 398) | Median 24 days | Leucodepleted Apheresis | Not reported | |
| Adolescents and adults with AML | 276 | Prophylactic plt transfusion if plt count < 10 x 109/L versus prophylactic plt transfusion if plt count < 20 x 109/L | Median 2.2 x 10¹¹ (pooled) 2.8 x 10¹¹ (apheresis) | Mean 27.8 to 29.7 days | Apheresis and pooled products | Frequency and severity of haemorrhage |
AML = acute myeloid leukaemia
HSCT = haematopoietic stem cell transplant
plt = platelet
SD = standard deviation
Study design
All three studies were open‐label studies. Two studies were single‐centre parallel RCTs (Diedrich 2005; Heckman 1997), and one study was a multicentre parallel RCT (Rebulla 1997).
Study size
The number of participants randomised ranged from 78 in Heckman 1997 to 276 in Rebulla 1997.
Setting
Two studies were conducted in the 1990s (Heckman 1997; Rebulla 1997), and one study was conducted in the early 2000s (Diedrich 2005). The studies were conducted in Italy (Rebulla 1997), Sweden (Diedrich 2005), and the United States (Heckman 1997).
Participants
In total, 520 participants were randomised; of these, 499 were included in the analysis. We excluded 21 participants randomised in Rebulla 1997 from the analysis (16 no study records received; two received non‐myeloablative chemotherapy; three died (two within 24 hours of enrolment in the study). Two of the studies examined adults with acute leukaemia; one included adults with acute lymphocytic leukaemia (ALL) or acute myeloid leukaemia (AML) (Heckman 1997), and the other included only adults with AML (Rebulla 1997). Both studies excluded adults with acute promyelocytic leukaemia (APL). The third study included both adults and children undergoing an allogeneic HSCT (Diedrich 2005).
Intervention
Two studies compared a prophylactic transfusion threshold of 10 x 109/L with a threshold of 20 x 109/L (Heckman 1997; Rebulla 1997). One study compared a threshold of 10 x 109/L with a threshold of 30 x 109/L (Diedrich 2005).
Co‐interventions
In two of the three studies a red cell transfusion policy was stated (Diedrich 2005; Rebulla 1997). Both studies transfused red cells when the haemoglobin was less than 80 g/L.
Outcomes
Two of the three studies defined a primary outcome (Diedrich 2005; Rebulla 1997). In Rebulla 1997, the primary outcome was the frequency and severity of bleeding, and the secondary outcome was the number of platelet transfusions, whereas in Diedrich 2005, the number of platelet transfusions was the primary outcome, with bleeding as one of the secondary outcomes. The third study, Heckman 1997, stated that its main aims were to look at platelet use and bleeding complications. All three studies commented on adverse events associated with platelet transfusions.
Funding sources
Two studies reported the funding sources for the trial (Diedrich 2005; Heckman 1997). All funding sources were either charitable foundations or government funds.
Excluded studies
See Characteristics of excluded studies for further details.
-
Twelve studies were excluded because they compared different participant groups (Andrew 1993; Arnold 2006; Bai 2004; Fanning 1995; Gajic 2006; Gerday 2009; Johansson 2007; Julmy 2009; NCT00699621; Reed 1986; Spiess 2004; Vadhan‐Raj 2002).
-
Seventy‐three studies compared different types of platelet formulations with outcome measures not relevant to the eligibility criteria (Agliastro 2006; Akkök 2007; Anderson 1997; Arnold 2004; Bentley 2000; Blumberg 2002; Blumberg 2004; Blundell 1996; Carr 1990; Corash 2001; Couban 2002; de Wildt‐Eggen 2000; Diedrich 2009; Di Pietro 1998; Dumont 2011; Gmür 1983; Goodnough 2001; Goodrich 2008; Grossman 1980; Gurkan 2007; Harrup 1999; Heal 1993; Heddle 1994; Heddle 1999; Heddle 2002; Heddle 2005; Heddle 2009; Higby 1974; ISRCTN01292427; ISRCTN49080246; ISRCTN56366401; Kakaiya 1981; Kerkhoffs 2010; Klumpp 1999; Kluter 1996; Lapierre 2003; Leach 1991; Lee 1989; Lozano 2010; Lozano 2011; Lu 2011; McCullough 2004; Messerschmidt 1988; Mirasol 2010; Murphy 1982; Murphy 1986; NCT01615146; Norville 1994; Norville 1997; Oksanen 1991; Oksanen 1994; Pamphilon 1996; Schiffer 1983; Shanwell 1992; Singer 1988; Sintnicolaas 1981; Sintnicolaas 1982; Sintnicolaas 1995; Slichter 1998; Slichter 2006; Slichter 2010; Solomon 1978; Stanworth 2013; Strindberg 1996; Sweeney 2000; Tinmouth 2004; TRAP 1997; Van Marwijk 1991; van Rhenen 2003; Wandt 2012; Wang 2002; Williamson 1994; Zhao 2002).
-
Three records were guidelines (Follea 2004; Samama 2005; Tosetto 2009).
-
One record was an audit (Qureshi 2007).
-
Thirty‐nine records were reviews (Andreu 2009; Avvisati 2003; Benjamin 2002; Blajchman 2008; Buhrkuhl 2010; Casbard 2004; Cid 2007; Dzik 2004; Goodnough 2002; Goodnough 2005; Heal 2004; Heddle 2003; Heddle 2007; Jelic 2006; Levi 2002; Lordkipanidze 2009; Lozano 2003; Martel 2004; McNicol 2003; Paramo 2004; Poon 2003; Rabinowitz 2010; Rayment 2005; Razzaghi 2012; Roberts 2003; Sakakura 2003; Shehata 2009; Shen 2007; Slichter 2004; Slichter 2007; Slichter 2012; Sosa 2003; Strauss 2004; Strauss 2005; Tinmouth 2003; Wandt 2010; Wang 2005; Woodard 2002; Zeller 2014).
-
Twenty‐six studies were not RCTs (Aderka 1986; Callow 2002; Cameron 2007; Chaoui 2005; Chaurasia 2012; Decaudin 2004; Eder 2007; Elting 2002; Elting 2003; Friedmann 2002; Gil‐Fernandez 1996; Gmür 1991; Greeno 2007; Hardan 1994; Lawrence 2001; Navarro 1998; Nevo 2007; Norol 1998; Paananen 2009; Sagmeister 1999; Verma 2008; Wandt 1998; Wandt 2005; Wandt 2006; Weigand 2009; Zahur 2002).
-
Fifty‐three records were secondary citations of excluded studies (cited as secondary references for the relevant excluded studies).
-
One study was a non‐human study (Velik‐Salchner 2007).
-
One study was a study in which fewer than 80% of the participants were haematological patients, and no data were available on the haematological subgroup (Zumberg 2002). Zumberg 2002 had been included in the previous review Stanworth 2004, but for this reason it has now been excluded.
Risk of bias in included studies
See Figure 2 and Figure 3 for visual representations of the 'Risk of bias' assessments across all studies and for each item in the included studies. See the Characteristics of included studies section 'Risk of bias' table for further information about the bias identified within the individual trials.

Risk of bias summary: review authors' judgements about each risk of bias item for each included study.

Risk of bias graph: review authors' judgements about each risk of bias item presented as percentages across all included studies.
All three studies had some threats to validity (Diedrich 2005; Heckman 1997; Rebulla 1997). The majority of these potential risks were due to a lack of detail provided on the specific criteria and were thus judged as 'unclear risk' using the Cochrane grading system.
Allocation
We assessed one study as low risk of selection bias due to adequate methods of sequence generation and allocation concealment (Rebulla 1997). We assessed the two remaining studies as unclear risk of selection bias due to the lack of information on sequence generation and allocation concealment (Diedrich 2005; Heckman 1997).
Blinding
We assessed all three studies as high risk of performance bias due to lack of blinding of medical staff (Diedrich 2005; Heckman 1997; Rebulla 1997).
We assessed one study as low risk of detection bias because there was adequate blinding of the bleeding assessor (Diedrich 2005). We assessed the other two studies as high risk of detection bias because the bleeding assessors and medical staff were unblinded (Heckman 1997; unpublished data of Rebulla 1997).
Incomplete outcome data
We assessed one study as low risk of attrition bias because the number of participants with missing outcome data were balanced across the intervention groups (Rebulla 1997). We assessed the two remaining studies as unclear risk of selection bias due to the lack of information on the number of participants lost to follow‐up (Diedrich 2005; Heckman 1997).
Selective reporting
We assessed all three studies as unclear risk of selection bias because as study protocols were not available, it was unclear whether any of the studies were free of selective reporting (Diedrich 2005; Heckman 1997; Rebulla 1997).
Other potential sources of bias
Protocol deviation
We assessed two of the three studies as at high risk of bias due to an imbalance in protocol deviations between the different arms of the studies (Heckman 1997; Rebulla 1997). The third study was insufficiently reported for us to make an adequate assessment (Diedrich 2005). In Heckman 1997, there was a statistically significant difference between the two arms. Fourteen out of 37 participants with a transfusion threshold of 10 x 109/L were affected by protocol deviations, whereas only 6 out of 41 participants with a transfusion threshold of 20 x 109/L were affected. In Rebulla 1997, the pre‐transfusion platelet count was higher than indicated in the protocol in 5.4% of platelet transfusions with a transfusion threshold of 10 x 109/L, but only 2% of platelet transfusions with a higher transfusion trigger were transfused outside the protocol guidelines; whether this was statistically significant was not reported.
Other potential sources
Two of the three studies appeared to be free of other sources of significant bias (Diedrich 2005; Rebulla 1997). The third study was insufficiently reported for us to make an adequate assessment (Heckman 1997).
Effects of interventions
See summary of findings Table for the main comparison.
In all the included studies, the study's own definition of clinically significant bleeding was used, unless otherwise stated (Table 2). The three studies used different grading systems for assessing bleeding.
| Study | Bleeding primary outcome of study | Method of bleeding assessment reported | Bleeding severity scale used | RBC usage part of bleeding severity assessment | RBC transfusion policy |
| Yes | Yes | New scale developed by Rebulla | Yes | Haemoglobin < 80 g/L | |
| Not reported | Yes | Yes | Not reported | ||
| No | Yes | No | Haemoglobin < 80 g/L |
RBC = red blood cell
Number and severity of bleeding episodes
All three studies reported bleeding outcomes. The median study duration was less than 30 days in two studies, Heckman 1997 and Rebulla 1997, and a maximum of 37 days of observation in the third study (Diedrich 2005) (Table 1). We therefore assumed data from all three studies was relevant to the bleeding outcomes.
Number of participants with at least one bleeding episode during the first 30 days of the study
Two of the three studies reported this (Diedrich 2005; Rebulla 1997), and the author supplied data from the third study (Heckman 1997). A meta‐analysis including 499 participants showed no difference between standard versus higher transfusion trigger levels (risk ratio (RR) 1.35, 95% confidence interval (CI) 0.95 to 1.90) (Analysis 1.1), nor was any difference seen if the studies comparing a threshold of 10 x 109/L versus 20 x 109/L were analysed separately (RR 1.41; 95% CI 0.95 to 2.1) (Heckman 1997; Rebulla 1997), to the study comparing a threshold of 10 x 109/L versus 30 x 109/L (RR 1.19, 95% CI 0.59 to 2.37) (Diedrich 2005).
The total number of days on which bleeding occurred during the first 30 days of the study
This outcome could have a unit of analysis problem due to participants having more than one day of bleeding. The authors of one study performed an analysis that took into account the unit of analysis issues for this outcome (Rebulla 1997). They found that the overall proportion of person‐days of observation during which participants experienced WHO Grade 2 bleeding or worse was 123 out of 4005 (3.1%) and 60 out of 3330 (1.8%) for the standard and higher transfusion trigger arms, respectively, giving a relative proportion of days with WHO Grade 2 or worse bleeding (RR 1.71, 95% CI 0.84 to 3.48). A permutation test for the comparison of these proportions gives a P value of 0.162, and therefore the study authors found no significant difference between study arms. The other two studies did not take into account this unit of analysis issue (Diedrich 2005; Heckman 1997).
Number of participants with at least one episode of severe or life‐threatening haemorrhage during the first 30 days of the study
Two of the studies reported the number of participants with WHO Grade 3 and 4 bleeding (Diedrich 2005; Rebulla 1997). A meta‐analysis of this data showed no difference between a standard versus a higher trigger level (421 participants; RR 0.99, 95% CI 0.52 to 1.88) (Analysis 1.2).
None of the studies reported the number of participants with WHO Grade 4 bleeding alone during the first 30 days of the study.
Only Diedrich 2005 reported the number of participants with bleeding that required a red cell transfusion. The study reported no significant difference between a standard versus a higher transfusion trigger level (RR 0.66, 95% CI 0.16 to 2.68) (Analysis 1.3).
None of the studies reported the number of participants with bleeding that caused cardiovascular compromise.
Time to first bleeding episode from the start of study
One study reported the time to the first bleeding episode (Rebulla 1997), showing no difference between the standard and higher transfusion trigger levels (hazard ratio 1.11, 95% CI 0.64 to 1.91) (Analysis 1.4).
Mortality
All‐cause mortality within 30 and 90 days
Two of the three studies reported all‐cause mortality (Heckman 1997; Rebulla 1997). However, only one study reported it within a 30‐ or 90‐day study period (Rebulla 1997) (Analysis 1.5), and showed no difference between a standard versus a higher transfusion trigger (RR 1.78, 95% CI 0.83 to 3.81) (Analysis 1.5).
Mortality secondary to bleeding within 30 and 90 days
All three studies reported death due to bleeding, but it was only in the largest study that any deaths occurred (Rebulla 1997). One death due to intracerebral haemorrhage in the standard trigger arm was included in the analysis (RR 2.67, 95% CI 0.11 to 64.91) (Analysis 1.6). However, two further deaths due to intracerebral haemorrhage (one in each arm of the study) occurred in participants who were randomised but not included in the analysis. If analysis of the data included all randomised participants, then there was still no evidence of a statistically significant difference in death rate between the two arms of the study (RR 1.85, 95% CI 0.17 to 20.59) (assuming that those participants for which no data forms were returned did not die secondary to bleeding) (Analysis 1.7).
Mortality secondary to infection within 30 and 90 days
One of the studies reported death due to infection (Rebulla 1997), showing no significant difference in mortality due to infection between a standard versus a higher transfusion trigger (RR 1.57, 95% CI 0.60 to 4.14) (Analysis 1.8).
Number of platelet transfusions per participant and number of platelet components per participant within 30 days from the start of the study
All three studies reported on the number of platelet transfusions required per participant (Table 3). Diedrich 2005 reported the results as medians and ranges. A meta‐analysis of the other two studies, Heckman 1997 (unpublished data) and Rebulla 1997, showed a reduction in the mean number of platelet transfusions required in the standard threshold arm (mean difference (MD) (fixed effect) ‐2.09, 95% CI ‐3.20 to ‐0.99) (Analysis 1.9).
| Study | Intervention | Number of participants in each arm | Number of platelet transfusions/participant | Comparison statistics | P value | Number of platelet units transfused/participant | Comparison statistics | P value |
| Short‐term follow‐up (up to 30 days) | ||||||||
| < 10 x 109/L | 79 | Median 4; range 0 to 32 | Not reported | < 0.001 | Not reported | Not reported | Not reported | |
| < 30 x 109/L | 87 | Median 10; range 0 to 48 | Not reported | Not reported | ||||
| ≤ 10 x 109/L | 37 | Mean 8.4 ± SD 5.3* | MD ‐3.00, 95% CI ‐5.76 to ‐0.24* | Not reported | Not reported | Not reported | Not reported | |
| ≤ 20 x 109/L | 41 | Mean 11.4 ± SD 7.1* | Not reported | Not reported | ||||
| < 10 x 109/L | 135 | Mean 7.05 ± SD 4.56 | MD ‐1.92, 95% CI ‐3.12 to ‐0.72 | 0.001 | Not reported | Not reported | Not reported | |
| < 20 x 109/L | 120 | Mean 8.97 ± SD 5.17 | Not reported | Not reported | ||||
*unpublished data provided by the author. The paper provided medians and ranges median 7 (5 to 11) for the standard‐trigger arm and median 11 (6 to 15) for the higher‐trigger arm.
CI = confidence interval
MD = mean difference
SD = standard deviation
None of the studies reported on the number of platelet components per participant.
Number of red cell transfusions per participant and number of red cell components per participant within 30 days from the start of the study
All three studies reported on the number of red cell transfusions required (Table 4). One of the studies reported the results as medians and ranges and showed no difference in the number of red cell transfusions required. A meta‐analysis of the other two studies, Heckman 1997 (unpublished data) and Rebulla 1997, showed no difference between the two arms in the mean number of red cell transfusions required (MD (fixed effect) 0.66, 95% CI ‐0.43 to 1.76) (Analysis 1.10).
| Study | Intervention | Number of participants in each arm | Number of red cell transfusions/participant | Comparison statistics | P value | Number of red cell units transfused/participant | Comparison statistics | P value |
| Short‐term follow‐up (up to 30 days) | ||||||||
| < 10 x 109/L | 79 | Median 4; range 0 to 26 | Not reported | Not significant | Not reported | Not reported | Not reported | |
| < 30 x 109/L | 87 | Median 4; range 0 to 31 | Not reported | Not reported | ||||
| ≤ 10 x 109/L | 37 | Mean 12.2 ± SD 6.9* | MD 1.50, 95% CI ‐1.22 to 4.22* | Not reported | Not reported | Not reported | Not reported | |
| ≤ 20 x 109/L | 41 | Mean 10.7 ± SD 5.1* | Not reported | Not reported | ||||
| < 10 x 109/L | 135 | Mean 9.57 ± SD 5.18 | MD 0.50, 95% CI ‐0.70 to 1.70* | Not reported | Not reported | Not reported | Not reported | |
| < 20 x 109/L | 120 | Mean 9.07 ± SD 4.58 | Not reported | Not reported | ||||
*unpublished data provided by the author. The paper provided medians and ranges median 11 (8 to 14) for the standard‐trigger arm and median 10 (6 to 14) for the higher‐trigger arm (P = 0.41).
CI = confidence interval
MD = mean difference
SD = standard deviation
Platelet transfusion interval within 30 days from the start of the study
None of the studies reported on the platelet transfusion interval.
Proportion of participants requiring additional interventions to stop bleeding (surgical, medical e.g. tranexamic acid, other blood products e.g. fresh frozen plasma (FFP), cryoprecipitate)
None of the studies reported on additional interventions to stop bleeding.
Overall survival within 30, 90, and 180 days from the start of the study
All three studies reported all‐cause survival. Only one of these studies reported overall survival within 30, 90 or 180 days, and reported actuarial survival up to 49 days after admission (Rebulla 1997). This was not significantly different between the two groups (P = 0.31).
Proportion of participants achieving complete remission within 30 days and 90 days from the start of the study
Two of the studies reported the number of participants who had achieved a complete remission (Heckman 1997; Rebulla 1997). A meta‐analysis of this data showed no evidence of a difference between the two arms (333 participants; RR 0.92, 95% CI 0.78 to 1.09) (Analysis 1.11).
Total time in hospital within 30 days from the start of the study
All of the studies reported the length of time that participants were in hospital. As these were all reported as medians with ranges or interquartile ranges (Table 5), we could not perform a meta‐analysis. Two of the studies reported no statistically significant difference in hospital stay between the arms of the study (Diedrich 2005; Heckman 1997), whereas the third study did not report any P values (Rebulla 1997).
| Study | Intervention (transfusion threshold) | Number of participants in each arm | Number of days in hospital (median) | P value |
| < 10 x 109/L | 79 | 23 Range 9 to 89 | Not significant | |
| < 30 x 109/L | 87 | 23 Range 14 to 140 | ||
| ≤ 10 x 109/L | 37 | 38 IQR 30 to 42 | 0.25* | |
| ≤ 20 x 109/L | 41 | 32 IQR 27 to 45 | ||
| < 10 x 109/L | 135 | 29 Range 3 to 64 | Not reported | |
| < 20 x 109/L | 120 | 28 Range 4 to 54 |
*unpublished data provided by the author.
IQR = interquartile range
Adverse effects of treatments within 30 days from the start of the study
All of the studies reported at least one adverse event of platelet transfusions.
Transfusion reactions
Only Heckman 1997 reported on transfusion reactions secondary to platelet transfusions, and there was insufficient evidence to determine if there was a difference in the number of transfusion reactions between the two arms of the study (RR 0.07, 95% CI 0.00 to 1.09) (Analysis 1.12).
Thromboembolic disease
Only Rebulla 1997 reported deaths due to thromboembolic disease. There was one death in each arm of the study (Analysis 1.13).
Transfusion‐transmitted infection
None of the studies reported on transfusion‐transmitted infection.
Development of platelet antibodies
Only Diedrich 2005 reported on the development of human leukocyte antigen (HLA) antibodies. There was no difference shown between the two arms of the study (RR 1.10, 95% CI 0.07 to 17.31) (Analysis 1.14).
Development of platelet refractoriness
Two of the studies reported on the development of platelet refractoriness (Diedrich 2005; Heckman 1997). A meta‐analysis involving 244 participants showed no difference between the different transfusion trigger levels (RR 0.66, 95% CI 0.16 to 2.67) (Analysis 1.15).
Quality of life (as defined by the individual studies)
None of the studies reported quality of life.
Prespecified subgroup analyses
Presence of fever
Two of the studies commented on an association between fever and bleeding risk (Heckman 1997; Rebulla 1997). However, neither of these studies reported bleeding per treatment arm for participants with or without fever.
Underlying disease
One study commented on status of underlying disease and bleeding risk (Heckman 1997).
The number of participants with at least one clinically significant bleeding episode
In Heckman 1997, the authors performed a multivariate analysis that included age (< 60 years versus ≥ 60 years), disease status (newly diagnosed versus relapsed leukaemia), and arm of the study, and there was no significant difference in the proportion of participants who bled between the standard and higher transfusion trigger levels.
Type of treatment
None of the studies reported this because in each study only one type of treatment was given (chemotherapy or allogenic stem cell transplant).
Age of participant
One study commented on age of participant and bleeding risk (Heckman 1997).
The number of participants with at least one clinically significant bleeding episode
In Heckman 1997, the authors performed a multivariate analysis that included age (< 60 years versus ≥ 60 years), disease status (newly diagnosed versus relapsed leukaemia), and arm of the study, and there was no significant difference in the proportion of participants who bled between the standard and higher transfusion trigger levels.
Platelet component dose
Two of the three included studies used a platelet component dose similar to the intermediate dose used by Slichter 2010 (2.2 x 10¹¹/m2 ± 25%) (Diedrich 2005; Heckman 1997), and one study used a dose between the intermediate and low dose used by Slichter 2010 (1.1 x 10¹¹/m2 ± 25%) (Rebulla 1997). Assuming a body surface area of 1.79 m2 (Sacco 2010), an intermediate platelet component dose equates to 3.9 x 10¹¹ ± 1.0 x 10¹¹, and a low platelet component dose equates to 2.0 x 10¹¹ ± 0.5 x 10¹¹. Only one analysis that included more than one study was affected by removing the data from (Rebulla 1997); this was the number of participants with a significant bleeding event. If only the two higher‐dose studies were included in the analysis, there was a difference between the standard and higher transfusion triggers (RR 1.71, 95% CI 1.04 to 2.82) (Analysis 1.16). However, there was no evidence of a difference between the two platelet component dose subgroups in this analysis (test for subgroup differences: Chi2 = 1.73, df = 1 (P = 0.19), I2 = 42.1%), and therefore only the overall result that showed no evidence of a difference should be considered.
Discussion
Summary of main results
This Cochrane systematic review intended to answer the question, which threshold should be used to trigger the transfusion of prophylactic platelets in participants with haematological disorders undergoing myelosuppressive chemotherapy or stem cell transplantation ? Only one of the four planned comparisons could be performed. No studies compared:
-
a lower platelet count threshold (5 x 10⁹/L) versus a standard platelet transfusion threshold (10 x 109/L);
-
different platelet count thresholds (5 x 10⁹/L, 20 x 109/L, 30 x 109/L, or 50 x 109/L) that did not include a comparison against the standard platelet transfusion threshold (10 x 109/L);
-
alternative thresholds to guide prophylactic platelet transfusions (e.g. platelet mass, immature platelet fraction, absolute immature platelet number).
Three RCTs met our inclusion criteria for this review, all of which had data available and compared a standard platelet transfusion threshold (10 x 109/L) versus a higher platelet count threshold (20 x 109/L, 30 x 109/L, or 50 x 109/L).
These trials were carried out from 1991 to 2001 and enrolled 520 participants from fairly comparable patient populations.
The findings of the review led to the following main conclusions:
Overall, a standard transfusion trigger of 10 x 109/L appears to be as effective as a higher transfusion trigger of 20 x 109/L or 30 x 109/L at preventing clinically significant bleeding. This included no evidence of a difference in the:
-
number of participants with a clinically significant bleeding event (WHO Grade 2 or above);
-
number of days with clinically significant bleeding (adjusted for repeated events);
-
number of participants with severe or life‐threatening bleeding;
-
time to first clinically significant bleeding episode.
This effect was seen irrespective of the participant's age or underlying disease stage. However, all of this evidence was of low quality, due to risk of bias within the included studies and imprecision of the estimate due to the small total numbers of participants, events, or both.
-
There was a reduction observed in the number of platelet transfusions required using a threshold of 10 x 109/L.
-
There was no evidence of a difference in all‐cause mortality.
-
None of the studies reported quality of life.
There were no differences between the groups with regards to mortality due to bleeding or infection, red cell transfusion requirements, survival, remission rates, hospital stay, or adverse events.
Overall completeness and applicability of evidence
This review provides the most up‐to‐date assessment of the effectiveness and safety of a a standard platelet transfusion threshold (10 x 109/L) versus a higher platelet count threshold (20 x 109/L, 30 x 109/L, or 50 x 109/L) to guide administration of prophylactic platelet transfusions.
The effectiveness and safety of the three other planned comparisons could not be evaluated because no study assessed these comparisons. These planned comparisons were:
-
a lower platelet count threshold (5 x 10⁹/L) versus standard platelet transfusion threshold (10 x 109/L);
-
different platelet count thresholds (5 x 10⁹/L, 20 x 109/L, 30 x 109/L, or 50 x 109/L) that did not include a comparison against the standard platelet transfusion threshold (10 x 109/L);
-
alternative thresholds to guide prophylactic platelet transfusions (e.g. platelet mass, immature platelet fraction, absolute immature platelet number).
(See How the intervention might work for further information on why these planned comparisons were clinically relevant.)
This updated review identified no new studies and no ongoing studies. It is unclear why no future studies are planned; it may be because of the large number of participants required within a study to demonstrate a statistically significant difference (Zisk 2014).
There was no evidence that people with haematological disorders receiving myelosuppressive chemotherapy or HSCT had an increase in clinically significant bleeding events with a standard platelet count threshold compared to a higher platelet count threshold.
The results of this meta‐analysis should not be interpreted without considering the impact of the following factors:
-
The recording of bleeding is subjective, and all three included studies used different grading systems to measure the severity of bleeding (Table 2).
-
No difference was demonstrated in the number of participants with clinically significant bleeding, but the 95% confidence interval (0.95 to 1.9) demonstrates that a clinically important difference in the proportion of participants with bleeding could have been missed. When combined, the studies were not adequately powered to detect a difference. In Rebulla 1997, which included 255 participants, the power calculations were based on the assumption that the rate of WHO Grade 2 or above bleeding was 30%, but the actual rate in this study was 20%. If we assume the rate of bleeding was similar in all three studies, to detect a 50% increase in the rate of bleeding (i.e. from 20% to 30%) with 80% power would require 293 participants per arm of the study (586 in total), and to detect a 25% increase in the rate of bleeding (i.e. from 20% to 25%) with 80% power would require 1098 participants per arm of the study (2196 in total). As there were only 499 participants within all three studies, the meta‐analysis would not be sufficiently powered to detect a 50% increase in the rate of bleeding in the restrictive transfusion arm.
-
There were important differences between the studies that might affect the degree of confidence that can be placed on the assertion of equivalence between higher (20 or 30 x 109/L) and standard (10 x 109/L) platelet count thresholds for prophylactic platelet transfusions. The treatment protocols for administration of platelets varied, particularly the circumstances for which platelet transfusions could be given. In Rebulla 1997, platelets could be given to participants in the 10 x 109/L threshold arm if the platelet count was in the range of 10 to 20 x 109/L and the participant's temperature was above 38°C. This meant that 22.6% of platelet transfusions were given above the threshold of 10 x 109/L. In Diedrich 2005 and Heckman 1997, there were no changes in the transfusion threshold in the presence of fever.
-
Not all endpoints from all the studies could be incorporated into a meta‐analysis due to differences in the ways the studies had reported the outcomes.
-
Some of the planned outcomes were not reported by any of the studies.
-
In all studies, the number of participants that were lost to follow‐up was quite low, and therefore there were minimal implications of missing data outcomes.
Quality of the evidence
All studies were RCTs, however they were all prone to bias and had threats to validity. The ability to assess the risk of bias was limited by most of the studies not reporting study methodology in adequate detail. For example, only one of the three studies reported allocation concealment as adequate (Rebulla 1997), and in all three studies blinding of participants was unknown.
None of the studies blinded medical staff caring for the participants to their patient's study allocation, and two of the three studies did not blind outcome assessors to the participants' study allocations (Heckman 1997; Rebulla 1997). This is likely to reflect the inherent difficulties with blinding platelet transfusion trials because medical staff caring for participants cannot be blinded to their patients' blood results.
We assessed the GRADE quality of evidence as low for:
-
number of participants with at least one clinically significant bleeding event up to 30 days from study entry;
-
number of participants with WHO Grade 3 or 4 bleeding up to 30 days from study entry;
-
time to first clinically significant bleeding event;
-
mortality from all causes up to 30 days from study entry;
-
number of platelet transfusions per participant.
The quality of the evidence was low due to risk of bias within the included studies and imprecision of the estimate due to the small total numbers of participants, events, or both.
We did not perform a GRADE assessment of quality of the evidence for quality of life because no study reported this outcome, or for number of days with bleeding, as we relied on the study authors' own analysis.
Potential biases in the review process
There were no obvious biases within the review process. We conducted a wide search, which included ongoing trial databases and contact with researchers in the field; we carefully assessed the relevance of each paper identified; and we made no restrictions for the language in which the paper was originally published or its publication status. We performed all screening and data extractions in duplicate. We prespecified all outcomes and subgroups prior to analysis. The numbers of included studies were insufficient for us to combine to complete a funnel plot in order to examine the risk of publication bias.
Agreements and disagreements with other studies or reviews
One platelet transfusion review was recently published in this area (Kumar 2014). Kumar 2014 performed a systematic review of the use of platelet transfusions in common clinical settings, including the comparison of prophylactic versus therapeutic platelet transfusions. Their review identified the same three studies included in this review (Diedrich 2005; Heckman 1997; Rebulla 1997), as well as including the data from Zumberg 2002. We excluded the data from Zumberg 2002 from this review because fewer than 80% of participants had a haematological malignancy, and no subgroup data were available. The Zumberg 2002 study was at high risk of bias due to the significant number of platelet transfusions (31.9%) given above the level of 10 x 109/L.
The Kumar 2014 review only included the outcome measures of all‐cause mortality, mortality due to bleeding, bleeding ("major" or "significant" bleeding as defined in each study), and number of platelet transfusions. They found no difference in significant bleeding between a standard and higher threshold and a significant decrease in the number of platelet transfusions. This was similar to the finding of our review.
The Kumar 2014 review did not perform a detailed assessment of the risk of bias of the included studies, nor did it consider reasons for heterogeneity between the included studies. Our review is more comprehensive and includes data on different bleeding outcome measures, adverse effects of transfusion, and unpublished study data provided by the authors. We have performed a detailed quality assessment of all identified studies and highlighted their weaknesses and shortcomings.
Risk of bias summary: review authors' judgements about each risk of bias item for each included study.
Risk of bias graph: review authors' judgements about each risk of bias item presented as percentages across all included studies.

Comparison 1 Prophylactic platelet transfusion at a standard trigger level versus a higher trigger level, Outcome 1 Numbers of participants with a significant bleeding event.

Comparison 1 Prophylactic platelet transfusion at a standard trigger level versus a higher trigger level, Outcome 2 Number of participants with WHO Grade 3 or 4 bleeding.

Comparison 1 Prophylactic platelet transfusion at a standard trigger level versus a higher trigger level, Outcome 3 Number of participants with bleeding requiring a red cell transfusion.

Comparison 1 Prophylactic platelet transfusion at a standard trigger level versus a higher trigger level, Outcome 4 Time to first bleeding episode.

Comparison 1 Prophylactic platelet transfusion at a standard trigger level versus a higher trigger level, Outcome 5 All‐cause mortality.

Comparison 1 Prophylactic platelet transfusion at a standard trigger level versus a higher trigger level, Outcome 6 Mortality due to bleeding.

Comparison 1 Prophylactic platelet transfusion at a standard trigger level versus a higher trigger level, Outcome 7 Mortality due to bleeding (all randomised participants).

Comparison 1 Prophylactic platelet transfusion at a standard trigger level versus a higher trigger level, Outcome 8 Mortality due to infection.

Comparison 1 Prophylactic platelet transfusion at a standard trigger level versus a higher trigger level, Outcome 9 Mean number of platelet transfusions per participant.
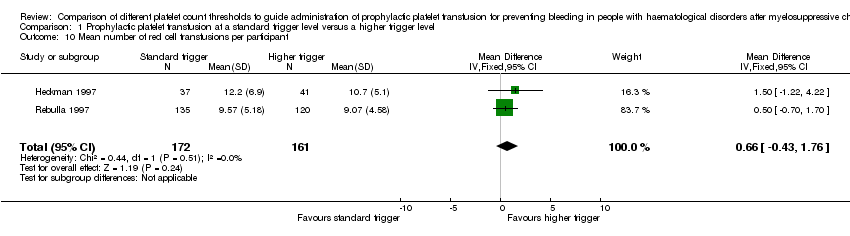
Comparison 1 Prophylactic platelet transfusion at a standard trigger level versus a higher trigger level, Outcome 10 Mean number of red cell transfusions per participant.

Comparison 1 Prophylactic platelet transfusion at a standard trigger level versus a higher trigger level, Outcome 11 Complete remission rates.

Comparison 1 Prophylactic platelet transfusion at a standard trigger level versus a higher trigger level, Outcome 12 Numbers of participants with platelet transfusion reactions.

Comparison 1 Prophylactic platelet transfusion at a standard trigger level versus a higher trigger level, Outcome 13 Number of participants with thromboembolic disease.

Comparison 1 Prophylactic platelet transfusion at a standard trigger level versus a higher trigger level, Outcome 14 Number of participants requiring HLA‐matched platelets.

Comparison 1 Prophylactic platelet transfusion at a standard trigger level versus a higher trigger level, Outcome 15 Number of participants with platelet refractoriness.

Comparison 1 Prophylactic platelet transfusion at a standard trigger level versus a higher trigger level, Outcome 16 Numbers of participants with a significant bleeding event.
| Prophylactic platelet transfusion at threshold of 10,000 compared to higher transfusion threshold (20,000 or 30,000) for prevention of haemorrhage after chemotherapy and stem cell transplantation | ||||||
| Patient or population: People with a haematological disorder | ||||||
| Outcomes | Illustrative comparative risks* (95% CI) | Relative effect | No of Participants | Quality of the evidence | Comments | |
| Assumed risk | Corresponding risk | |||||
| Higher transfusion threshold (20 x 109/L or 30 x 109/L) | Prophylactic platelet transfusion at threshold of 10 x 109/L | |||||
| Numbers of participants with at least 1 clinically significant bleeding event up to 30 days from study entry | 177 per 1000 | 239 per 1000 | RR 1.35 | 499 | ⊕⊕⊝⊝ | The definition of clinically significant bleeding varied between studies, because there were differences in the way bleeding was graded |
| Number of days on which clinically significant bleeding occurred per participant up to 30 days from study entry | Not estimable3 | Not estimable3 | Not estimable3 | 255 (1 study) | ⊕⊕⊝⊝ | ‐ |
| Number of participants with WHO Grade 3 or 4 bleeding up to 30 days from study entry | 82 per 1000 | 81 per 1000 (43 to 154) | RR 0.99 (0.52 to 1.88) | 421 (2 studies) | ⊕⊕⊝⊝ | ‐ |
| Time to first bleeding episode (days) | ‐ | ‐ | HR 1.11 (0.64 to 1.91) | 255 (1 study) | ⊕⊕⊝⊝ | ‐ |
| Number of platelet transfusions per participant up to 30 days from study entry | The mean number of platelet transfusions per participant in the 10 x 109/L group was | ‐ | 333 | ⊕⊕⊝⊝ | ‐ | |
| Mortality from all causes up to 30 days from study entry | 75 per 1000 | 134 per 1000 (62 to 286) | RR 1.78 (0.83 to 3.81) | 255 (1 study) | ⊕⊕⊝⊝ | ‐ |
| Quality of life ‐ not reported | Not estimable | Not estimable | Not estimable | ‐ | See comment | None of the studies reported quality of life |
| *The basis for the assumed risk (e.g. the median control group risk across studies) is provided in footnotes. The corresponding risk (and its 95% confidence interval) is based on the assumed risk in the comparison group and the relative effect of the intervention (and its 95% CI). | ||||||
| GRADE Working Group grades of evidence | ||||||
| 1The number of participants from all three studies may not be large enough to detect a clinically significant difference. The confidence intervals are wide, and therefore there is uncertainty about the result. The level of evidence was downgraded by 1 due to imprecision. 2All of the studies were at high risk of bias due to lack of blinding and more protocol deviations in the standard‐trigger arm (10 x 109/L). The Rebulla study did not perform an intention‐to‐treat analysis and excluded 2 participants who died within 24 hours of entering the study. The level of evidence was downgraded by 1 due to risk of bias. 3The authors of Rebulla 1997 reported a relative proportion of days with WHO Grade 2 or worse bleeding of 1.71 (95% CI 0.84 to 3.48) for the standard versus higher transfusion trigger arms. A permutation test for the comparison of these proportions gives a P value of 0.162, and therefore no significant difference between study arms was found. These results are the authors' own results. | ||||||
| Study | Type of participants | Number of participants | Intervention | Platelet component dose | Duration of study | Type of platelet component | Primary outcome |
| All ages undergoing | 166 | Prophylactic plt transfusion if plt count < 10 x 109/L | Average yield (mean ± SD) 4.10 x 10¹¹ ± 0.2 x 10¹¹ (buffy coat) 3.80 x 10¹¹ ± 0.2 x 10¹¹ (apheresis) | Maximum duration of observation was 37 days (7 days pre‐HSCT and 30 days post‐HSCT). No information available on the number of participants who died or were lost to follow‐up | Leucodepleted, ABO ‐matched, irradiated | Number of platelet transfusions | |
| Adults with acute leukaemia | 82 | Prophylactic plt transfusion if plt count ≤ 10 x 109/L versus prophylactic plt transfusion if plt count ≤ 20 x 109/L | 1 apheresis unit. Average yield each study year (number of transfusions) 4.9 x 10¹¹ 1991 (n = 502) 4.5 x10¹¹ 1992 (n = 418) 4.7 x 10¹¹ 1993 (n = 399) 4.0 x 10¹¹ 1994 (n = 400) 4.3 x 10¹¹ 1995 (n = 398) | Median 24 days | Leucodepleted Apheresis | Not reported | |
| Adolescents and adults with AML | 276 | Prophylactic plt transfusion if plt count < 10 x 109/L versus prophylactic plt transfusion if plt count < 20 x 109/L | Median 2.2 x 10¹¹ (pooled) 2.8 x 10¹¹ (apheresis) | Mean 27.8 to 29.7 days | Apheresis and pooled products | Frequency and severity of haemorrhage | |
| AML = acute myeloid leukaemia HSCT = haematopoietic stem cell transplant plt = platelet SD = standard deviation | |||||||
| Study | Bleeding primary outcome of study | Method of bleeding assessment reported | Bleeding severity scale used | RBC usage part of bleeding severity assessment | RBC transfusion policy |
| Yes | Yes | New scale developed by Rebulla | Yes | Haemoglobin < 80 g/L | |
| Not reported | Yes | Yes | Not reported | ||
| No | Yes | No | Haemoglobin < 80 g/L | ||
| RBC = red blood cell | |||||
| Study | Intervention | Number of participants in each arm | Number of platelet transfusions/participant | Comparison statistics | P value | Number of platelet units transfused/participant | Comparison statistics | P value |
| Short‐term follow‐up (up to 30 days) | ||||||||
| < 10 x 109/L | 79 | Median 4; range 0 to 32 | Not reported | < 0.001 | Not reported | Not reported | Not reported | |
| < 30 x 109/L | 87 | Median 10; range 0 to 48 | Not reported | Not reported | ||||
| ≤ 10 x 109/L | 37 | Mean 8.4 ± SD 5.3* | MD ‐3.00, 95% CI ‐5.76 to ‐0.24* | Not reported | Not reported | Not reported | Not reported | |
| ≤ 20 x 109/L | 41 | Mean 11.4 ± SD 7.1* | Not reported | Not reported | ||||
| < 10 x 109/L | 135 | Mean 7.05 ± SD 4.56 | MD ‐1.92, 95% CI ‐3.12 to ‐0.72 | 0.001 | Not reported | Not reported | Not reported | |
| < 20 x 109/L | 120 | Mean 8.97 ± SD 5.17 | Not reported | Not reported | ||||
| *unpublished data provided by the author. The paper provided medians and ranges median 7 (5 to 11) for the standard‐trigger arm and median 11 (6 to 15) for the higher‐trigger arm. CI = confidence interval MD = mean difference SD = standard deviation | ||||||||
| Study | Intervention | Number of participants in each arm | Number of red cell transfusions/participant | Comparison statistics | P value | Number of red cell units transfused/participant | Comparison statistics | P value |
| Short‐term follow‐up (up to 30 days) | ||||||||
| < 10 x 109/L | 79 | Median 4; range 0 to 26 | Not reported | Not significant | Not reported | Not reported | Not reported | |
| < 30 x 109/L | 87 | Median 4; range 0 to 31 | Not reported | Not reported | ||||
| ≤ 10 x 109/L | 37 | Mean 12.2 ± SD 6.9* | MD 1.50, 95% CI ‐1.22 to 4.22* | Not reported | Not reported | Not reported | Not reported | |
| ≤ 20 x 109/L | 41 | Mean 10.7 ± SD 5.1* | Not reported | Not reported | ||||
| < 10 x 109/L | 135 | Mean 9.57 ± SD 5.18 | MD 0.50, 95% CI ‐0.70 to 1.70* | Not reported | Not reported | Not reported | Not reported | |
| < 20 x 109/L | 120 | Mean 9.07 ± SD 4.58 | Not reported | Not reported | ||||
| *unpublished data provided by the author. The paper provided medians and ranges median 11 (8 to 14) for the standard‐trigger arm and median 10 (6 to 14) for the higher‐trigger arm (P = 0.41). CI = confidence interval MD = mean difference SD = standard deviation | ||||||||
| Study | Intervention (transfusion threshold) | Number of participants in each arm | Number of days in hospital (median) | P value |
| < 10 x 109/L | 79 | 23 Range 9 to 89 | Not significant | |
| < 30 x 109/L | 87 | 23 Range 14 to 140 | ||
| ≤ 10 x 109/L | 37 | 38 IQR 30 to 42 | 0.25* | |
| ≤ 20 x 109/L | 41 | 32 IQR 27 to 45 | ||
| < 10 x 109/L | 135 | 29 Range 3 to 64 | Not reported | |
| < 20 x 109/L | 120 | 28 Range 4 to 54 | ||
| *unpublished data provided by the author. IQR = interquartile range | ||||
| Outcome or subgroup title | No. of studies | No. of participants | Statistical method | Effect size |
| 1 Numbers of participants with a significant bleeding event Show forest plot | 3 | 499 | Risk Ratio (M‐H, Fixed, 95% CI) | 1.35 [0.95, 1.90] |
| 1.1 Platelet threshold < 10 vs. < 20 | 2 | 333 | Risk Ratio (M‐H, Fixed, 95% CI) | 1.41 [0.95, 2.10] |
| 1.2 Platelet threshold < 10 vs. < 30 | 1 | 166 | Risk Ratio (M‐H, Fixed, 95% CI) | 1.19 [0.59, 2.37] |
| 2 Number of participants with WHO Grade 3 or 4 bleeding Show forest plot | 2 | 421 | Risk Ratio (M‐H, Fixed, 95% CI) | 0.99 [0.52, 1.88] |
| 2.1 Platelet threshold < 10 vs. < 20 | 1 | 255 | Risk Ratio (M‐H, Fixed, 95% CI) | 1.21 [0.58, 2.54] |
| 2.2 Platelet threshold < 10 vs. < 30 | 1 | 166 | Risk Ratio (M‐H, Fixed, 95% CI) | 0.55 [0.14, 2.13] |
| 3 Number of participants with bleeding requiring a red cell transfusion Show forest plot | 1 | Risk Ratio (M‐H, Fixed, 95% CI) | Subtotals only | |
| 4 Time to first bleeding episode Show forest plot | 1 | Hazard Ratio (Fixed, 95% CI) | Subtotals only | |
| 5 All‐cause mortality Show forest plot | 1 | Risk Ratio (M‐H, Fixed, 95% CI) | Subtotals only | |
| 6 Mortality due to bleeding Show forest plot | 3 | Risk Ratio (M‐H, Fixed, 95% CI) | Totals not selected | |
| 7 Mortality due to bleeding (all randomised participants) Show forest plot | 3 | Odds Ratio (M‐H, Fixed, 95% CI) | Totals not selected | |
| 8 Mortality due to infection Show forest plot | 1 | Odds Ratio (M‐H, Fixed, 95% CI) | Subtotals only | |
| 9 Mean number of platelet transfusions per participant Show forest plot | 2 | 333 | Mean Difference (IV, Fixed, 95% CI) | ‐2.09 [‐3.20, ‐0.99] |
| 10 Mean number of red cell transfusions per participant Show forest plot | 2 | 333 | Mean Difference (IV, Fixed, 95% CI) | 0.66 [‐0.43, 1.76] |
| 11 Complete remission rates Show forest plot | 2 | 333 | Risk Ratio (M‐H, Fixed, 95% CI) | 0.92 [0.78, 1.09] |
| 12 Numbers of participants with platelet transfusion reactions Show forest plot | 1 | Risk Ratio (M‐H, Fixed, 95% CI) | Subtotals only | |
| 13 Number of participants with thromboembolic disease Show forest plot | 1 | Risk Ratio (M‐H, Fixed, 95% CI) | Subtotals only | |
| 14 Number of participants requiring HLA‐matched platelets Show forest plot | 1 | Risk Ratio (M‐H, Fixed, 95% CI) | Subtotals only | |
| 15 Number of participants with platelet refractoriness Show forest plot | 2 | 244 | Risk Ratio (M‐H, Fixed, 95% CI) | 0.66 [0.16, 2.67] |
| 16 Numbers of participants with a significant bleeding event Show forest plot | 3 | 499 | Risk Ratio (M‐H, Fixed, 95% CI) | 1.35 [0.95, 1.90] |
| 16.1 Platelet component dose (2.9 x 10¹¹ to 4.9 x 10¹¹) | 2 | 244 | Risk Ratio (M‐H, Fixed, 95% CI) | 1.71 [1.04, 2.82] |
| 16.2 Platelet component dose (< 2.9 x 10¹¹) | 1 | 255 | Risk Ratio (M‐H, Fixed, 95% CI) | 1.07 [0.66, 1.74] |