Scolaris Content Display Scolaris Content Display

Study flow diagram.
Figures and Tables -
Figure 1

Study flow diagram.

Risk of bias summary: review authors' judgements about each risk of bias item for each included study.
Figures and Tables -
Figure 2

Risk of bias summary: review authors' judgements about each risk of bias item for each included study.

Risk of bias graph: review authors' judgements about each risk of bias item presented as percentages across all included studies.
Figures and Tables -
Figure 3

Risk of bias graph: review authors' judgements about each risk of bias item presented as percentages across all included studies.

Comparison 1 Hyaluronic acid versus Placebo, Outcome 1 AOS total (combined pain and function score) at 6months.
Figures and Tables -
Analysis 1.1

Comparison 1 Hyaluronic acid versus Placebo, Outcome 1 AOS total (combined pain and function score) at 6months.

Comparison 1 Hyaluronic acid versus Placebo, Outcome 2 AOS total (combined pain and function score) at 3months.
Figures and Tables -
Analysis 1.2

Comparison 1 Hyaluronic acid versus Placebo, Outcome 2 AOS total (combined pain and function score) at 3months.

Comparison 1 Hyaluronic acid versus Placebo, Outcome 3 Pain (AOS pain) at 3months.
Figures and Tables -
Analysis 1.3

Comparison 1 Hyaluronic acid versus Placebo, Outcome 3 Pain (AOS pain) at 3months.

Comparison 1 Hyaluronic acid versus Placebo, Outcome 4 Physical Function ( AOS disability) at 3months.
Figures and Tables -
Analysis 1.4

Comparison 1 Hyaluronic acid versus Placebo, Outcome 4 Physical Function ( AOS disability) at 3months.

Comparison 1 Hyaluronic acid versus Placebo, Outcome 5 Serious adverse events.
Figures and Tables -
Analysis 1.5

Comparison 1 Hyaluronic acid versus Placebo, Outcome 5 Serious adverse events.

Comparison 1 Hyaluronic acid versus Placebo, Outcome 6 Any adverse events.
Figures and Tables -
Analysis 1.6

Comparison 1 Hyaluronic acid versus Placebo, Outcome 6 Any adverse events.

Comparison 1 Hyaluronic acid versus Placebo, Outcome 7 Patients who withdraw because of an adverse event.
Figures and Tables -
Analysis 1.7

Comparison 1 Hyaluronic acid versus Placebo, Outcome 7 Patients who withdraw because of an adverse event.

Comparison 2 Hyaluronic acid versus Exercise therapy, Outcome 1 Pain during activity‐VAS.
Figures and Tables -
Analysis 2.1

Comparison 2 Hyaluronic acid versus Exercise therapy, Outcome 1 Pain during activity‐VAS.

Comparison 2 Hyaluronic acid versus Exercise therapy, Outcome 2 Physical Function_total AOFAS.
Figures and Tables -
Analysis 2.2

Comparison 2 Hyaluronic acid versus Exercise therapy, Outcome 2 Physical Function_total AOFAS.

Comparison 2 Hyaluronic acid versus Exercise therapy, Outcome 3 Walking distance (AOFAS).
Figures and Tables -
Analysis 2.3

Comparison 2 Hyaluronic acid versus Exercise therapy, Outcome 3 Walking distance (AOFAS).

Comparison 3 Hyaluronic acid versus botulinum toxin A, Outcome 1 Pain_AOS‐pain.
Figures and Tables -
Analysis 3.1

Comparison 3 Hyaluronic acid versus botulinum toxin A, Outcome 1 Pain_AOS‐pain.

Comparison 3 Hyaluronic acid versus botulinum toxin A, Outcome 2 Physical Function_AOS‐disability.
Figures and Tables -
Analysis 3.2

Comparison 3 Hyaluronic acid versus botulinum toxin A, Outcome 2 Physical Function_AOS‐disability.

Comparison 3 Hyaluronic acid versus botulinum toxin A, Outcome 3 Adverse events.
Figures and Tables -
Analysis 3.3

Comparison 3 Hyaluronic acid versus botulinum toxin A, Outcome 3 Adverse events.

Summary of findings for the main comparison. Hyaluronic acid for osteoarthritis of the ankle

Hyaluronic acid for osteoarthritis of the ankle

Patient or population: patients with osteoarthritis of the ankle
Settings: Rehabilitation centre / hospital
Intervention: hyaluronic acid
Comparison: placebo

Outcomes

Illustrative comparative risks* (95% CI)

Relative effect
(95% CI)

No of Participants
(studies)

Quality of the evidence
(GRADE)

Comments

Assumed risk

Corresponding risk

Placebo

Hyaluronic acid

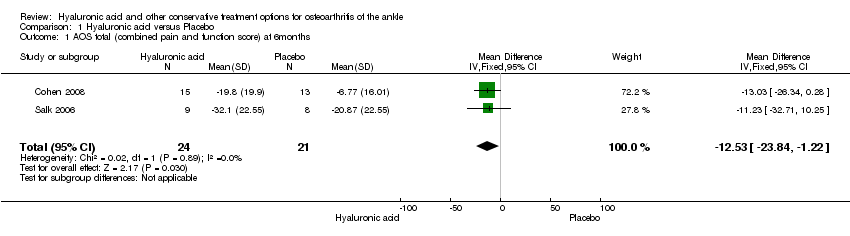
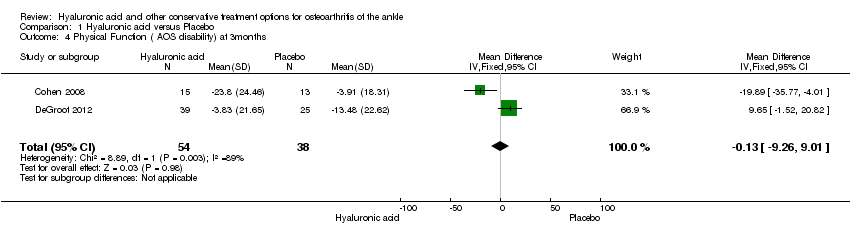
AOS total (Pain & Physical function)
AOS total score. Scale from: 0 to 100 (0 = being no pain/disability, 100 = worst imaginable pain/disability).
Follow‐up: 6 months

The mean pain/physical function change ranged across the control groups from 6.8 to 20.9 points lower with a weighted mean of
12.14 lower

The mean pain/physical function in the hyaluronic acid group was 12.53 points lower (23.84 lower to 1.22 lower) compared to placebo at 6 months.

45
(2 studies)

⊕⊕⊝⊝
Low1

A lower score indicates less pain and a better physical function. It is not known if a change of 12 points is clinically relevant.

NNT = 4 (95% CI 2 to 205) (using a SMD = 0.5 as a minimum important difference).

Absolute risk difference is −12.53% (95% CI −23.84 to −1.22).

Relative percentage change is 1.85% (95% CI 0.18 to 3.58%).

Radiographic Joint Structure Changes

See comment

See comment

Not estimable

0
(0)

See comment

Radiographic joint structure changes were not investigated.

Quality of Life

SF12. Scale from: 0 to 100. Follow‐up: mean 6 months.

See comment

See Comment

Not estimable

45 (2 studies)

See comment

Cohen 2008 only described that there was no significant difference between placebo and intervention for the SF12 outcome, no exact data was provided.

Salk 2006 could not provide us with the standard deviations, so no estimate of the SF12 could be made. He demonstrated a statistically significant difference in his paper favouring hyaluronic acid at 6 months.

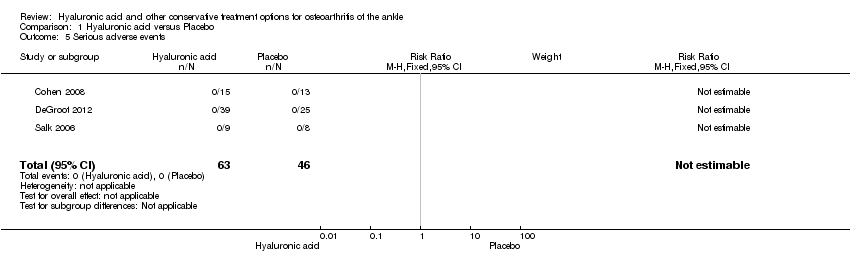
Number of participants experiencing any serious adverse events

Follow‐up: 3 to 6 months

See comment

See comment

Not estimable

109
(3 studies)

See comment

No serious adverse events (SAEs) were noted

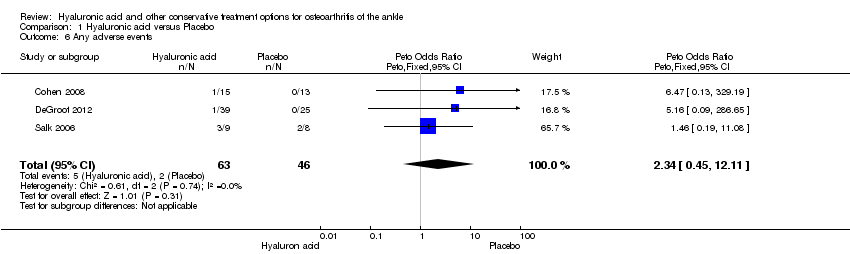
Number of participants experiencing any adverse event

Follow‐up: 3 to 6 months

43 per 1000

35 per 1000
higher (26 fewer to 241 more) compared to placebo.

RR 1.66
(0.47 to 5.88)

109
(3 studies)

⊕⊕⊝⊝
low1

Peto Odds Ratio is 2.34

(95% CI 0.45 to 12.11)

Absolute risk difference is 5.00% (−5 to 14), relative percentage change is 66% (−53% to 488%).

Adverse events for all 3 studies were reported, even though DeGroot had a follow up of 3 months. All adverse events resolved within a week after injection, so a shorter follow up has no effect on the estimate of effect.

Participants who withdraw because of an adverse event or any other reason

Follow‐up: 3 to 6 months

See comment

See comment

Not estimable

109
(3 studies)

See comment

No participants withdrew because of an adverse event

AOS: Ankle Osteoarthritis ScaleCI: Confidence interval; RR: Risk ratio; OR: Odds ratio; SF12: short form 12

GRADE Working Group grades of evidence
High quality: Further research is very unlikely to change our confidence in the estimate of effect.
Moderate quality: Further research is likely to have an important impact on our confidence in the estimate of effect and may change the estimate.
Low quality: Further research is very likely to have an important impact on our confidence in the estimate of effect and is likely to change the estimate.
Very low quality: We are very uncertain about the estimate.

Grade criteria: study limitation, indirectness, inconsistency, imprecision, publication bias.

* The assumed risk was based on the weighted mean of the scores in the control groups across the 2 studies. The range was based on the mean change in pain on a visual analogue scale (100 mm) of the control group in each separate study.The corresponding risk (and its 95% confidence interval) is based on the assumed risk in the comparison group and the relative effect of the intervention (and its 95% CI).

1 Evidence was downgraded based on limitations in study design and imprecision of results. Limitation in study design: there was a unclear risk of selection bias for Salk and Cohen, unclear risk for attrition bias for Salk. Imprecision of results: the population size is small (45 participants). No indirectness of evidence was found, no inconsistency and no publication bias.

2 Evidence was downgraded based on limitations in study design and imprecision of results. Limitation in study design: there was a unclear risk of selection bias for Cohen, an unclear risk for reporting bias for DeGroot. Imprecision of results: the total population size is small (92 participants). No indirectness of evidence was found, no inconsistency and no publication bias.

Figures and Tables -
Summary of findings for the main comparison. Hyaluronic acid for osteoarthritis of the ankle
Comparison 1. Hyaluronic acid versus Placebo

Outcome or subgroup title

No. of studies

No. of participants

Statistical method

Effect size

1 AOS total (combined pain and function score) at 6months Show forest plot

2

45

Mean Difference (IV, Fixed, 95% CI)

‐12.53 [‐23.84, ‐1.22]

2 AOS total (combined pain and function score) at 3months Show forest plot

2

92

Mean Difference (IV, Fixed, 95% CI)

‐2.26 [‐11.23, 6.72]

3 Pain (AOS pain) at 3months Show forest plot

2

92

Mean Difference (IV, Fixed, 95% CI)

‐1.83 [‐11.33, 7.68]

4 Physical Function ( AOS disability) at 3months Show forest plot

2

92

Mean Difference (IV, Fixed, 95% CI)

‐0.13 [‐9.26, 9.01]

5 Serious adverse events Show forest plot

3

109

Risk Ratio (M‐H, Fixed, 95% CI)

0.0 [0.0, 0.0]

6 Any adverse events Show forest plot

3

109

Peto Odds Ratio (Peto, Fixed, 95% CI)

2.34 [0.45, 12.11]

7 Patients who withdraw because of an adverse event Show forest plot

3

109

Risk Ratio (M‐H, Fixed, 95% CI)

0.0 [0.0, 0.0]

Figures and Tables -
Comparison 1. Hyaluronic acid versus Placebo
Comparison 2. Hyaluronic acid versus Exercise therapy

Outcome or subgroup title

No. of studies

No. of participants

Statistical method

Effect size

1 Pain during activity‐VAS Show forest plot

1

30

Mean Difference (IV, Fixed, 95% CI)

‐0.70 [‐2.54, 1.14]

2 Physical Function_total AOFAS Show forest plot

1

30

Mean Difference (IV, Fixed, 95% CI)

13.1 [2.97, 23.23]

3 Walking distance (AOFAS) Show forest plot

1

30

Mean Difference (IV, Fixed, 95% CI)

‐0.30 [‐1.27, 0.67]

Figures and Tables -
Comparison 2. Hyaluronic acid versus Exercise therapy
Comparison 3. Hyaluronic acid versus botulinum toxin A

Outcome or subgroup title

No. of studies

No. of participants

Statistical method

Effect size

1 Pain_AOS‐pain Show forest plot

1

75

Mean Difference (IV, Fixed, 95% CI)

0.10 [‐0.42, 0.62]

2 Physical Function_AOS‐disability Show forest plot

1

75

Mean Difference (IV, Fixed, 95% CI)

0.20 [‐0.34, 0.74]

3 Adverse events Show forest plot

1

75

Risk Ratio (M‐H, Fixed, 95% CI)

1.03 [0.15, 6.91]

Figures and Tables -
Comparison 3. Hyaluronic acid versus botulinum toxin A