Esteroides inhalados y riesgo de neumonía para la enfermedad pulmonar obstructiva crónica
Information
- DOI:
- https://doi.org/10.1002/14651858.CD010115.pub2Copy DOI

- Database:
-
- Cochrane Database of Systematic Reviews
- Version published:
-
- 10 March 2014see what's new
- Type:
-
- Intervention
- Stage:
-
- Review
- Cochrane Editorial Group:
-
Cochrane Airways Group
- Copyright:
-
- Copyright © 2014 The Cochrane Collaboration. Published by John Wiley & Sons, Ltd.
Article metrics
Altmetric:
Cited by:
Authors
Contributions of authors
Alieksei Seniukowich and Kayleigh Kew extracted data. Kayleigh conducted the analysis, interpreted the data and wrote up the results, with clinical input from Alieksei.
Charlotta Karner, authored the protocol, sifted the search and contributed to data extraction.
Sources of support
Internal sources
-
NIHR, UK.
This review is supported by a programme grant from NIHR.
External sources
-
No sources of support supplied
Declarations of interest
None known.
Acknowledgements
We are grateful to Elizabeth Stovold for her help in designing the search strategy and to Charlotta Karner for her role in study selection and data extraction.
CRG Funding Acknowledgement: The National Institute for Health Research (NIHR) is the largest single funder of the Cochrane Airways Group.
Disclaimer: The views and opinions expressed therein are those of the review authors and do not necessarily reflect those of NIHR, NHS or the Department of Health.
Julia Walters was the Editor for this review and commented critically on the review.
Version history
| Published | Title | Stage | Authors | Version |
| 2014 Mar 10 | Inhaled steroids and risk of pneumonia for chronic obstructive pulmonary disease | Review | Kayleigh M Kew, Alieksei Seniukovich | |
| 2012 Sep 12 | Inhaled steroids and risk of pneumonia for chronic obstructive pulmonary disease | Protocol | Charlotta Karner, Aliaksei Seniukovich | |
Differences between protocol and review
The subgroup analysis stated in the protocol based on diagnostic criteria for pneumonia could not be conducted, as most trials did not state the definition. We included studies using fluticasone furoate, alone or in combination with the LABA vilanterol; these new formulations were not anticipated during the writing of the protocol. For reasons explained in the review, we chose not to calculate an indirect comparison of fluticasone/LABA versus budesonide LABA.
We added the following additional comparisons: fluticasone furoate/vilanterol versus vilanterol; fluticasone/vilanterol versus budesonide/formoterol.
We added to the methods a section on assessing transitivity.
Keywords
MeSH
Medical Subject Headings (MeSH) Keywords
- Administration, Inhalation;
- Adrenergic beta‐2 Receptor Agonists [administration & dosage, adverse effects];
- Androstadienes [administration & dosage, *adverse effects];
- Anti‐Inflammatory Agents [administration & dosage, *adverse effects];
- Bronchodilator Agents [administration & dosage, *adverse effects];
- Budesonide [administration & dosage, *adverse effects];
- Drug Therapy, Combination [methods];
- Fluticasone;
- Pneumonia [chemically induced];
- Pulmonary Disease, Chronic Obstructive [*drug therapy];
- Randomized Controlled Trials as Topic;
Medical Subject Headings Check Words
Female; Humans; Male; Middle Aged;
PICOs

Direct and indirect comparisons of fluticasone and budesonide covered in the review.


Risk of bias summary: review authors' judgements about each risk of bias item for each included study.
Summary of pooled effects of trials comparing ICS versus placebo and combination versus LABA.
Non‐fatal serious adverse pneumonia events were those requiring hospital admission. Data for all pneumonia events were not pooled because of heterogeneity.

Indirect comparisons of fluticasone and budesonide monotherapy.
Non‐fatal serious adverse pneumonia events were defined as those requiring hospital admission.

Indirect comparisons of fluticasone and budesonide monotherapy—Sensitivity analysis removing (Calverley 2007 TORCH).

Comparison 1 Fluticasone versus controls (all outcomes by treatment), Outcome 1 Non‐fatal, serious adverse pneumonia events.
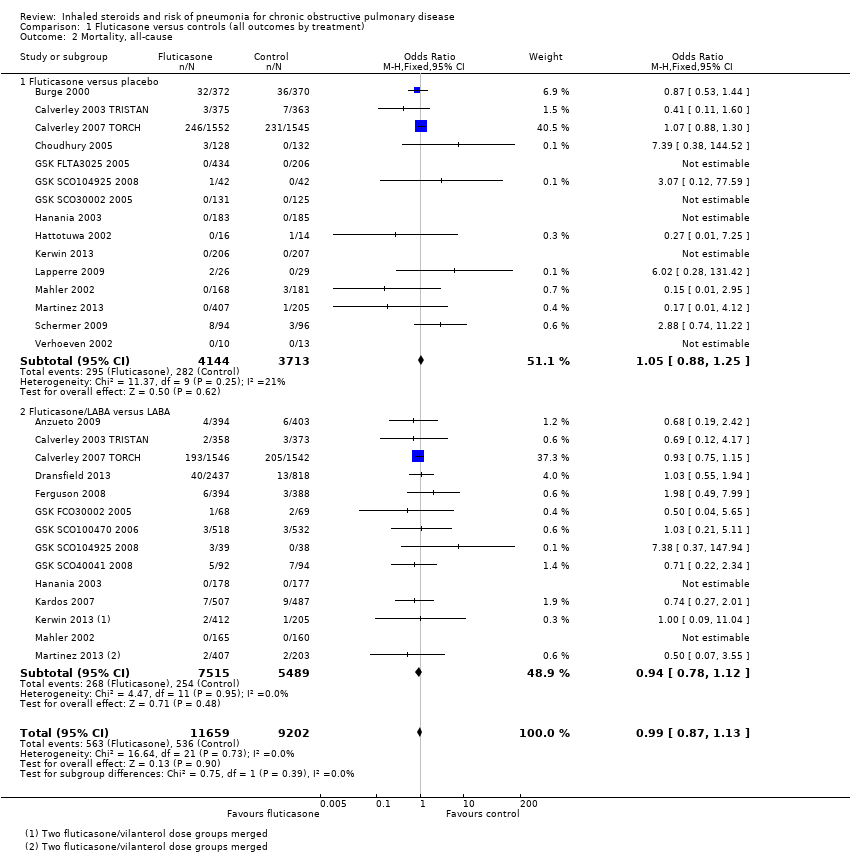
Comparison 1 Fluticasone versus controls (all outcomes by treatment), Outcome 2 Mortality, all‐cause.

Comparison 1 Fluticasone versus controls (all outcomes by treatment), Outcome 3 Mortality, due to pneumonia.
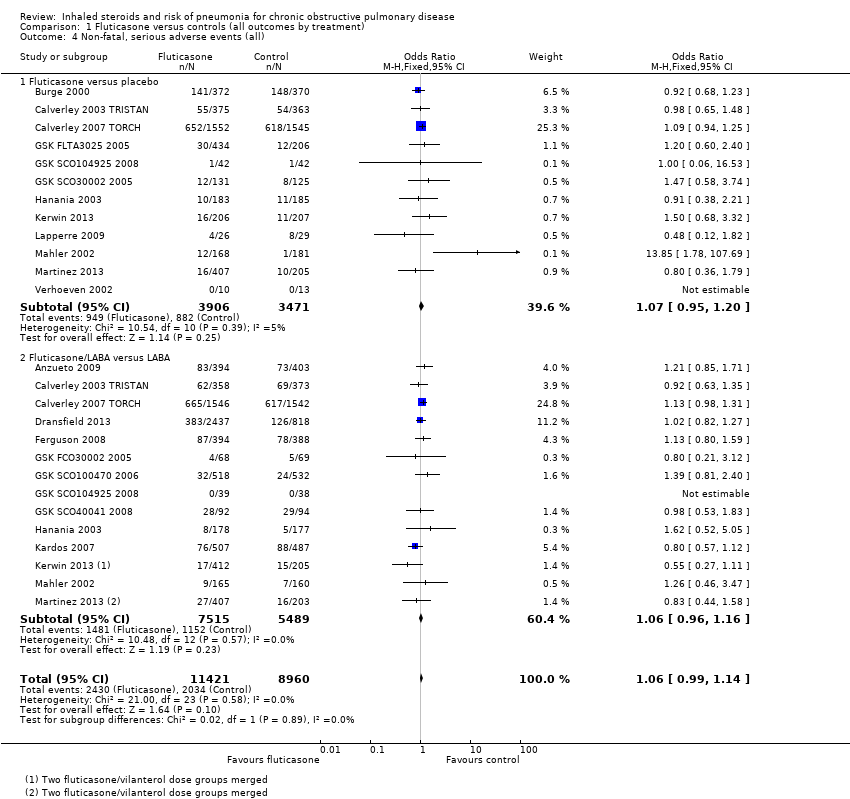
Comparison 1 Fluticasone versus controls (all outcomes by treatment), Outcome 4 Non‐fatal, serious adverse events (all).

Comparison 1 Fluticasone versus controls (all outcomes by treatment), Outcome 5 All pneumonia events.
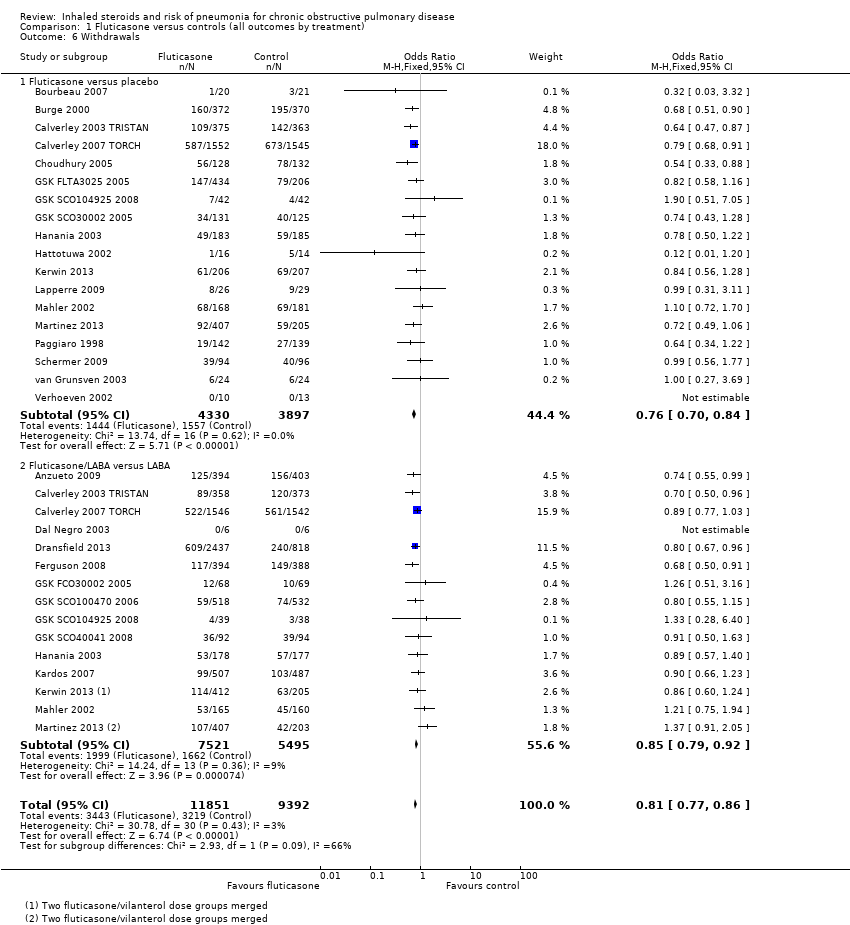
Comparison 1 Fluticasone versus controls (all outcomes by treatment), Outcome 6 Withdrawals.
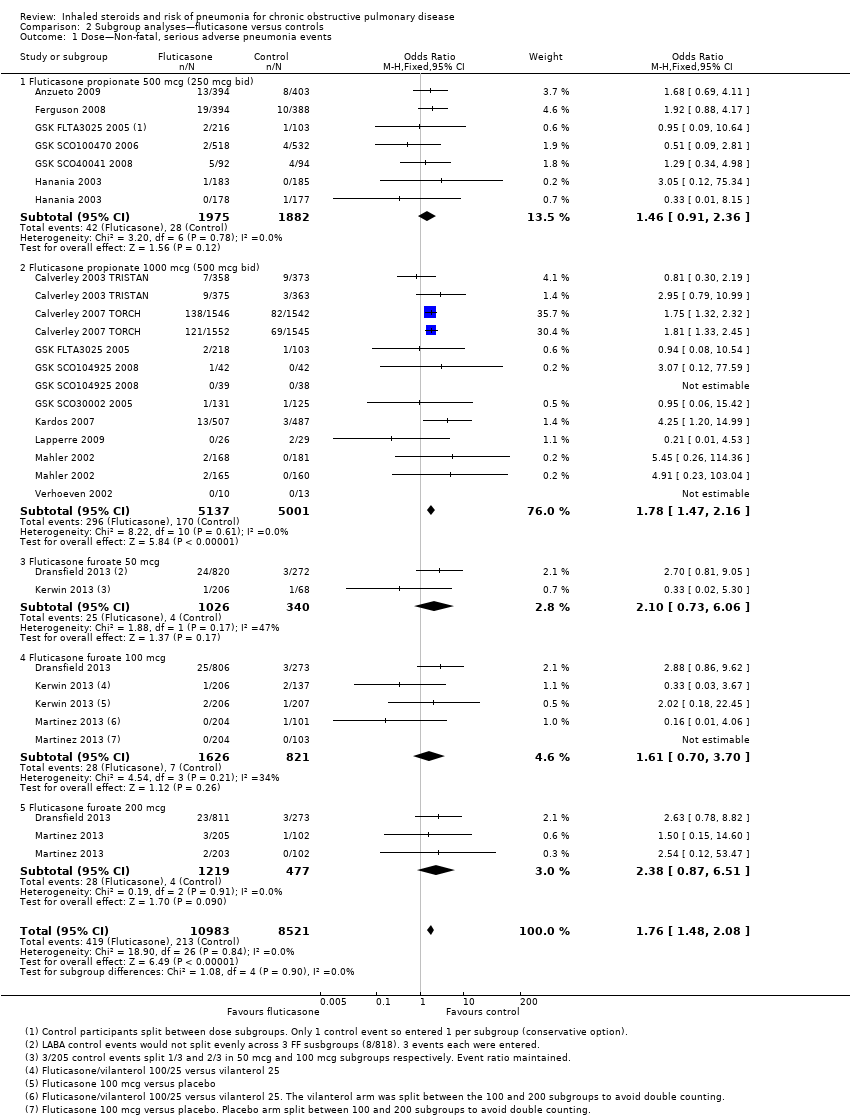
Comparison 2 Subgroup analyses—fluticasone versus controls, Outcome 1 Dose—Non‐fatal, serious adverse pneumonia events.
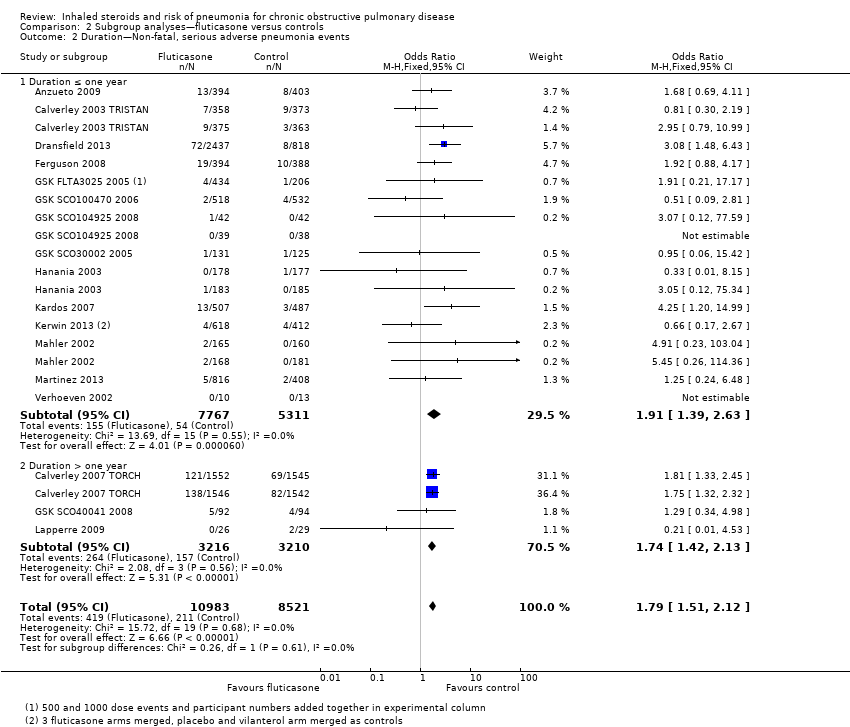
Comparison 2 Subgroup analyses—fluticasone versus controls, Outcome 2 Duration—Non‐fatal, serious adverse pneumonia events.
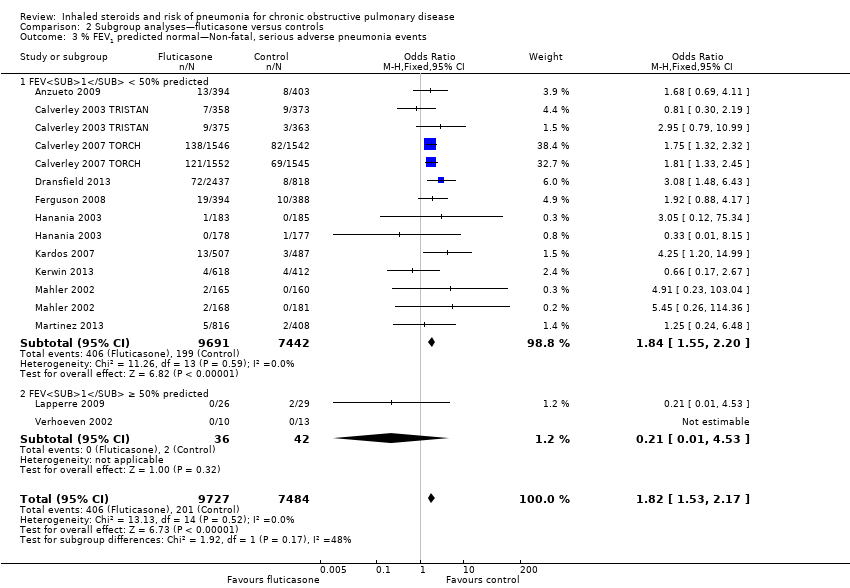
Comparison 2 Subgroup analyses—fluticasone versus controls, Outcome 3 % FEV1 predicted normal—Non‐fatal, serious adverse pneumonia events.
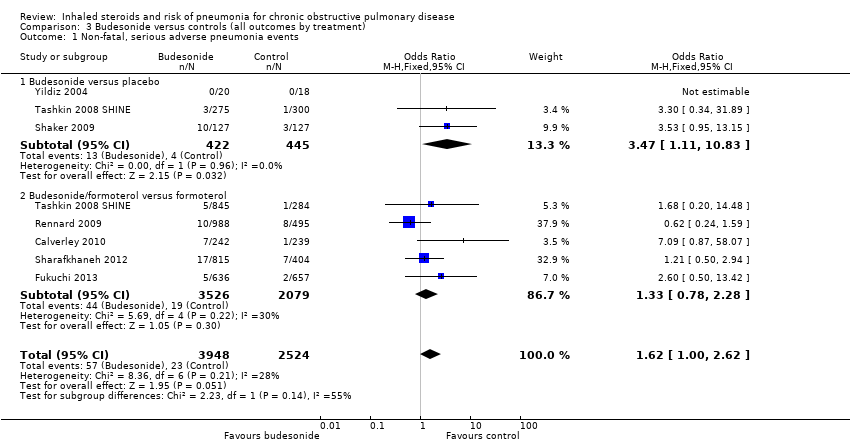
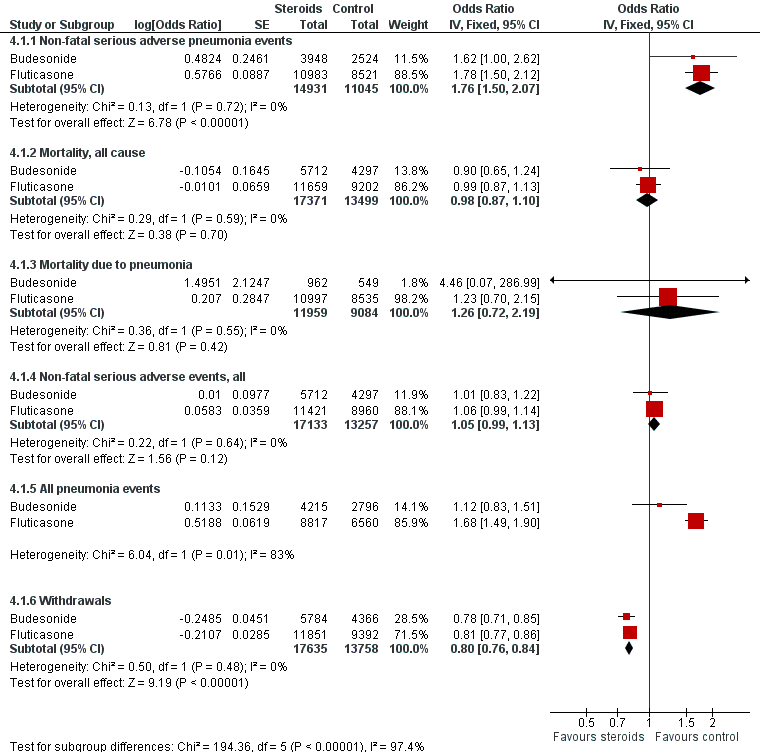
Comparison 3 Budesonide versus controls (all outcomes by treatment), Outcome 1 Non‐fatal, serious adverse pneumonia events.

Comparison 3 Budesonide versus controls (all outcomes by treatment), Outcome 2 Mortality, all‐cause.

Comparison 3 Budesonide versus controls (all outcomes by treatment), Outcome 3 Mortality, due to pneumonia.

Comparison 3 Budesonide versus controls (all outcomes by treatment), Outcome 4 Non‐fatal, serious adverse events (all).

Comparison 3 Budesonide versus controls (all outcomes by treatment), Outcome 5 All pneumonia events.
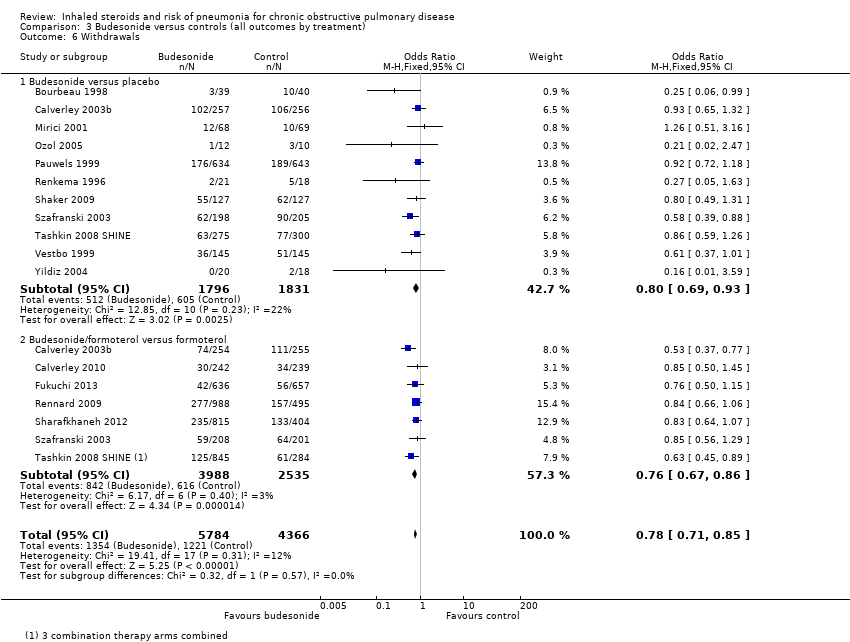
Comparison 3 Budesonide versus controls (all outcomes by treatment), Outcome 6 Withdrawals.
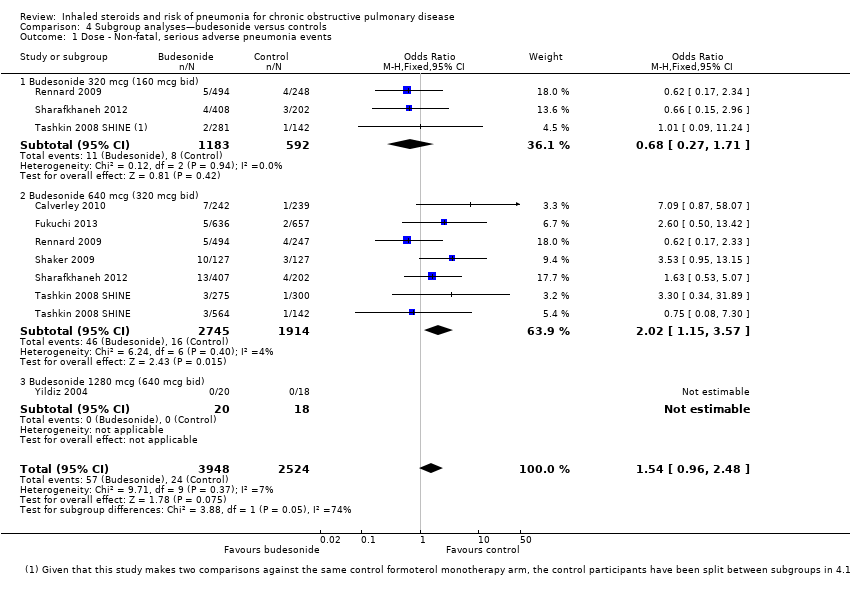
Comparison 4 Subgroup analyses—budesonide versus controls, Outcome 1 Dose ‐ Non‐fatal, serious adverse pneumonia events.

Comparison 4 Subgroup analyses—budesonide versus controls, Outcome 2 Duration ‐ Non‐fatal, serious adverse pneumonia events.

Comparison 4 Subgroup analyses—budesonide versus controls, Outcome 3 % FEV1 predicted normal ‐ Non‐fatal, serious adverse pneumonia events.
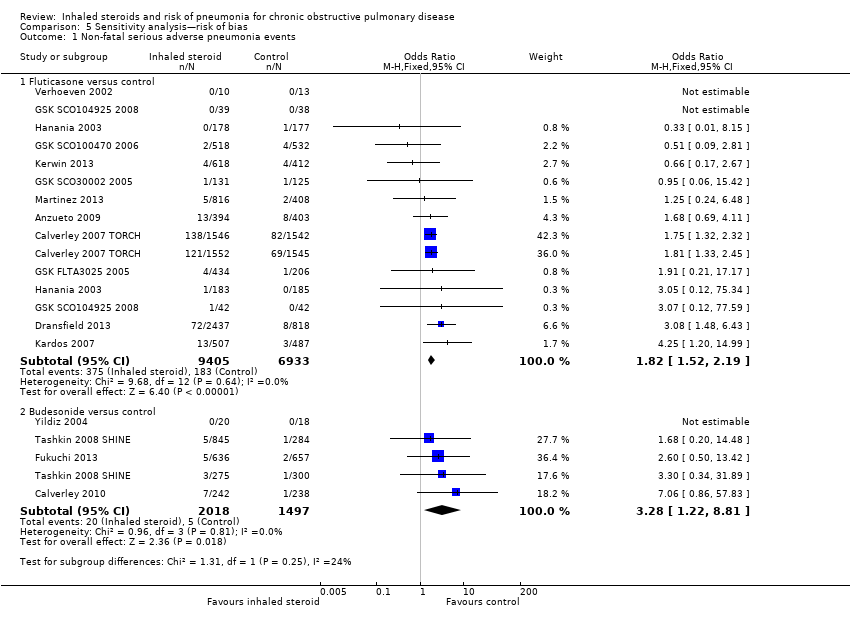
Comparison 5 Sensitivity analysis—risk of bias, Outcome 1 Non‐fatal serious adverse pneumonia events.
| Fluticasone for chronic obstructive pulmonary disease | |||||
| Patient or population: patients with chronic obstructive pulmonary disease Comparison: placebo or LABA monotherapy (dependent upon whether fluticasone was given with LABA in the intervention group) Setting: community | |||||
| Outcomes Follow‐ups presented as weighted means | Illustrative comparative risks* (95% CI) | Relative effect | No. of participants | Quality of the evidence | |
| Assumed risk | Corresponding risk | ||||
| Control | Fluticasone | ||||
| Non‐fatal, serious adverse pneumonia events (requiring hospital admission) | 25 per 1000 | 43 per 1000 | OR 1.78 | 19,504 | ⊕⊕⊕⊕ |
| Mortality, all‐cause | 58 per 1000 | 58 per 1000 | OR 0.99 | 20,861 | ⊕⊕⊕⊕ |
| Mortality, due to pneumonia | 2 per 1000 | 3 per 1000 | OR 1.23 | 19,532 | ⊕⊕⊕⊝ |
| Non‐fatal, serious adverse events (all) | 227 per 1000 | 237 per 1000 | OR 1.06 | 20,381 | ⊕⊕⊕⊕ |
| All pneumonia events | 72 per 1000 | 116 per 1000 | OR 1.68 | 15,377 | ⊕⊕⊕⊝ |
| Withdrawals | 343 per 1000 | 297 per 1000 | OR 0.81 | 21,243 | ⊕⊕⊕⊕ |
| *The basis for the assumed risk (e.g. the median control group risk across studies) is provided in footnotes. The corresponding risk (and its 95% confidence interval) is based on the assumed risk in the comparison group and the relative effect of the intervention (and its 95% CI). Unless otherwise stated, subgroup differences between monotherapy studies (fluticasone versus placebo) and combination therapy studies (fluticasone/LABA versus LABA) were not significant. | |||||
| GRADE Working Group grades of evidence. | |||||
| 1Wide confidence intervals include significant benefit and harm, based on very few events (‐1 for imprecision). | |||||
| Budesonide for chronic obstructive pulmonary disease | |||||
| Patient or population: patients with chronic obstructive pulmonary disease Comparison: placebo or LABA monotherapy (dependent upon whether fluticasone was given with LABA in the intervention group) Setting: community | |||||
| Outcomes Follow‐ups presented as weighted means | Illustrative comparative risks* (95% CI) | Relative effect | No of Participants | Quality of the evidence | |
| Assumed risk | Corresponding risk | ||||
| Control | Budesonide | ||||
| Non‐fatal, serious adverse pneumonia events (requiring hospital admission) | 9 per 1000 | 15 per 1000 | OR 1.62 | 6472 | ⊕⊕⊕⊝ |
| Mortality, all‐cause | 17 per 1000 | 16 per 1000 | OR 0.90 | 10,009 | ⊕⊕⊕⊝ |
| Mortality, due to pneumonia | 0 per 1000 | 0 per 1000 | OR 4.46 | 1511 | ⊕⊝⊝⊝ |
| Non‐fatal, serious adverse events (all) | 145 per 1000 | 146 per 1000 | OR 1.01 | 10,009 | ⊕⊕⊕⊝ |
| All pneumonia events | 28 per 1000 | 31 per 1000 | OR 1.12 | 7011 | ⊕⊕⊕⊝ |
| Withdrawals | 280 per 1000 | 232 per 1000 | OR 0.78 | 10150 | ⊕⊕⊕⊕ |
| *The basis for the assumed risk (e.g. the median control group risk across studies) is provided in footnotes. The corresponding risk (and its 95% confidence interval) is based on the assumed risk in the comparison group and the relative effect of the intervention (and its 95% CI). Unless otherwise stated, subgroup differences between monotherapy studies (budesonide versus placebo) and combination therapy studies (budesonide/LABA versus LABA) were not significant. | |||||
| GRADE Working Group grades of evidence. | |||||
| 1Confidence intervals are quite wide but are not considered serious enough to downgrade. | |||||
| Study ID | Duration (m) | N Rand | Funder | ICS dose (mcg) | % Male | Mean age | Pack‐years | % pred FEV1 |
| Fluticasone versus placebo (n = 18) | ||||||||
| 3 | 41 | GSK | 1000 | 78 | 65 | 53 | 57 | |
| 36 | 740 | GSK | 1000 | 75 | 64 | 44 | 50 | |
| 12 | 763 | GSK | 1000 | 73 | 63 | 43 | 45 | |
| 36 | 3097 | GSK | 1000 | 76 | 65 | 49 | 44 | |
| 12 | 260 | Indep. | 1000 | 52 | 67 | 39 | 54 | |
| 6 | 640 | GSK | 500, 1000 | 69 | 64 | ‐ | ‐ | |
| 3 | 84 | GSK | 1000 | 77 | 64 | ‐ | ‐ | |
| 12 | 256 | GSK | 1000 | 82 | 65 | ‐ | ‐ | |
| 6 | 368 | GSK | 500 | 63 | 64 | 57 | 42 | |
| 3 | 36 | GSK | 1000 | 87 | 65 | 63 | 46 | |
| Kerwin 2013a,b | 6 | 413 | GSK | 100 | 66 | 62 | 46 | 42 |
| 30 | 55 | GSK | 1000 | 86 | 60 | 43 | 55 | |
| 6 | 349 | GSK | 1000 | 66 | 65 | 55 | 41 | |
| 6 | 612 | GSK | 100, 200 | 72 | 62 | 43 | 48 | |
| 6 | 281 | ‐ | 1000 | 74 | 63 | ‐ | 57 | |
| 36 | 190 | Indep. | 1000 | 71 | 59 | 28 | 64 | |
| 24 | 48 | GSK | 500 | 52 | 47 | 9 | 97 | |
| 6 | 23 | GSK | 1000 | 82 | 55 | 26 | 63 | |
| WM 22 m | 459 | ‐ | ‐ | 72 | 62 | 43 | 54 | |
| Fluticasone/LABA combination versus LABA monotherapy (n = 15) | ||||||||
| 12 | 797 | GSK | 500 | 54 | 65 | 57 | 34 | |
| 12 | 731 | GSK | 1000 | 73 | 63 | 43 | 45 | |
| 36 | 3088 | GSK | 1000 | 76 | 65 | 49 | 44 | |
| 12 | 12 | ‐ | 500 | 92 | ‐ | 42 | 50 | |
| 12 | 3255 | GSK | 50, 100, 200 | 57 | 64 | ‐ | 45 | |
| 12 | 782 | GSK | 500 | 55 | 65 | 56 | 33 | |
| 3 | 140 | GSK | 1000 | 66 | 62 | ‐ | ‐ | |
| 6 | 1050 | GSK | 500 | 78 | 64 | ‐ | ‐ | |
| 3 | 77 | GSK | 1000 | 77 | 64 | ‐ | ‐ | |
| 36 | 186 | GSK | 500 | 61 | 66 | ‐ | ‐ | |
| 6 | 355 | GSK | 500 | 63 | 64 | 57 | 42 | |
| 10 | 994 | GSK | 1000 | 76 | 64 | 37 | 40 | |
| Kerwin 2013a,b | 6 | 617 | GSK | 100 | 67 | 63 | 46 | 43 |
| 6 | 325 | GSK | 1000 | 66 | 65 | 55 | 41 | |
| 6 | 610 | GSK | 100, 200 | 72 | 62 | 43 | 48 | |
| WM 16 m | 867 | ‐ | ‐ | 69 | 64 | 53 | 42 | |
| aMulti‐arm studies making both comparisons of interest (ICS vs placebo and ICS/LABA vs LABA). bStudies using vilanterol as the LABA combination and monotherapy comparator, with fluticasone furoate. Dose is given as the total received per day (i.e. 500 signifies 250 morning and evening). WM = weighted mean. | ||||||||
| Study ID | Duration (m) | N Rand | Funder | ICS dose (mcg) | % Male | Mean age | Pack‐years | % pred FEV1 |
| Budesonide versus placebo (n = 13) | ||||||||
| 6 | 79 | AZ | 640 | 79 | 66 | 51 | 37 | |
| 12 | 513 | GSK | 640 | 76 | 64 | 35 | 36 | |
| 6 | 49 | NR | 640 | NR | NR | NR | NR | |
| 3 | 50 | NR | 640 | 75 | 53 | 27 | 62 | |
| 6 | 26 | NR | 640 | 69 | 65 | 45 | 59 | |
| 36 | 1277 | AZ | 640 | 73 | 52 | 39 | 77 | |
| 24 | 39 | AZ | 1280 | 100 | 55 | NR | 64 | |
| 6 | 26 | NR | 640 | 54 | 61 | NR | NR | |
| 36 | 254 | AZ | 640 | 58 | 64 | 56 | 52 | |
| 12 | 403 | AZ | 640 | 79 | 64 | 45 | 36 | |
| 6 | 575 | AZ | 640 | 68 | 63 | 41 | 40 | |
| 36 | 290 | AZ | 640 | 88 | 59 | NR | 87 | |
| 3 | 38 | ? | 1280 | 100 | 67 | 51 | 46 | |
| WM 23 m | 278 | ‐ | ‐ | 77 | 61 | 43 | 54 | |
| Budesonide/LABA combination versus LABA monotherapy (n = 7) | ||||||||
| 12 | 509 | GSK | 640 | 76 | 64 | 35 | 36 | |
| 11 | 481 | Chiesi | 640 | 81 | 64 | 39 | 42 | |
| 3 | 1293 | AZ | 640 | 89 | 65 | 44 | 41 | |
| 12 | 1483 | AZ | 320, 640 | 63 | 63 | NR | 39 | |
| 12 | 1219 | AZ | 320, 640 | 62 | 63 | 44 | 38 | |
| 12 | 409 | AZ | 640 | 79 | 64 | 45 | 36 | |
| 6 | 1129 | AZ | 320, 640 | 68 | 63 | 41 | 40 | |
| WM 9 m | 932 | ‐ | ‐ | 75 | 64 | 41 | 39 | |
| aMulti‐arm studies making both comparisons of interest (ICS vs placebo and ICS/LABA vs LABA). Dose is given as the total received per day (i.e. 640 signifies 320 morning and evening). WM = weighted mean. | ||||||||
| Drug | Daily dose (mcg) | BDP equivalent (mcg) |
| Budesonide | 320 | 320 |
| 640 | 640 | |
| 1280 | 1280 | |
| Fluticasone | 500 (propionate) | 1000 |
| 1000 (propionate) | 2000 | |
| 50 (furoate) | 500 | |
| 100 (furoate) | 1000 | |
| 200 (furoate) | 2000 |
| Monotherapy comparison—Placebo control events | Combination comparison—LABA control events | |||
| Fluticasone | Budesonide | Fluticasone | Budesonide | |
| Pneumonia‐related serious adverse events | 2.5%, 77/310 | 0.9%, 4/445 | 2.5%, 134/5420 | 0.9%, 19/2079 |
| 0.5% without TORCH | 0.7% without TORCH | |||
| All‐cause mortality | 7.6%, 282/3713 | 2.1%, 37/1763 | 5.1%, 254/5489 | 1.5%, 37/2534 |
| 2.4% without TORCH | 1.2% without TORCH | |||
| All‐cause serious adverse events | 25%, 882/3471 | 15%, 268/1763 | 21%, 1152/5489 | 14%, 356/2534 |
| 14% without TORCH | 14% without TORCH | |||
| For the fluticasone control groups with and without the large 3‐year TORCH study. | ||||
| Outcome or subgroup title | No. of studies | No. of participants | Statistical method | Effect size |
| 1 Non‐fatal, serious adverse pneumonia events Show forest plot | 17 | 19504 | Odds Ratio (M‐H, Fixed, 95% CI) | 1.78 [1.50, 2.12] |
| 1.1 Fluticasone versus placebo | 11 | 6635 | Odds Ratio (M‐H, Fixed, 95% CI) | 1.84 [1.39, 2.44] |
| 1.2 Fluticasone/LABA versus LABA | 13 | 12869 | Odds Ratio (M‐H, Fixed, 95% CI) | 1.75 [1.41, 2.17] |
| 2 Mortality, all‐cause Show forest plot | 22 | 20861 | Odds Ratio (M‐H, Fixed, 95% CI) | 0.99 [0.87, 1.13] |
| 2.1 Fluticasone versus placebo | 15 | 7857 | Odds Ratio (M‐H, Fixed, 95% CI) | 1.05 [0.88, 1.25] |
| 2.2 Fluticasone/LABA versus LABA | 14 | 13004 | Odds Ratio (M‐H, Fixed, 95% CI) | 0.94 [0.78, 1.12] |
| 3 Mortality, due to pneumonia Show forest plot | 18 | 19532 | Peto Odds Ratio (Peto, Fixed, 95% CI) | 1.23 [0.70, 2.15] |
| 3.1 Fluticasone versus placebo | 12 | 6665 | Peto Odds Ratio (Peto, Fixed, 95% CI) | 1.20 [0.52, 2.77] |
| 3.2 Fluticasone/LABA versus LABA | 13 | 12867 | Peto Odds Ratio (Peto, Fixed, 95% CI) | 1.25 [0.59, 2.65] |
| 4 Non‐fatal, serious adverse events (all) Show forest plot | 19 | 20381 | Odds Ratio (M‐H, Fixed, 95% CI) | 1.06 [0.99, 1.14] |
| 4.1 Fluticasone versus placebo | 12 | 7377 | Odds Ratio (M‐H, Fixed, 95% CI) | 1.07 [0.95, 1.20] |
| 4.2 Fluticasone/LABA versus LABA | 14 | 13004 | Odds Ratio (M‐H, Fixed, 95% CI) | 1.06 [0.96, 1.16] |
| 5 All pneumonia events Show forest plot | 11 | 15377 | Odds Ratio (M‐H, Fixed, 95% CI) | 1.68 [1.49, 1.90] |
| 5.1 Fluticasone versus placebo | 6 | 4971 | Odds Ratio (M‐H, Fixed, 95% CI) | 1.62 [1.33, 1.97] |
| 5.2 Fluticasone/LABA versus LABA | 9 | 10406 | Odds Ratio (M‐H, Fixed, 95% CI) | 1.72 [1.47, 2.01] |
| 6 Withdrawals Show forest plot | 26 | 21243 | Odds Ratio (M‐H, Fixed, 95% CI) | 0.81 [0.77, 0.86] |
| 6.1 Fluticasone versus placebo | 18 | 8227 | Odds Ratio (M‐H, Fixed, 95% CI) | 0.76 [0.70, 0.84] |
| 6.2 Fluticasone/LABA versus LABA | 15 | 13016 | Odds Ratio (M‐H, Fixed, 95% CI) | 0.85 [0.79, 0.92] |
| Outcome or subgroup title | No. of studies | No. of participants | Statistical method | Effect size |
| 1 Dose—Non‐fatal, serious adverse pneumonia events Show forest plot | 17 | 19504 | Odds Ratio (M‐H, Fixed, 95% CI) | 1.76 [1.48, 2.08] |
| 1.1 Fluticasone propionate 500 mcg (250 mcg bid) | 6 | 3857 | Odds Ratio (M‐H, Fixed, 95% CI) | 1.46 [0.91, 2.36] |
| 1.2 Fluticasone propionate 1000 mcg (500 mcg bid) | 9 | 10138 | Odds Ratio (M‐H, Fixed, 95% CI) | 1.78 [1.47, 2.16] |
| 1.3 Fluticasone furoate 50 mcg | 2 | 1366 | Odds Ratio (M‐H, Fixed, 95% CI) | 2.10 [0.73, 6.06] |
| 1.4 Fluticasone furoate 100 mcg | 3 | 2447 | Odds Ratio (M‐H, Fixed, 95% CI) | 1.61 [0.70, 3.70] |
| 1.5 Fluticasone furoate 200 mcg | 2 | 1696 | Odds Ratio (M‐H, Fixed, 95% CI) | 2.38 [0.87, 6.51] |
| 2 Duration—Non‐fatal, serious adverse pneumonia events Show forest plot | 17 | 19504 | Odds Ratio (M‐H, Fixed, 95% CI) | 1.79 [1.51, 2.12] |
| 2.1 Duration ≤ one year | 14 | 13078 | Odds Ratio (M‐H, Fixed, 95% CI) | 1.91 [1.39, 2.63] |
| 2.2 Duration > one year | 3 | 6426 | Odds Ratio (M‐H, Fixed, 95% CI) | 1.74 [1.42, 2.13] |
| 3 % FEV1 predicted normal—Non‐fatal, serious adverse pneumonia events Show forest plot | 12 | 17211 | Odds Ratio (M‐H, Fixed, 95% CI) | 1.82 [1.53, 2.17] |
| 3.1 FEV1 < 50% predicted | 10 | 17133 | Odds Ratio (M‐H, Fixed, 95% CI) | 1.84 [1.55, 2.20] |
| 3.2 FEV1 ≥ 50% predicted | 2 | 78 | Odds Ratio (M‐H, Fixed, 95% CI) | 0.21 [0.01, 4.53] |
| Outcome or subgroup title | No. of studies | No. of participants | Statistical method | Effect size |
| 1 Non‐fatal, serious adverse pneumonia events Show forest plot | 7 | 6472 | Odds Ratio (M‐H, Fixed, 95% CI) | 1.62 [1.00, 2.62] |
| 1.1 Budesonide versus placebo | 3 | 867 | Odds Ratio (M‐H, Fixed, 95% CI) | 3.47 [1.11, 10.83] |
| 1.2 Budesonide/formoterol versus formoterol | 5 | 5605 | Odds Ratio (M‐H, Fixed, 95% CI) | 1.33 [0.78, 2.28] |
| 2 Mortality, all‐cause Show forest plot | 12 | 10009 | Odds Ratio (M‐H, Fixed, 95% CI) | 0.90 [0.65, 1.24] |
| 2.1 Budesonide versus placebo | 8 | 3487 | Odds Ratio (M‐H, Fixed, 95% CI) | 0.85 [0.52, 1.37] |
| 2.2 Budesonide/formoterol versus formoterol | 7 | 6522 | Odds Ratio (M‐H, Fixed, 95% CI) | 0.94 [0.61, 1.46] |
| 3 Mortality, due to pneumonia Show forest plot | 3 | 1511 | Peto Odds Ratio (Peto, Fixed, 95% CI) | 4.46 [0.07, 286.99] |
| 3.1 Budesonide versus placebo | 2 | 292 | Peto Odds Ratio (Peto, Fixed, 95% CI) | 0.0 [0.0, 0.0] |
| 3.2 Budesonide/formoterol versus formoterol | 1 | 1219 | Peto Odds Ratio (Peto, Fixed, 95% CI) | 4.46 [0.07, 286.99] |
| 4 Non‐fatal, serious adverse events (all) Show forest plot | 12 | 10009 | Odds Ratio (M‐H, Random, 95% CI) | 1.01 [0.83, 1.22] |
| 4.1 Budesonide versus placebo | 8 | 3487 | Odds Ratio (M‐H, Random, 95% CI) | 1.02 [0.69, 1.50] |
| 4.2 Budesonide/formoterol versus formoterol | 7 | 6522 | Odds Ratio (M‐H, Random, 95% CI) | 0.93 [0.78, 1.11] |
| 5 All pneumonia events Show forest plot | 6 | 7011 | Odds Ratio (M‐H, Fixed, 95% CI) | 1.12 [0.83, 1.51] |
| 5.1 Budesonide versus placebo | 3 | 1378 | Odds Ratio (M‐H, Fixed, 95% CI) | 0.87 [0.50, 1.50] |
| 5.2 Budesonide/formoterol versus formoterol | 5 | 5633 | Odds Ratio (M‐H, Fixed, 95% CI) | 1.24 [0.87, 1.77] |
| 6 Withdrawals Show forest plot | 15 | 10150 | Odds Ratio (M‐H, Fixed, 95% CI) | 0.78 [0.71, 0.85] |
| 6.1 Budesonide versus placebo | 11 | 3627 | Odds Ratio (M‐H, Fixed, 95% CI) | 0.80 [0.69, 0.93] |
| 6.2 Budesonide/formoterol versus formoterol | 7 | 6523 | Odds Ratio (M‐H, Fixed, 95% CI) | 0.76 [0.67, 0.86] |
| Outcome or subgroup title | No. of studies | No. of participants | Statistical method | Effect size |
| 1 Dose ‐ Non‐fatal, serious adverse pneumonia events Show forest plot | 7 | 6472 | Odds Ratio (M‐H, Fixed, 95% CI) | 1.54 [0.96, 2.48] |
| 1.1 Budesonide 320 mcg (160 mcg bid) | 3 | 1775 | Odds Ratio (M‐H, Fixed, 95% CI) | 0.68 [0.27, 1.71] |
| 1.2 Budesonide 640 mcg (320 mcg bid) | 6 | 4659 | Odds Ratio (M‐H, Fixed, 95% CI) | 2.02 [1.15, 3.57] |
| 1.3 Budesonide 1280 mcg (640 mcg bid) | 1 | 38 | Odds Ratio (M‐H, Fixed, 95% CI) | 0.0 [0.0, 0.0] |
| 2 Duration ‐ Non‐fatal, serious adverse pneumonia events Show forest plot | 7 | 6471 | Odds Ratio (M‐H, Fixed, 95% CI) | 1.62 [1.00, 2.62] |
| 2.1 Duration ≤ one year | 6 | 6217 | Odds Ratio (M‐H, Fixed, 95% CI) | 1.41 [0.83, 2.37] |
| 2.2 Duration > one year | 1 | 254 | Odds Ratio (M‐H, Fixed, 95% CI) | 3.53 [0.95, 13.15] |
| 3 % FEV1 predicted normal ‐ Non‐fatal, serious adverse pneumonia events Show forest plot | 7 | 6471 | Odds Ratio (M‐H, Fixed, 95% CI) | 1.60 [0.99, 2.59] |
| 3.1 FEV1 < 50% predicted | 6 | 6217 | Odds Ratio (M‐H, Fixed, 95% CI) | 1.39 [0.82, 2.34] |
| 3.2 FEV1 ≥ 50% predicted | 1 | 254 | Odds Ratio (M‐H, Fixed, 95% CI) | 3.53 [0.95, 13.15] |
| Outcome or subgroup title | No. of studies | No. of participants | Statistical method | Effect size |
| 1 Non‐fatal serious adverse pneumonia events Show forest plot | 16 | Odds Ratio (M‐H, Fixed, 95% CI) | Subtotals only | |
| 1.1 Fluticasone versus control | 12 | 16338 | Odds Ratio (M‐H, Fixed, 95% CI) | 1.82 [1.52, 2.19] |
| 1.2 Budesonide versus control | 4 | 3515 | Odds Ratio (M‐H, Fixed, 95% CI) | 3.28 [1.22, 8.81] |