Mimetik thrombopoietin untuk pesakit sindrom myelodysplastic
Abstract
Background
Myelodysplastic syndrome (MDS) is one of the most frequent haematologic malignancies of the elderly population and characterised by progenitor cell dysplasia with ineffective haematopoiesis and a high rate of transformation to acute myeloid leukaemia (AML). Thrombocytopenia represents a common problem for patients with MDS. ranging from mild to serious bleeding events and death. To manage thrombocytopenia, the current standard treatment includes platelet transfusion, unfortunately leading to a range of side effects. Thrombopoietin (TPO) mimetics represent an alternative treatment option for MDS patients with thrombocytopenia. However, it remains unclear, whether TPO mimetics influence the increase of blast cells and therefore to premature progression to AML.
Objectives
To evaluate the efficacy and safety of thrombopoietin (TPO) mimetics for patients with MDS.
Search methods
We searched for randomised controlled trials in the Cochrane Central Register of Controlled Trials (CENTRAL), MEDLINE (January 2000 to August 2017), trials registries (ISRCTN, EU clinical trials register and clinicaltrials.gov) and conference proceedings. We did not apply any language restrictions. Two review authors independently screened search results, disagreements were solved by discussion.
Selection criteria
We included randomised controlled trials comparing TPO mimetics with placebo, no further treatment or another TPO mimetic in patients with MDS of all risk groups, without gender, age or ethnicity restrictions. Additional chemotherapeutic treatment had to be equal in both arms.
Data collection and analysis
Two review authors independently extracted data and assessed the quality of trials, disagreements were resolved by discussion. Risk ratio (RR) was used to analyse mortality during study, transformation to AML, incidence of bleeding events, transfusion requirement, all adverse events, adverse events >= grade 3, serious adverse events and platelet response. Overall survival (OS) and progression‐free survival (PFS) have been extracted as hazard ratios, but could not be pooled as results were reported in heterogenous ways. Health‐related quality of life and duration of thrombocytopenia would have been analysed as standardised mean differences, but no trial reported these outcomes.
Main results
We did not identify any trial comparing one TPO mimetic versus another. We analysed six eligible trials involving 746 adult patients. All trials were reported as randomised and double‐blind trials including male and female patients. Two trials compared TPO mimetics (romiplostim or eltrombopag) with placebo, one trial evaluated eltrombopag in addition to the hypomethylating agent azacitidine, two trials analysed romiplostim additionally to a hypomethylating agent (azacitidine or decitabine) and one trial evaluated romiplostim in addition to the immunomodulatory drug lenalidomide. There are more data on romiplostim (four included, completed, full‐text trials) than on eltrombopag (two trials included: one full‐text publication, one abstract publication). Due to small sample sizes and imbalances in baseline characteristics in three trials and premature termination of two studies, we judged the potential risk of bias of all included trials as high.
Due to heterogenous reporting, we were not able to pool data for OS. Instead of that, we analysed mortality during study. There is little or no evidence for a difference in mortality during study for thrombopoietin mimetics compared to placebo (RR 0.97, 95% confidence interval (CI) 0.73 to 1.27, N = 6 trials, 746 patients, low‐quality evidence). It is unclear whether the use of TPO mimetics induces an acceleration of transformation to AML (RR 1.02, 95% CI 0.59 to 1.77, N = 5 trials, 372 patients, very low‐quality evidence).Thrombopoietin mimetics probably improve the incidence of all bleeding events (RR 0.92, 95% CI 0.86 to 0.99, N = 5 trials, 390 patients, moderate‐quality evidence). This means that in the study population, 713 out of 1000 in the placebo arm will have a bleeding event, compared to 656 of 1000 (95% CI 613 to 699) in the TPO mimetics arm. There is little or no evidence for a difference that TPO mimetics significantly diminish the rate of transfusion requirement (RR 0.83, 95% CI 0.66 to 1.05, N = 4 trials, 358 patients, low‐quality evidence). No studies were found that looked at quality of life or duration of thrombocytopenia.
There is no evidence that patients given TPO mimetics suffer more all adverse events (RR 1.01, 95% CI 0.96 to 1.07, N = 5 trials, 390 patients, moderate‐quality evidence). There is uncertainty whether the number of serious adverse events decrease under therapy with TPO mimetics (RR 0.89, 95% CI 0.54 to 1.46, N = 4 trials, 356 patients, very low‐quality evidence).
We identified one ongoing study and one study marked as completed (March 2015), but without publication of results for MDS patients (only results reported for AML and MDS patients together). Both studies evaluate MDS patients receiving eltrombopag in comparison to placebo.
Authors' conclusions
No trial evaluated one TPO mimetic versus another.
Six trials including adult patients analysed one TPO mimetic versus placebo, sometimes combined with standard therapy in both arms. Given the uncertainty of the quality of evidence, meta‐analyses show that there is little or no evidence for a difference in mortality during study and premature progress to AML. However, these assumptions have to be further explored. Treatment with TPO mimetics resulted in a lower number of MDS patients suffering from bleeding events.There is no evidence for a difference between study groups regarding transfusion requirement. Enlarged sample sizes and a longer follow‐up of future trials should improve the estimate of safety and efficacy of TPO mimetics, moreover health‐related quality of life should be evaluated. As two ongoing studies currently investigate eltrombopag (one already completed, but without published results), we are awaiting results for this drug.
PICOs
Ringkasan bahasa mudah
Mimetik thrombopoietin untuk pesakit sindrom myelodysplastic
Latar belakang
Sindrom myelodysplastic (MDS) adalah kelompok penyakit stem sel hematopoetik yang menyebabkan anemia, pendarahan ataupun jangkitan akibat kekurangan sel darah periferal dan kemajuan pramatang kepada leukemia myeloid akut (AML). Pesakit terutamanya menghidap penyakit ini dalam usia lanjut. Pemindahan sumsum tulang adalah satu‐satunya pilihan yang menyembuhkan penyakit ini. Kekurangan sel platelet merupakan komplikasi yang mengancam nyawa dalam penyakit ini dan pilihan rawatan selain transfusi platelet adalah terhad. Pengenalan mimetik TPO (meningkatkan jumlah platelet dengan meniru kesan TPO manusia) dalam rawatan MDS boleh meningkatkan kepelbagaian rawatan.
Soalan ulasan
Dengan ulasan ini kami berhasrat untuk mendekati peranan mimetik TPO dalam perawatan pesakit MDS. Kami berhasrat untuk memberi tumpuan kepada pelanjutan nyawa, kematian semasa kajian, transformasi ke tahap AML, kejadian pendarahan, keperluan transfusi, kualiti hidup, kesemua kesan sampingan, dan kesan sampingan yang serius untuk meneroka kesan mimetik TPO.
Ciri‐ciri kajian
Kami mencari pangkalan data perubatan seperti Daftar Pusat Kajian Terkawal Cochrane (CENTRAL), MEDLINE, prosiding persidangan dan pendaftaran kajian (Januari 2000 hingga Ogos 2017). Tiada kajian yang menilai satu TPO mimetik (romiplostim atau eltrombopag) berbanding dengan lain. Kami mendapati lapan kajian yang layak (enam dinilai, dua yang berterusan, satu daripadanya telah selesai tetapi tanpa keputusan akhir untuk pesakit MDS) dan kami melibatkan 746 pesakit dewasa dalam ulasan kami. Kajian‐kajian adalah rawak, double‐blinded dan melibatkan romiplostim atau eltrombopag berbanding dengan plasebo. Dalam empat kajian ejen hypomethylating atau ubat imunomodulator diberikan secara gabungan dengan romiplostim atau eltrombopag. Hanya orang dewasa yang dimasukkan.
Keputusan utama
meta‐analisis terhadap pelanjutan nyawa adalah tidak mungkin, kerana data terlalu heterogenous Sebaliknya, kami menganalisis data kematian. Tiada perbezaan yang kukuh antara mimetik TPO dan plasebo dari segi mortaliti semasa kajian, transformasi ke tahap AML, keperluan transfusi, kesan sampingan yang serius. Mimetik thrombopoietin mungkin mengurangkan jumlah pesakit yang mengalami pendarahan. Dalam populasi kajian, 713 dari 1000 pesakit dalam kelompok plasebo mengalami peristiwa pendarahan berbanding 656 dari 1000 (selang keyakinan 95% (CI) 613 hingga 699) dalam kelompok mimetik TPO. Tiada kajian yang menilai kualiti kehidupan.
Kualiti bukti
Kualiti bukti untuk hasil kejadian pendarahan dan semua kejadian buruk adalah sederhana kerana risiko berat sebelah yang tinggi (saiz sampel kecil dan ketidakseimbangan dalam ciri asas dalam tiga kajian, penutupan pramatang dua kajian, pelaporan terpilih dalam satu kajian, penajaan industri). Kualiti bukti untuk hasil kematian semasa kajian dan keperluan transfusi adalah rendah, disebabkan oleh ketidaktepatan melalui beberapa kejadian dan risiko berat sebelah yang tinggi. Ia sangat rendah untuk hasil transformasi kepada AML dankesan sampingan yang serius, kerana bilangan kejadian yang sangat kecil, risiko berat sebelah dan heterogenitas di antara kajian.
Kesimpulan
Meskipun ulasan sistematik ini menunjukkan potensi manfaat mimetik TPO dari segi peristiwa pendarahan dalam pesakit dewasa yang dinilai, kajian masa depan harus menumpu kepada aspek keselamatan, keberkesanan dan kualiti hidup dalam menilai penggunaan seharian ubat ini. Andaian pelanjutan pramatang ke AML tidak dapat disahkan dengan jelas. Oleh kerana bilangan kajian yang rendah dan saiz sampel yang kecil, ketidakpastian mengenai penemuan dalam ulasan ini wujud dan menuntut siasatan lanjut dengan lebih banyak kajian dan peserta dan tempoh tindak lanjut yang lebih lama.
Authors' conclusions
Summary of findings
| Thrombopoietin mimetics compared to placebo for patients with myelodysplastic syndromes | ||||||
| Patient or population: Adult patients with myelodysplastic syndromes and thrombocytopenia
Comparison: Placebo or placebo plus standard therapy | ||||||
| Outcomes | Anticipated absolute effects* (95% CI) | Relative effect | № of participants | Quality of the evidence | Comments | |
| Risk with placebo | Risk with Thrombopoietin mimetics | |||||
| Overall survival | see comment | see comment | 282 (2 studies) | As Platzbecker 2015 did not provide 95% CI, data could not be meta‐analysed. Giagounidis 2014: OS 58‐weeks follow up: 18% of romiplostim patients died and 20.5% of placebo patients (HR 0.86, 95% CI 0.48 to 1.56). Platzbecker 2015: median OS: 34 weeks for eltrombopag patients and 15.4 weeks for placebo‐treated patients (HR 0.70, CI not provided) | ||
| Mortality during study | Study population | RR 0.97 | 746 | ⊕⊕⊝⊝ | ||
| 249 per 1.000 | 242 per 1.000 | |||||
| Transformation to AML | Study population | RR 1.02 | 372 | ⊕⊝⊝⊝ | ||
| 110 per 1.000 | 112 per 1.000 | |||||
| Incidence of bleeding events | Study population | RR 0.92 | 390 | ⊕⊕⊕⊝ | ||
| 713 per 1.000 | 656 per 1.000 (613 to 699) | |||||
| Transfusion requirement | Study population | RR 0.83 | 358 | ⊕⊕⊝⊝ | ||
| 508 per 1.000 | 422 per 1.000 | |||||
| Health‐related quality of life | not reported | |||||
| All adverse events | Study population | RR 1.01 (0.96 to 1.07) | 390 | ⊕⊕⊕⊝ | ||
| 912 per 1.000 | 921 per 1.000 | |||||
| Serious adverse events | Study population | RR 0.89 | 356 | ⊕⊝⊝⊝ | ||
| 387 per 1.000 | 344 per 1.000 | |||||
| *The risk in the intervention group (and its 95% confidence interval) is based on the assumed risk in the comparison group and the relative effect of the intervention (and its 95% CI). | ||||||
| GRADE Working Group grades of evidence | ||||||
| 1 Small number of events (<200) resulting in downgrading 1 point due to imprecision 2 High risk of bias due to small sample sizes and imbalances in baseline characteristics in three trials, premature closure of two trials, selective reporting in one trial, and industrial sponsorship 3 Very small number of events (<50) resulting in downgrading 2 points due to imprecision 4 Heterogeneity between studies resulting in downgrading in 1 point | ||||||
Background
Description of the condition
Epidemiology of myelodysplastic syndromes (MDS)
Myelodysplastic syndromes (MDS) are a heterogeneous group of haematological diseases that are characterised by a uni‐ or multilineage dysplasia of haematological stem cells. MDS is a rare disease of the elderly population. The overall incidence of the disease is about 4 to 7 per 100,000 people, whereas 20 to 50 per 100,000 people over the age of 70 years are affected (Della Porta 2010; Greenberg 2011; Sekeres 2011b). Approximately 85% of all patients with MDS are over 60 years when first diagnosed (Goldberg 2010). In general, MDS is characterised by myeloid, erythroid or megakaryocytic dysplasia, or a combination of dysplasias, associated with ineffective haematopoiesis and a high rate of transformation to acute myeloid leukaemia (AML) in approximately 20% of patients with MDS (Nimer 2008; Vardiman 2009).
Classification of MDS
Two systems are commonly used to define haematopoietic malignancies. The French‐American‐British classification, introduced in 1976, is based on morphological and cytochemical methods (Bennett 1976). It subcategorises MDS into five entities and sets the threshold between high‐grade MDS and AML at 30% blasts in the bone marrow. The World Health Organization (WHO) classification, introduced in 1999 and revised in 2008, uses morphology and newer prognostic factors such as karyotype and clinical features to define the different entities (Harris 1999; Vardiman 2009). It distinguishes between five entities and 11 subtypes of MDS, and the threshold for the diagnosis of AML has been lowered to > 20% blasts (Harris 1999; Vardiman 2009).
Prognosis of MDS
The International Prognostic Scoring System (IPSS) is the most widely used risk assessment system to evaluate the prognosis of MDS. The tool is based on the percentage of blasts in the bone marrow, the number of cytopenias and the karyotype, and categorises newly diagnosed patients into the following four groups: low, intermediate‐1, intermediate‐2 and high risk (Greenberg 1997). These prognostic groups are associated with a median survival of 5.7 years (low risk), 3.5 years (intermediate‐1 risk), 1.2 years (intermediate‐2 risk) and 0.4 years (high risk) (Greenberg 1997).
Clinical presentation focusing on thrombocytopenia
Clinical symptoms of patients with MDS are related to the occurring cytopenias (anaemia, neutropenia (decrease in white blood cells, specifically neutrophils), and thrombocytopenia (decrease in the number of blood platelets)) that arise from the ineffective haematopoiesis. Often patients present with symptoms of anaemia such as fatigue, asthenia and dyspnoea, accompanied by infections due to neutropenia and prolonged bleeding time or bleeding events because of thrombocytopenia (Nimer 2008).
In 2007 Kantarjian and colleagues performed a systematic review to summarise the available information regarding the incidence and impact of thrombocytopenia in patients with MDS. It demonstrated that thrombocytopenia (defined as platelet count < 100 x 109/L) is a common clinical problem in MDS patients with a prevalence of 65% (range 23% to 93%) in untreated patients at baseline (Kantarjian 2007). An additional problem is the iatrogenically‐induced thrombocytopenia through currently available therapeutics in the treatment of MDS such as hypomethylation agents (i.e. azacitidine, decitabine), or lenalidomide (Kantarjian 2006; List 2006a). Randomised studies reported thrombocytopenia grade 3 or 4 in 70% to 74% of the patients receiving azacitidine (Fenaux 2009; Santini 2010), 85% of the patients with decitabine (Kantarjian 2006) and 54.7% of the patients with lenalidomide (List 2006a).
The most important clinical complications caused by thrombocytopenia are bleeding events and death. The reported incidence of bleeding in MDS patients ranges from 3% to 53% (Kantarjian 2007). These bleeding complications might be less severe such as petechiae, gingival bleeding (bleeding from the gums) or haematoma, but can also be serious if gastrointestinal, intracranial, pulmonary or retinal haemorrhages occur (Dayyani 2010; Neukirchen 2009). The frequency of haemorrhagic deaths in patients with MDS ranges from 14% to 24% (Kantarjian 2007).
Description of the intervention
General treatment approaches of MDS
Patients with clinically relevant cytopenia can be stratified into two major risk groups, the relatively lower‐risk patients (IPSS: low risk, intermediate‐1‐risk) and the higher‐risk patients (IPSS: high risk, intermediate‐2‐risk) (Bowen 2003; Greenberg 2011). In lower‐risk patients with MDS, supportive care, meaning red blood or platelet transfusion, antibiotics and hematopoietic growth factors, is the main treatment option, but the administration of additional treatment with hypomethylation agents or immunosuppressive therapy might be considered (Fey 2010; Gotze 2010; Greenberg 2011; Santini 2010). Higher‐risk patients with MDS should receive allogenic stem cell transplantation (alloSCT), which is the only curative treatment for MDS patients. If they are not eligible for allogenic stem cell transplantation (due to patient's age, performance status and presence of major comorbid conditions) or lacking an available donor, there are different recommended alternatives that include hypomethylation agents, other low‐intensive chemotherapeutics and high‐intensive chemotherapy regimens, with or without autologous stem cell transplantation (Fey 2010; Gotze 2010; Greenberg 2011; Santini 2010).
Treatment options focusing on thrombocytopenia
In general, clinical practice guidelines recommend platelet transfusion to manage severe thrombocytopenia or thrombocytopenic bleeding (Fey 2010; Greenberg 2011; Santini 2010). Furthermore, aminocaproic acid or other antifibrinolytic agents may be considered for bleeding refractory to platelet transfusion or profound thrombocytopenia (Greenberg 2011).
Although platelet transfusions are effective to increase platelet counts, they are associated with a range of risks including transfusion‐related fever, allergic reactions, infections with bacteria or viruses, pulmonary disease or alloimmunisation (Kantarjian 2009; McCullough 2000; Melchert 2008). Platelet alloimmunisation occurs when a patient has formed antibodies against donor platelets. It leads to refractoriness of platelet transfusion with a significantly lower platelet count after transfusion than expected. After multiple platelet transfusions 5% to 15% of the patients become refractory (Rebulla 2005).
Alternative treatment options to platelet transfusion are limited. Clinical studies evaluated different approaches including immunosuppressive agents such as cyclosporine (Sloand 2005) and antithymocyte globulin (Deeg 2004). Due to the limited efficacy of these agents, clinical practice guidelines mention immunosuppressive therapy as a treatment option only for patients with refractory severe thrombocytopenia (Fey 2010; Greenberg 2011). Currently, thrombopoietin mimetics (i.e. romiplostim and eltrombopag) are in the focus of clinical research.
How the intervention might work
Thrombopoietin is a glycoprotein, primarily synthesised by the liver and kidney. It is the major regulator of both megakaryocytopoiesis and thrombopoiesis. After binding to the thrombopoietin receptor (that is expressed at the pluripotential stem cells, early progenitor cells, the megakaryocyte colony‐forming cells and early megakaryocyte progenitors) thrombopoietin launches a number of signal transduction processes that initiate cell proliferation, ramp up cell differentiation and stimulate an anti‐apoptotic cascade (Kaushansky 2006; Kuter 2007).
Romiplostim
Romiplostim (synonym: AMG 53) is a thrombopoietin peptide mimetic that stimulates the megakaryocytopoiesis and generates increases in platelet counts by binding to the human thrombopoietin receptor (Kuter 2009; Stasi 2010). Romiplostim is available as a lyophilised, powdery agent and is usually dissolvable in sterile water. It is syringed subcutaneously once a week at doses of 1 μg/kg to 10 μg/kg (Kantarjian 2009; Sekeres 2011a). Single intravenous or subcutaneous injections in healthy people showed a dose‐responsive platelet production with an apparently linear relationship between platelet response and dose and a peak platelet count on days 12 to 16 without clinically significant adverse events (Wang 2004).
Small non‐randomised trials examining the administration of romiplostim in thrombocytopenic patients with lower‐risk MDS have shown platelet responses (defined as eight consecutive weeks independent of platelet transfusions) in 46% to 57% of participants (Kantarjian 2009; Sekeres 2011a). However, treatment‐related serious adverse events such as osteonecrosis, febrile neutropenia, thrombocytopenia and blast cell count increase were reported in five of 44 patients (11%) (Kantarjian 2009). Furthermore, the European Medicines Agency recommended the use of romiplostim for the treatment of patients with MDS only in clinical trials, because cases of transient increases in blast cell counts were observed and cases of MDS disease progression to AML were reported (EMEA 2011). In addition, thromboembolic complications (i.e. portal vein thrombosis) have been reported in patients with chronic liver disease receiving romiplostim (AMGEN 2011).
Eltrombopag
Eltrombopag, a non‐peptide mimetic, also activates the thrombopoietin receptor by binding to it (Kuter 2007; Stasi 2010). It is available as an orally administered drug, available as 25 mg, 50 mg or 75 mg tablets and should be taken daily and continuously on an empty stomach (Kuter 2007; Stasi 2010). In healthy volunteers receiving eltrombopag for 10 days at doses of 5 mg, 10 mg, 25 mg, 30 mg, 50 mg and 75 mg platelet counts increased in a dose‐dependent manner. There were no differences in the incidence or severity of adverse events between eltrombopag and placebo (Jenkins 2007).
So far, the effects of eltrombopag have only been researched on bone marrow mononuclear cells from patients with MDS and AML, healthy participants or laboratory animals in preclinical or phase I studies (Jenkins 2007). Ex vivo trials show that eltrombopag increases megakaryocytopoiesis in bone marrow mononuclear cells and does not influence the proliferation of malignant blasts. Adverse effects like headache, abdominal pain, sore throat and tiredness were not dose‐related and did not differ among treatment groups (Jenkins 2007; Will 2009).
Romiplostim and eltrombopag, experiences from their use in chronic idiopathic thrombocytopenic purpura (ITP)
Thrombopoietin mimetics (i.e. romiplostim and eltrombopag) have been approved for clinical use by the US Food and Drug Administration (FDA) for the treatment of chronic idiopathic thrombocytopenic purpura (ITP) (Ikeda 2009). A Cochrane review investigating the use of romiplostim and eltrombopag for chronic ITP was published in 2011 by Zeng and colleagues (Zeng 2011). It included six trials with 808 patients (five studies compared thrombopoietin mimetics with placebo). Overall survival (OS) was not studied by these randomised controlled trials and despite significantly increased platelet response, there was no evidence to demonstrate that thrombopoietin mimetics compared to placebo or standard care improved significant bleeding events in chronic ITP. In summary, there is currently no evidence that supports the efficiency of these substances compared to placebo or other treatment options in patients with chronic ITP (Zeng 2011).
Why it is important to do this review
Thrombocytopenia is a common clinical problem in patients with MDS and alternative treatment options to platelet transfusion are limited. Thrombopoietin mimetics (i.e. romiplostim and eltrombopag) currently, are the focus of clinical research (e.g. Greenberg 2009; Kantarjian 2010a; Lyons 2009). They have been tested in MDS patients with thrombocytopenia and might be an effective treatment option for MDS patients (Jenkins 2007; Kantarjian 2009; Sekeres 2011a). Nevertheless, the evidence of clinical efficacy of romiplostim and eltrombopag has not been assessed systematically. It is still uncertain whether thrombopoietin (TPO) mimetics can induce a meaningful clinical benefit in patients with MDS. Furthermore, it remains unclear whether they influence the increase of blast cells leading to premature progression to AML (EMEA 2011; Kantarjian 2009).
As far as we know at this stage one systematic review has been published, investigating safety and efficacy of thrombopoietin‐receptor (TPO‐R) agonists in MDS patients (Prica 2014). We are aiming to obtain more evidence regarding the clinical benefit (overall survival (OS), progression‐free survival (PFS), quality of life) and the therapy‐related risks (treatment‐related mortality, adverse events), by systematically analysing the reliability and validity of the data and by considering only randomised controlled trials for our review.
Objectives
To evaluate the efficacy and safety of thrombopoietin (TPO) mimetics for patients with myelodysplastic syndromes (MDS).
Methods
Criteria for considering studies for this review
Types of studies
We considered only randomised controlled trials as primary studies in this review and meta‐analysis. We included both full‐text and abstract publications. Randomisation is the best way to prevent systematic differences between baseline characteristics of participants between the two relevant intervention groups in terms of both known and unknown (or unmeasured) confounders (O'Connor 2011). We did not include cross‐over studies or quasi‐randomised trials.
Types of participants
Participants had to be diagnosed with MDS. We included studies concerning all risk groups, without gender, age or ethnicity restrictions. If trials consisted of patients with different haematological malignancies, we only used data from the MDS subgroup. If subgroup data for MDS patients were not provided after contacting the author of the trial, we excluded the trial if less than 80% of patients had MDS.
Types of interventions
We considered the following interventions:
-
Experimental intervention: Thrombopoietin (TPO) mimetics
-
Comparator intervention:
-
Placebo or no treatment
-
Another TPO mimetic
-
We considered the following comparisons:
-
TPO mimetic versus placebo or no treatment in MDS patients with thrombocytopenia
-
TPO mimetic 1 versus TPO mimetic 2 in MDS patients with thrombocytopenia
-
TPO mimetic versus placebo or no treatment in patients with MDS (thrombocytopenia is not described as an inclusion criteria of the study)
-
TPO mimetic 1 versus TPO mimetic 2 in patients with MDS (thrombocytopenia is not described as an inclusion criteria of the study)
We included trials comparing different dosages or time schedules of TPO mimetics.
We evaluated only the first comparison as we identified only trials randomising thrombocytopenic patients to TPO mimetics or placebo.
Additional chemotherapeutic treatment had to be equal in both arms except for the use of TPO mimetics.
Types of outcome measures
Primary outcomes
-
Overall survival (OS), defined as the time interval from random treatment assignment/entry into the study to death from any cause or to last follow‐up.
-
Mortality during study
Secondary outcomes
We assessed the following secondary outcomes for all considered comparisons.
-
Transformation to acute myeloid leukaemia (AML)
-
Incidence of minor bleedings (analysed as incidence of bleeding events)
-
Incidence of major bleedings (analysed as incidence of bleeding events)
-
Transfusion requirement
-
Health‐related quality of life was summarised, if available and measured with reliable and valid instruments. In the case that different questionnaires were used, we reviewed the concept of measurement of these instruments to compare, and if possible meta‐analyse, their content
-
Adverse events (i.e. all adverse events of World Health Organization (WHO) grade III or IV; serious adverse events)
-
Tumour control outcomes such as time to progression (e.g. progression‐free survival (PFS) (defined as time from randomisation to first evidence of progressive disease or death), or similar outcomes)
We assessed the following secondary outcome only in trials that included thrombocytopenic patients with MDS.
-
Platelet responses (we aimed to extract the increase of thrombocytes by at least 30,000/mm3 or transfusion independence)
We would have assessed the following secondary outcomes in trials that included patients with MDS (thrombocytopenia was not described as an inclusion criteria of the study), but did not identify any of these trials.
-
Incidence of thrombocytopenia
-
Duration of thrombocytopenia
Search methods for identification of studies
Electronic searches
We adapted search strategies from those suggested in the Cochrane Handbook for Systematic Reviews of Interventions (Lefebvre 2011). No language restriction was applied to reduce the language bias.
We searched the following databases of medical literature and started the search in 2000, as the intervention of interest (thrombopoietin mimetics) was mentioned the first time in 2000, in a trial in dogs (Case 2000):
-
Cochrane Central Register of Controlled Trials (CENTRAL), the Cochrane Library 2017, Issue 7 (Appendix 1).
-
MEDLINE (2000 to 01 August 2017) (Appendix 2)
Searching other resources
We searched the following conference proceedings from January 2000 to May 2017, if they were not included in CENTRAL.
-
American Society of Hematology (ASH)
-
American Society of Clinical Oncology (ASCO)
-
European Hematology Association (EHA)
-
European Society of Medical Oncology (ESMO)
We electronically searched in the database of ongoing trials up to 05 May 2017.
-
ISRCTN: http://www.isrctn.com
-
EU clinical trials register: https://www.clinicaltrialsregister.eu/ctr‐search/search
-
Clinicaltrials.gov: https://clinicaltrials.gov/
In addition, we looked for studies in reference lists of relevant publications and at the European Group for Bone and Marrow Transplantation (available at: http://www.ebmt.org/).
Data collection and analysis
Selection of studies
After the first review of all titles and abstracts of the identified studies from the above sources, two review authors independently rejected all studies that were clearly ineligible. We assessed selected studies by using an eligibility form regarding study design and compliance with inclusion criteria. The forms contained the following questions.
-
Was the study described as randomised?
-
Were the participants previously untreated?
-
Were the patients diagnosed with MDS?
-
Were the patients in the intervention group treated with TPO mimetics?
-
Were the patients in the control group treated with placebo or no treatment or with a TPO mimetic?
In case of doubt we included full‐text analysis and discussed eligibility with both review authors to finalise a decision (preferably including studies rather than losing relevant data). According to PRISMA we used a flow diagram to show numbers of identified records, excluded articles and included studies (Figure 1) (Moher 2009).

Study flow diagram.
Data extraction and management
Two review authors (HD, NS) independently extracted data according to Chapter Seven of the Cochrane Handbook for Systematic Reviews of Interventions (Higgins 2011b) by using a standardised data extraction form containing the following items.
-
General information: Author, title, source, publication date, country, language, duplicate publications.
-
Quality assessments: Sequence generation, allocation concealment, blinding (participants personnel outcome assessors), incomplete outcome data, selective outcome reporting, other sources of bias.
-
Study characteristics: Trial design, aims, setting and dates, source of participants, inclusion/exclusion criteria, comparability of groups, subgroup analysis, statistical methods, power calculations, treatment cross‐overs, compliance with assigned treatment, length of follow‐up, time point of randomisation.
-
Participant characteristics: Age; gender; number of participants recruited, allocated, evaluated; participants lost to follow‐up; stage of disease; type of International Prognostic Scoring System (IPSS); type of MDS.
-
Interventions: TPO mimetics (treatment and control arm), best supportive care (treatment and control arm).
-
Outcomes: OS, mortality, transformation to AML, transfusion requirements, incidence of minor bleedings, incidence of major bleedings, adverse events (i.e. all adverse events of WHO grade III or IV; serious adverse events), health‐related quality of life, platelet responses, tumour control outcomes such as time to progression (e.g. progression‐free survival, event‐free survival or disease‐free survival), incidence of thrombocytopenia, duration of thrombocytopenia.
Assessment of risk of bias in included studies
To assess the methodological quality and the risk of bias we used a questionnaire according to the recommendations in Chapter Eight of the Cochrane Handbook for Systematic Reviews of Interventions for the following criteria (Higgins 2011c).
-
Sequence generation
-
Allocation concealment
-
Blinding (participants, personnel, outcome assessors)
-
Incomplete outcome data
-
Selective outcome reporting
-
Other sources of bias
The judgement of the review authors involved an answer for each criterion, based on a three‐point scale (low risk of bias, high risk of bias or unclear) and a summary description.
Measures of treatment effect
For binary outcomes we calculated risk ratios (RR) with 95% confidence intervals (CIs) for each trial. We planned to calculate continuous outcomes as standardised mean difference (SMD), but no trial reported specific outcomes. For time‐to‐event outcomes we extracted the hazard ratio (HR) from published data according to Parmar 1998 and Tierney 2007.
Dealing with missing data
As suggested in Chapter 16 of the Cochrane Handbook for Systematic Reviews of Interventions (Higgins 2011a), there were many potential sources of missing data that had to be taken into account: at study level, at outcome level, at summary data level, at individual level and at study‐level characteristics (e.g. for subgroups analysis). It was important to differentiate between "missing at random" and "not missing at random".
If data were assumed to be missing at random, we analysed only the available data (i.e. ignoring the missing data).
In the case data were assumed not to be missing at random, we imputed the missing data with replacement values, and treated these as if they were observed (e.g. last observation carried forward, imputing an assumed outcome such as assuming all were poor outcomes, imputing the mean, imputing based on predicted values from a regression analysis).
Assessment of heterogeneity
We assessed heterogeneity of treatment effects between trials by using a Chi2 test with a significance level at P < 0.1. We used the I2 statistic to quantify possible heterogeneity (30% < I2 < 75%: moderate heterogeneity, 75% < I2: considerable heterogeneity) (Deeks 2011).
We accomplished subgroups by tests for interaction.
Assessment of reporting biases
As we did not conduct meta‐analyses with at least 10 trials, we were not able to explore the potential publication bias by generating a funnel plot. In future updates we will test potential publication bias with a linear regression test and considering P < 0.1 as significant for this test (Sterne 2011).
Data synthesis
We performed analyses according to the recommendations of Chapter Nine of the Cochrane Handbook for Systematic Reviews of Interventions (Deeks 2011). We used aggregated data for analysis. For statistical analysis, we entered data into the Cochrane statistical package Review Manager (RevMan) 5. One review author entered data into the software and a second review author checked it for accuracy. As the trials were heterogenous in terms of clinical characteristics (e.g. concomitant medication), we performed meta‐analyses using a random‐effects model (e.g. the generic inverse variance method for survival data outcomes and Mantel‐Haenszel method for dichotomous data outcomes). We used the fixed‐effect model in terms of sensitivity analyses.
We created a 'Summary of findings' table on absolute risks with the help of GRADE. We summarised the evidence of mortality during study, transformation to AML, incidence of bleeding events, transfusion requirement, health‐related quality of life, all adverse events, and serious adverse events in summary of findings Table for the main comparison.
Subgroup analysis and investigation of heterogeneity
We assessed heterogeneity of treatment effects between trials by using a Chi² test with a significance level at P < 0.1. We used the I² statistic to quantify possible heterogeneity. We performed subgroup analyses on the following characteristics.
-
Different types of TPO mimetics
-
Different types of additional agents (e.g. no other additional agent versus other chemotherapeutics)
-
Different types of MDS risk groups
Sensitivity analysis
We performed sensitivity analyses on the following characteristics. :
-
Fixed‐effect modelling versus random‐effects modelling
-
We performed sensitivity analysis regarding full‐text publications versus abstract only publication
Results
Description of studies
For study details please see: Included studies; Excluded studies
Results of the search
We identified 679 potentially relevant references through database searches and handsearching. Of these, we excluded 653 at the initial stage of screening because they did not fulfil our predefined inclusion criteria. We checked the remaining 26 publications for detailed evaluation. Of these, we excluded nine publications. Finally, we included six eligible trials (in 17 publications) with 812 patients in this review. A total of 746 patients entered the meta‐analysis, as 66 patients in the Platzbecker 2015 trial where analysed with AML and therefore excluded in this review.
The overall number of trials screened, identified, selected, excluded and included was documented with reasons according to PRISMA flow diagram (see Figure 1).
Included studies
We included six trials (Dickinson 2016; Giagounidis 2014; Greenberg 2013; Kantarjian 2010; Platzbecker 2015; Wang 2012) in this review. We extracted data from full‐text publications for five trials (Giagounidis 2014; Greenberg 2013; Kantarjian 2010; Platzbecker 2015; Wang 2012), one trial was published as an abstract (Dickinson 2016). All studies were published in English. We included a total of 746 MDS patients who fulfilled our predefined criteria.
Details of the methods, participants, interventions and outcome measures of individual studies are summarised in Characteristics of included studies.
Design
All studies were reported to be randomised, double‐blind and placebo‐controlled trials. Of all the included trials, four trials were two‐armed randomised controlled trials (Dickinson 2016; Giagounidis 2014; Greenberg 2013; Platzbecker 2015) and two trials were three‐armed randomised controlled trials (Kantarjian 2010; Wang 2012). With the exception of Dickinson 2016, all trials were reported to be multicentre studies.
Sample size
Sample sizes ranged from 29 patients (Greenberg 2013) to 356 patients (Dickinson 2016).
Location
Three included trials were carried out in the USA (Greenberg 2013; Kantarjian 2010; Wang 2012) and the other three trials were performed by an international study group (Dickinson 2016; Giagounidis 2014; Platzbecker 2015).
Participants
We included a total of 746 male and female patients. Of these, 236 patients were randomised to romiplostim, 227 patients were randomised to eltrombopag and 283 patients were randomised to placebo. For all trials, patients from 18 years of age and older were enrolled. The median age of participants was 68 years (range 52 to 84) (Greenberg 2013), 70 years (range 24 to 89) (Dickinson 2016), 70 years (range 61 to 77) (Giagounidis 2014), 71 (range 56 to 86) (Kantarjian 2010), 71 years (range 40 to 91) in the placebo group and 73 years (range 29 to 88) in the eltrombopag group (Platzbecker 2015) and 74 years (range 39 to 90) (Wang 2012). Four trials included low‐ and intermediate‐1 risk MDS patients (Giagounidis 2014; Greenberg 2013; Kantarjian 2010; Wang 2012), one trial included intermediate‐1, intermediate‐2 and high‐risk MDS patients (Dickinson 2016), and one trial included advanced MDS and AML patients (Platzbecker 2015). However, from this trial only patients diagnosed with MDS were included in the current review.
Interventions
Four trials analysed the thrombopoietin (TPO) mimetic romiplostim (Giagounidis 2014; Greenberg 2013; Kantarjian 2010; Wang 2012). In two trials patients received the TPO mimetic eltrombopag (Dickinson 2016; Platzbecker 2015). In two trials a dose of 750 µg romiplostim was evaluated versus placebo (Giagounidis 2014; Greenberg 2013). Two trials assessed two different dose schedules (750 µg or 500 µg) of romiplostim and were analysed as three‐armed trials with the different doses included as one arm versus placebo (Kantarjian 2010; Wang 2012). In four trials, patients concurrently received the hypomethylating agents azacitidine (Dickinson 2016; Kantarjian 2010) or decitabine (Greenberg 2013) or the immunomodulatory drug lenalidomide (Wang 2012). The duration of studies ranged from four 28‐day cycles (Dickinson 2016; Greenberg 2013; Kantarjian 2010; Wang 2012), six months (Platzbecker 2015) to > 58 weeks (Giagounidis 2014). No trial drew a comparison between two different kinds of TPO mimetics.
Primary outcome measure
We elaborated overall survival (OS) in two trials (Giagounidis 2014; Platzbecker 2015), however as Platzbecker 2015 did not report 95% confidence intervals (CIs), data could not be meta‐analysed.
Due to absence of applicable data referring to OS we used "mortality during study" as a new primary outcome. This outcome was reported by all trials.
Secondary outcome measures
Transformation to AML was reported in five studies (Giagounidis 2014; Greenberg 2013; Kantarjian 2010; Platzbecker 2015; Wang 2012). Data with regard to minor and major bleeding events were summarised as incidence of bleeding events and reported by five trials as follows: all bleeding events (Giagounidis 2014, Greenberg 2013; Kantarjian 2010; Wang 2012) and grade >= three haemorrhages (Platzbecker 2015). Four trials (Giagounidis 2014; Greenberg 2013; Kantarjian 2010; Wang 2012) assessed transfusion requirement. Progression‐free survival (PFS) was assessed by Platzbecker 2015 as median PFS in weeks. Giagounidis 2014 reported PFS as AML‐free survival. Five trials reported all adverse events (Giagounidis 2014; Greenberg 2013; Kantarjian 2010; Platzbecker 2015; Wang 2012); >= grade 3 adverse events were reported by Greenberg 2013, Kantarjian 2010, Platzbecker 2015 and Wang 2012. Four trials published data regarding serious adverse events (Giagounidis 2014; Greenberg 2013; Kantarjian 2010; Wang 2012). As platelet response was only assessed in trials that included thrombocytopenic patients with MDS, only Platzbecker 2015 provided information regarding this outcome. No trial mentioned duration of thrombocytopenia or health‐related quality of life.
Due to insufficient data or variable definition of the outcome, we only included mortality during the study, transformation to AML, transfusion requirement, incidence of bleeding events, all adverse events, adverse events >= grade 3, and serious adverse events in the meta‐analysis.
Conflict of interest
All trials disclosed their conflict of interest and were supported by the pharmaceutical industry as follows.
-
Dickinson 2016: All authors were either employee, consultant, participant in speakers´ bureau or received funding or honoraria from GlaxoSmithKline, Celgene Corporation, Janssen‐Cilag, Novartis, Astex, TEVA Pharmaceutical Industries, Pfizer or Roche
-
Giagounidis 2014: All authors were either employee, consultant, equity owner, advisory committee member or received funding or honoraria from Amgen, Alexion, Bristol Myers Squibb, GlaxoSmithKline, Celgene, Roche, Janssen Cilag or Celgene Corp.
-
Greenberg 2013: five of eight authors were either employee, spokesman, consultant, equity owner, advisory committee member or received funding from Novartis, Eisai, Genentech, Celgene or Amgen Inc..
-
Kantarjian 2010: All authors were either employee, consultant or advisor of Amgen.
-
Platzbecker 2015: 10 of 11 authors were either advisory board member, employee, consultant or received funding or honoraria from Amgen, GlaxoSmithKline, Novartis or were participants in speakers´ bureau for Astellas Pharma, Bayer, Boehringer Ingelheim, Bristol‐Myers Squibb, Covidien, GlaxoSmithKline, Hospira, Leo Pharma andNovartis.
-
Wang 2012: All authors were either employee, spokesman, consultant, equity owner or received funding or honoraria from GlaxoSmithKline, Johnson&Johnson, Celgene or Amgen Inc.
Excluded studies
A total of six studies (eight articles) were excluded after detailed evaluation of full‐text publications. The main reasons for exclusion were:
-
one review
-
six publications of non‐randomised controlled trials
-
one study included patients with different haematological malignancies; data from the MDS subgroup were not reported
For information on excluded trials see Characteristics of excluded studies, where reasons for the exclusion are listed.
Ongoing studies (one already completed awaiting final results)
Currently there are two ongoing trials.
NCT01440374 is a three‐part (part 1: open‐label, part 2: randomised, double‐blind, part 3: extension) worldwide, multicentre study, also sponsored by GlaxoSmithKline. It started in September 2011 and finally included 162 patients. Participants with MDS or AML who have thrombocytopenia due to bone marrow insufficiency from their underlying disease or prior chemotherapy have been enrolled. In part 2 of this study; MDS patients were randomised to receive eltrombopag in comparison to placebo. Study completion date was September 2015, but no final results for MDS patients have been published, only data for AML and MDS patients together.
Oliva 2017 is a phase II, multicentre, prospective, placebo‐controlled single‐blind study. An interim report based on data of 90 patients has been reported, 174 patients will be included in this trial. Eligible participants receive eltrombopag in comparison to placebo; study completion is planned for 2019.
Detailed information regarding these trials is summarised under Characteristics of ongoing studies.
Risk of bias in included studies
Overall the potential risk of bias of included trials is high. The judgement is graphically summarised in Figure 2 and Figure 3. For more information see risk of bias table of included trials in Characteristics of included studies.

'Risk of bias' graph: review authors' judgements about each risk of bias item presented as percentages across all included studies.

'Risk of bias' summary: review authors' judgements about each risk of bias item for each included study.
Allocation
Four trials (Giagounidis 2014; Greenberg 2013; Platzbecker 2015; Wang 2012) reported allocation concealment using an interactive voice response system (IVRS) for randomisation. We supposed that Kantarjian 2010 also used IVRS for randomisation as it is part A of the Greenberg 2013 trial. We judged allocation concealment for these trials as low risk. As Dickinson 2016 provided insufficient data according allocation we judged this study to have an unclear risk. For all included trials sequence generation was judged to be low risk.
Blinding
All trials reported to be double‐blind, but provided insufficient information regarding this item. Nevertheless, we judged the risk of performance bias for these trials as low risk as we assume it was adequate.
Incomplete outcome data
There was no suggestion of incomplete outcome data in all trials. Therefore we judged low risk for all trials.
Selective reporting
Study protocols were available for all trials. All of the studies' pre‐specified primary and secondary outcomes that are of interest in the review were reported by four trials (Giagounidis 2014; Greenberg 2013; Kantarjian 2010; Wang 2012); we judged risk of selective reporting as low for these trials. Dickinson 2016 was judged as high risk for selective reporting as fewer outcomes than the protocol‐predefined outcomes have been published. We judged Platzbecker 2015 to be high risk as only a subgroup analysis for MDS patients was published as an abstract publication (this may have influenced the outcome of transformation to AML). More importantly, there has been no full report of the total MDS population.
Other potential sources of bias
Due to small sample sizes and imbalances in baseline characteristics (e.g. mismatch within arms regarding severity of the MDS disease, enrolment of patients with diverging baseline platelet counts, no individually‐adjusted TPO‐mimetic doses to bring platelets into a target range), we judged high risk in three trials (Greenberg 2013; Kantarjian 2010; Wang 2012). Giagounidis 2014 was discontinued earlier due to concerns regarding the potential for transient increases in blast cell counts and the risk for progression to or treatment for AML. Therefore, we also judged this trial to be at high risk. As the Dickinson 2016 trial was prematurely stopped, because outcomes crossed the predefined futility threshold and for safety reasons we also judged high risk of bias for this item. We did not identify other risk of bias for the Platzbecker 2015 trial, therefore we judge as low risk of potential bias.
All trials were funded by the pharmaceutical industry.
Effects of interventions
We did not identify any trial evaluating one thrombopoietin (TPO) mimetic versus another. The following results are for the comparison of one TPO mimetic versus placebo or in addition to standard therapy compared to standard therapy only. All trials included thrombocytopenic patients, therefore all trials were analysed in one meta‐analysis.
Primary outcome: Overall survival (OS)
Data of overall survival (OS) were available from Giagounidis 2014 and Platzbecker 2015 with a total of 282 (TPO mimetic/placebo: 185/97) patients. This outcome was defined as OS within a predefined period (Giagounidis 2014) and as OS in weeks (Platzbecker 2015).
In Giagounidis 2014, OS was assessed during the 58‐week study period and included the time to follow‐up for participants who discontinued the study drug earlier. There was no evidence for a difference between treatment groups with 18% of romiplostim patients dying and 20.5% of placebo patients (hazard ratio (HR) 0.86, 95% confidence interval (CI) 0.48 to 1.56).
Platzbecker 2015 reported a median OS of 34 weeks for eltrombopag‐treated patients in comparison to 15.4 weeks for placebo‐treated. The HR was 0.70 without evidence for a difference (P = 0.38). As Platzbecker 2015 did not provide 95% CI, data could not be meta‐analysed.
Subgroup and sensitivity analysis were not performed, because the identified studies were not meta‐analysed.
Primary outcome: Mortality during study
All trials released information regarding mortality during study with a total of 746 (TPO mimetic/placebo: 433/313) patients.
With regards to mortality during study, there is little or no evidence for a difference in the pooled analysis (RR 0.97, 95% CI 0.73 to 1.27, P = 0.80; six trials, 746 patients; low‐quality evidence; Analysis 1.1; Figure 4). The same is true for the subgroup analysis for different types of TPO mimetic, different types of additional agents and different types of MDS risk groups (Analysis 1.3; Analysis 1.4; Analysis 1.5). By comparing fixed‐effect modelling (FE) versus random‐effects modelling (RE) in the sensitivity analysis, there was also no evidence for a difference between both models (Analysis 1.2).

Forest plot of comparison: 1 Thrombopoietin mimetics versus placebo, outcome: 1.1 Mortality during study ‐ all.
In the original analysis from June 2011, Giagounidis 2014 reported that 18% of patients in the romiplostim and 20.5% of patients in the placebo group died (HR 0.86, 95% CI 0.48 to 1.56). These data were used for the meta‐analysis on mortality during the study. The trial was discontinued early, due to a potentially increased risk of AML caused by romiplostim. We did not use the long‐term follow‐up data as the patients did not receive the study drug any longer during this period.
Greenberg 2013 documented the death of three patients. One death caused by neutropenic sepsis was considered to be related to the hypomethylating agent decitabine. Kantarjian 2010 mentioned two patients who died in the placebo group from fungal pneumonia and from endocarditis. Platzbecker 2015 provided information regarding five eltrombopag‐treated and six placebo‐treated patients dying on therapy or < 30 days from the last drug administration. There were 57 cases of death (32%) in the eltrombopag arm and 51 cases of death (29%) in the placebo arm in Dickinson 2016. Within 30 days after end of treatment, 33 events of death (19%) were reported in the eltrombopag group and 29 events of death (16%) were reported in the placebo group. More than 10% of all deaths were caused by diseases under study treatment and sepsis. In Wang 2012, one patient in the 750 µg romiplostim group died of intestinal obstruction in the extension period without any relation to romiplostim treatment.
Secondary outcome: Transformation to Acute myeloid leukaemia (AML)
Data regarding transformation to AML were available from five trials (Giagounidis 2014; Greenberg 2013; Kantarjian 2010; Platzbecker 2015; Wang 2012) with a total of 390 (TPO mimetic/placebo: 254/136) patients.
There was no evidence for a difference concerning transformation to AML (RR 1.02, 95% CI 0.59 to 1.77, P = 0.94; five trials, 372 patients; very low‐quality evidence; Analysis 1.7; Figure 5). There was no evidence for subgroup differences in the analyses of different types of TPO mimetics, different types of additional agents and different types of MDS risk groups (Analysis 1.9; Analysis 1.10; Analysis 1.11). By comparing fixed‐effect modelling (FE) versus random‐effects modelling (RE) in the sensitivity analysis, we could not identify any relevant difference between both models (Analysis 1.8).

Forest plot of comparison: 1 Thrombopoietin mimetics versus placebo, outcome: 1.7 Transformation to AML ‐ all.
In 2011, Giagounidis 2014 detected a non‐statistically significant increased risk of transformation to AML with HR 2.51, (95% CI 0.55 to 11.47, P = 0.23). Due to concerns of premature AML progression, these results led to early withdrawal of the study. However, two romiplostim‐treated patients with increasing peripheral blast cell counts achieved treatment for AML without having a bone marrow puncture four weeks after discontinuation of romiplostim. These patients were counted as AML‐progressed patients. In addition, in both arms there were more patients with RAEB‐1/RAEB‐2 (refractory anaemia with excess blasts) among those developing AML. Long‐term follow‐up analyses regarding this issue from 2011 were well balanced for both arms (HR 1.15, 95% CI 0.47 to 2.85). Updated follow‐up results from 2012 again presented balanced numbers of AML‐progression for both arms (HR 1.14, 95% CI 0.49 to 2.62). Finally, five‐year long‐term follow‐up from December 2016 confirmed all previous follow‐up data (HR 1.06, 95% CI 0.48 to 2.33) with 20 (11.9%) patients developing AML in the romiplostim arm and 9 (11.0%) patients developing AML in the placebo arm.
Secondary outcome: Incidence of bleeding events
We meta‐analysed data of all reporting trials with a total of 390 patients (TPO mimetic/placebo: 254/136). Analysable data with regard to bleeding events were reported by five trials as follows: all number of bleeding events (Giagounidis 2014; Greenberg 2013; Kantarjian 2010; Wang 2012) and grade >= 3 bleeding events (Platzbecker 2015).
Comparing these trials, treatment with TPO mimetics resulted in a statistically significant lower incidence of all bleeding events compared to placebo (RR 0.92, 95% CI 0.86 to 0.98, P = 0.02; Analysis 1.12; five trials, 390 patients; moderate‐quality evidence see Figure 6). There was no evidence for a difference for the subgroup analyses of different types of TPO mimetics, different types of additional agents, different MDS risk groups and grade >= grade 3 versus all bleeding events (Analysis 1.14; Analysis 1.15; Analysis 1.16; Analysis 1.17). Moreover, we could not identify any significant difference between fixed‐effect model and random‐effects model (Analysis 1.13).

Forest plot of comparison: 1 Thrombopoietin mimetics versus placebo, outcome: 1.12 Incidence of bleeding events ‐ all.
Secondary outcome: Transfusion requirement
Four trials (Giagounidis 2014; Greenberg 2013; Kantarjian 2010; Wang 2012) with a total of 358 (TPO/placebo: 236/122) patients provided informations regarding transfusion requirement.
Regarding transfusion requirement, there was no evidence for a difference between patients treated with TPO mimetic or placebo (RR 0.83, 95% CI 0.66 to 1.05, P = 0.11; four trials, 358 patients; low‐quality evidence; Analysis 1.18). There was no evidence for a difference in the subgroup analysis of different types of additional agents (Analysis 1.20) and no relevant difference between fixed‐effect and random‐effects model (Analysis 1.19).
Kantarjian 2010 reported a higher need of platelet transfusions in patients with intermediate‐2 risk (86%) in comparison to patients with low‐ or intermediate‐1 risk (38%) MDS. Unfortunately, due to missing data regarding different MDS risk groups, we had to we were unable to carry out this subgroup analysis. Subgroup analysis in terms of "different types of thrombopoietin mimetics" was also not performed, because the identified studies showed no differences or presented insufficient data regarding these study characteristics.
Secondary outcome: Health‐related quality of life
No trial provided sufficient data to interpret health‐related quality of life.
Secondary outcome: Duration of thrombocytopenia
None of the trials reported duration of thrombocytopenia.
Secondary outcome: All adverse events
Five trials with a total of 390 (TPO mimetic/placebo: 254/136) patients reported total number of patients affected by adverse events (Giagounidis 2014; Greenberg 2013; Kantarjian 2010; Platzbecker 2015; Wang 2012).
Concerning this outcome, there was no evidence for a difference (RR 1.01, 95% CI 0.96 to 1.07, P = 0.67; five trials, 390 patients; moderate‐quality evidence; Analysis 1.21). There was also no evidence for a difference in the subgroup analyses of different types of TPO mimetics, different types of additional agents and different MDS risk groups (Analysis 1.23; Analysis 1.24; Analysis 1.25) and in the sensitivity analysis (Analysis 1.22).
All adverse events reported in this trial are presented in Table 1.
| Number of patients | Placebo = 83 TPO mim. = 167 (PBO / TPO) | Placebo = 14 TPO mim. = 15 (PBO / TPO) | Placebo = 13 TPO mim. = 27 (PBO / TPO) | Placebo = 14 TPO mim. = 18 (PBO / TPO) | Placebo = 9 TPO mim. = 28 (PBO / TPO) |
| Any AE | 76 / 157 2) | 14 / 15 | 13 / 27 | 13 / 17 | 8 / 13 |
| Grade 1 AE | n. r. | 0 / 1 | n. r. | n. r. | n. r. |
| Grade 2 AE | n. r. | 3 / 4 | n. r. | n. r. | n. r. |
| Grade 3 AE | n. r. | 7 / 7 | n. r. | n. r. | 5 / 13 |
| ≥Grade 3 AE | n. r. | 1 / 2 | 2 / 1 | 8 / 13 9) | 6 / 19 |
| Grade 4 AE | n. r. | 2 / 2 | n. r. | n. r. | 1 / 6 |
| Grade 5 AE | n. r. | 2 / 1 | n. r. | n. r. | n. r. |
| Constipation | n. r. | n. r. | 5 / 14 | 2 / 5 | n. r. |
| Fatigue | n. r. | n. r. | 5 / 7 | 3 / 3 | 1 /13 |
| Dizziness | n. r. | n. r. | 1 / 6 | n. r. | n. r. |
| Headache | n. r. | n. r. | n. r. | 2 / 2 | n. r. |
| Pyrexia | n. r. | n. r. | n. r. | 6 / 5 | n. r. |
| Hypotension | n. r. | n. r. | 1 / 7 | n. r. | n. r. |
| Dyspnoea | n. r. | n. r. | 6 / 6 | n. r. | n. r. |
| Cough | n. r. | n. r. | n. r. | n. r. | n. r. |
| Peripheral oedema | n. r. | n. r. | 4 / 6 | 3 / 4 | n. r. |
| Contusion | n. r. | n. r. | 3 / 7 | n. r. | n. r. |
| Moderate thrombocytopenia | n. r. | n. r. | 4 / 2 | n. r. | 3 / 10 |
| Diarrhoea | n. r. | n. r. | 1 / 10 | 1 / 6 | 5 / 10 |
| Rash | n. r. | n. r. | 2 / 6 | n. r. | 2 / 10 |
| Rash & hypersensitivity | n. r. | n. r. | 0 / 1 | n. r. | n. r. |
| Nausea | n. r. | n. r. | 7 / 11 | 1 / 3 | 0 / 9 |
| Vomiting | n. r. | n. r. | n. r. | n. r. | n. r. |
| Decreased appetite | n. r. | n. r. | n. r. | 3 / 3 | n. r. |
| Asthenia | n. r. | n. r. | n. r. | n. r. | n. r. |
| Anorexia | n. r. | n. r. | 0 / 6 | n. r. | n. r. |
| Pain in extremity | n. r. | n. r. | 1 / 7 | n. r. | n. r. |
| IP‐related adverse event | n. r. | 3 / 5 | 4 / 14 6) | 6 / 10 | 2 / 13 |
| Serious AE | 22 / 671) | 8 / 8 | 10 / 16 | n. r. | 6 / 9 12) |
| Serious thrombocytopenia | n. r. | n. r. | n. r. | n. r. | 0 / 4 |
| Anaemia | n. r. | n. r. | 3 / 5 | 2 / 4 | 0 / 3 |
| Back pain | n. r. | n. r. | n. r. | n. r. | 0 / 2 |
| Bleeding events | 80 / 148 | 6 / 4 | 7 / 15 | 3 / 2 | 1 / 8 |
| ≥ Grade 3 bleeding events | n. r. | n. r. | 2 / 1 | 3 / 2 | n. r. |
| Pulmonary haemorrhage | n. r. | n. r. | 1 / 0 | n. r. | n. r. |
| Haematoma | n. r. | n. r. | 1 / 0 | 1 / 4 | n. r. |
| Epistaxis | n. r. | n. r. | 0 / 1 | 4 / 4 | n. r. |
| Neutropenia | n. r. | n. r. | 4 / 5 | n. r. | n. r. |
| Febrile neutropenia | n. r. | n. r. | 6 / 3 | 4 / 1 | 0 / 2 |
| Myelofibrosis | 3) | n. r. | 1 / 0 | n. r. | n. r. |
| Erythema nodosum | n. r. | n. r. | 1 / 0 | n. r. | n. r. |
| Hypokalemia | n. r. | n. r. | n. r. | n. r. | n. r. |
| Hyperkalemia | n. r. | n. r. | n. r. | n. r. | 0 / 2 |
| IP‐related SAE | n. r. | 0 / 1 | 2 / 2 7) | n. r. | 1 / 1 |
| Cerebrovascular accident | n. r. | 1 / 0 | n. r. | n. r. | 1 / 0 |
| Endocarditis | n. r. | n. r. | 1 / 0 | n. r. | n. r. |
| Worsening thrombocytopenia | n. r. | n. r. | n. r. | n. r. | 0 / 1 |
| Pulmonary artery thrombosis | n. r. | 0 / 1 4) | n. r. | n. r. | n. r. |
| Infection | n. r. | n. r. | n. r. | 3 / 1 | n. r. |
| Pneumonia | n. r. | n. r. | n. r. | 2 / 2 | n. r. |
| Fungal pneumonia | n. r. | n. r. | 1 / 0 | n. r. | n. r. |
| Neutropenic sepsis | n. r. | 1 / 0 | n. r. | n. r. | n. r. |
| Sepsis | n. r. | 0 / 1 | n. r. | 2 / 2 | n. r. |
| Deaths | 5 / 8 | 2 / 1 5) | 2 / 08) | 6 / 5 | 0 / 1 10) |
| AE leading to withdrawal or IP discontinuation | 4 / 20 | 4 / 2 | 3 / 3 | 4 / 5 | 3 / 3 11) |
Legend:AE adverse event; IP investigational product; n. r. not reported
1)Serious AE related to romiplostim: 12 patients ( increased myeloblast count, colon cancer, deep vein thrombosis, extramedullary haemopoiesis, leukocytosis, myelofibrosis, pneumonia, pyrexia, splenic infarction, transient ischaemic attack, type 2 diabetes mellitus)
2)Adverse event in both study arms: Epistaxis, hematoma, petechiae
3)Two romiplostim‐treated patients had myelofibrosis. One patient had disease progression and was reported to have grade 3 bone marrow fibrosis on day 35 of treatment. This event was reported being related to romiplostim. The second patient had a history of myelofibrosis and progressed to grade 2 bone marrow fibrosis on day 71 and grade 3 bone marrow fibrosis on day 99 of treatment. None of these event were considered related to romiplostim treatment.
4)One patient (7%) in the romiplostim group; pulmonary artery thrombosis was reported as treatment‐related serious adverse event
5)Three deaths occurred during treatment period. None was considered related to treatment, although neutropenic sepsis was considered related to decitabine. No deaths occurred during extension period. One death was reported in the romiplostim group who died from cholecystitis ≥30 days after last dose of romiplostim
6)All treatment‐related adverse events were grade 1 or 2, except for grade 3 arthralgia in one patient in the romiplostim 500 µg group and one patient with grade 3 rash in the 750 µg group.
7)Three patients had treatment‐related serious adverse events, two in the placebo group ( myelofibrosis and erythema nodosum) and one patient with grade 3 rash in the romiplostim 750 µg group.
8)One patient died from fungal pneumonia and one from endocarditis.
9)The most common ≥ grade 3 AE in the eltrombopag vs PBO groups were: febrile neutropenia (6% / 29%), anaemia (11% / 14%), pneumonia (11% / 14%) and sepsis (11% / 14%).
10)One patient in the 750µg romiplostim group died during the extension period from intestinal obstruction, which was not considered related to romiplostim.
11)Adverse events leading to study withdrawal were pancytopenia, asthenia, and cerebrovascular accident in the placebo group; pancytopenia and rash in the romiplostim 500µg group; and thrombocytopenia in the 750µg group. Only cerebrovascular accident in the placebo group was considered related to IP.
12)Only two serious AE were considered related to treatment: Cerebrovascular accident in one patient in the placebo group and worsening thrombocytopenia in one patient in the romiplostim 500µg group.
Secondary outcome: Adverse events >= grade 3
Adverse events >= grade 3 were reported by five trials (Dickinson 2016; Giagounidis 2014; Kantarjian 2010; Platzbecker 2015; Wang 2012) with a total of 494 patients (TPO mimetic/placebo: 267/227). Four trials were meta‐analysed regarding this outcome (Giagounidis 2014; Kantarjian 2010; Platzbecker 2015; Wang 2012).
The analysis of adverse events >= grade 3 showed no evidence for a difference (RR 0.98, 95% CI 0.74 to 1.31, P = 0.91;four trials, 138 patients; Analysis 1.26). All subgroup analyses and the sensitivity analysis confirmed this finding (Analysis 1.28; Analysis 1.29; Analysis 1.30; Analysis 1.27).
Dickinson 2016 reported 195 adverse events >= grade 3 in the eltrombopag arm and 137 adverse events >= grade 3 in the placebo arm. As in this trial the number of adverse event were counted, instead of the number of patients, this trial could not be added to the meta‐analysis.
Secondary outcome: Serious adverse events
Four trials including 358 patients (thrombopoietin mimetic/placebo: 236/122) reported this outcome (Giagounidis 2014; Greenberg 2013; Kantarjian 2010; Wang 2012).
Regarding serious adverse events there was no evidence for a difference between arms (RR = 0.89, 95% CI 0.54 to 1.46, P = 0.64; four trial, 356 patients; very low‐quality evidence; Analysis 1.31).
In the subgroup analysis of different types of additional agents Giagounidis 2014, the only trial solely treating with romiplostim monotherapy, showed a statistically significant advantage for the placebo arm (RR = 1.51, 95% CI 1.01 to 2.27, P = 0.04). Wang 2012, substituting a combination therapy of romiplostim and the immunomodulatory drug lenalidomide, showed a statistically significant advantage for the TPO arm (RR 0.48, 95% CI 0.24 to 0.98, P = 0.04). The test for differences between subgroups for different types of additional agents was statistically significant (P = 0.010) (Analysis 1.33). However, due to the very low number of patients included in the Wang 2012 trial, certainty in this effect estimate is very low.
Secondary outcome: Progression‐free survival (PFS)start here
Two trials with a total of 282 patients (thrombopoietin mimetic/placebo: 185/97) reported this outcome. Progression‐free survival (PFS) was reported as AML‐free survival in two different ways: Giagounidis 2014 published data about patient numbers reaching this outcome. Platzbecker 2015 defined this outcome as time span of weeks. Due to different outcome definitions this item did not undergo a meta‐analysis.
At the time of study discontinuation in February 2011 Giagounidis 2014 reported similar rates of AML‐free survival between treatment arms (HR 0.86, 95% CI 0.49 to 1.51). 33 (19.8%) of the romiplostim‐treated patients and 19 (22.9%) of placebo‐treated patients had an AML‐free survival. However, two romiplostim‐treated patients with increasing peripheral blast cell counts achieved treatment for AML without having a bone marrow puncture four weeks after discontinuation of romiplostim. These patients were counted as AML‐progressed patients. In addition, in both arms there were more patients with RAEB‐1/RAEB‐2 among those developing AML. Follow‐up results in 2012 (data beyond 58 weeks) documented a HR of 1.11 (95% CI 0.72 to 1.70) with 66 (39.5%) of the romiplostim‐treated patients and 32 (38.6%) of placebo‐treated patients. In November 2013 updated follow‐up results confirmed these results (HR 1.14, 95% CI 0.49 to 2.62). Final five‐year long‐term follow‐up data from December 2016 again reinforced the non‐impact of romiplostim on PFS (HR 1.04, 95% CI 0.73 to 1.48). Due to missing data regarding the P value we were not able to make a statement regarding statistical significance.
Platzbecker 2015 presented a median PFS of 16.1 weeks for eltrombopag patients compared to 7.7 weeks for placebo patients with a HR of 0.61. With P = 0.1531 this result was not statistically significant.
Subgroup and sensitivity analysis were not performed, because the identified studies were not meta‐analysed.
Secondary outcome: Platelet response
As mentioned in Methods, this outcome was only assessed in trials that included thrombocytopenic patients with MDS. Only one trial with a total of 32 patients (TPO mimetic/placebo: 18/14) provided information regarding this outcome (Platzbecker 2015).
Platzbecker 2015 defined this outcome as proportion of subject with baseline platelet count < 20 Gi/L and an increase to >20 Gi/L and at least 2 x baseline or a baseline platelet count ≥ 20 Gi/L and an increase to ≥50 Gi/L and at least 2x baseline at any time during treatment with study medication.
Ten out of 34 (29%) placebo‐treated patients and 18 out of 64 (28%) eltrombopag‐treated patients showed a platelet response.
As these data included both, MDS and AML patients and unfortunately results solely for MDS patients were not reported, thus these findings could not be included.
Secondary outcome: Incidence of thrombocytopenia
As thrombocytopenia represents a common symptom for MDS patients and may also occur as a drug‐induced side effect, we judged this outcome as meaningless and therefore did not analyse incidence of thrombocytopenia.
Discussion
In the context of Myelodysplastic syndromes (MDS) disease, thrombocytopenia, due to illness or iatrogenically induced, represents a potential life‐threatening condition. Thrombopoietin (TPO) mimetics like romiplostim or eltrombopag might represent a curative option to platelet transfusions, at present considered as the common treatment of thrombocytopenia. Before using these agents outside of clinical trials, it is necessary to illustrate the role and impact of TPO mimetics in the treatment of MDS patients. For that reason we performed this systematic review.
Summary of main results
Our meta‐analysis including six trials and 746 patients results in the following conclusions.
-
No meta‐analysis was performed for overall survival (OS), our primary outcome, as insufficient data were available.
-
There is little or no evidence for a difference regarding our primary outcome of mortality during study and our secondary outcomes transformation to acute myeloid leukaemia (AML, transfusion requirement, all adverse events and >= grade 3 adverse events and serious adverse events.
-
There is a statistically significance for subgroup differences for serious adverse events when comparing different types of additional agents. Serious adverse events occur more frequently in patients treated with romiplostim monotherapy in comparison to placebo. Serious adverse events were observed less frequently when TPO mimetics were combined with immunomodulatory agents. However, as the number of included patients in the trial giving immunomodulatory agents is very low, certainty of this result remains very low.
-
Treatment with TPO mimetics results in a statistically significant lower incidence of bleeding events compared to placebo.
-
Due to different outcome definitions progression‐free survival (PFS) was not meta‐analysed. Platelet response was not meta‐analysed because no MDS‐subgroup data were available.
-
None of the trials reported health‐related quality of life or duration of thrombocytopenia.
Overall completeness and applicability of evidence
Six studies, five published in full‐text publications and one published as an abstract, addressed the use of TPO mimetics for MDS patients and included adult patients between 18 and 90 years of age with IPSS low‐, intermediate‐1, intermediate‐2 risk or high‐risk MDS. Except health‐related quality of life and duration of thrombocytopenia, the included trials reported our previously specified protocol outcomes. OS and PFS were only reported in some trials, but could not be included in the meta‐analysis, due to missing data and different outcome definition. The outcome "mortality during study" was analysed as an additional primary outcome.
Due to small sample sizes (e.g. Greenberg 2013 N = 29; Kantarjian 2010 N = 40; Platzbecker 2015 N = 32; Wang 2012 N = 39;) the included studies do not have adequate power to detect small differences. Moreover, a poor information content of these trials hampered the evaluation of differences in subgroup analyses and therefore a potential heterogeneity in detail. The trials provided sufficient informations in terms of therapy‐related risks (e.g. transformation to AML, transfusion requirement, incidence of bleeding events), but adequate data on the clinical benefit (e.g. OS, AML‐free survival, health‐related quality of life) were lacking. Reported follow‐up were short for some trials: four weeks (Greenberg 2013; Wang 2012), six months (Platzbecker 2015; Kantarjian 2010), 19 months (Greenberg 2013) and five years (Giagounidis 2014). Due to the premature study closure of two studies (Dickinson 2016; Giagounidis 2014), overestimates are imaginable and publication bias might be present, but we have no evidence for this.
Currently, there is one ongoing study and one already completed trial, focusing on eltrombopag for patients with MDS. The ongoing study will be completed in 2019; the other trial was completed in 2015, but no results for MDS patients have been published yet. Both trials could help to shed light on the value of eltrombopag in the treatment of MDS patients, as this drug is under‐represented in the meta‐analysis.
Quality of the evidence
Overall, the potential risk of bias of the six included trials with 746 patients is high. All trials were reported to be randomised, double‐blinded and placebo‐controlled and a;; had a registered protocol. Five trials suggested using an interactive voice response system (IVRS) for random sequence generation. Although there was a lack of information regarding allocation concealment and blinding procedures, we did not expect any selection or performance bias. However, three trials were very small, baseline imbalances were reported for two trials. In addition, two studies were stopped prematurely, because outcomes crossed the predefined futility threshold or due to concerns regarding a transient increase in blast cell counts, and as a result the risk for a premature progression to AML. Less outcomes than protocol‐predefined were published in one trial. In summary, this could lead to selection bias and other sources of bias. All trials were sponsored by the pharmaceutical industry. Furthermore, Amgen, the manufacturer of romiplostim, funded four included trials.
The quality of evidence for the outcomes number of bleeding events and adverse events is moderate due to high risk of bias and downgraded by one point (small sample sizes and imbalances in baseline characteristics in three trials, premature closure of two trials, selective reporting in one trial). The quality of evidence for the outcomes mortality during study (measured instead of OS) and transfusion requirements is low, due to imprecision through small number of events (downgraded one point) and high risk of bias (downgraded one point). It is very low for the outcomes transformation to AML and serious adverse events, because of very small number of events (downgraded two points), high risk of bis and heterogeneity between trials (downgraded one point). Quality of life was not reported in any of the included trials.
Potential biases in the review process
To avoid potential biases within the review, only randomised controlled trials were observed and the entire processing was edited by two review authors. All conference proceedings (ASH, ASCO, EHA, ESMO) and study registries were searched until May 2017. We expect, that all appropriate studies were identified, all essential data could be acquired and the processing of this meta‐analysis did not introduce bias into this review.
As less than 10 trials were included in this meta‐analysis, we were not able to evaluate publication bias and therefore did not generate a funnel plot. By searching all relevant databases and study registries (ISRCTN, EU clinical trials register, Clinicaltrials.gov), we identified one ongoing trial with an estimated completion date in 2019 and one which has already been completed (September 2015), but without publishing results for MDS patients. This may indicate an unexciting result and hence a lack of incentive to publish, but we are awaiting further results of this trial soon.
Agreements and disagreements with other studies or reviews
Prica 2014 and colleagues analysed the value of TPO mimetics compared to placebo in patients with MDS, Desborough 2016 and colleagues evaluated alternative agents to prophylactic platelet transfusion for preventing bleeding in people with thrombocytopenia due to chronic bone marrow failure. Both reviews included five trials for the comparison TPO mimetics versus placebo for MDS patients or patients with chronic bone marrow failure. We included the same trials, but due to our updated search strategy also the trial by Dickinson 2016 and colleagues. Our results are in line with these reviews, also less bleeding events and pointing out the unclear risk of potentially more patients with transformation to AML caused by these agents. As the focus of the Desborough 2016 review was on alternative agents to platelet transfusions, they assessed different outcomes and also included patients with AML. Moreoever, the authors planned a network meta‐analysis, which they were not able to perform, due to huge inconsistency between trials.
'Risk of bias' graph: review authors' judgements about each risk of bias item presented as percentages across all included studies.
'Risk of bias' summary: review authors' judgements about each risk of bias item for each included study.
Forest plot of comparison: 1 Thrombopoietin mimetics versus placebo, outcome: 1.1 Mortality during study ‐ all.
Forest plot of comparison: 1 Thrombopoietin mimetics versus placebo, outcome: 1.7 Transformation to AML ‐ all.
Forest plot of comparison: 1 Thrombopoietin mimetics versus placebo, outcome: 1.12 Incidence of bleeding events ‐ all.

Comparison 1 Thrombopoietin mimetics versus placebo, Outcome 1 Mortality during study ‐ all.

Comparison 1 Thrombopoietin mimetics versus placebo, Outcome 2 Mortality during study ‐ all (sensitivity analysis, FE model).

Comparison 1 Thrombopoietin mimetics versus placebo, Outcome 3 Mortality during study ‐ different types of thrombopoietin mimetics.

Comparison 1 Thrombopoietin mimetics versus placebo, Outcome 4 Mortality during study ‐ different types of additional agents.

Comparison 1 Thrombopoietin mimetics versus placebo, Outcome 5 Mortality during study ‐ different types of MDS risk groups.

Comparison 1 Thrombopoietin mimetics versus placebo, Outcome 6 Mortality during study ‐ full‐text versus abstract publication.

Comparison 1 Thrombopoietin mimetics versus placebo, Outcome 7 Transformation to AML ‐ all.

Comparison 1 Thrombopoietin mimetics versus placebo, Outcome 8 Transformation to AML ‐ all (sensitivity analysis, FE model).

Comparison 1 Thrombopoietin mimetics versus placebo, Outcome 9 Transformation to AML ‐ different types of thrombopoietin mimetics.

Comparison 1 Thrombopoietin mimetics versus placebo, Outcome 10 Transformation to AML ‐ different types of additional agents.

Comparison 1 Thrombopoietin mimetics versus placebo, Outcome 11 Transformation to AML ‐ different types of MDS risk groups.

Comparison 1 Thrombopoietin mimetics versus placebo, Outcome 12 Incidence of bleeding events ‐ all.

Comparison 1 Thrombopoietin mimetics versus placebo, Outcome 13 Incidence of bleeding events ‐ all (sensitivity analysis, FE model).

Comparison 1 Thrombopoietin mimetics versus placebo, Outcome 14 Incidence of bleeding events ‐ >= grade 3 versus all bleeding events.

Comparison 1 Thrombopoietin mimetics versus placebo, Outcome 15 Incidence of bleeding events ‐ different types of thrombopoietin mimetics.

Comparison 1 Thrombopoietin mimetics versus placebo, Outcome 16 Incidence of bleeding events ‐ different types of additional agents.

Comparison 1 Thrombopoietin mimetics versus placebo, Outcome 17 Incidence of bleeding events ‐ different MDS risk groups.

Comparison 1 Thrombopoietin mimetics versus placebo, Outcome 18 Transfusion requirement ‐ all.

Comparison 1 Thrombopoietin mimetics versus placebo, Outcome 19 Transfusion requirement ‐ all (sensitivity analysis, FE model).

Comparison 1 Thrombopoietin mimetics versus placebo, Outcome 20 Transfusion requirement ‐ different types of additional agents.

Comparison 1 Thrombopoietin mimetics versus placebo, Outcome 21 All adverse events ‐ all.

Comparison 1 Thrombopoietin mimetics versus placebo, Outcome 22 All adverse events ‐ all (sensitivity analysis, FE model).

Comparison 1 Thrombopoietin mimetics versus placebo, Outcome 23 All adverse events ‐ different types of thrombopoietin mimetics.

Comparison 1 Thrombopoietin mimetics versus placebo, Outcome 24 All adverse events ‐ different types of additional agents.

Comparison 1 Thrombopoietin mimetics versus placebo, Outcome 25 All adverse events ‐ different MDS risk groups.

Comparison 1 Thrombopoietin mimetics versus placebo, Outcome 26 Adverse events >= grade 3 ‐ all.
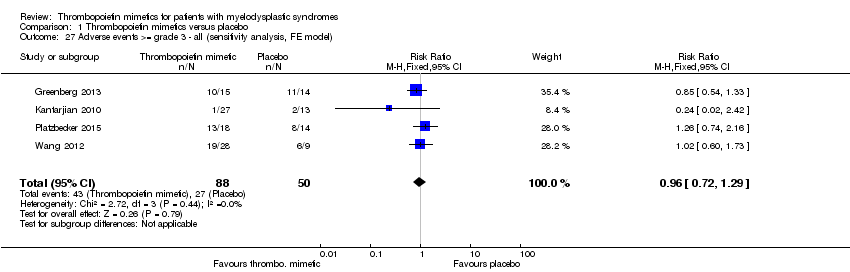
Comparison 1 Thrombopoietin mimetics versus placebo, Outcome 27 Adverse events >= grade 3 ‐ all (sensitivity analysis, FE model).

Comparison 1 Thrombopoietin mimetics versus placebo, Outcome 28 Adverse events >= grade 3 ‐ different types of thrombopoietin mimetics.

Comparison 1 Thrombopoietin mimetics versus placebo, Outcome 29 Adverse events >= grade 3 ‐ different types of additional agents.

Comparison 1 Thrombopoietin mimetics versus placebo, Outcome 30 Adverse events >= grade 3 ‐ different MDS risk groups.

Comparison 1 Thrombopoietin mimetics versus placebo, Outcome 31 Serious adverse events ‐ all.

Comparison 1 Thrombopoietin mimetics versus placebo, Outcome 32 Serious adverse events ‐ all (sensitivity analysis, FE model).

Comparison 1 Thrombopoietin mimetics versus placebo, Outcome 33 Serious adverse events ‐ different types of additional agents.
| Thrombopoietin mimetics compared to placebo for patients with myelodysplastic syndromes | ||||||
| Patient or population: Adult patients with myelodysplastic syndromes and thrombocytopenia
Comparison: Placebo or placebo plus standard therapy | ||||||
| Outcomes | Anticipated absolute effects* (95% CI) | Relative effect | № of participants | Quality of the evidence | Comments | |
| Risk with placebo | Risk with Thrombopoietin mimetics | |||||
| Overall survival | see comment | see comment | 282 (2 studies) | As Platzbecker 2015 did not provide 95% CI, data could not be meta‐analysed. Giagounidis 2014: OS 58‐weeks follow up: 18% of romiplostim patients died and 20.5% of placebo patients (HR 0.86, 95% CI 0.48 to 1.56). Platzbecker 2015: median OS: 34 weeks for eltrombopag patients and 15.4 weeks for placebo‐treated patients (HR 0.70, CI not provided) | ||
| Mortality during study | Study population | RR 0.97 | 746 | ⊕⊕⊝⊝ | ||
| 249 per 1.000 | 242 per 1.000 | |||||
| Transformation to AML | Study population | RR 1.02 | 372 | ⊕⊝⊝⊝ | ||
| 110 per 1.000 | 112 per 1.000 | |||||
| Incidence of bleeding events | Study population | RR 0.92 | 390 | ⊕⊕⊕⊝ | ||
| 713 per 1.000 | 656 per 1.000 (613 to 699) | |||||
| Transfusion requirement | Study population | RR 0.83 | 358 | ⊕⊕⊝⊝ | ||
| 508 per 1.000 | 422 per 1.000 | |||||
| Health‐related quality of life | not reported | |||||
| All adverse events | Study population | RR 1.01 (0.96 to 1.07) | 390 | ⊕⊕⊕⊝ | ||
| 912 per 1.000 | 921 per 1.000 | |||||
| Serious adverse events | Study population | RR 0.89 | 356 | ⊕⊝⊝⊝ | ||
| 387 per 1.000 | 344 per 1.000 | |||||
| *The risk in the intervention group (and its 95% confidence interval) is based on the assumed risk in the comparison group and the relative effect of the intervention (and its 95% CI). | ||||||
| GRADE Working Group grades of evidence | ||||||
| 1 Small number of events (<200) resulting in downgrading 1 point due to imprecision 2 High risk of bias due to small sample sizes and imbalances in baseline characteristics in three trials, premature closure of two trials, selective reporting in one trial, and industrial sponsorship 3 Very small number of events (<50) resulting in downgrading 2 points due to imprecision 4 Heterogeneity between studies resulting in downgrading in 1 point | ||||||
| Number of patients | Placebo = 83 TPO mim. = 167 (PBO / TPO) | Placebo = 14 TPO mim. = 15 (PBO / TPO) | Placebo = 13 TPO mim. = 27 (PBO / TPO) | Placebo = 14 TPO mim. = 18 (PBO / TPO) | Placebo = 9 TPO mim. = 28 (PBO / TPO) |
| Any AE | 76 / 157 2) | 14 / 15 | 13 / 27 | 13 / 17 | 8 / 13 |
| Grade 1 AE | n. r. | 0 / 1 | n. r. | n. r. | n. r. |
| Grade 2 AE | n. r. | 3 / 4 | n. r. | n. r. | n. r. |
| Grade 3 AE | n. r. | 7 / 7 | n. r. | n. r. | 5 / 13 |
| ≥Grade 3 AE | n. r. | 1 / 2 | 2 / 1 | 8 / 13 9) | 6 / 19 |
| Grade 4 AE | n. r. | 2 / 2 | n. r. | n. r. | 1 / 6 |
| Grade 5 AE | n. r. | 2 / 1 | n. r. | n. r. | n. r. |
| Constipation | n. r. | n. r. | 5 / 14 | 2 / 5 | n. r. |
| Fatigue | n. r. | n. r. | 5 / 7 | 3 / 3 | 1 /13 |
| Dizziness | n. r. | n. r. | 1 / 6 | n. r. | n. r. |
| Headache | n. r. | n. r. | n. r. | 2 / 2 | n. r. |
| Pyrexia | n. r. | n. r. | n. r. | 6 / 5 | n. r. |
| Hypotension | n. r. | n. r. | 1 / 7 | n. r. | n. r. |
| Dyspnoea | n. r. | n. r. | 6 / 6 | n. r. | n. r. |
| Cough | n. r. | n. r. | n. r. | n. r. | n. r. |
| Peripheral oedema | n. r. | n. r. | 4 / 6 | 3 / 4 | n. r. |
| Contusion | n. r. | n. r. | 3 / 7 | n. r. | n. r. |
| Moderate thrombocytopenia | n. r. | n. r. | 4 / 2 | n. r. | 3 / 10 |
| Diarrhoea | n. r. | n. r. | 1 / 10 | 1 / 6 | 5 / 10 |
| Rash | n. r. | n. r. | 2 / 6 | n. r. | 2 / 10 |
| Rash & hypersensitivity | n. r. | n. r. | 0 / 1 | n. r. | n. r. |
| Nausea | n. r. | n. r. | 7 / 11 | 1 / 3 | 0 / 9 |
| Vomiting | n. r. | n. r. | n. r. | n. r. | n. r. |
| Decreased appetite | n. r. | n. r. | n. r. | 3 / 3 | n. r. |
| Asthenia | n. r. | n. r. | n. r. | n. r. | n. r. |
| Anorexia | n. r. | n. r. | 0 / 6 | n. r. | n. r. |
| Pain in extremity | n. r. | n. r. | 1 / 7 | n. r. | n. r. |
| IP‐related adverse event | n. r. | 3 / 5 | 4 / 14 6) | 6 / 10 | 2 / 13 |
| Serious AE | 22 / 671) | 8 / 8 | 10 / 16 | n. r. | 6 / 9 12) |
| Serious thrombocytopenia | n. r. | n. r. | n. r. | n. r. | 0 / 4 |
| Anaemia | n. r. | n. r. | 3 / 5 | 2 / 4 | 0 / 3 |
| Back pain | n. r. | n. r. | n. r. | n. r. | 0 / 2 |
| Bleeding events | 80 / 148 | 6 / 4 | 7 / 15 | 3 / 2 | 1 / 8 |
| ≥ Grade 3 bleeding events | n. r. | n. r. | 2 / 1 | 3 / 2 | n. r. |
| Pulmonary haemorrhage | n. r. | n. r. | 1 / 0 | n. r. | n. r. |
| Haematoma | n. r. | n. r. | 1 / 0 | 1 / 4 | n. r. |
| Epistaxis | n. r. | n. r. | 0 / 1 | 4 / 4 | n. r. |
| Neutropenia | n. r. | n. r. | 4 / 5 | n. r. | n. r. |
| Febrile neutropenia | n. r. | n. r. | 6 / 3 | 4 / 1 | 0 / 2 |
| Myelofibrosis | 3) | n. r. | 1 / 0 | n. r. | n. r. |
| Erythema nodosum | n. r. | n. r. | 1 / 0 | n. r. | n. r. |
| Hypokalemia | n. r. | n. r. | n. r. | n. r. | n. r. |
| Hyperkalemia | n. r. | n. r. | n. r. | n. r. | 0 / 2 |
| IP‐related SAE | n. r. | 0 / 1 | 2 / 2 7) | n. r. | 1 / 1 |
| Cerebrovascular accident | n. r. | 1 / 0 | n. r. | n. r. | 1 / 0 |
| Endocarditis | n. r. | n. r. | 1 / 0 | n. r. | n. r. |
| Worsening thrombocytopenia | n. r. | n. r. | n. r. | n. r. | 0 / 1 |
| Pulmonary artery thrombosis | n. r. | 0 / 1 4) | n. r. | n. r. | n. r. |
| Infection | n. r. | n. r. | n. r. | 3 / 1 | n. r. |
| Pneumonia | n. r. | n. r. | n. r. | 2 / 2 | n. r. |
| Fungal pneumonia | n. r. | n. r. | 1 / 0 | n. r. | n. r. |
| Neutropenic sepsis | n. r. | 1 / 0 | n. r. | n. r. | n. r. |
| Sepsis | n. r. | 0 / 1 | n. r. | 2 / 2 | n. r. |
| Deaths | 5 / 8 | 2 / 1 5) | 2 / 08) | 6 / 5 | 0 / 1 10) |
| AE leading to withdrawal or IP discontinuation | 4 / 20 | 4 / 2 | 3 / 3 | 4 / 5 | 3 / 3 11) |
| Legend:AE adverse event; IP investigational product; n. r. not reported 1)Serious AE related to romiplostim: 12 patients ( increased myeloblast count, colon cancer, deep vein thrombosis, extramedullary haemopoiesis, leukocytosis, myelofibrosis, pneumonia, pyrexia, splenic infarction, transient ischaemic attack, type 2 diabetes mellitus) 2)Adverse event in both study arms: Epistaxis, hematoma, petechiae 3)Two romiplostim‐treated patients had myelofibrosis. One patient had disease progression and was reported to have grade 3 bone marrow fibrosis on day 35 of treatment. This event was reported being related to romiplostim. The second patient had a history of myelofibrosis and progressed to grade 2 bone marrow fibrosis on day 71 and grade 3 bone marrow fibrosis on day 99 of treatment. None of these event were considered related to romiplostim treatment. 4)One patient (7%) in the romiplostim group; pulmonary artery thrombosis was reported as treatment‐related serious adverse event 5)Three deaths occurred during treatment period. None was considered related to treatment, although neutropenic sepsis was considered related to decitabine. No deaths occurred during extension period. One death was reported in the romiplostim group who died from cholecystitis ≥30 days after last dose of romiplostim 6)All treatment‐related adverse events were grade 1 or 2, except for grade 3 arthralgia in one patient in the romiplostim 500 µg group and one patient with grade 3 rash in the 750 µg group. 7)Three patients had treatment‐related serious adverse events, two in the placebo group ( myelofibrosis and erythema nodosum) and one patient with grade 3 rash in the romiplostim 750 µg group. 8)One patient died from fungal pneumonia and one from endocarditis. 9)The most common ≥ grade 3 AE in the eltrombopag vs PBO groups were: febrile neutropenia (6% / 29%), anaemia (11% / 14%), pneumonia (11% / 14%) and sepsis (11% / 14%). 10)One patient in the 750µg romiplostim group died during the extension period from intestinal obstruction, which was not considered related to romiplostim. 11)Adverse events leading to study withdrawal were pancytopenia, asthenia, and cerebrovascular accident in the placebo group; pancytopenia and rash in the romiplostim 500µg group; and thrombocytopenia in the 750µg group. Only cerebrovascular accident in the placebo group was considered related to IP. 12)Only two serious AE were considered related to treatment: Cerebrovascular accident in one patient in the placebo group and worsening thrombocytopenia in one patient in the romiplostim 500µg group. | |||||
| Outcome or subgroup title | No. of studies | No. of participants | Statistical method | Effect size |
| 1 Mortality during study ‐ all Show forest plot | 6 | 746 | Risk Ratio (M‐H, Random, 95% CI) | 0.97 [0.73, 1.27] |
| 2 Mortality during study ‐ all (sensitivity analysis, FE model) Show forest plot | 6 | 746 | Risk Ratio (M‐H, Fixed, 95% CI) | 0.95 [0.74, 1.23] |
| 3 Mortality during study ‐ different types of thrombopoietin mimetics Show forest plot | 6 | 746 | Risk Ratio (M‐H, Random, 95% CI) | 0.97 [0.73, 1.27] |
| 3.1 Romiplostim | 4 | 358 | Risk Ratio (M‐H, Random, 95% CI) | 0.71 [0.33, 1.55] |
| 3.2 Eltrombopag | 2 | 388 | Risk Ratio (M‐H, Random, 95% CI) | 1.03 [0.73, 1.46] |
| 4 Mortality during study ‐ different types of additional agents Show forest plot | 6 | 746 | Risk Ratio (M‐H, Random, 95% CI) | 0.97 [0.73, 1.27] |
| 4.1 Thrombopoietin mimetic monotherapy | 2 | 282 | Risk Ratio (M‐H, Random, 95% CI) | 0.82 [0.51, 1.30] |
| 4.2 Plus hypomethylating agent | 3 | 425 | Risk Ratio (M‐H, Random, 95% CI) | 0.70 [0.23, 2.19] |
| 4.3 Plus immunomodulatory agent | 1 | 39 | Risk Ratio (M‐H, Random, 95% CI) | 0.0 [0.0, 0.0] |
| 5 Mortality during study ‐ different types of MDS risk groups Show forest plot | 6 | 746 | Risk Ratio (M‐H, Random, 95% CI) | 0.97 [0.73, 1.27] |
| 5.1 Low risk & intermediate‐1 risk | 4 | 358 | Risk Ratio (M‐H, Random, 95% CI) | 0.71 [0.33, 1.55] |
| 5.2 Intermediate‐2 risk and high risk | 1 | 32 | Risk Ratio (M‐H, Random, 95% CI) | 0.65 [0.25, 1.69] |
| 5.3 Mixed risk group | 1 | 356 | Risk Ratio (M‐H, Random, 95% CI) | 1.11 [0.81, 1.52] |
| 6 Mortality during study ‐ full‐text versus abstract publication Show forest plot | 6 | 746 | Risk Ratio (M‐H, Random, 95% CI) | 0.97 [0.73, 1.27] |
| 6.1 full‐text publication | 5 | 390 | Risk Ratio (M‐H, Random, 95% CI) | 0.76 [0.48, 1.20] |
| 6.2 abstract publication Mixed risk group | 1 | 356 | Risk Ratio (M‐H, Random, 95% CI) | 1.11 [0.81, 1.52] |
| 7 Transformation to AML ‐ all Show forest plot | 5 | 372 | Risk Ratio (M‐H, Random, 95% CI) | 1.02 [0.59, 1.77] |
| 8 Transformation to AML ‐ all (sensitivity analysis, FE model) Show forest plot | 5 | 372 | Risk Ratio (M‐H, Fixed, 95% CI) | 1.05 [0.59, 1.86] |
| 9 Transformation to AML ‐ different types of thrombopoietin mimetics Show forest plot | 5 | 372 | Risk Ratio (M‐H, Random, 95% CI) | 1.02 [0.59, 1.77] |
| 9.1 Romiplostim | 4 | 358 | Risk Ratio (M‐H, Random, 95% CI) | 1.08 [0.55, 2.14] |
| 9.2 Eltrombopag | 1 | 14 | Risk Ratio (M‐H, Random, 95% CI) | 0.93 [0.37, 2.33] |
| 10 Transformation to AML ‐ different types of additional agents Show forest plot | 5 | 372 | Risk Ratio (M‐H, Random, 95% CI) | 1.02 [0.59, 1.77] |
| 10.1 Thrombopoietin mimetic monotherapy | 2 | 264 | Risk Ratio (M‐H, Random, 95% CI) | 1.03 [0.58, 1.84] |
| 10.2 Plus hypomethylating agent | 2 | 69 | Risk Ratio (M‐H, Random, 95% CI) | 0.95 [0.17, 5.45] |
| 10.3 Plus immunomodulatory agent | 1 | 39 | Risk Ratio (M‐H, Random, 95% CI) | 0.0 [0.0, 0.0] |
| 11 Transformation to AML ‐ different types of MDS risk groups Show forest plot | 5 | 372 | Risk Ratio (M‐H, Random, 95% CI) | 1.02 [0.59, 1.77] |
| 11.1 Low risk & intermediate‐1 risk | 4 | 358 | Risk Ratio (M‐H, Random, 95% CI) | 1.08 [0.55, 2.14] |
| 11.2 Intermediate‐2 risk and high risk | 1 | 14 | Risk Ratio (M‐H, Random, 95% CI) | 0.93 [0.37, 2.33] |
| 12 Incidence of bleeding events ‐ all Show forest plot | 5 | 390 | Risk Ratio (M‐H, Random, 95% CI) | 0.92 [0.86, 0.98] |
| 13 Incidence of bleeding events ‐ all (sensitivity analysis, FE model) Show forest plot | 5 | 390 | Risk Ratio (M‐H, Fixed, 95% CI) | 0.93 [0.84, 1.03] |
| 14 Incidence of bleeding events ‐ >= grade 3 versus all bleeding events Show forest plot | 5 | 390 | Risk Ratio (M‐H, Random, 95% CI) | 0.92 [0.86, 0.98] |
| 14.1 All bleeding events | 4 | 358 | Risk Ratio (M‐H, Random, 95% CI) | 0.92 [0.86, 0.99] |
| 14.2 >= grade 3 bleeding events | 1 | 32 | Risk Ratio (M‐H, Random, 95% CI) | 0.52 [0.10, 2.69] |
| 15 Incidence of bleeding events ‐ different types of thrombopoietin mimetics Show forest plot | 5 | 390 | Risk Ratio (M‐H, Random, 95% CI) | 0.92 [0.86, 0.98] |
| 15.1 Romiplostim | 4 | 358 | Risk Ratio (M‐H, Random, 95% CI) | 0.92 [0.86, 0.99] |
| 15.2 Eltrombopag | 1 | 32 | Risk Ratio (M‐H, Random, 95% CI) | 0.52 [0.10, 2.69] |
| 16 Incidence of bleeding events ‐ different types of additional agents Show forest plot | 5 | 390 | Risk Ratio (M‐H, Random, 95% CI) | 0.92 [0.86, 0.98] |
| 16.1 Thrombopoietin mimetics monotherapy | 2 | 282 | Risk Ratio (M‐H, Random, 95% CI) | 0.92 [0.86, 0.98] |
| 16.2 Plus hypomethylating agent | 2 | 69 | Risk Ratio (M‐H, Random, 95% CI) | 0.91 [0.54, 1.53] |
| 16.3 Plus immunomodulatory agent | 1 | 39 | Risk Ratio (M‐H, Random, 95% CI) | 3.56 [0.50, 25.36] |
| 17 Incidence of bleeding events ‐ different MDS risk groups Show forest plot | 5 | 390 | Risk Ratio (M‐H, Random, 95% CI) | 0.92 [0.86, 0.98] |
| 17.1 Low risk & intermediate‐1 risk | 4 | 358 | Risk Ratio (M‐H, Random, 95% CI) | 0.92 [0.86, 0.99] |
| 17.2 Intermediate‐2 risk and high risk | 1 | 32 | Risk Ratio (M‐H, Random, 95% CI) | 0.52 [0.10, 2.69] |
| 18 Transfusion requirement ‐ all Show forest plot | 4 | 358 | Risk Ratio (M‐H, Random, 95% CI) | 0.83 [0.66, 1.05] |
| 19 Transfusion requirement ‐ all (sensitivity analysis, FE model) Show forest plot | 4 | 358 | Risk Ratio (M‐H, Fixed, 95% CI) | 0.84 [0.67, 1.06] |
| 20 Transfusion requirement ‐ different types of additional agents Show forest plot | 4 | 358 | Risk Ratio (M‐H, Random, 95% CI) | 0.83 [0.66, 1.05] |
| 20.1 Thrombopoietin mimetics monotherapy | 1 | 250 | Risk Ratio (M‐H, Random, 95% CI) | 0.90 [0.68, 1.18] |
| 20.2 Plus hypomethylating agent | 2 | 69 | Risk Ratio (M‐H, Random, 95% CI) | 0.67 [0.43, 1.05] |
| 20.3 Plus immunomodulatory agent | 1 | 39 | Risk Ratio (M‐H, Random, 95% CI) | 0.89 [0.33, 2.39] |
| 21 All adverse events ‐ all Show forest plot | 5 | 390 | Risk Ratio (M‐H, Random, 95% CI) | 1.01 [0.96, 1.07] |
| 22 All adverse events ‐ all (sensitivity analysis, FE model) Show forest plot | 5 | 390 | Risk Ratio (M‐H, Fixed, 95% CI) | 1.00 [0.94, 1.06] |
| 23 All adverse events ‐ different types of thrombopoietin mimetics Show forest plot | 5 | 390 | Risk Ratio (M‐H, Random, 95% CI) | 1.01 [0.96, 1.07] |
| 23.1 Romiplostim | 4 | 358 | Risk Ratio (M‐H, Random, 95% CI) | 1.01 [0.96, 1.07] |
| 23.2 Eltrombopag | 1 | 32 | Risk Ratio (M‐H, Random, 95% CI) | 1.02 [0.85, 1.22] |
| 24 All adverse events ‐ different types of additional agents Show forest plot | 5 | 390 | Risk Ratio (M‐H, Random, 95% CI) | 1.01 [0.96, 1.07] |
| 24.1 Thrombopoietin mimetics monotherapy | 2 | 282 | Risk Ratio (M‐H, Random, 95% CI) | 1.03 [0.96, 1.10] |
| 24.2 Plus hypomethylating agent | 2 | 69 | Risk Ratio (M‐H, Random, 95% CI) | 1.0 [0.92, 1.09] |
| 24.3 Plus immunomodulatory agent | 1 | 39 | Risk Ratio (M‐H, Random, 95% CI) | 0.72 [0.41, 1.26] |
| 25 All adverse events ‐ different MDS risk groups Show forest plot | 5 | 390 | Risk Ratio (M‐H, Random, 95% CI) | 1.01 [0.96, 1.07] |
| 25.1 Low risk & intermediate‐1 risk | 4 | 358 | Risk Ratio (M‐H, Random, 95% CI) | 1.01 [0.96, 1.07] |
| 25.2 Intermediate‐2 risk and high risk | 1 | 32 | Risk Ratio (M‐H, Random, 95% CI) | 1.02 [0.85, 1.22] |
| 26 Adverse events >= grade 3 ‐ all Show forest plot | 4 | 138 | Risk Ratio (M‐H, Random, 95% CI) | 0.98 [0.74, 1.31] |
| 27 Adverse events >= grade 3 ‐ all (sensitivity analysis, FE model) Show forest plot | 4 | 138 | Risk Ratio (M‐H, Fixed, 95% CI) | 0.96 [0.72, 1.29] |
| 28 Adverse events >= grade 3 ‐ different types of thrombopoietin mimetics Show forest plot | 4 | 138 | Risk Ratio (M‐H, Random, 95% CI) | 0.98 [0.74, 1.31] |
| 28.1 Romiplostim | 3 | 106 | Risk Ratio (M‐H, Random, 95% CI) | 0.89 [0.63, 1.25] |
| 28.2 Eltrombopag | 1 | 32 | Risk Ratio (M‐H, Random, 95% CI) | 1.26 [0.74, 2.16] |
| 29 Adverse events >= grade 3 ‐ different types of additional agents Show forest plot | 4 | 138 | Risk Ratio (M‐H, Random, 95% CI) | 0.98 [0.74, 1.31] |
| 29.1 Thrombopoietin mimetics monotherapy | 1 | 32 | Risk Ratio (M‐H, Random, 95% CI) | 1.26 [0.74, 2.16] |
| 29.2 Plus hypomethylating agent | 2 | 69 | Risk Ratio (M‐H, Random, 95% CI) | 0.71 [0.27, 1.82] |
| 29.3 Plus immunomodulatory agent | 1 | 37 | Risk Ratio (M‐H, Random, 95% CI) | 1.02 [0.60, 1.73] |
| 30 Adverse events >= grade 3 ‐ different MDS risk groups Show forest plot | 4 | 138 | Risk Ratio (M‐H, Random, 95% CI) | 0.98 [0.74, 1.31] |
| 30.1 Low risk & intermediate‐1 risk | 3 | 106 | Risk Ratio (M‐H, Random, 95% CI) | 0.89 [0.63, 1.25] |
| 30.2 Intermediate‐2 risk and high risk | 1 | 32 | Risk Ratio (M‐H, Random, 95% CI) | 1.26 [0.74, 2.16] |
| 31 Serious adverse events ‐ all Show forest plot | 4 | 356 | Risk Ratio (M‐H, Random, 95% CI) | 0.89 [0.54, 1.46] |
| 32 Serious adverse events ‐ all (sensitivity analysis, FE model) Show forest plot | 4 | 356 | Risk Ratio (M‐H, Fixed, 95% CI) | 1.11 [0.85, 1.45] |
| 33 Serious adverse events ‐ different types of additional agents Show forest plot | 4 | 356 | Risk Ratio (M‐H, Random, 95% CI) | 0.89 [0.54, 1.46] |
| 33.1 Thrombopoietin mimetics monotherapy | 1 | 250 | Risk Ratio (M‐H, Random, 95% CI) | 1.51 [1.01, 2.27] |
| 33.2 Plus hypomethylating agent | 2 | 69 | Risk Ratio (M‐H, Random, 95% CI) | 0.82 [0.57, 1.17] |
| 33.3 Plus immunomodulatory agent | 1 | 37 | Risk Ratio (M‐H, Random, 95% CI) | 0.48 [0.24, 0.98] |