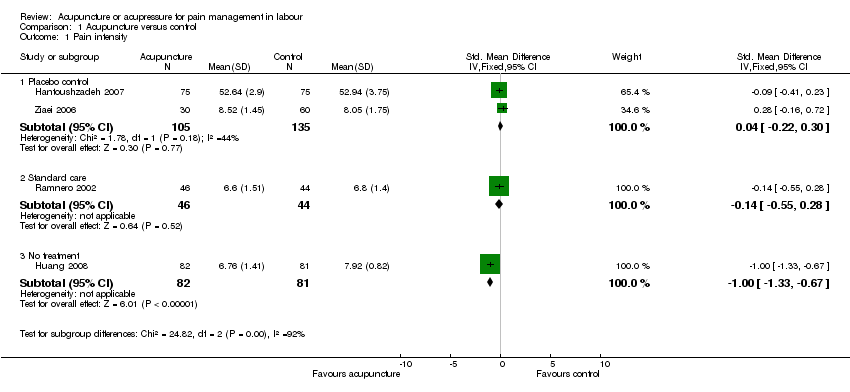
| 1 Pain intensity Show forest plot | 4 | | Std. Mean Difference (IV, Fixed, 95% CI) | Subtotals only |
|
| 1.1 Placebo control | 2 | 240 | Std. Mean Difference (IV, Fixed, 95% CI) | 0.04 [‐0.22, 0.30] |
| 1.2 Standard care | 1 | 90 | Std. Mean Difference (IV, Fixed, 95% CI) | ‐0.14 [‐0.55, 0.28] |
| 1.3 No treatment | 1 | 163 | Std. Mean Difference (IV, Fixed, 95% CI) | 1.00 [‐1.33, ‐0.67] |
| 2 Satisfaction with pain relief in labour Show forest plot | 2 | | Risk Ratio (M‐H, Fixed, 95% CI) | Subtotals only |
|
| 2.1 Placebo control | 1 | 150 | Risk Ratio (M‐H, Fixed, 95% CI) | 2.38 [1.78, 3.19] |
| 2.2 Standard care | 1 | 90 | Risk Ratio (M‐H, Fixed, 95% CI) | 1.08 [0.95, 1.22] |
| 3 Use of pharmacological analgesia Show forest plot | 5 | | Risk Ratio (M‐H, Random, 95% CI) | Subtotals only |
|
| 3.1 Placebo control | 1 | 208 | Risk Ratio (M‐H, Random, 95% CI) | 0.72 [0.58, 0.88] |
| 3.2 Standard care | 3 | 704 | Risk Ratio (M‐H, Random, 95% CI) | 0.68 [0.56, 0.83] |
| 3.3 Water injection | 1 | 128 | Risk Ratio (M‐H, Random, 95% CI) | 0.84 [0.54, 1.30] |
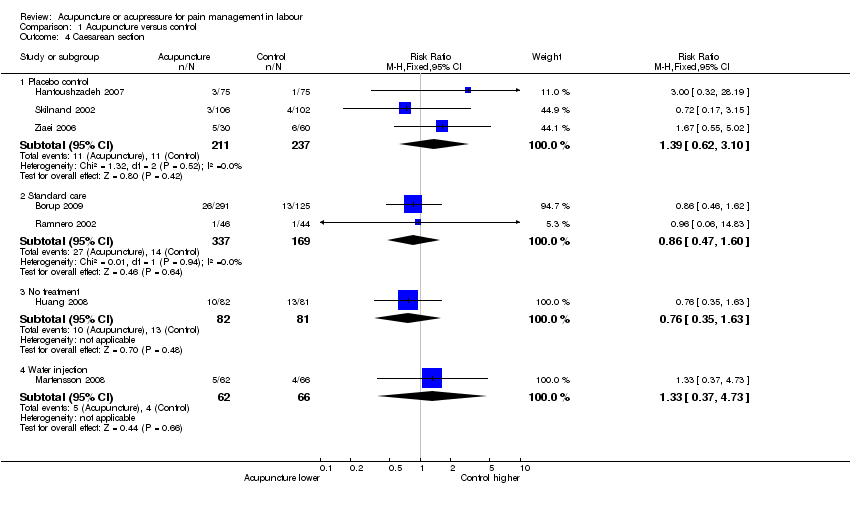
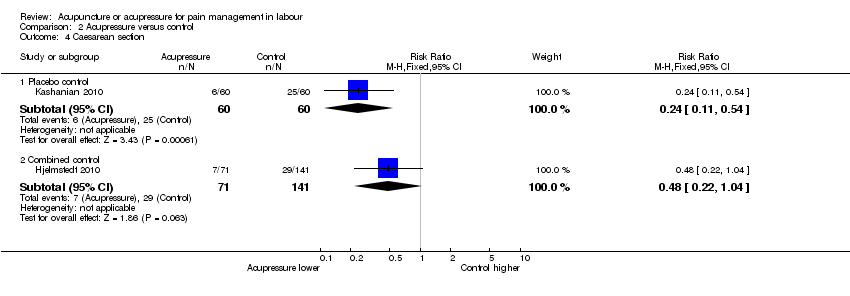
| 4 Caesarean section Show forest plot | 7 | | Risk Ratio (M‐H, Fixed, 95% CI) | Subtotals only |
|
| 4.1 Placebo control | 3 | 448 | Risk Ratio (M‐H, Fixed, 95% CI) | 1.39 [0.62, 3.10] |
| 4.2 Standard care | 2 | 506 | Risk Ratio (M‐H, Fixed, 95% CI) | 0.86 [0.47, 1.60] |
| 4.3 No treatment | 1 | 163 | Risk Ratio (M‐H, Fixed, 95% CI) | 0.76 [0.35, 1.63] |
| 4.4 Water injection | 1 | 128 | Risk Ratio (M‐H, Fixed, 95% CI) | 1.33 [0.37, 4.73] |
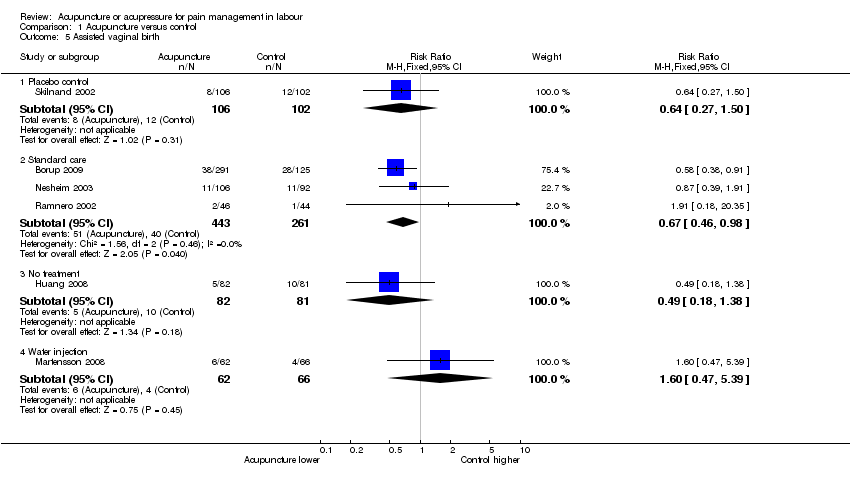
| 5 Assisted vaginal birth Show forest plot | 6 | | Risk Ratio (M‐H, Fixed, 95% CI) | Subtotals only |
|
| 5.1 Placebo control | 1 | 208 | Risk Ratio (M‐H, Fixed, 95% CI) | 0.64 [0.27, 1.50] |
| 5.2 Standard care | 3 | 704 | Risk Ratio (M‐H, Fixed, 95% CI) | 0.67 [0.46, 0.98] |
| 5.3 No treatment | 1 | 163 | Risk Ratio (M‐H, Fixed, 95% CI) | 0.49 [0.18, 1.38] |
| 5.4 Water injection | 1 | 128 | Risk Ratio (M‐H, Fixed, 95% CI) | 1.60 [0.47, 5.39] |
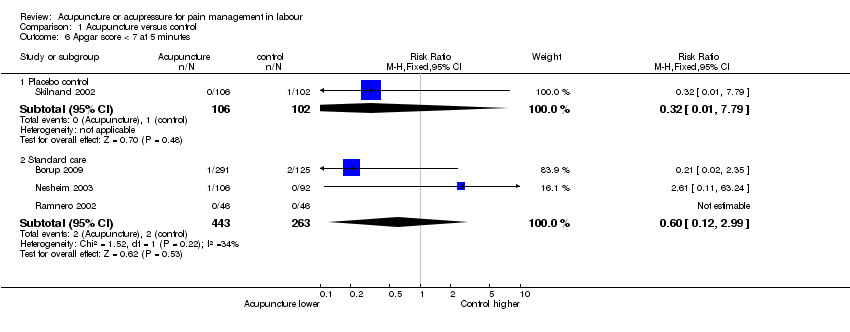
| 6 Apgar score < 7 at 5 minutes Show forest plot | 4 | | Risk Ratio (M‐H, Fixed, 95% CI) | Subtotals only |
|
| 6.1 Placebo control | 1 | 208 | Risk Ratio (M‐H, Fixed, 95% CI) | 0.32 [0.01, 7.79] |
| 6.2 Standard care | 3 | 706 | Risk Ratio (M‐H, Fixed, 95% CI) | 0.60 [0.12, 2.99] |
| 7 Spontaneous vaginal delivery Show forest plot | 3 | | Risk Ratio (M‐H, Random, 95% CI) | Subtotals only |
|
| 7.1 Placebo control | 2 | 358 | Risk Ratio (M‐H, Random, 95% CI) | 1.00 [0.87, 1.14] |
| 7.2 Standard care | 1 | 90 | Risk Ratio (M‐H, Random, 95% CI) | 0.98 [0.89, 1.08] |
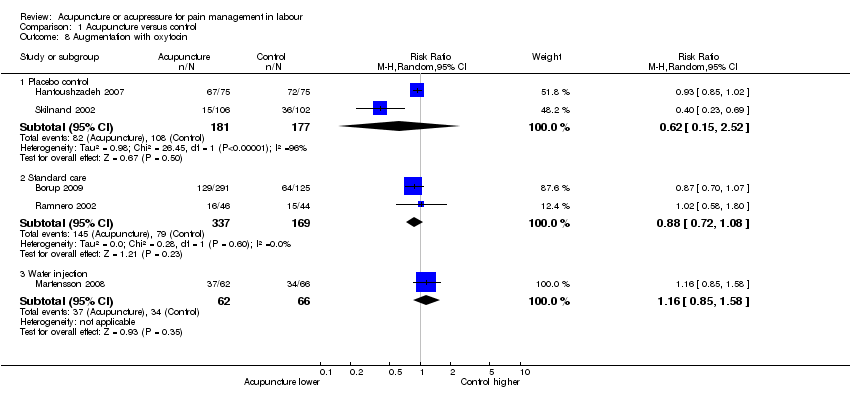
| 8 Augmentation with oxytocin Show forest plot | 5 | | Risk Ratio (M‐H, Random, 95% CI) | Subtotals only |
|
| 8.1 Placebo control | 2 | 358 | Risk Ratio (M‐H, Random, 95% CI) | 0.62 [0.15, 2.52] |
| 8.2 Standard care | 2 | 506 | Risk Ratio (M‐H, Random, 95% CI) | 0.88 [0.72, 1.08] |
| 8.3 Water injection | 1 | 128 | Risk Ratio (M‐H, Random, 95% CI) | 1.16 [0.85, 1.58] |
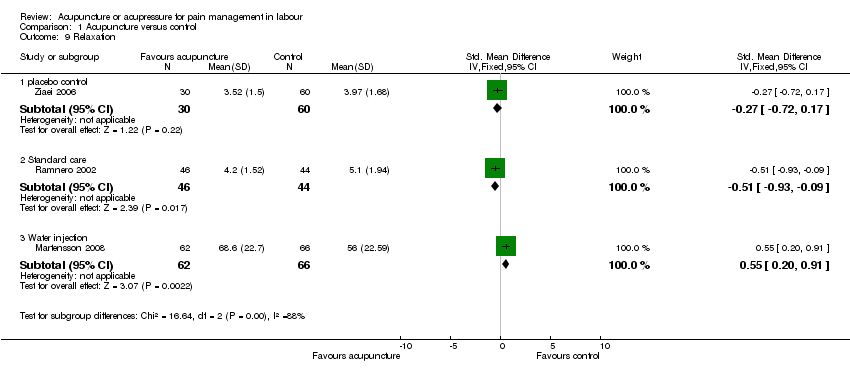
| 9 Relaxation Show forest plot | 3 | | Std. Mean Difference (IV, Fixed, 95% CI) | Subtotals only |
|
| 9.1 placebo control | 1 | 90 | Std. Mean Difference (IV, Fixed, 95% CI) | ‐0.27 [‐0.72, 0.17] |
| 9.2 Standard care | 1 | 90 | Std. Mean Difference (IV, Fixed, 95% CI) | ‐0.51 [‐0.93, ‐0.09] |
| 9.3 Water injection | 1 | 128 | Std. Mean Difference (IV, Fixed, 95% CI) | 0.55 [0.20, 0.91] |