Frecuencia de cambios de apósito para los dispositivos de acceso venoso central en las infecciones relacionadas con el catéter
Information
- DOI:
- https://doi.org/10.1002/14651858.CD009213.pub2Copy DOI

- Database:
-
- Cochrane Database of Systematic Reviews
- Version published:
-
- 01 February 2016see what's new
- Type:
-
- Intervention
- Stage:
-
- Review
- Cochrane Editorial Group:
-
Cochrane Wounds Group
- Copyright:
-
- Copyright © 2016 The Cochrane Collaboration. Published by John Wiley & Sons, Ltd.
Article metrics
Altmetric:
Cited by:
Authors
Contributions of authors
Nicole Gavin: conceived, designed and coordinated the review. Extracted data, checked the quality of the data extraction, and analysed and interpreted data. Undertook and checked quality assessment. Performed statistical analysis and checked the quality of the statistical analysis. Completed the first draft of the review. Is the guarantor of the review.
Joan Webster: extracted data, checked the quality of the data extraction, and analysed and interpreted data. Undertook and checked quality assessment. Performed part of data analysis and interpretation. Checked the quality of the statistical analysis. Performed part of writing and editing the review. Advised on the review and approved the final review before submission.
Raymond Chan: Performed part of writing and editing the review. Advised on the review and approved the final review before submission.
Claire Rickard: Performed part of writing and editing the review. Advised on the review and approved the final review before submission.
Contributions of editorial base
Nicky Cullum: edited the protocol and the review: advised on methodology, interpretation and content. Approved the final review prior to publication.
Sally Bell‐Syer: co‐ordinated the editorial process. Advised on methodology, interpretation and content. Edited the protocol and review.
Ruth Foxlee: designed the search strategy and Rocio Rodriguez‐Lopez ran the searches.
Sources of support
Internal sources
-
Cancer Care Services & Centre for Clinical Nursing (Research & Development Unit), Royal Brisbane and Women’s Hospital, Brisbane, Australia.
For funding the salary and facilities for NG to conduct this systematic review
-
Griffith University, Brisbane, Australia.
For providing the supervision to undertake this systematic review as part of Nicole Gavin's Masters of Advanced Practice (Health Care Research)
External sources
-
Australasian Cochrane Centre, Australia.
For providing two‐day workshop: Developing a Protocol for a Systematic Review and Introduction to Analysis
For providing five‐day workshop: Cochrane Review Completion and Update Program
-
NIHR/Department of Health (England), (Cochrane Wounds Group), UK.
This project was supported by the National Institute for Health Research via Cochrane Infrastructure funding to Cochrane Wounds. The views and opinions expressed herein are those of the authors and do not necessarily reflect those of the Systematic Reviews Programme, NIHR, NHS or the Department of Health.
-
Australian National Health and Medical Research Council through the Centre for Research Excellence in Nursing Interventions for Hospitalised Patients, Australia.
Nicole Gavin is supported for a PhD scholarship
Declarations of interest
Nicole C Gavin: none known
Joan Webster: none known
Raymond J Chan: none known
Claire M Rickard: Claire Rickard is a Board Member of the Australian Intensive Care Foundation. She has carried out consultancy research on IV flushing for Becton Dickinson Medical and has received grants from commercial companies supporting research projects including those on IV dressings. The granting bodies did not undertake study design, procedures, data analysis or preparation of results for publication. She has received payment from commercial companies for educational lectures based on her research, and educational grants to support her conference attendance.
Acknowledgements
The authors would like to acknowledge the contribution of peer referees: Mieke Flour, Kurinchi Gurasamy, Gill Worthy, Anneke Andriessen, Dayanithee Chetty, Donna Gillies and Gemma Villanueva and copy‐editors Jenny Bellorini and Elizabeth Royle.
Version history
| Published | Title | Stage | Authors | Version |
| 2016 Feb 01 | Frequency of dressing changes for central venous access devices on catheter‐related infections | Review | Nicole C Gavin, Joan Webster, Raymond J Chan, Claire M Rickard | |
| 2011 Jul 06 | Frequency of dressing changes for central venous access devices on catheter‐related infections | Protocol | Nicole C Gavin, Joan Webster, Raymond J Chan, Claire M Rickard | |
Differences between protocol and review
Methods; Criteria for considering studies; Types of studies
Studies with co‐intervention excluded. Co‐interventions (frequency of administration set replacement) were different between different arms of the study. Not stated in the protocol.
Methods; Data collection and analysis; Measures of treatment effect
Event rates for dichotomous outcomes are presented as risk ratio (RR) and 95% confidence interval (CI). Not stated in the protocol.
Methods; Data collection and analysis; Summary of Findings Table
Summary of Findings Tables added.
Keywords
MeSH
Medical Subject Headings (MeSH) Keywords
Medical Subject Headings Check Words
Adult; Child; Humans;
PICOs
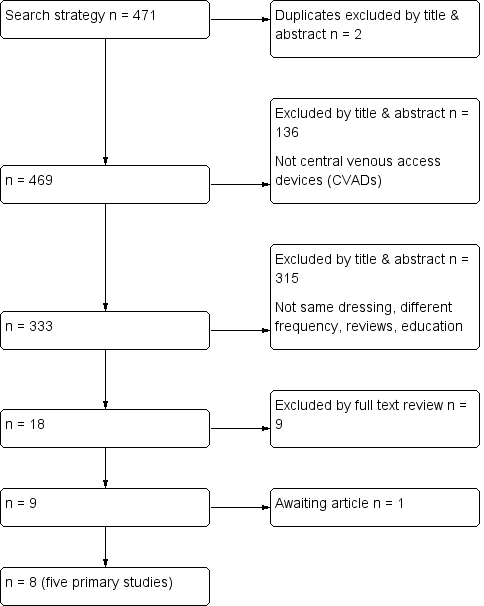
Flow diagram of included and excluded studies

Risk of bias graph: review authors' judgements about each risk of bias item presented as percentages across all included studies

Risk of bias summary: review authors' judgements about each risk of bias item for each included study
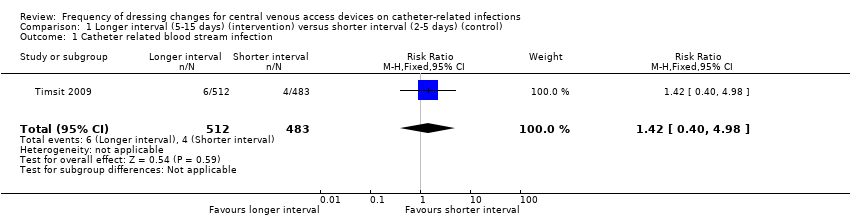
Comparison 1 Longer interval (5‐15 days) (intervention) versus shorter interval (2‐5 days) (control), Outcome 1 Catheter related blood stream infection.
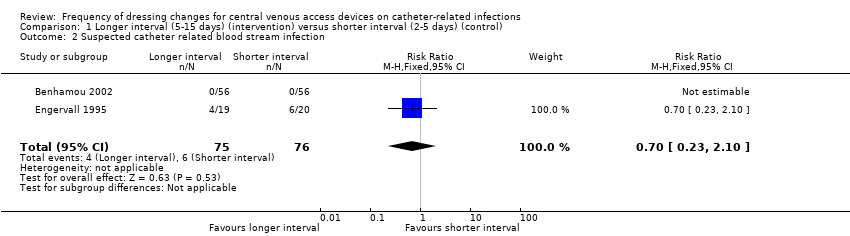
Comparison 1 Longer interval (5‐15 days) (intervention) versus shorter interval (2‐5 days) (control), Outcome 2 Suspected catheter related blood stream infection.

Comparison 1 Longer interval (5‐15 days) (intervention) versus shorter interval (2‐5 days) (control), Outcome 3 All‐cause mortality.

Comparison 1 Longer interval (5‐15 days) (intervention) versus shorter interval (2‐5 days) (control), Outcome 4 Catheter‐site infection.
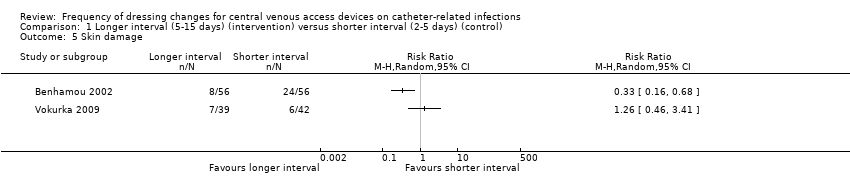
Comparison 1 Longer interval (5‐15 days) (intervention) versus shorter interval (2‐5 days) (control), Outcome 5 Skin damage.
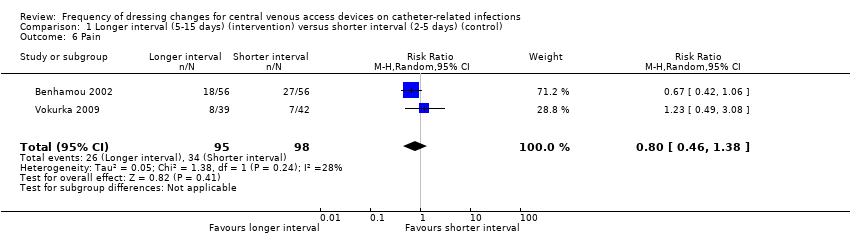
Comparison 1 Longer interval (5‐15 days) (intervention) versus shorter interval (2‐5 days) (control), Outcome 6 Pain.
| Patient or population: patients with a central venous access device | ||||||
| Outcomes | Relative effect | Anticipated absolute effects* (95% CI) | Quality of the evidence | What happens | ||
| Without longer interval (5 ‐ 15 days) | With longer interval (5 ‐ 15 days) | Difference | ||||
| Catheter‐related blood stream infection (CRBSI) | RR 1.42 | Study population | ⊕⊕⊝⊝ | Longer intervals between dressing changes may have little or no effect on catheter‐related blood stream infection | ||
| 8 per 1000 | 12 per 1000 | 4 more per 1000 | ||||
| All‐cause mortality | RR 1.06 | Study population | ⊕⊕⊝⊝ | Longer intervals between dressing changes probably have little or no effect on death from any cause | ||
| 354 per 1000 | 375 per 1000 | 21 more per 1000 | ||||
| Skin damage Follow up: unclear | Not estimable | Skin damage was reported in four studies. Two provided data but their results were not combined due to inconsistency of size and direction of the effects. One study in children found less skin damage in the longer interval group (8/56) compared with the shorter interval group (24/56). Rates of skin damage in one study in adults were similar (7/39 in longer interval versus 6/42 in shorter interval).9 | ⊕⊝⊝⊝ | It is uncertain whether longer (compared with shorter) intervals between dressing changes reduce skin damage | ||
| Pain Follow up: unclear | RR 0.80 | Study population | ⊕⊕⊝⊝ | It is uncertain whether longer (compared with shorter) intervals between dressing changes affect pain on dressing removal | ||
| 347 per 1000 | 278 per 1000 | 69 fewer per 1000 | ||||
| *The risk in the intervention group (and its 95% confidence interval) is based on the assumed risk in the comparison group and the relative effect of the intervention (and its 95% CI). | ||||||
| GRADE Working Group grades of evidence | ||||||
| 1 Downgraded for risk of bias due to lack of blinding of participants and personnel and for a probable unit of analysis error (individual participants randomised but numbers of infections reported) 2 Downgraded for serious imprecision: result consistent with a reduction in CRBSI or an almost 5 fold increase 3 Downgraded for risk of bias due to lack of blinding of participants and personnel 4 Downgraded for imprecision: result consistent with a 10% reduction in mortality or a 25% increase 5 Downgraded twice for serious risk of bias: risk of performance bias due to lack of blinding of participants and personnel; different dressings were used in response to skin damage 6 Downgraded for inconsistency: experimental and control groups were different between studies and frequency of dressing changes overlapped between longer and shorter groups 7 Downgraded for imprecision 8 Downgraded for risk of bias: blinding of outcome assessment not described 9 Data from two additional RCTs could not be extracted and used within the analysis. One study presented toxicity on a 5‐point scale and reported no differences between groups. We are unable to use the data from the fourth study due to the 2 x 2 factorial design. | ||||||
| CRBSI | Not applicable | Not applicable | Not applicable | High risk | Not applicable |
| Suspected CRBSI | High risk | High risk | Not applicable | Not applicable | Not applicable |
| All‐cause mortality | Low risk | Low risk | Not applicable | Low risk | Not applicable |
| Catheter‐site infection | High risk | High risk | High risk | High risk | High risk |
| Skin damage | High risk | Not applicable | High risk | High risk | High risk |
| Pain | HIgh risk | Not applicable | Not applicable | Not applicable | High risk |
| Quality of life | Not applicable | Not applicable | Not applicable | Not applicable | Not applicable |
| Cost | Not applicable | Not applicable | High risk | Not applicable | Not applicable |
| CRBSI | Not applicable | Not applicable | Not applicable | Low risk | Not applicable |
| Suspected CRBSI | Unclear risk | Unclear risk | Not applicable | Not applicable | Not applicable |
| All‐cause mortality | Low risk | Low risk | Not applicable | Low risk | Not applicable |
| Catheter‐site infection | Unclear risk | Unclear risk | Unclear risk | Low risk | Unclear risk |
| Skin damage | Unclear risk | Not applicable | Unclear risk | Unclear risk | Unclear risk |
| Pain | Unclear risk | Not applicable | Not applicable | Not applicable | Unclear risk |
| Quality of life | Not applicable | Not applicable | Not applicable | Not applicable | Not applicable |
| Cost | Not applicable | Not applicable | Unclear risk | Not applicable | Not applicable |
| Outcome or subgroup title | No. of studies | No. of participants | Statistical method | Effect size |
| 1 Catheter related blood stream infection Show forest plot | 1 | 995 | Risk Ratio (M‐H, Fixed, 95% CI) | 1.42 [0.40, 4.98] |
| 2 Suspected catheter related blood stream infection Show forest plot | 2 | 151 | Risk Ratio (M‐H, Fixed, 95% CI) | 0.70 [0.23, 2.10] |
| 3 All‐cause mortality Show forest plot | 3 | 896 | Risk Ratio (M‐H, Fixed, 95% CI) | 1.06 [0.90, 1.25] |
| 4 Catheter‐site infection Show forest plot | 2 | 371 | Risk Ratio (M‐H, Fixed, 95% CI) | 1.07 [0.71, 1.63] |
| 5 Skin damage Show forest plot | 2 | Risk Ratio (M‐H, Random, 95% CI) | Totals not selected | |
| 6 Pain Show forest plot | 2 | 193 | Risk Ratio (M‐H, Random, 95% CI) | 0.80 [0.46, 1.38] |