Aminosalicilatos para la inducción de remisión o respuesta en la enfermedad de Crohn
Appendices
Appendix 1. Search Strategies
MEDLINE on PUBMED was searched using the following search terms:
| #1 crohn* #2 sulphasalazine OR sulfasalazine OR salazosulphapyr* OR salazosulfapyr* OR salicylazosulphapyr* OR salicylazosulfapyr* OR salazopyrin #3 mesalamine OR mezalamine OR aminosalicylate* OR aminosalicylic acid OR 5‐aminosalicylate* OR 5‐aminosalicylic acid OR 5‐ASA #4 #2 OR #3 #5 #4 AND #1 #6 singl* OR doubl* OR tripl* OR trebl* OR blind* OR mask* OR placebo* OR single‐blind* OR double‐blind* OR triple‐blind* OR random* OR (controlled clinical) #7 #5 AND #6 |
EMBASE database was searched using the following search terms:
| #1 random$.tw. #2 factorial$.tw. #3 (crossover$ or cross over$ or cross‐over$).tw. #4 placebo$.tw. #5 single blind.mp. #6 double blind.mp. #7 triple blind.mp. #8 (singl$ adj blind$).tw. #9 (double$ adj blind$).tw. #10 (tripl$ adj blind$).tw. #11 assign$.tw. #12 allocat$.tw. #13 crossover procedure/ #14 double blind procedure/ #15 single blind procedure/ #16 triple blind procedure/ #17 randomized controlled trial/ #18 or/1‐17 #19 (exp animal/ or animal.hw. or nonhuman/) not (exp human/ or human cell/ or (human or humans).ti.) #20 #18 not #19 #21 exp salazosulfapyridine/ #22 (sulphasalazine or sulfasalazine or salazosulphapyr* or salazosulfapyr* or salicylazosulphapyr* or salicylazosulfapyr* or salazopyrin*).tw. #23 mesalamine.tw. or exp mesalazine/ #24 exp aminosalicylic acid/ #25 aminosalicylate*.tw. or exp aminosalicylic acid derivative/ or exp aminosalicylic acid/ #26 (mesalazine or aminosalicylic acid or 5‐aminosalicylate* or 5‐aminosalicylic acid or 5‐ASA or olsalazine).tw. #27 or/21‐26 #28 exp Crohn disease/ or crohn*.tw. #29 #20 and #27 and #28 |
OVID MEDLINE(R) database was searched using the following search terms:
| #1 random$.tw. #2 factorial$.tw. #3 (crossover$ or cross over$ or cross‐over$).tw. #4 placebo$.tw. #5 single blind.mp. #6 double blind.mp. #7 triple blind.mp. #8 (singl$ adj blind$).tw. #9 (double$ adj blind$).tw. #10 (tripl$ adj blind$).tw. #11 assign$.tw. #12 allocat$.tw. #13 crossover procedure/ #14 double blind procedure/ #15 single blind procedure/ #16 triple blind procedure/ #17 randomized controlled trial/ #18 or/1‐17 #19 (exp animal/ or animal.hw. or nonhuman/) not (exp human/ or human cell/ or (human or humans).ti.) #20 #18 not #19 #21 exp salazosulfapyridine/ #22 (sulphasalazine or sulfasalazine or salazosulphapyr* or salazosulfapyr* or salicylazosulphapyr* or salicylazosulfapyr* or salazopyrin*).tw. #23 mesalamine.tw. or exp mesalazine/ #24 exp aminosalicylic acid/ #25 aminosalicylate*.tw. or exp aminosalicylic acid derivative/ or exp aminosalicylic acid/ #26 (mesalazine or aminosalicylic acid or 5‐aminosalicylate* or 5‐aminosalicylic acid or 5‐ASA or olsalazine).tw. #27 or/21‐26 #28 exp Crohn disease/ or crohn*.tw. #29 #20 and #27 and #28 |
Cochrance Central Library database was searched using the following search terms:
| #1 crohn* #2 sulphasalazine or sulfasalazine or salazosulphapyr* or salazosulfapyr* or salicylazosulphapyr* or salicylazosulfapyr* #3 mesalamine or mezalamine or aminosalicylate* or aminosalicylic acid or 5‐aminosalicylate* or 5‐aminosalicylic acid or 5‐ASA #4 #2 or #3 #5 #1 and #4 |
The Cochrane IBD‐FBD Specialized Register was searched using the following terms:
| #1 (sulpha or sulfa or sala or salicyl or mesala or aminosal or 5‐aminosal or 5‐ASA or olsal).ti. #2 Crohn.ti. #3 1 and 2 |


Risk of bias summary: review authors' judgements about each risk of bias item for each included study.

Comparison 1 Sulfasalazine versus placebo, Outcome 1 Induction of remission (CDAI <150), therapeutic response (VHI decrease >=25%) or clinical improvement.
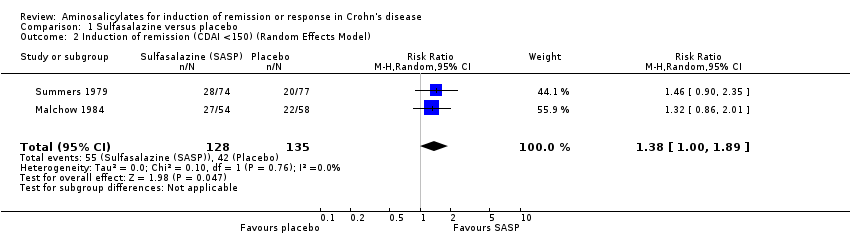
Comparison 1 Sulfasalazine versus placebo, Outcome 2 Induction of remission (CDAI <150) (Random Effects Model).
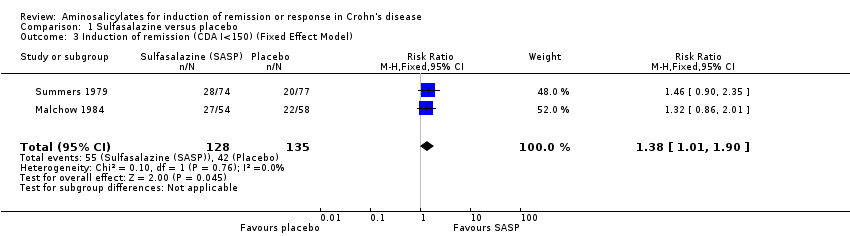
Comparison 1 Sulfasalazine versus placebo, Outcome 3 Induction of remission (CDA I<150) (Fixed Effect Model).

Comparison 1 Sulfasalazine versus placebo, Outcome 4 Adverse events.
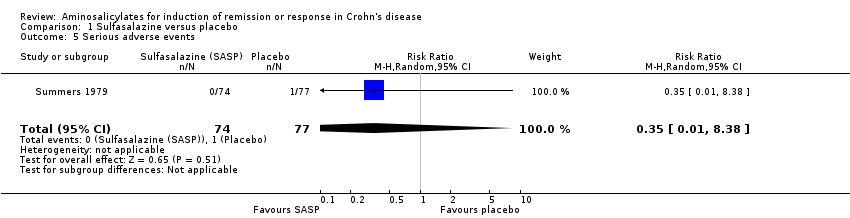
Comparison 1 Sulfasalazine versus placebo, Outcome 5 Serious adverse events.
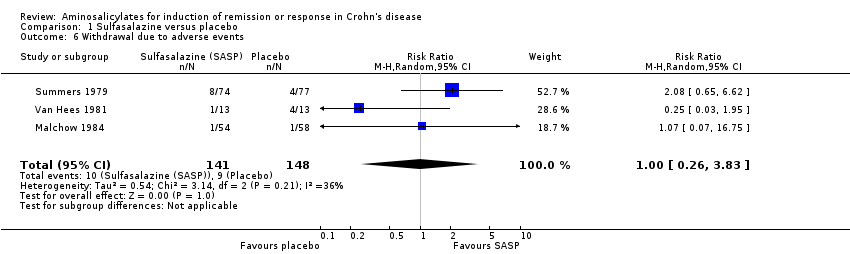
Comparison 1 Sulfasalazine versus placebo, Outcome 6 Withdrawal due to adverse events.
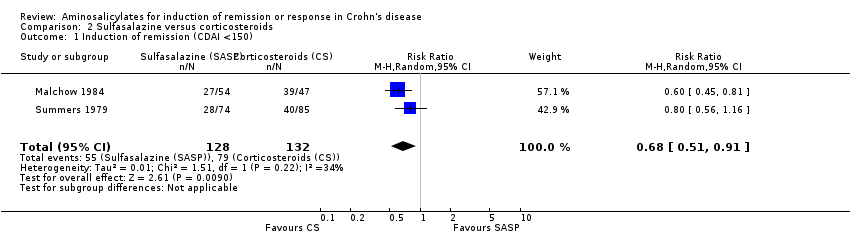
Comparison 2 Sulfasalazine versus corticosteroids, Outcome 1 Induction of remission (CDAI <150).
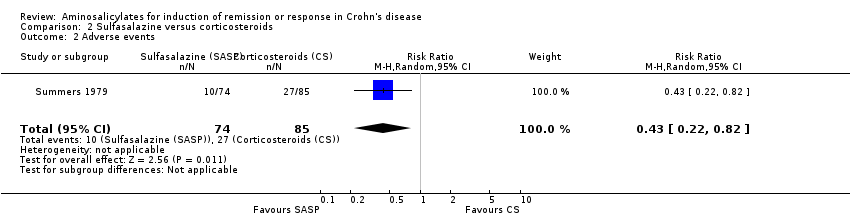
Comparison 2 Sulfasalazine versus corticosteroids, Outcome 2 Adverse events.
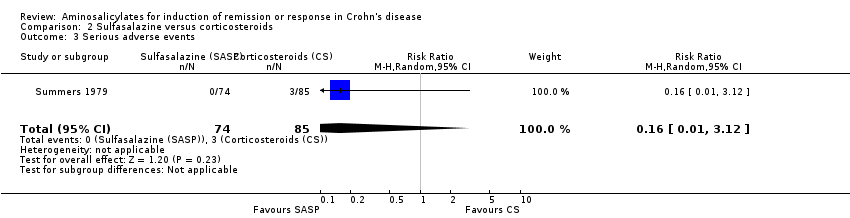
Comparison 2 Sulfasalazine versus corticosteroids, Outcome 3 Serious adverse events.

Comparison 2 Sulfasalazine versus corticosteroids, Outcome 4 Withdrawal adverse events.
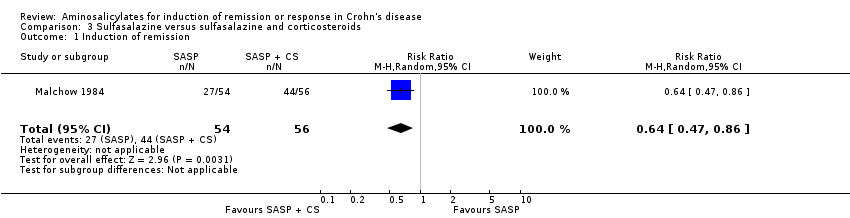
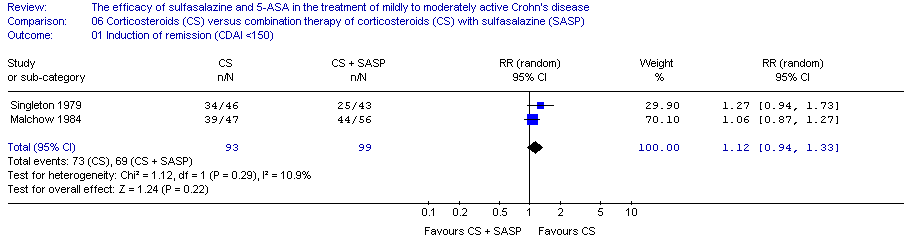
Comparison 3 Sulfasalazine versus sulfasalazine and corticosteroids, Outcome 1 Induction of remission.
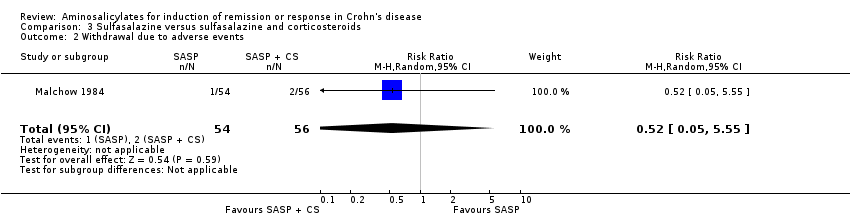
Comparison 3 Sulfasalazine versus sulfasalazine and corticosteroids, Outcome 2 Withdrawal due to adverse events.

Comparison 4 Controlled‐release mesalamine (1 ‐ 2 g/day) versus placebo, Outcome 1 Decrease in CDAI >=50, HBI >=2 or improvement/remission (as defined by Tvede et al).
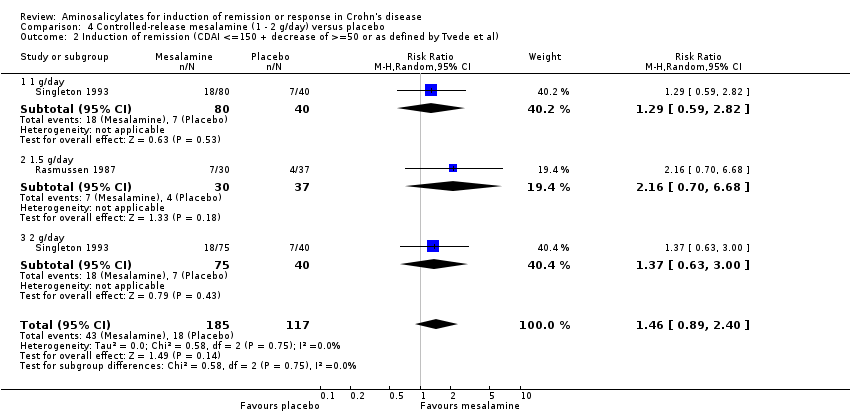
Comparison 4 Controlled‐release mesalamine (1 ‐ 2 g/day) versus placebo, Outcome 2 Induction of remission (CDAI <=150 + decrease of >=50 or as defined by Tvede et al).
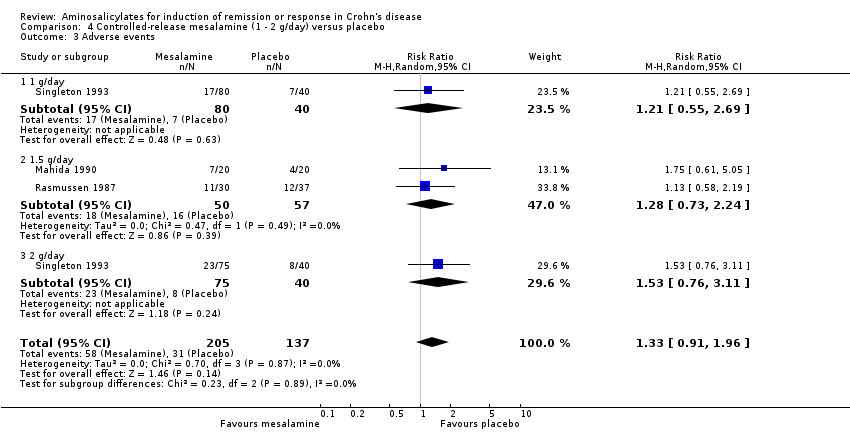
Comparison 4 Controlled‐release mesalamine (1 ‐ 2 g/day) versus placebo, Outcome 3 Adverse events.

Comparison 4 Controlled‐release mesalamine (1 ‐ 2 g/day) versus placebo, Outcome 4 Withdrawal due to adverse events.
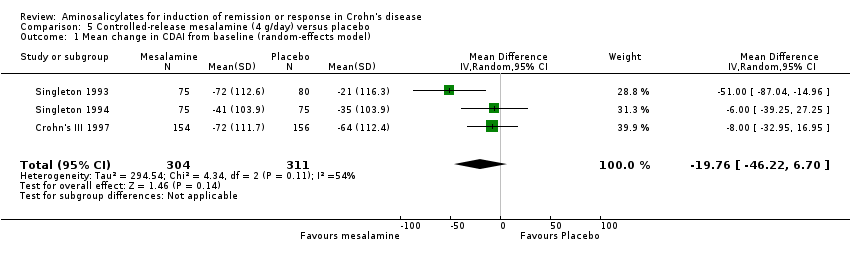
Comparison 5 Controlled‐release mesalamine (4 g/day) versus placebo, Outcome 1 Mean change in CDAI from baseline (random‐effects model).

Comparison 5 Controlled‐release mesalamine (4 g/day) versus placebo, Outcome 2 Mean change in CDAI from baseline (fixed‐effect model).

Comparison 5 Controlled‐release mesalamine (4 g/day) versus placebo, Outcome 3 Adverse events.
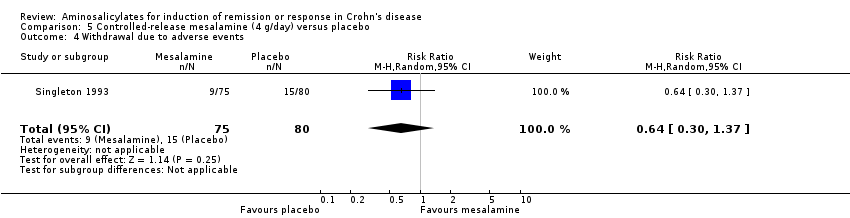
Comparison 5 Controlled‐release mesalamine (4 g/day) versus placebo, Outcome 4 Withdrawal due to adverse events.

Comparison 6 Azo‐bonded and delayed‐release mesalamine (2 ‐ 3.2 g/day) versus placebo, Outcome 1 Induction of remission or clinical improvement.
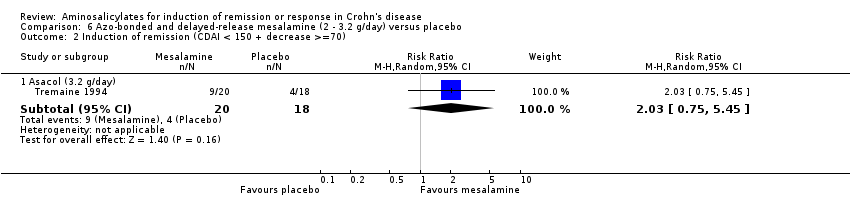
Comparison 6 Azo‐bonded and delayed‐release mesalamine (2 ‐ 3.2 g/day) versus placebo, Outcome 2 Induction of remission (CDAI < 150 + decrease >=70).

Comparison 6 Azo‐bonded and delayed‐release mesalamine (2 ‐ 3.2 g/day) versus placebo, Outcome 3 Adverse events.
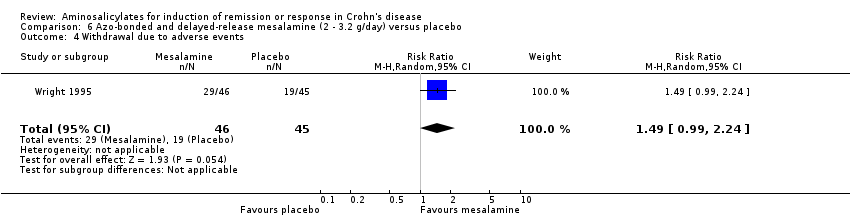
Comparison 6 Azo‐bonded and delayed‐release mesalamine (2 ‐ 3.2 g/day) versus placebo, Outcome 4 Withdrawal due to adverse events.

Comparison 7 Delayed‐release mesalamine (3 ‐ 4.5 g/day) versus corticosteroids, Outcome 1 Induction of remission (CDAI < or =150 with or without decrease of at least 60 points).
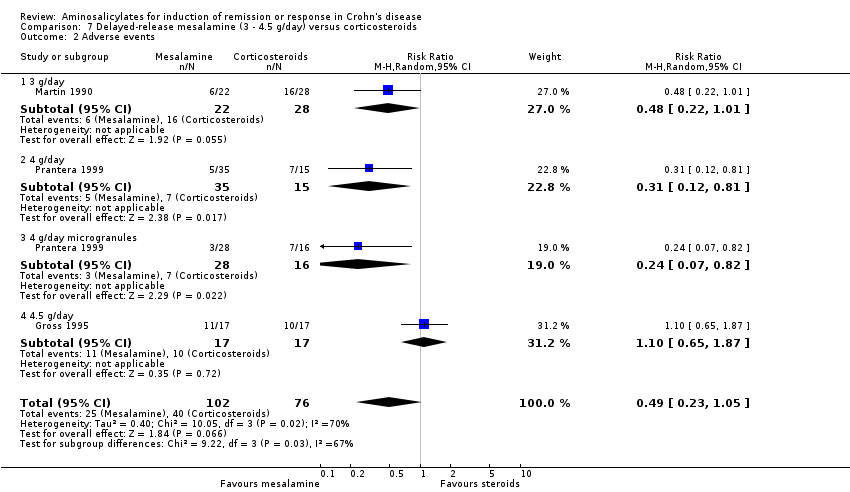
Comparison 7 Delayed‐release mesalamine (3 ‐ 4.5 g/day) versus corticosteroids, Outcome 2 Adverse events.
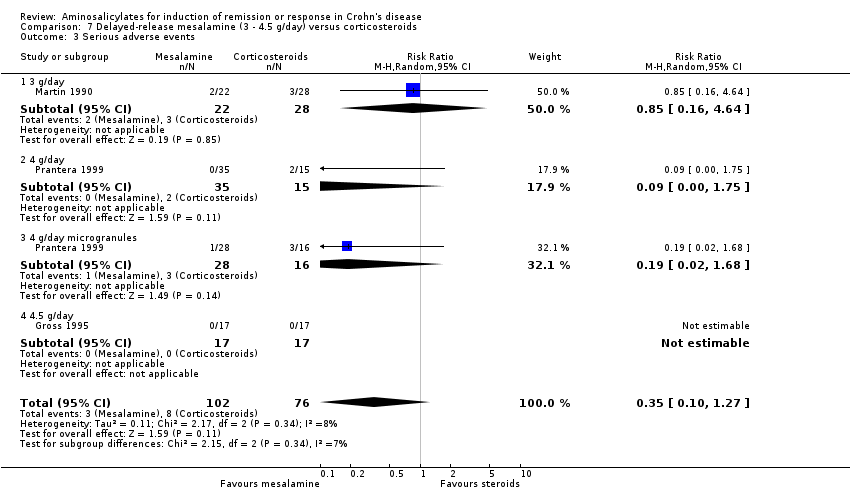
Comparison 7 Delayed‐release mesalamine (3 ‐ 4.5 g/day) versus corticosteroids, Outcome 3 Serious adverse events.

Comparison 7 Delayed‐release mesalamine (3 ‐ 4.5 g/day) versus corticosteroids, Outcome 4 Withdrawal due to adverse events.

Comparison 8 Mesalamine (4 ‐ 4.5 g/day) versus budesonide, Outcome 1 Induction of remission (CDAI < or = 150).

Comparison 8 Mesalamine (4 ‐ 4.5 g/day) versus budesonide, Outcome 2 Adverse events.

Comparison 8 Mesalamine (4 ‐ 4.5 g/day) versus budesonide, Outcome 3 Serious adverse events.
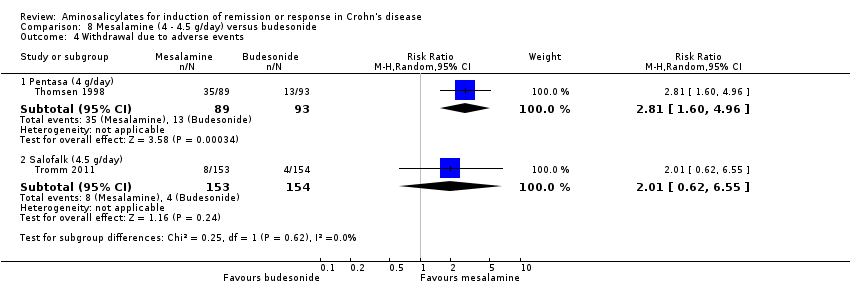
Comparison 8 Mesalamine (4 ‐ 4.5 g/day) versus budesonide, Outcome 4 Withdrawal due to adverse events.

Comparison 9 Mesalamine versus sulfasalazine (alone or in combination with corticosteroids), Outcome 1 Induction of remission (CDAI < 150) or clinical improvement.

Comparison 9 Mesalamine versus sulfasalazine (alone or in combination with corticosteroids), Outcome 2 Adverse events.
| Sulfasalazine compared to placebo for induction of remission or response in Crohn's disease | ||||||
| Patient or population: patients with induction of remission or response in Crohn's disease | ||||||
| Outcomes | Illustrative comparative risks* (95% CI) | Relative effect | No of Participants | Quality of the evidence | Comments | |
| Assumed risk | Corresponding risk | |||||
| Placebo | Sulfasalazine | |||||
| Induction of remission (CDAI <150), therapeutic response (VHI decrease >=25%) or clinical improvement | 291 per 10001 | 442 per 1000 | RR 1.52 | 289 | ⊕⊕⊝⊝ | |
| Induction of remission (CDAI <150) (Random Effects Model) | 311 per 10001 | 429 per 1000 | RR 1.38 | 263 | ⊕⊕⊕⊝ | |
| *The basis for the assumed risk (e.g. the median control group risk across studies) is provided in footnotes. The corresponding risk (and its 95% confidence interval) is based on the assumed risk in the comparison group and the relative effect of the intervention (and its 95% CI). | ||||||
| GRADE Working Group grades of evidence | ||||||
| 1 Control group risk comes from control arm of meta‐analysis, based on included trials. | ||||||
| Sulfasalazine compared to Corticosteroids for induction of remission or response in Crohn's disease | ||||||
| Patient or population: patients with induction of remission or response in Crohn's disease | ||||||
| Outcomes | Illustrative comparative risks* (95% CI) | Relative effect | No of Participants | Quality of the evidence | Comments | |
| Assumed risk | Corresponding risk | |||||
| Corticosteroids | Sulfasalazine | |||||
| Induction of remission (CDAI <150) | 598 per 10001 | 407 per 1000 | RR 0.68 | 260 | ⊕⊕⊕⊝ | |
| *The basis for the assumed risk (e.g. the median control group risk across studies) is provided in footnotes. The corresponding risk (and its 95% confidence interval) is based on the assumed risk in the comparison group and the relative effect of the intervention (and its 95% CI). | ||||||
| GRADE Working Group grades of evidence | ||||||
| 1 Control group risk comes from control arm of meta‐analysis, based on included trials. | ||||||
| Sulfasalazine compared to Sulfasalazine and corticosteroids for induction of remission or response in Crohn's disease | ||||||
| Patient or population: patients with induction of remission or response in Crohn's disease | ||||||
| Outcomes | Illustrative comparative risks* (95% CI) | Relative effect | No of Participants | Quality of the evidence | Comments | |
| Assumed risk | Corresponding risk | |||||
| Sulfasalazine and corticosteroids | Sulfasalazine | |||||
| Induction of remission | 786 per 10001 | 503 per 1000 | RR 0.64 | 110 | ⊕⊕⊕⊝ | |
| *The basis for the assumed risk (e.g. the median control group risk across studies) is provided in footnotes. The corresponding risk (and its 95% confidence interval) is based on the assumed risk in the comparison group and the relative effect of the intervention (and its 95% CI). | ||||||
| GRADE Working Group grades of evidence | ||||||
| 1 Control group risk comes from control arm of the included study | ||||||
| Controlled‐release mesalamine (1 ‐ 2 g/day) compared to Placebo for induction of remission or response in Crohn's disease | ||||||
| Patient or population: patients with induction of remission or response in Crohn's disease | ||||||
| Outcomes | Illustrative comparative risks* (95% CI) | Relative effect | No of Participants | Quality of the evidence | Comments | |
| Assumed risk | Corresponding risk | |||||
| Placebo | Controlled‐release mesalamine (1 ‐ 2 g/day) | |||||
| Decrease in CDAI >=50, HBI >=2 or improvement/remission (as defined by Tvede et al) | 350 per 10001 | 375 per 1000 | RR 1.07 | 342 | ⊕⊕⊝⊝ | |
| Induction of remission (CDAI <=150 + decrease of >=50 or as defined by Tvede et al) | 444 per 10001 | 649 per 1000 | RR 1.46 | 302 | ⊕⊕⊝⊝ | |
| *The basis for the assumed risk (e.g. the median control group risk across studies) is provided in footnotes. The corresponding risk (and its 95% confidence interval) is based on the assumed risk in the comparison group and the relative effect of the intervention (and its 95% CI). | ||||||
| GRADE Working Group grades of evidence | ||||||
| 1 Control group risk comes from control arm of meta‐analysis, based on included trials. | ||||||
| Controlled‐release mesalamine (4 g/day) compared to Placebo for Induction of remission or response in Crohn's disease | ||||||
| Patient or population: patients with Induction of remission or response in Crohn's disease | ||||||
| Outcomes | Illustrative comparative risks* (95% CI) | Relative effect | No of Participants | Quality of the evidence | Comments | |
| Assumed risk | Corresponding risk | |||||
| Placebo | Controlled‐release mesalamine (4 g/day) | |||||
| Mean change in baseline CDAI (Random effects model) | The mean mean change in baseline cdai (random effects model) in the intervention groups was | 615 | ⊕⊕⊝⊝ | |||
| Mean change in baseline CDAI (Fixed effects model) | The mean mean change in baseline cdai (fixed effects model) in the intervention groups was | 615 | ⊕⊕⊝⊝ | |||
| *The basis for the assumed risk (e.g. the median control group risk across studies) is provided in footnotes. The corresponding risk (and its 95% confidence interval) is based on the assumed risk in the comparison group and the relative effect of the intervention (and its 95% CI). | ||||||
| GRADE Working Group grades of evidence | ||||||
| 1 Downgraded one level due to moderate heterogeneity (I2 = 54%). | ||||||
| Azo‐bonded and delayed‐release mesalamine (2 ‐ 3.2 g/day) compared to Placebo for Induction of remission or response in Crohn's disease | ||||||
| Patient or population: patients with Induction of remission or response in Crohn's disease | ||||||
| Outcomes | Illustrative comparative risks* (95% CI) | Relative effect | No of Participants | Quality of the evidence | Comments | |
| Assumed risk | Corresponding risk | |||||
| Placebo | Azo‐bonded and delayed‐release mesalamine (2 ‐ 3.2 g/day) | |||||
| Induction of remission or clinical improvement ‐ Olsalazine (2 g/day) | 489 per 10001 | 176 per 1000 | RR 0.36 | 91 | ⊕⊝⊝⊝ | |
| Induction of remission or clinical improvement ‐ Asacol (3.2 g/day) | 222 per 10001 | 600 per 1000 | RR 2.7 | 38 | ⊕⊝⊝⊝ | |
| Induction of remission (CDAI < 150 + decrease >=70) ‐ Asacol (3.2 g/day) | 222 per 10001 | 451 per 1000 | RR 2.03 | 38 | ⊕⊝⊝⊝ | |
| *The basis for the assumed risk (e.g. the median control group risk across studies) is provided in footnotes. The corresponding risk (and its 95% confidence interval) is based on the assumed risk in the comparison group and the relative effect of the intervention (and its 95% CI). | ||||||
| GRADE Working Group grades of evidence | ||||||
| 1 Control group risk comes from control arm of the included study. | ||||||
| Delayed‐release mesalamine (3 ‐ 4.5 g/day) compared to Corticosteroids for Induction of remission or response in Crohn's disease | ||||||
| Patient or population: patients with Induction of remission or response in Crohn's disease | ||||||
| Outcomes | Illustrative comparative risks* (95% CI) | Relative effect | No of Participants | Quality of the evidence | Comments | |
| Assumed risk | Corresponding risk | |||||
| Corticosteroids | Delayed‐release mesalamine (3 ‐ 4.5 g/day) | |||||
| Induction of remission (CDAI < or =150 with or without decrease of at least 60 points) | 526 per 10001 | 547 per 1000 | RR 1.04 | 178 | ⊕⊕⊕⊝ | |
| Induction of remission (CDAI < or =150 with or without decrease of at least 60 points) ‐ 3 g/day | 429 per 10003 | 407 per 1000 | RR 0.95 | 50 | ⊕⊕⊝⊝ | |
| Induction of remission (CDAI < or =150 with or without decrease of at least 60 points) ‐ 2.4 g/day | 600 per 10003 | 600 per 1000 | RR 1 | 50 | ⊕⊕⊕⊝ | |
| Induction of remission (CDAI < or =150 with or without decrease of at least 60 points) ‐ 4 g/day microgranules | 625 per 10003 | 788 per 1000 | RR 1.26 | 44 | ⊕⊕⊕⊝ | |
| Induction of remission (CDAI < or =150 with or without decrease of at least 60 points) ‐ 4.5 g/day | 529 per 10003 | 355 per 1000 | RR 0.67 | 34 | ⊕⊕⊝⊝ | |
| *The basis for the assumed risk (e.g. the median control group risk across studies) is provided in footnotes. The corresponding risk (and its 95% confidence interval) is based on the assumed risk in the comparison group and the relative effect of the intervention (and its 95% CI). | ||||||
| GRADE Working Group grades of evidence | ||||||
| 1 Control group risk comes from control arm of meta‐analysis, based on included trials. | ||||||
| Mesalamine (4 ‐ 4.5 g/day) compared to Budesonide for Induction of remission or response in Crohn's disease | ||||||
| Patient or population: patients with Induction of remission or response in Crohn's disease | ||||||
| Outcomes | Illustrative comparative risks* (95% CI) | Relative effect | No of Participants | Quality of the evidence | Comments | |
| Assumed risk | Corresponding risk | |||||
| Budesonide | Mesalamine (4 ‐ 4.5 g/day) | |||||
| Induction of remission (CDAI < or = 150) ‐ Pentasa (4 g/day) | 602 per 10001 | 337 per 1000 | RR 0.56 | 182 | ⊕⊕⊝⊝ | |
| Induction of remission (CDAI < or = 150) ‐ Salofalk (4.5 g/day) | 695 per 10001 | 618 per 1000 | RR 0.89 | 307 | ⊕⊕⊕⊝ | |
| *The basis for the assumed risk (e.g. the median control group risk across studies) is provided in footnotes. The corresponding risk (and its 95% confidence interval) is based on the assumed risk in the comparison group and the relative effect of the intervention (and its 95% CI). | ||||||
| GRADE Working Group grades of evidence | ||||||
| 1 Control group risk comes from control arm of the included study. | ||||||
| Mesalamine compared to Sulfasalazine (alone or in combination with corticosteroids) for Induction of remission or response in Crohn's disease | ||||||
| Patient or population: patients with Induction of remission or response in Crohn's disease | ||||||
| Outcomes | Illustrative comparative risks* (95% CI) | Relative effect | No of Participants | Quality of the evidence | Comments | |
| Assumed risk | Corresponding risk | |||||
| Sulfasalazine (alone or in combination with corticosteroids) | Mesalamine | |||||
| Induction of remission (CDAI < 150) or clinical improvement ‐ Salofalk (1.5 g/day) | 733 per 10001 | 865 per 1000 | RR 1.18 | 30 | ⊕⊝⊝⊝ | |
| Induction of remission (CDAI < 150) or clinical improvement ‐ Salofalk (3.0 g/day) | 885 per 10001 | 832 per 1000 | RR 0.94 | 50 | ⊕⊕⊝⊝ | |
| *The basis for the assumed risk (e.g. the median control group risk across studies) is provided in footnotes. The corresponding risk (and its 95% confidence interval) is based on the assumed risk in the comparison group and the relative effect of the intervention (and its 95% CI). | ||||||
| GRADE Working Group grades of evidence | ||||||
| 1 Control group risk comes from control arm of the included study. | ||||||
| Study ID | Comparators | Endpoint | Study design | Patient Population | Exclusion reasons |
| Anonymous 1985 | SASP 1 g/15 kg /day alone | Clinical response | Uncontrolled | Active CD | 1, 5 |
| Anonymous 1990 | 5‐ASA 1.5 g/day versus Placebo | Clinical relapse | Randomized controlled | CD in remission (Medical/Surgical) | 2, 6 |
| Anthonisen 1974 | SASP (1.5 g for 3 days followed by 3 g/day) versus Placebo | Clinical improvement | Double‐blind placebo controlled cross‐over | Active CD | 7 |
| Arber 1995 | 5‐ASA 1 g/day versus Placebo | Clinical relapse | Randomized controlled | CD in remission | 2, 6 |
| Ardizzone 2004 | 5‐ASA 3 g/day versus Azathioprine | Clinical and surgical relapse | Open label, randomized | CD in remission (Surgical) | 2, 5, 6 |
| Beck 1988 | 5‐ASA versus SASP | Clinical response | Uncontrolled | Active CD | 1 |
| Bergman 1976 | SASP + CS versus No Treatment | Clinical relapse | Randomized controlled | CD in remission (Surgical) | 2, 4, 6 |
| Blichfeldt 1978 | SASP versus prednisolone (Metronidazole/ placebo cross‐over) | Clinical improvement | Double‐blind cross‐over | Active CD | 4, 5 |
| Bresci 1994 | 5‐ASA 2.4 g/day versus No Specific Therapy | Clinical relapse | Randomized controlled | CD in remission (Medical) | 2, 6 |
| Brignola 1992 | 5‐ASA 2 g/day versus Placebo | Clinical relapse | Randomized controlled | CD in remission | 2, 6 |
| Brignola 1995 | 5‐ASA 3 g/day versus Placebo | Endoscopic relapse | Double‐blind placebo controlled | CD in remission (Surgical) | 2, 6 |
| Caprilli 1994 | 5‐ASA 2.4 g/day versus No Treatment | Endoscopic relapse | Randomized controlled | CD in remission (Surgical) | 2, 6 |
| Caprilli 2003 | 5‐ASA 2.4 g/day versus 5‐ASA 4 g/day | Clinical and endoscopic relapse | Randomized controlled | CD in remission (Surgical) | 2, 6 |
| Cezard 2009 | 5‐ASA versus Placebo | Clinical relapse | Double‐blind placebo‐controlled | CD in remission (Paediatric) | 2, 6 |
| Cohen 2000 | 5ASA versus Placebo | Endoscopic recurrence | Randomized, controlled | CD in remission (Surgical) | 2, 6 |
| Colombel 1999 | 5‐ASA versus Antibiotic | Remission | Randomized controlled | Active CD | 5 |
| de Franchis R 1997 | 5‐ASA 3 g/day versus Placebo | Clinical relapse | Randomized controlled | CD in remission (Steroid‐induced) | 2, 6 |
| Del Corso 1995 | 5‐ASA 2.4 g/day versus No Treatment | Clinical relapse | Controlled trial | CD in remission (Medical/Surgical) | 2, 6 |
| Dirks 1989 | SASP + CS versus Surgery | Clinical relapse | Uncontrolled | CD in remission | 1,2,4,5,6 |
| Ewe 1976 | SASP versus Placebo | Relapse | Double‐blind | CD in remission | 2, 6 |
| Ewe 1984 | SASP, radical versus restricted surgery | Clinical relapse | Partially randomized, double‐blind | CD in remission (Surgical) | 2,6 |
| Ewe 1986 | SASP, radicality of surgery | Clinical relapse | CD in remission (Surgical) | 2,6 | |
| Ewe 1989 | SASP versus Placebo | Clinical relapse | Randomized controlled | CD in remission (Surgical) | 2, 6 |
| Fiasse 1990 | 5‐ASA versus Placebo | Relapse | Double‐blind placebo‐controlled | CD in remission (Surgical) | 2, 6 |
| Florent 1996 | 5‐ASA 3 g/day versus Placebo | Endoscopic relapse | Double‐blind placebo‐controlled | CD in remission (Surgical) | 2, 6 |
| Gendre 1993 | 5‐ASA 2 g/day versus Placebo | Clinical relapse | Randomized controlled | CD in remission | 2, 6 |
| Gerhardt 2001 | 5‐ASA versus Boswellia serrata extract H15 | Change in CDAI | Randomized controlled | Active CD | 5 |
| Goldstein 1987 | SASP alone | Clinical response | Retrospective | Active small bowel CD | 1, 5 |
| Griffiths 1993 | 5‐ASA 50 mg/kg versus Placebo | Change in CDAI, VHI | Randomized controlled | Active small bowel CD (Paediatric) | 2 |
| Guslandi 2000 | 5‐ASA 3 g/day versus 5‐ASA 2 g/day + Saccharomyces boulardii (yeast) | Clinical relapse | Randomized controlled | CD in remission | 2, 5, 6 |
| Hanauer 1993 | 5‐ASA 4g/day alone | Clinical response | Uncontrolled | Active CD and CD in remission | 1, 5 |
| Hanauer 2004b | 5‐ASA 3 g/day versus 6‐MP 50 mg/day versus placebo | Clinical, endoscopic and radiographic relapse | Randomized controlled | CD in remission (Surgical) | 2, 6 |
| Howaldt 1993 | 5‐ASA 1.5 g/day versus 4‐ASA 1.5 g/day | Clinical relapse | Randomized controlled | CD in remission | 2, 6 |
| Klein 1995 | 5‐ASA 1.5 g/day versus Placebo | Endoscopic relapse | Controlled trial | CD in remission (Surgical) | 2, 6 |
| Klotz 1980 | SASP versus Sulfapyridine versus Rectal 5‐ASA | Activity index, stool quality, remission rate | Randomized controlled | Active CD and UC | 3, 5 |
| Lennard‐Jones 1977 | SASP versus Placebo | Clinical relapse | Double‐blind placebo‐controlled | CD in remission (Medical/Surgical) | 2, 6 |
| Lichtenstein 2009a | 5‐ASA alone | Clinical relapse | Prospective, uncontrolled | CD in remission | 1, 2, 5, 6 |
| Lichtenstein 2009b | 5‐ASA alone | Clinical remission | Prospective, uncontrolled | Active CD | 1, 5 |
| Lochs 1991 | SASP 3 g/day + CS versus Enteral Nutrition | Clinical remission | Randomized controlled | Active CD | 4, 5 |
| Lochs 2000 | 5‐ASA 4 g/day versus Placebo | Clinical relapse | Randomized controlled | CD in remission (Surgical) | 2, 6 |
| Mahmud 2001 | 5‐ASA 2 g/day versus Placebo | Clinical relapse | Randomized controlled | CD in remission | 2, 6 |
| Malchow 1990 | SASP + CS versus Enteral Nutrition | Clinical remission | Randomized controlled | Active CD | 4, 5 |
| Mantzaris 2003 | 5‐ASA 3 g/day versus Budesonide 6 mg/day | Clinical relapse and quality of life | Randomized controlled | CD in remission (Steroid‐dependent) | 2, 6 |
| Mate‐Jimenez 2000 | 5‐ASA 3g/day versus MTX 15 mg/week versus 6‐MP 1.5 mg/kg/day | Clinical remission and relapse | Randomized controlled | CD and UC (Steroid‐dependent) | 2, 5, 6 |
| McLeod 1995 | 5‐ASA 3g/day versus Placebo | Clinical relapse | Randomized controlled | CD in remission (Surgical) | 2, 6 |
| Modigliani 1996 | 5‐ASA 4g/day versus Placebo | Clinical relapse, steroid weaning | Randomized controlled | CD in remission (Steroid‐induced) | 2,6 |
| Orlando 2012 | 5‐ASA alone | Endoscopic recurrence | Prospective, uncontrolled | CD in remission (Surgical) | 1, 2, 5, 6 |
| Papi 2009 | 5‐ASA alone vs No Treatment | Clinical and surgical relapse | Retrospective | CD in remission (Surgical) | 1, 2, 6 |
| Prantera 1992 | 5‐ASA 2.4 g/day versus placebo | Clinical relapse | Randomized controlled | CD in remission | 2, 6 |
| Rasmussen 1983 | 5‐ASA 1.5 g/day alone | Clinical response | Uncontrolled | Active CD | 1, 5 |
| Reinisch 2010 | 5‐ASA versus Azathioprine | Therapeutic failure | Duoble‐blind, Double‐dummy, Randomized controlled | CD in remission, moderate/severe endoscopic recurrence | 2, 5, 6 |
| Romano 2005 | 5‐ASA+omega‐3 FA versus 5‐ASA | Clinical relapse | Randomized controlled, double‐blind | CD in remission (Paediatric) | 2, 4, 6 |
| Rosen 1982 Ursing1982 | SASP 3 g/day versus Metronidazole | Remission | Randomized controlled | Active CD | 5 |
| Savarino 2013 | 5ASA versus Azathioprine versus Adalimumab | Endoscopic and clinical recurrence | Randomized controlled | CD in remission (Surgical) | 2, 5, 6 |
| Schneider 1985 | Metronidazole versus CS + SASP +/‐ Metronidazole | Clinical response | Randomized controlled | Active CD or discharging fistulae | 4, 5 |
| Schreiber 1994 | 5‐ASA 1.5 g/day versus 4‐ASA 1.5 g/day | Clinical relapse | Randomized controlled | CD in remission | 2, 6 |
| Singleton 1979 | SASP 1 g/15 kg + CS versus CS alone | Clinical remission and response | Randomized controlled | Active CD | 4 |
| Stober 1983 | SASP+CS versus Elementary Diet + SASP +/‐ CS | Laboratory parameters, body weight | Active CD (Paediatric) | 2, 4, 5, 6 | |
| Sutherland 1997 | 5‐ASA 3g/day versus Placebo | Clinical relapse | Randomized controlled | CD in remission (Medical or Surgical) | 2,6 |
| Tao 2009 | 5‐ASA versus Tripterygium wilfordii | Clinical relapse | Randomized controlled | CD in remission (Surgical) | 2, 5, 6 |
| Terranova 2001 | 5ASA + Enteral Nutrition versus 5‐ASA + CS | Clinical improvement, biohumoral markers | Randomized controlled | Active CD and UC | 4, 5 |
| Terrin 2002 | 5‐ASA + CS versus Semi‐Elemental Diet | Clinical remission | Randomized controlled | Active CD | 4, 5 |
| Thomson 1995 | 5‐ASA 3g/day versus Placebo | Clinical relapse | Randomized controlled | CD in remission | 2, 6 |
| Triantafillidis 2010 | 5‐ASA vs Modulen ®IBD | Clinical relapse | Randomized controlled | CD in remission | 2, 5, 6 |
| Wellman 1986 | TPN + steroids with or without 5‐ASA lavage | Endotoxemia, clinical response | Randomized controlled | Active CD | 3, 4, 5 |
| Wellmann 1988 | 5‐ASA versus Placebo | Clinical relapse | Double‐blind placebo‐controlled | CD in remission | 2, 6 |
| Wenckert 1978 | SASP versus Placebo | Clinical relapse | Double‐blind placebo‐controlled | CD in remission (Surgical) | 2, 6 |
| Yamamoto 2009 | 5‐ASA versus Azathioprine versus Infliximab | Clinical relapse | Prospective | CD in remission (Surgical) | 1, 2, 5, 6 |
| 1=Inappropriate study design (Uncontrolled, open‐label), 2= Inappropriate study population (pediatric, CD in remission, severe CD), 3= Inappropriate route of drug delivery (rectal, lavage), 4= combined therapy, 5= inappropriate comparator, 6= inappropriate endpoint, 7=cross‐over studies that did not provide data prior to first crossover. Numbers in bold indicate primary reason for exclusion. | |||||
| Outcome or subgroup title | No. of studies | No. of participants | Statistical method | Effect size |
| 1 Induction of remission (CDAI <150), therapeutic response (VHI decrease >=25%) or clinical improvement Show forest plot | 3 | 289 | Risk Ratio (M‐H, Random, 95% CI) | 1.52 [0.95, 2.43] |
| 2 Induction of remission (CDAI <150) (Random Effects Model) Show forest plot | 2 | 263 | Risk Ratio (M‐H, Random, 95% CI) | 1.38 [1.00, 1.89] |
| 3 Induction of remission (CDA I<150) (Fixed Effect Model) Show forest plot | 2 | 263 | Risk Ratio (M‐H, Fixed, 95% CI) | 1.38 [1.01, 1.90] |
| 4 Adverse events Show forest plot | 1 | 151 | Risk Ratio (M‐H, Random, 95% CI) | 2.08 [0.75, 5.80] |
| 5 Serious adverse events Show forest plot | 1 | 151 | Risk Ratio (M‐H, Random, 95% CI) | 0.35 [0.01, 8.38] |
| 6 Withdrawal due to adverse events Show forest plot | 3 | 289 | Risk Ratio (M‐H, Random, 95% CI) | 1.00 [0.26, 3.83] |
| Outcome or subgroup title | No. of studies | No. of participants | Statistical method | Effect size |
| 1 Induction of remission (CDAI <150) Show forest plot | 2 | 260 | Risk Ratio (M‐H, Random, 95% CI) | 0.68 [0.51, 0.91] |
| 2 Adverse events Show forest plot | 1 | 159 | Risk Ratio (M‐H, Random, 95% CI) | 0.43 [0.22, 0.82] |
| 3 Serious adverse events Show forest plot | 1 | 159 | Risk Ratio (M‐H, Random, 95% CI) | 0.16 [0.01, 3.12] |
| 4 Withdrawal adverse events Show forest plot | 2 | 260 | Risk Ratio (M‐H, Random, 95% CI) | 0.72 [0.33, 1.59] |
| Outcome or subgroup title | No. of studies | No. of participants | Statistical method | Effect size |
| 1 Induction of remission Show forest plot | 1 | 110 | Risk Ratio (M‐H, Random, 95% CI) | 0.64 [0.47, 0.86] |
| 2 Withdrawal due to adverse events Show forest plot | 1 | 110 | Risk Ratio (M‐H, Random, 95% CI) | 0.52 [0.05, 5.55] |
| Outcome or subgroup title | No. of studies | No. of participants | Statistical method | Effect size |
| 1 Decrease in CDAI >=50, HBI >=2 or improvement/remission (as defined by Tvede et al) Show forest plot | 3 | 342 | Risk Ratio (M‐H, Random, 95% CI) | 1.07 [0.80, 1.42] |
| 1.1 1 g/day | 1 | 120 | Risk Ratio (M‐H, Random, 95% CI) | 0.91 [0.56, 1.46] |
| 1.2 1.5 g/day | 2 | 107 | Risk Ratio (M‐H, Random, 95% CI) | 1.47 [0.87, 2.49] |
| 1.3 2 g/day | 1 | 115 | Risk Ratio (M‐H, Random, 95% CI) | 0.97 [0.60, 1.55] |
| 2 Induction of remission (CDAI <=150 + decrease of >=50 or as defined by Tvede et al) Show forest plot | 2 | 302 | Risk Ratio (M‐H, Random, 95% CI) | 1.46 [0.89, 2.40] |
| 2.1 1 g/day | 1 | 120 | Risk Ratio (M‐H, Random, 95% CI) | 1.29 [0.59, 2.82] |
| 2.2 1.5 g/day | 1 | 67 | Risk Ratio (M‐H, Random, 95% CI) | 2.16 [0.70, 6.68] |
| 2.3 2 g/day | 1 | 115 | Risk Ratio (M‐H, Random, 95% CI) | 1.37 [0.63, 3.00] |
| 3 Adverse events Show forest plot | 3 | 342 | Risk Ratio (M‐H, Random, 95% CI) | 1.33 [0.91, 1.96] |
| 3.1 1 g/day | 1 | 120 | Risk Ratio (M‐H, Random, 95% CI) | 1.21 [0.55, 2.69] |
| 3.2 1.5 g/day | 2 | 107 | Risk Ratio (M‐H, Random, 95% CI) | 1.28 [0.73, 2.24] |
| 3.3 2 g/day | 1 | 115 | Risk Ratio (M‐H, Random, 95% CI) | 1.53 [0.76, 3.11] |
| 4 Withdrawal due to adverse events Show forest plot | 3 | 342 | Risk Ratio (M‐H, Random, 95% CI) | 1.21 [0.75, 1.95] |
| 4.1 1 g/day | 1 | 120 | Risk Ratio (M‐H, Random, 95% CI) | 1.07 [0.48, 2.42] |
| 4.2 1.5 g/day | 2 | 107 | Risk Ratio (M‐H, Random, 95% CI) | 1.47 [0.56, 3.86] |
| 4.3 2 g/day | 1 | 115 | Risk Ratio (M‐H, Random, 95% CI) | 1.2 [0.57, 2.51] |
| Outcome or subgroup title | No. of studies | No. of participants | Statistical method | Effect size |
| 1 Mean change in CDAI from baseline (random‐effects model) Show forest plot | 3 | 615 | Mean Difference (IV, Random, 95% CI) | ‐19.76 [‐46.22, 6.70] |
| 2 Mean change in CDAI from baseline (fixed‐effect model) Show forest plot | 3 | 615 | Mean Difference (IV, Fixed, 95% CI) | ‐17.54 [‐33.00, ‐0.08] |
| 3 Adverse events Show forest plot | 1 | 155 | Risk Ratio (M‐H, Random, 95% CI) | 1.42 [0.79, 2.57] |
| 4 Withdrawal due to adverse events Show forest plot | 1 | 155 | Risk Ratio (M‐H, Random, 95% CI) | 0.64 [0.30, 1.37] |
| Outcome or subgroup title | No. of studies | No. of participants | Statistical method | Effect size |
| 1 Induction of remission or clinical improvement Show forest plot | 2 | Risk Ratio (M‐H, Random, 95% CI) | Subtotals only | |
| 1.1 Olsalazine (2 g/day) | 1 | 91 | Risk Ratio (M‐H, Random, 95% CI) | 0.36 [0.18, 0.71] |
| 1.2 Asacol (3.2 g/day) | 1 | 38 | Risk Ratio (M‐H, Random, 95% CI) | 2.70 [1.06, 6.88] |
| 2 Induction of remission (CDAI < 150 + decrease >=70) Show forest plot | 1 | Risk Ratio (M‐H, Random, 95% CI) | Subtotals only | |
| 2.1 Asacol (3.2 g/day) | 1 | 38 | Risk Ratio (M‐H, Random, 95% CI) | 2.03 [0.75, 5.45] |
| 3 Adverse events Show forest plot | 1 | 38 | Risk Ratio (M‐H, Random, 95% CI) | 0.9 [0.68, 1.18] |
| 4 Withdrawal due to adverse events Show forest plot | 1 | 91 | Risk Ratio (M‐H, Random, 95% CI) | 1.49 [0.99, 2.24] |
| Outcome or subgroup title | No. of studies | No. of participants | Statistical method | Effect size |
| 1 Induction of remission (CDAI < or =150 with or without decrease of at least 60 points) Show forest plot | 3 | 178 | Risk Ratio (M‐H, Random, 95% CI) | 1.04 [0.79, 1.36] |
| 1.1 3 g/day | 1 | 50 | Risk Ratio (M‐H, Random, 95% CI) | 0.95 [0.49, 1.85] |
| 1.2 4 g/day | 1 | 50 | Risk Ratio (M‐H, Random, 95% CI) | 1.0 [0.61, 1.64] |
| 1.3 4 g/day microgranules | 1 | 44 | Risk Ratio (M‐H, Random, 95% CI) | 1.26 [0.82, 1.92] |
| 1.4 4.5 g/day | 1 | 34 | Risk Ratio (M‐H, Random, 95% CI) | 0.67 [0.30, 1.46] |
| 2 Adverse events Show forest plot | 3 | 178 | Risk Ratio (M‐H, Random, 95% CI) | 0.49 [0.23, 1.05] |
| 2.1 3 g/day | 1 | 50 | Risk Ratio (M‐H, Random, 95% CI) | 0.48 [0.22, 1.01] |
| 2.2 4 g/day | 1 | 50 | Risk Ratio (M‐H, Random, 95% CI) | 0.31 [0.12, 0.81] |
| 2.3 4 g/day microgranules | 1 | 44 | Risk Ratio (M‐H, Random, 95% CI) | 0.24 [0.07, 0.82] |
| 2.4 4.5 g/day | 1 | 34 | Risk Ratio (M‐H, Random, 95% CI) | 1.1 [0.65, 1.87] |
| 3 Serious adverse events Show forest plot | 3 | 178 | Risk Ratio (M‐H, Random, 95% CI) | 0.35 [0.10, 1.27] |
| 3.1 3 g/day | 1 | 50 | Risk Ratio (M‐H, Random, 95% CI) | 0.85 [0.16, 4.64] |
| 3.2 4 g/day | 1 | 50 | Risk Ratio (M‐H, Random, 95% CI) | 0.09 [0.00, 1.75] |
| 3.3 4 g/day microgranules | 1 | 44 | Risk Ratio (M‐H, Random, 95% CI) | 0.19 [0.02, 1.68] |
| 3.4 4.5 g/day | 1 | 34 | Risk Ratio (M‐H, Random, 95% CI) | 0.0 [0.0, 0.0] |
| 4 Withdrawal due to adverse events Show forest plot | 3 | 178 | Risk Ratio (M‐H, Random, 95% CI) | 0.39 [0.13, 1.15] |
| 4.1 3 g/day | 1 | 50 | Risk Ratio (M‐H, Random, 95% CI) | 0.85 [0.16, 4.64] |
| 4.2 4 g/day | 1 | 50 | Risk Ratio (M‐H, Random, 95% CI) | 0.09 [0.00, 1.75] |
| 4.3 4 g/day microgranules | 1 | 44 | Risk Ratio (M‐H, Random, 95% CI) | 0.19 [0.02, 1.68] |
| 4.4 4.5 g/day | 1 | 34 | Risk Ratio (M‐H, Random, 95% CI) | 0.5 [0.05, 5.01] |
| Outcome or subgroup title | No. of studies | No. of participants | Statistical method | Effect size |
| 1 Induction of remission (CDAI < or = 150) Show forest plot | 2 | Risk Ratio (M‐H, Random, 95% CI) | Subtotals only | |
| 1.1 Pentasa (4 g/day) | 1 | 182 | Risk Ratio (M‐H, Random, 95% CI) | 0.56 [0.40, 0.78] |
| 1.2 Salofalk (4.5 g/day) | 1 | 307 | Risk Ratio (M‐H, Random, 95% CI) | 0.89 [0.76, 1.05] |
| 2 Adverse events Show forest plot | 2 | Risk Ratio (M‐H, Random, 95% CI) | Subtotals only | |
| 2.1 Pentasa (4 g/day) | 1 | 182 | Risk Ratio (M‐H, Random, 95% CI) | 1.13 [0.93, 1.39] |
| 2.2 Salofalk (4.5 g/day) | 1 | 307 | Risk Ratio (M‐H, Random, 95% CI) | 1.10 [0.86, 1.41] |
| 3 Serious adverse events Show forest plot | 1 | 182 | Risk Ratio (M‐H, Random, 95% CI) | 1.61 [0.80, 3.25] |
| 4 Withdrawal due to adverse events Show forest plot | 2 | Risk Ratio (M‐H, Random, 95% CI) | Subtotals only | |
| 4.1 Pentasa (4 g/day) | 1 | 182 | Risk Ratio (M‐H, Random, 95% CI) | 2.81 [1.60, 4.96] |
| 4.2 Salofalk (4.5 g/day) | 1 | 307 | Risk Ratio (M‐H, Random, 95% CI) | 2.01 [0.62, 6.55] |
| Outcome or subgroup title | No. of studies | No. of participants | Statistical method | Effect size |
| 1 Induction of remission (CDAI < 150) or clinical improvement Show forest plot | 2 | Risk Ratio (M‐H, Random, 95% CI) | Subtotals only | |
| 1.1 Salofalk (1.5 g/day) | 1 | 30 | Risk Ratio (M‐H, Random, 95% CI) | 1.18 [0.82, 1.70] |
| 1.2 Salofalk (3.0 g/day) | 1 | 50 | Risk Ratio (M‐H, Random, 95% CI) | 0.94 [0.75, 1.18] |
| 2 Adverse events Show forest plot | 2 | Risk Ratio (M‐H, Random, 95% CI) | Subtotals only | |
| 2.1 Salofalk (1.5 g/day) | 1 | 30 | Risk Ratio (M‐H, Random, 95% CI) | 0.11 [0.01, 1.90] |
| 2.2 Salofalk (3.0 g/day) | 1 | 50 | Risk Ratio (M‐H, Random, 95% CI) | 0.54 [0.15, 1.93] |