Antimicóticos tópicos para la dermatitis seborreica
Information
- DOI:
- https://doi.org/10.1002/14651858.CD008138.pub3Copy DOI

- Database:
-
- Cochrane Database of Systematic Reviews
- Version published:
-
- 02 May 2015see what's new
- Type:
-
- Intervention
- Stage:
-
- Review
- Cochrane Editorial Group:
-
Cochrane Skin Group
- Copyright:
-
- Copyright © 2015 The Authors. Cochrane Database of Systematic Reviews published by John Wiley & Sons, Ltd. on behalf of The Cochrane Collaboration.
- This is an open access article under the terms of the Creative Commons Attribution‐Non‐Commercial‐No‐Derivatives Licence, which permits use and distribution in any medium, provided the original work is properly cited, the use is non‐commercial and no modifications or adaptations are made.
Article metrics
Altmetric:
Cited by:
Authors
Contributions of authors
EOO was the contact person with the editorial base.
EOO coordinated contributions from the co‐authors and wrote the final draft of the review.
EOO, JHV, JHR, OO and VNB screened papers against eligibility criteria.
EOO and JHV obtained data on ongoing and unpublished studies.
EOO, JHR and JHV appraised the quality of papers.
EOO and JHV extracted data for the review and sought additional information about papers.
EOO and JHV entered data into RevMan.
EOO and JHV analysed and interpreted data.
EOO and JHV worked on the Methods sections.
EOO and JHV drafted the clinical sections of the background and responded to the clinical comments of the referees.
EOO and JHV responded to the methodology and statistics comments of the referees.
This review had no consumer co‐author.
EOO is the guarantor of the update.
Disclaimer
This project was supported by the National Institute for Health Research, via Cochrane Infrastructure funding to the Cochrane Skin Group. The views and opinions expressed therein are those of the authors and do not necessarily reflect those of the Systematic Reviews Programme, NIHR, NHS or the Department of Health.
Sources of support
Internal sources
-
The Nigerian Branch of the South African Cochrane Centre, Nigeria.
Capacity building in research synthesis by way of a training workshop on protocol development.
External sources
-
The National Institute for Health Research (NIHR), UK.
The NIHR, UK, is the largest single funder of the Cochrane Skin Group.
Declarations of interest
Enembe O Okokon: nothing to declare.
Jos H Verbeek: nothing to declare.
Jani H Ruotsalainen: nothing to declare.
Olumuyiwa A Ojo: nothing to declare.
Victor Nyange Bakhoya: nothing to declare.
Clinical referee, Rod Hay: "I have been a paid consultant for both P and G and L’Oreal to provide advice on the pathogenesis of seborrhoeic dermatitis but not its treatment. I have been consulted, as an expert adviser (unpaid), by a borderline products investigation by the European Commission on the effect of antifungal products – the index product was climbazole ‐ in cosmetics including shampoos on wider antifungal drug resistance."
Acknowledgements
The authors would like to thank Martin Meremikwu and Angela Oyoita for their encouragement, which led to conception of this review. We also thank Erin Dixon and Oliver Chosidow for their input to the protocol. Kenneth Ochieng gave support during development and testing of the data extraction tools. We would like to thank immensely the Cochrane Occupational Safety and Health Review Group editorial base in Kuopio, Finland, for their hospitality and support. Their initiative, encouragement and expertise was crucial in building this review beyond the protocol stage. We also appreciate Piotr Sakowski and Gosia Bala, who helped with translation of some articles.
The Cochrane Skin Group editorial base wishes to thank Luigi Naldi, who was the Cochrane Dermatology Editor for this review; Jo Leonardi‐Bee, who was the Statistical Editor; Philippa Middleton, who was Methods Editor; the clinical referees, Roderick Hay and Noah Scheinfeld; and the consumer referee, Shirley Manknell.
Version history
| Published | Title | Stage | Authors | Version |
| 2015 May 02 | Topical antifungals for seborrhoeic dermatitis | Review | Enembe O Okokon, Jos H Verbeek, Jani H Ruotsalainen, Olumuyiwa A Ojo, Victor Nyange Bakhoya | |
| 2015 Apr 28 | Topical antifungals for seborrhoeic dermatitis | Review | Enembe O Okokon, Jos H Verbeek, Jani H Ruotsalainen, Olumuyiwa A Ojo, Victor Nyange Bakhoya | |
| 2009 Oct 07 | Interventions for seborrhoeic dermatitis | Protocol | Enembe O Okokon, Angela Oyo‐Ita, Olivier Chosidow | |
Differences between protocol and review
Title
We changed the review title from 'Interventions for seborrhoeic dermatitis' to 'Topical antifungals for seborrhoeic dermatitis'. In the protocol, we presented this review as an all‐encompassing interventions review for seborrhoeic dermatitis. We had to modify that goal and limit ourselves to topical antifungal agents used for treatment of seborrhoeic dermatitis. This decision was made because of the multiplicity of comparisons and the equally diverse outcome variables that we encountered. We reasoned that for meaningful comparisons, leading to coherent conclusions, it was best to split the review into segments focusing on major classes of treatment as we identified them from the trials that we scoured, which will be published in series, at the end of which an overview can be written.
Searches
We had proposed to conduct a search for side effects of various interventions used to treat seborrhoeic dermatitis. We did not carry out this search because we lacked the resources. In the included studies, adverse effects that were reported were non‐specific; therefore with hindsight, we believe that a search for specific adverse effects would have been difficult to perform. We also decided that searching grey literature and conference proceedings, as proposed in the protocol, would not yield extra information. The quality of reporting of published trials was already low, which made analysis difficult. Conference proceedings that were covered by the electronic search provided very little in terms of data, and we believe that it was not useful to further pursue this search approach.
Excluded studies
We decided to exclude studies in which antifungals were combined with other active medicines in the same treatment; this was not specified in the protocol. This decision was made when it became clear that with these combination treatments, treatment effect could not be attributed to the antifungal when in combination with an active agent of another class, or to a specific antifungal when in combination with another antifungal.
Interventions
We set out to include all interventions for seborrhoeic dermatitis but later reconsidered this proposal and rather split the review into two parts. This part is related only to topical antifungals.
Outcomes
We made some changes to the secondary outcome measures. Because we reasoned that global severity scores cannot be assessed in a valid way, we chose to drop the outcomes measures listed below.
-
Mean change in global severity score from baseline as assessed by the physician.
-
Mean change in global severity score from baseline as assessed by the participant.
We replaced these measures with severity scores for erythema, pruritus and scaling, which are cardinal symptoms of seborrhoeic dermatitis and unarguably the most investigated. We deemed these measures adequate to objectively capture treatment effect and enable comparisons across trials when they were derived on different scales. This decision was made after due consultation with experts in this field, including the Co‐ordinating Editor of the Skin Group. The consultation was conducted to clarify which measure of treatment effect was objective enough to facilitate comparisons across studies. It was informed by the observation that global severity scores were measured on the basis of different combinations of affected areas of the skin and various possible symptoms. Thus we excluded studies that used only composite scores for treatment outcomes, as they did not all represent the same thing. Such studies are listed under the heading Excluded studies. Studies were included only if investigators had measured complete clearance of symptoms or a change in at least one of the cardinal symptoms of seborrhoeic dermatitis.
Subgroup analysis
In the review we added conflicts of interest to the parameters on which we based our subgroup analysis.
Searches
In the protocol in error, we omitted that we planned to search LILACS, which is an important source of records from South America; therefore we searched this database for this review.
GRADE
Within the time period that we needed to complete the review, assessing quality of evidence using the GRADE (Grades of Recommendation, Assessment, Development and Evaluation) approach became established practice. Therefore, we used GRADE to assess the quality of evidence, and we prepared 'Summary of findings' tables. These were not specified in the protocol.
Sensitivity analysis
We proposed to conduct a sensitivity analysis based on the presence of co‐morbidities such as HIV, participants' use of drugs other than prescriptions for seborrhoeic dermatitis and the professional cadre of the diagnostician. Only one study recruited participants who also had HIV infection. Most studies included use of other drugs as an exclusion criterion. Very few studies have identified the cadre of the care provider who made the diagnosis. We therefore dropped these original criteria for these reasons.
Notes
The original protocol was split into 2 separate protocols ‐ 1 on antifungal agents and the other on anti‐inflammatory agents. This was done because of the large number of studies retrieved and the multiplicity of outcome measures used. See Differences between protocol and review.
Keywords
MeSH
Medical Subject Headings (MeSH) Keywords
- Antifungal Agents [*therapeutic use];
- Ciclopirox;
- Clotrimazole [therapeutic use];
- Dermatitis, Seborrheic [*drug therapy];
- Facial Dermatoses [*drug therapy];
- Ketoconazole [therapeutic use];
- Lithium Compounds;
- Miconazole [therapeutic use];
- Pyridones [therapeutic use];
- Randomized Controlled Trials as Topic;
- Scalp Dermatoses [*drug therapy];
- Solanum [chemistry];
- Steroids [therapeutic use];
Medical Subject Headings Check Words
Adolescent; Adult; Humans;
PICOs
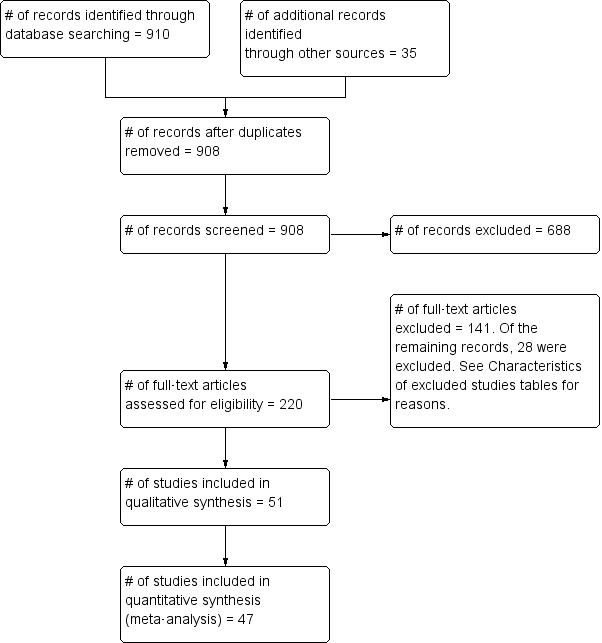
Flow diagram for study inclusion.

Risk of bias summary: review authors' judgements about each risk of bias item for each included study.

Risk of bias graph: review authors' judgements about each risk of bias item presented as percentages across all included studies.

Funnel plot of comparison: 1 Ketoconazole vs placebo, outcome: 1.1 Failure to achieve complete resolution.

Comparison 1 Ketoconazole vs placebo, Outcome 1 Failure to achieve complete resolution.

Comparison 1 Ketoconazole vs placebo, Outcome 2 Decrease in erythema score.

Comparison 1 Ketoconazole vs placebo, Outcome 3 Decrease in erythema score (long term).

Comparison 1 Ketoconazole vs placebo, Outcome 4 Erythema ‐ Failure to achieve complete resolution.

Comparison 1 Ketoconazole vs placebo, Outcome 5 Decrease in pruritus score.

Comparison 1 Ketoconazole vs placebo, Outcome 6 Decrease in pruritus (long term).

Comparison 1 Ketoconazole vs placebo, Outcome 7 Pruritus ‐ Failure to achieve complete resolution.

Comparison 1 Ketoconazole vs placebo, Outcome 8 Decrease in scaling score.

Comparison 1 Ketoconazole vs placebo, Outcome 9 Decrease in scaling (long term).

Comparison 1 Ketoconazole vs placebo, Outcome 10 Scaling ‐ Failure to achieve complete resolution.

Comparison 1 Ketoconazole vs placebo, Outcome 11 Side effects.

Comparison 2 Ketoconazole vs steroids, Outcome 1 Failure to achieve complete resolution.

Comparison 2 Ketoconazole vs steroids, Outcome 2 Failure to achieve complete resolution (long term).

Comparison 2 Ketoconazole vs steroids, Outcome 3 Decrease in erythema score.

Comparison 2 Ketoconazole vs steroids, Outcome 4 Decrease in erythema score (long term).

Comparison 2 Ketoconazole vs steroids, Outcome 5 Erythema ‐ Failure to achieve complete resolution.

Comparison 2 Ketoconazole vs steroids, Outcome 6 Decrease in pruritus score.

Comparison 2 Ketoconazole vs steroids, Outcome 7 Decrease in pruritus (long term).

Comparison 2 Ketoconazole vs steroids, Outcome 8 Pruritus ‐ Failure to achieve complete resolution.

Comparison 2 Ketoconazole vs steroids, Outcome 9 Decrease in scaling score.

Comparison 2 Ketoconazole vs steroids, Outcome 10 Decrease in scaling score (long term).

Comparison 2 Ketoconazole vs steroids, Outcome 11 Scaling ‐ Failure to achieve complete resolution.

Comparison 2 Ketoconazole vs steroids, Outcome 12 Side effects.

Comparison 3 Ketoconazole vs zinc pyrithione, Outcome 1 Failure to achieve complete resolution.

Comparison 3 Ketoconazole vs zinc pyrithione, Outcome 2 Failure to achieve complete resolution (long term).

Comparison 3 Ketoconazole vs zinc pyrithione, Outcome 3 Decrease in scaling score.

Comparison 3 Ketoconazole vs zinc pyrithione, Outcome 4 Decrease in scaling score (long term).

Comparison 3 Ketoconazole vs zinc pyrithione, Outcome 5 Side effects.

Comparison 4 Ketoconazole vs ciclopirox, Outcome 1 Failure to achieve complete resolution.

Comparison 4 Ketoconazole vs ciclopirox, Outcome 2 Failure to achieve complete resolution (long term).

Comparison 4 Ketoconazole vs ciclopirox, Outcome 3 Decrease in erythema score.

Comparison 4 Ketoconazole vs ciclopirox, Outcome 4 Decrease in erythema score (long term).

Comparison 4 Ketoconazole vs ciclopirox, Outcome 5 Erythema ‐ Failure to achieve complete resolution.

Comparison 4 Ketoconazole vs ciclopirox, Outcome 6 Decrease in pruritus score.

Comparison 4 Ketoconazole vs ciclopirox, Outcome 7 Decrease in pruritus score (long term).

Comparison 4 Ketoconazole vs ciclopirox, Outcome 8 Decrease in scaling score.

Comparison 4 Ketoconazole vs ciclopirox, Outcome 9 Decrease in scaling score (long term).

Comparison 4 Ketoconazole vs ciclopirox, Outcome 10 Scaling ‐ Failure to achieve complete resolution.

Comparison 4 Ketoconazole vs ciclopirox, Outcome 11 Side effects.

Comparison 5 Ketoconazole vs metronidazole, Outcome 1 Failure to achieve complete resolution.

Comparison 5 Ketoconazole vs metronidazole, Outcome 2 Decrease in pruritus score.

Comparison 5 Ketoconazole vs metronidazole, Outcome 3 Side effects.

Comparison 6 Ketoconazole vs climbazole, Outcome 1 Failure to achieve complete resolution (long term).

Comparison 6 Ketoconazole vs climbazole, Outcome 2 Erythema ‐ Failure to achieve complete resolution.

Comparison 6 Ketoconazole vs climbazole, Outcome 3 Erythema ‐ Failure to achieve complete resolution (long term).

Comparison 6 Ketoconazole vs climbazole, Outcome 4 Scaling ‐ Erythema ‐ Failure to achieve complete resolution.

Comparison 6 Ketoconazole vs climbazole, Outcome 5 Scaling ‐ Erythema ‐ Failure to achieve complete resolution (long term).

Comparison 7 Ketoconazole vs S. chrysotrichum, Outcome 1 Failure to achieve complete resolution.

Comparison 8 Ketoconazole vs pimecrolimus, Outcome 1 Decrease in erythema score (long term).

Comparison 8 Ketoconazole vs pimecrolimus, Outcome 2 Decrease in scaling score (long term).

Comparison 8 Ketoconazole vs pimecrolimus, Outcome 3 Side effects.

Comparison 9 Ketoconazole vs lithium, Outcome 1 Failure to achieve complete resolution.

Comparison 9 Ketoconazole vs lithium, Outcome 2 Failure to achieve complete resolution (long term).

Comparison 9 Ketoconazole vs lithium, Outcome 3 Erythema ‐ Failure to achieve complete resolution.

Comparison 9 Ketoconazole vs lithium, Outcome 4 Erythema ‐ Failure to achieve complete resolution (long term).

Comparison 9 Ketoconazole vs lithium, Outcome 5 Pruritus ‐ Failure to achieve complete resolution.

Comparison 9 Ketoconazole vs lithium, Outcome 6 Pruritus ‐ Failure to achieve complete resolution (long term).

Comparison 9 Ketoconazole vs lithium, Outcome 7 Scaling ‐ Failure to achieve complete resolution.

Comparison 9 Ketoconazole vs lithium, Outcome 8 Scaling ‐ Failure to achieve complete resolution (long term).

Comparison 9 Ketoconazole vs lithium, Outcome 9 Side effects.

Comparison 10 Ketoconazole vs selenium, Outcome 1 Decrease in scaling score.

Comparison 11 Ketoconazole vs Quassia amara, Outcome 1 Failure to achieve complete resolution.

Comparison 11 Ketoconazole vs Quassia amara, Outcome 2 Failure to achieve complete resolution (long term).

Comparison 12 Ketoconazole foam vs ketoconazole cream, Outcome 1 Failure to achieve complete resolution.

Comparison 12 Ketoconazole foam vs ketoconazole cream, Outcome 2 Erythema ‐ Failure to achieve complete resolution.

Comparison 12 Ketoconazole foam vs ketoconazole cream, Outcome 3 Pruritus ‐ Failure to achieve complete resolution.

Comparison 12 Ketoconazole foam vs ketoconazole cream, Outcome 4 Scaling ‐ Failure to achieve complete resolution.

Comparison 13 Ketoconazole 2% vs ketoconazole 1%, Outcome 1 Failure to achieve complete resolution.

Comparison 13 Ketoconazole 2% vs ketoconazole 1%, Outcome 2 Failure to achieve complete resolution (long term).

Comparison 14 Bifonazole vs placebo, Outcome 1 Failure to achieve complete resolution.

Comparison 14 Bifonazole vs placebo, Outcome 2 Failure to achieve complete resolution (long term).

Comparison 14 Bifonazole vs placebo, Outcome 3 Decrease in erythema score.

Comparison 14 Bifonazole vs placebo, Outcome 4 Decrease in erythema score (long term).

Comparison 14 Bifonazole vs placebo, Outcome 5 Decrease in pruritus score.

Comparison 14 Bifonazole vs placebo, Outcome 6 Decrease in pruritus score (long term).

Comparison 14 Bifonazole vs placebo, Outcome 7 Decrease in scaling score.

Comparison 14 Bifonazole vs placebo, Outcome 8 Decrease in scaling score (long term).

Comparison 14 Bifonazole vs placebo, Outcome 9 Side effects.

Comparison 15 Clotrimazole vs steroid, Outcome 1 Decrease in erythema score.

Comparison 15 Clotrimazole vs steroid, Outcome 2 Decrease in pruritus score.

Comparison 15 Clotrimazole vs steroid, Outcome 3 Decrease in scaling score.

Comparison 16 Clotrimazole vs Emu oil, Outcome 1 Decrease in erythema score.

Comparison 16 Clotrimazole vs Emu oil, Outcome 2 Decrease in pruritus score.

Comparison 16 Clotrimazole vs Emu oil, Outcome 3 Decrease in scaling score.

Comparison 17 Miconazole vs steroids, Outcome 1 Failure to achieve complete resolution.

Comparison 17 Miconazole vs steroids, Outcome 2 Failure to achieve complete resolution (long term).

Comparison 18 Miconazole rinse plus shampoo vs shampoo, Outcome 1 Itching ‐ Failure to achieve complete resolution.

Comparison 18 Miconazole rinse plus shampoo vs shampoo, Outcome 2 Scaling ‐ Failure to achieve complete resolution.

Comparison 19 Ciclopirox vs placebo, Outcome 1 Failure to achieve complete resolution.

Comparison 19 Ciclopirox vs placebo, Outcome 2 Failure to achieve complete resolution (long term).

Comparison 19 Ciclopirox vs placebo, Outcome 3 Decrease in erythema score.

Comparison 19 Ciclopirox vs placebo, Outcome 4 Decrease in erythema score (long term).

Comparison 19 Ciclopirox vs placebo, Outcome 5 Erythema ‐ Failure to achieve complete resolution.

Comparison 19 Ciclopirox vs placebo, Outcome 6 Decrease in pruritus score.

Comparison 19 Ciclopirox vs placebo, Outcome 7 Decrease in pruritus score (long term).

Comparison 19 Ciclopirox vs placebo, Outcome 8 Pruritus ‐ Failure to achieve complete resolution.

Comparison 19 Ciclopirox vs placebo, Outcome 9 Decrease in scaling score.

Comparison 19 Ciclopirox vs placebo, Outcome 10 Decrease in scaling score (long term).

Comparison 19 Ciclopirox vs placebo, Outcome 11 Scaling ‐ Failure to achieve complete resolution.

Comparison 19 Ciclopirox vs placebo, Outcome 12 Side effects.

Comparison 20 Ciclopirox (higher dose) vs ciclopirox (lower dose), Outcome 1 Failure to achieve complete resolution.

Comparison 21 Ciclopirox vs Quassia amara, Outcome 1 Failure to achieve complete resolution.

Comparison 21 Ciclopirox vs Quassia amara, Outcome 2 Failure to achieve complete resolution (long term).

Comparison 22 Lithium vs placebo, Outcome 1 Failure to achieve complete resolution.

Comparison 22 Lithium vs placebo, Outcome 2 Failure to achieve complete resolution (long term).

Comparison 22 Lithium vs placebo, Outcome 3 Decrease in erythema score.

Comparison 22 Lithium vs placebo, Outcome 4 Decrease in erythema score (long term).

Comparison 22 Lithium vs placebo, Outcome 5 Erythema ‐ Failure to achieve complete resolution.

Comparison 22 Lithium vs placebo, Outcome 6 Decrease in scaling score.

Comparison 22 Lithium vs placebo, Outcome 7 Decrease in scaling score (long term).

Comparison 22 Lithium vs placebo, Outcome 8 Scaling ‐ Failure to achieve complete resolution.

Comparison 22 Lithium vs placebo, Outcome 9 Side effects.

Comparison 23 Ketoconazole vs placebo ‐ Subgroup analysis by COI, Outcome 1 Failure to achieve complete resolution.

Comparison 23 Ketoconazole vs placebo ‐ Subgroup analysis by COI, Outcome 2 Decrease in erythema score.

Comparison 23 Ketoconazole vs placebo ‐ Subgroup analysis by COI, Outcome 3 Decrease in pruritus score.

Comparison 23 Ketoconazole vs placebo ‐ Subgroup analysis by COI, Outcome 4 Side effects.

Comparison 24 Ketoconazole vs steroids ‐ Subgroup analysis by COI, Outcome 1 Failure to achieve complete resolution.

Comparison 24 Ketoconazole vs steroids ‐ Subgroup analysis by COI, Outcome 2 Failure to achieve complete resolution.

Comparison 24 Ketoconazole vs steroids ‐ Subgroup analysis by COI, Outcome 3 Decrease in scaling score.

Comparison 25 Ketoconazole vs placebo ‐ Subgroup analysis by dose, Outcome 1 Failure to achieve complete resolution.

Comparison 25 Ketoconazole vs placebo ‐ Subgroup analysis by dose, Outcome 2 Decrease in erythema score.

Comparison 25 Ketoconazole vs placebo ‐ Subgroup analysis by dose, Outcome 3 Erythema ‐ Failure to achieve complete resolution.

Comparison 25 Ketoconazole vs placebo ‐ Subgroup analysis by dose, Outcome 4 Decrease in pruritus score.

Comparison 25 Ketoconazole vs placebo ‐ Subgroup analysis by dose, Outcome 5 Pruritus ‐ Failure to achieve complete resolution.

Comparison 25 Ketoconazole vs placebo ‐ Subgroup analysis by dose, Outcome 6 Decrease in scaling score.

Comparison 25 Ketoconazole vs placebo ‐ Subgroup analysis by dose, Outcome 7 Decrease in scaling (long term).

Comparison 25 Ketoconazole vs placebo ‐ Subgroup analysis by dose, Outcome 8 Scaling ‐ Failure to achieve complete resolution.

Comparison 25 Ketoconazole vs placebo ‐ Subgroup analysis by dose, Outcome 9 Side effects.

Comparison 26 Ketoconazole vs steroids ‐ Subgroup analysis by dose, Outcome 1 Failure to achieve complete resolution.

Comparison 26 Ketoconazole vs steroids ‐ Subgroup analysis by dose, Outcome 2 Failure to achieve complete resolution (long term).

Comparison 26 Ketoconazole vs steroids ‐ Subgroup analysis by dose, Outcome 3 Erythema ‐ Failure to achieve complete resolution.

Comparison 26 Ketoconazole vs steroids ‐ Subgroup analysis by dose, Outcome 4 Decrease in scaling score.

Comparison 27 Ketoconazole vs placebo ‐ Subgroup analysis by mode of delivery, Outcome 1 Failure to achieve complete resolution.

Comparison 27 Ketoconazole vs placebo ‐ Subgroup analysis by mode of delivery, Outcome 2 Decrease in erythema score.

Comparison 27 Ketoconazole vs placebo ‐ Subgroup analysis by mode of delivery, Outcome 3 Erythema ‐ Failure to achieve complete resolution.

Comparison 27 Ketoconazole vs placebo ‐ Subgroup analysis by mode of delivery, Outcome 4 Decrease in pruritus score.

Comparison 27 Ketoconazole vs placebo ‐ Subgroup analysis by mode of delivery, Outcome 5 Decrease in scaling score.

Comparison 27 Ketoconazole vs placebo ‐ Subgroup analysis by mode of delivery, Outcome 6 Decrease in scaling score (long term).

Comparison 27 Ketoconazole vs placebo ‐ Subgroup analysis by mode of delivery, Outcome 7 Side effects.

Comparison 28 Ketoconazole vs steroids ‐ Subgroup analysis by mode of delivery, Outcome 1 Failure to achieve complete resolution.

Comparison 28 Ketoconazole vs steroids ‐ Subgroup analysis by mode of delivery, Outcome 2 Decrease in scaling score.
| Ketoconazole compared with placebo for seborrhoeic dermatitis | ||||||
| Patient or population: patients with seborrhoeic dermatitis | ||||||
| Outcomes | Illustrative comparative risks* (95% CI) | Relative effect | Number of participants | Quality of the evidence | Comments | |
| Assumed risk | Corresponding risk | |||||
| Placebo | Ketoconazole | |||||
| Failure to achieve complete resolution | Study population | RR 0.69 | 2520 | ⊕⊝⊝⊝ | ||
| 724 per 1000 | 500 per 1000 | |||||
| Moderate | ||||||
| 686 per 1000 | 473 per 1000 | |||||
| Side effects | Study population | RR 0.97 | 988 | ⊕⊝⊝⊝ | ||
| 162 per 1000 | 157 per 1000 | |||||
| Moderate | ||||||
| 175 per 1000 | 170 per 1000 | |||||
| *The basis for the assumed risk (e.g. median control group risk across studies) is provided in footnotes. The corresponding risk (and its 95% confidence interval) is based on the assumed risk in the comparison group and the relative effect of the intervention (and its 95% CI). | ||||||
| GRADE Working Group grades of evidence. | ||||||
| aDowngraded 1 level because most studies were at high or unclear risk of bias. | ||||||
| Ketoconazole compared with steroids for seborrhoeic dermatitis | ||||||
| Patient or population: patients with seborrhoeic dermatitis | ||||||
| Outcomes | Illustrative comparative risks* (95% CI) | Relative effect | Number of participants | Quality of the evidence | Comments | |
| Assumed risk | Corresponding risk | |||||
| Steroids | Ketoconazole | |||||
| Failure to achieve complete resolution (combined for face and scalp) | Study population | RR 1.17 | 302 | ⊕⊕⊝⊝ | ||
| 414 per 1000 | 484 per 1000 | |||||
| Moderate | ||||||
| 335 per 1000 | 392 per 1000 | |||||
| Failure to achieve complete resolution (long term, combined for face and scalp) | See comment | See comment | Not estimable | 80 | ⊕⊝⊝⊝ | Studies could not be combined because of high heterogeneity |
| Side effects (combined for face and scalp) | Study population | RR 0.56 | 596 | ⊕⊕⊕⊝ | ||
| 95 per 1000 | 53 per 1000 | |||||
| Moderate | ||||||
| 48 per 1000 | 27 per 1000 | |||||
| *The basis for the assumed risk (e.g. median control group risk across studies) is provided in footnotes. The corresponding risk (and its 95% confidence interval) is based on the assumed risk in the comparison group and the relative effect of the intervention (and its 95% CI). | ||||||
| GRADE Working Group grades of evidence. | ||||||
| aDowngraded 1 level because most studies were at high or unclear risk of bias. | ||||||
| Ketoconazole compared with ciclopirox for seborrhoeic dermatitis | ||||||
| Patient or population: patients with seborrhoeic dermatitis | ||||||
| Outcomes | Illustrative comparative risks* (95% CI) | Relative effect | Number of participants | Quality of the evidence | Comments | |
| Assumed risk | Corresponding risk | |||||
| Ciclopirox | Ketoconazole | |||||
| Failure to achieve complete resolution ‐ Face only | Study population | RR 1.09 | 447 | ⊕⊕⊝⊝ | ||
| 583 per 1000 | 636 per 1000 | |||||
| Moderate | ||||||
| 630 per 1000 | 687 per 1000 | |||||
| Failure to achieve complete resolution (long term) ‐ Face only | Study population | RR 1.16 | 339 | ⊕⊕⊝⊝ | ||
| 566 per 1000 | 657 per 1000 | |||||
| Moderate | ||||||
| 710 per 1000 | 824 per 1000 | |||||
| Side effects ‐ Scalp only | Study population | RR 1.35 | 603 | ⊕⊝⊝⊝ | ||
| 125 per 1000 | 169 per 1000 | |||||
| Moderate | ||||||
| 124 per 1000 | 167 per 1000 | |||||
| *The basis for the assumed risk (e.g. median control group risk across studies) is provided in footnotes. The corresponding risk (and its 95% confidence interval) is based on the assumed risk in the comparison group and the relative effect of the intervention (and its 95% CI). | ||||||
| GRADE Working Group grades of evidence. | ||||||
| aDowngraded 1 level because most studies had high or unclear risk of bias. | ||||||
| Ciclopirox compared with placebo for seborrhoeic dermatitis | ||||||
| Patient or population: patients with seborrhoeic dermatitis | ||||||
| Outcomes | Illustrative comparative risks* (95% CI) | Relative effect | Number of participants | Quality of the evidence | Comments | |
| Assumed risk | Corresponding risk | |||||
| Placebo | Ciclopirox | |||||
| Failure to achieve complete resolution (combined for face and scalp) | Study population | RR 0.79 | 1525 | ⊕⊕⊕⊝ | ||
| 788 per 1000 | 623 per 1000 | |||||
| Moderate | ||||||
| 736 per 1000 | 581 per 1000 | |||||
| Side effects (combined for face and scalp) | Study population | RR 0.9 | 908 | ⊕⊕⊕⊝ | ||
| 279 per 1000 | 251 per 1000 | |||||
| Moderate | ||||||
| 266 per 1000 | 239 per 1000 | |||||
| *The basis for the assumed risk (e.g. median control group risk across studies) is provided in footnotes. The corresponding risk (and its 95% confidence interval) is based on the assumed risk in the comparison group and the relative effect of the intervention (and its 95% CI). | ||||||
| GRADE Working Group grades of evidence. | ||||||
| aDowngraded 1 level because of high heterogeneity (I² > 75%). | ||||||
| Comparison | Risk of bias | Consistency | Directness | Precision | Publication bias | Grade quality |
| Ketoconazole vs placebo | Most studies had unclear risk of bias: Downgrade 1 level | High heterogeneity | No indirect comparison: no downgrading | 2520 participants, no overlap with 1: no downgrading | Funnel plot does not indicate publication bias: no downgrading | Low: downgraded for risk of bias, consistency |
| Ketoconazole vs steroids | Most studies had unclear risk of bias: Downgrade 1 level | Consistent: no downgrading | No indirect comparison: no downgrading | 302 participants. CI overlaps with RR = 1 and RR = 1.25: Downgrade 1 level | Funnel plot does not indicate publication bias: no downgrading | Low: downgraded for risk of bias, precision |
| Ketoconazole vs ciclopirox | Most studies had unclear risk of bias: Downgrade 1 level | Consistent: no downgrading | No indirect comparison: no downgrading | 272 participants. CI overlaps with RR = 1 and RR = 1.25: Downgrade 1 level | Funnel plot does not indicate publication bias: no downgrading | Low: downgraded for risk of bias, precision |
| Ciclopirox vs placebo | Most studies had low or unclear risk of bias: Downgrade 1 level | High heterogeneity | No indirect comparison: no downgrading | 1525 participants, no overlap with 1: no downgrading | Funnel plot does not indicate publication bias: no downgrading | Low: downgraded for risk of bias, consistency |
| Outcome or subgroup title | No. of studies | No. of participants | Statistical method | Effect size |
| 1 Failure to achieve complete resolution Show forest plot | 8 | 2520 | Risk Ratio (M‐H, Random, 95% CI) | 0.69 [0.59, 0.81] |
| 1.1 Scalp only | 2 | 228 | Risk Ratio (M‐H, Random, 95% CI) | 0.71 [0.31, 1.61] |
| 1.2 Face and scalp | 3 | 2132 | Risk Ratio (M‐H, Random, 95% CI) | 0.72 [0.61, 0.84] |
| 1.3 Face only | 3 | 160 | Risk Ratio (M‐H, Random, 95% CI) | 0.73 [0.51, 1.05] |
| 2 Decrease in erythema score Show forest plot | 2 | Std. Mean Difference (IV, Random, 95% CI) | Totals not selected | |
| 2.1 Scalp only | 1 | Std. Mean Difference (IV, Random, 95% CI) | 0.0 [0.0, 0.0] | |
| 2.2 Face and scalp | 1 | Std. Mean Difference (IV, Random, 95% CI) | 0.0 [0.0, 0.0] | |
| 3 Decrease in erythema score (long term) Show forest plot | 1 | Std. Mean Difference (IV, Random, 95% CI) | Totals not selected | |
| 3.1 Scalp only | 1 | Std. Mean Difference (IV, Random, 95% CI) | 0.0 [0.0, 0.0] | |
| 4 Erythema ‐ Failure to achieve complete resolution Show forest plot | 2 | Risk Ratio (M‐H, Fixed, 95% CI) | Totals not selected | |
| 4.1 Face only | 1 | Risk Ratio (M‐H, Fixed, 95% CI) | 0.0 [0.0, 0.0] | |
| 4.2 Scalp only | 1 | Risk Ratio (M‐H, Fixed, 95% CI) | 0.0 [0.0, 0.0] | |
| 5 Decrease in pruritus score Show forest plot | 2 | Std. Mean Difference (IV, Fixed, 95% CI) | Totals not selected | |
| 5.1 Scalp only | 1 | Std. Mean Difference (IV, Fixed, 95% CI) | 0.0 [0.0, 0.0] | |
| 5.2 Face and scalp | 1 | Std. Mean Difference (IV, Fixed, 95% CI) | 0.0 [0.0, 0.0] | |
| 6 Decrease in pruritus (long term) Show forest plot | 1 | Mean Difference (IV, Random, 95% CI) | Totals not selected | |
| 6.1 Scalp only | 1 | Mean Difference (IV, Random, 95% CI) | 0.0 [0.0, 0.0] | |
| 7 Pruritus ‐ Failure to achieve complete resolution Show forest plot | 2 | 75 | Risk Ratio (M‐H, Fixed, 95% CI) | 0.38 [0.21, 0.69] |
| 7.1 Scalp | 1 | 16 | Risk Ratio (M‐H, Fixed, 95% CI) | 0.26 [0.07, 0.91] |
| 7.2 Face only | 1 | 59 | Risk Ratio (M‐H, Fixed, 95% CI) | 0.43 [0.22, 0.83] |
| 8 Decrease in scaling score Show forest plot | 3 | Mean Difference (IV, Fixed, 95% CI) | Totals not selected | |
| 8.1 Scalp only | 2 | Mean Difference (IV, Fixed, 95% CI) | 0.0 [0.0, 0.0] | |
| 8.2 Face and scalp | 1 | Mean Difference (IV, Fixed, 95% CI) | 0.0 [0.0, 0.0] | |
| 9 Decrease in scaling (long term) Show forest plot | 2 | Mean Difference (IV, Fixed, 95% CI) | Totals not selected | |
| 9.1 Scalp only | 2 | Mean Difference (IV, Fixed, 95% CI) | 0.0 [0.0, 0.0] | |
| 10 Scaling ‐ Failure to achieve complete resolution Show forest plot | 3 | 284 | Risk Ratio (M‐H, Random, 95% CI) | 0.56 [0.29, 1.06] |
| 10.1 Scalp only | 2 | 216 | Risk Ratio (M‐H, Random, 95% CI) | 0.77 [0.67, 0.87] |
| 10.2 Face only | 1 | 68 | Risk Ratio (M‐H, Random, 95% CI) | 0.22 [0.09, 0.52] |
| 11 Side effects Show forest plot | 6 | 988 | Risk Ratio (M‐H, Random, 95% CI) | 0.97 [0.58, 1.64] |
| 11.1 Scalp only | 3 | 440 | Risk Ratio (M‐H, Random, 95% CI) | 1.27 [0.47, 3.45] |
| 11.2 Face only | 3 | 548 | Risk Ratio (M‐H, Random, 95% CI) | 0.78 [0.54, 1.13] |
| Outcome or subgroup title | No. of studies | No. of participants | Statistical method | Effect size |
| 1 Failure to achieve complete resolution Show forest plot | 6 | 302 | Risk Ratio (M‐H, Fixed, 95% CI) | 1.17 [0.95, 1.44] |
| 1.1 Scalp only | 2 | 118 | Risk Ratio (M‐H, Fixed, 95% CI) | 1.17 [0.97, 1.42] |
| 1.2 Face and scalp | 2 | 113 | Risk Ratio (M‐H, Fixed, 95% CI) | 1.85 [0.90, 3.79] |
| 1.3 Face only | 2 | 71 | Risk Ratio (M‐H, Fixed, 95% CI) | 0.68 [0.32, 1.47] |
| 2 Failure to achieve complete resolution (long term) Show forest plot | 2 | Risk Ratio (M‐H, Random, 95% CI) | Totals not selected | |
| 2.1 28% per week | 1 | Risk Ratio (M‐H, Random, 95% CI) | 0.0 [0.0, 0.0] | |
| 2.2 2% to 7% per week | 1 | Risk Ratio (M‐H, Random, 95% CI) | 0.0 [0.0, 0.0] | |
| 3 Decrease in erythema score Show forest plot | 3 | 190 | Std. Mean Difference (IV, Fixed, 95% CI) | ‐0.01 [‐0.30, 0.28] |
| 3.1 Face only | 1 | 40 | Std. Mean Difference (IV, Fixed, 95% CI) | ‐0.11 [‐0.73, 0.51] |
| 3.2 Scalp only | 2 | 150 | Std. Mean Difference (IV, Fixed, 95% CI) | 0.02 [‐0.30, 0.34] |
| 4 Decrease in erythema score (long term) Show forest plot | 1 | Mean Difference (IV, Fixed, 95% CI) | Totals not selected | |
| 4.1 Scalp only | 1 | Mean Difference (IV, Fixed, 95% CI) | 0.0 [0.0, 0.0] | |
| 5 Erythema ‐ Failure to achieve complete resolution Show forest plot | 2 | 195 | Risk Ratio (M‐H, Random, 95% CI) | 0.51 [0.19, 1.38] |
| 5.1 Face and scalp | 1 | 53 | Risk Ratio (M‐H, Random, 95% CI) | 0.24 [0.06, 1.03] |
| 5.2 Scalp only | 1 | 142 | Risk Ratio (M‐H, Random, 95% CI) | 0.71 [0.44, 1.14] |
| 6 Decrease in pruritus score Show forest plot | 4 | 259 | Std. Mean Difference (IV, Fixed, 95% CI) | 0.15 [‐0.09, 0.40] |
| 6.1 Face only | 1 | 40 | Std. Mean Difference (IV, Fixed, 95% CI) | ‐0.14 [‐0.76, 0.48] |
| 6.2 Scalp only | 3 | 219 | Std. Mean Difference (IV, Fixed, 95% CI) | 0.20 [‐0.06, 0.47] |
| 7 Decrease in pruritus (long term) Show forest plot | 1 | Mean Difference (IV, Fixed, 95% CI) | Totals not selected | |
| 7.1 Scalp only | 1 | Mean Difference (IV, Fixed, 95% CI) | 0.0 [0.0, 0.0] | |
| 8 Pruritus ‐ Failure to achieve complete resolution Show forest plot | 2 | 215 | Risk Ratio (M‐H, Fixed, 95% CI) | 0.53 [0.34, 0.84] |
| 8.1 Face and scalp | 1 | 53 | Risk Ratio (M‐H, Fixed, 95% CI) | 0.28 [0.06, 1.20] |
| 8.2 Scalp only | 1 | 162 | Risk Ratio (M‐H, Fixed, 95% CI) | 0.59 [0.37, 0.95] |
| 9 Decrease in scaling score Show forest plot | 5 | 329 | Std. Mean Difference (IV, Random, 95% CI) | 0.19 [‐0.13, 0.51] |
| 9.1 Face only | 1 | 40 | Std. Mean Difference (IV, Random, 95% CI) | ‐0.32 [‐0.95, 0.30] |
| 9.2 Scalp only | 3 | 219 | Std. Mean Difference (IV, Random, 95% CI) | 0.32 [‐0.12, 0.77] |
| 9.3 Face and scalp | 1 | 70 | Std. Mean Difference (IV, Random, 95% CI) | 0.19 [‐0.28, 0.66] |
| 10 Decrease in scaling score (long term) Show forest plot | 2 | 112 | Std. Mean Difference (IV, Fixed, 95% CI) | 0.71 [0.31, 1.11] |
| 10.1 Scalp only | 1 | 49 | Std. Mean Difference (IV, Fixed, 95% CI) | 1.96 [1.27, 2.65] |
| 10.2 Face and scalp | 1 | 63 | Std. Mean Difference (IV, Fixed, 95% CI) | 0.08 [‐0.42, 0.57] |
| 11 Scaling ‐ Failure to achieve complete resolution Show forest plot | 2 | 215 | Risk Ratio (M‐H, Fixed, 95% CI) | 0.78 [0.54, 1.12] |
| 11.1 Face and scalp | 1 | 53 | Risk Ratio (M‐H, Fixed, 95% CI) | 0.53 [0.21, 1.39] |
| 11.2 Scalp only | 1 | 162 | Risk Ratio (M‐H, Fixed, 95% CI) | 0.84 [0.57, 1.25] |
| 12 Side effects Show forest plot | 8 | 596 | Risk Ratio (M‐H, Fixed, 95% CI) | 0.56 [0.32, 0.96] |
| 12.1 Scalp only | 4 | 381 | Risk Ratio (M‐H, Fixed, 95% CI) | 0.81 [0.34, 1.93] |
| 12.2 Face and scalp | 3 | 175 | Risk Ratio (M‐H, Fixed, 95% CI) | 0.36 [0.17, 0.78] |
| 12.3 Face only | 1 | 40 | Risk Ratio (M‐H, Fixed, 95% CI) | 3.0 [0.13, 69.52] |
| Outcome or subgroup title | No. of studies | No. of participants | Statistical method | Effect size |
| 1 Failure to achieve complete resolution Show forest plot | 1 | Risk Ratio (M‐H, Fixed, 95% CI) | Totals not selected | |
| 1.1 Scalp only | 1 | Risk Ratio (M‐H, Fixed, 95% CI) | 0.0 [0.0, 0.0] | |
| 2 Failure to achieve complete resolution (long term) Show forest plot | 1 | Risk Ratio (M‐H, Fixed, 95% CI) | Totals not selected | |
| 2.1 Scalp only | 1 | Risk Ratio (M‐H, Fixed, 95% CI) | 0.0 [0.0, 0.0] | |
| 3 Decrease in scaling score Show forest plot | 2 | Mean Difference (IV, Random, 95% CI) | Totals not selected | |
| 3.1 Scalp only | 2 | Mean Difference (IV, Random, 95% CI) | 0.0 [0.0, 0.0] | |
| 4 Decrease in scaling score (long term) Show forest plot | 1 | Mean Difference (IV, Fixed, 95% CI) | Totals not selected | |
| 4.1 Scalp only | 1 | Mean Difference (IV, Fixed, 95% CI) | 0.0 [0.0, 0.0] | |
| 5 Side effects Show forest plot | 1 | Odds Ratio (M‐H, Fixed, 95% CI) | Totals not selected | |
| 5.1 Scalp only | 1 | Odds Ratio (M‐H, Fixed, 95% CI) | 0.0 [0.0, 0.0] | |
| Outcome or subgroup title | No. of studies | No. of participants | Statistical method | Effect size |
| 1 Failure to achieve complete resolution Show forest plot | 3 | Risk Ratio (M‐H, Fixed, 95% CI) | Subtotals only | |
| 1.1 Face only | 3 | 447 | Risk Ratio (M‐H, Fixed, 95% CI) | 1.09 [0.95, 1.26] |
| 2 Failure to achieve complete resolution (long term) Show forest plot | 2 | Risk Ratio (M‐H, Random, 95% CI) | Subtotals only | |
| 2.1 Face only | 2 | 339 | Risk Ratio (M‐H, Random, 95% CI) | 1.10 [0.88, 1.36] |
| 3 Decrease in erythema score Show forest plot | 1 | Mean Difference (IV, Fixed, 95% CI) | Totals not selected | |
| 3.1 Scalp only | 1 | Mean Difference (IV, Fixed, 95% CI) | 0.0 [0.0, 0.0] | |
| 4 Decrease in erythema score (long term) Show forest plot | 1 | Mean Difference (IV, Fixed, 95% CI) | Totals not selected | |
| 4.1 Scalp only | 1 | Mean Difference (IV, Fixed, 95% CI) | 0.0 [0.0, 0.0] | |
| 5 Erythema ‐ Failure to achieve complete resolution Show forest plot | 1 | Risk Ratio (M‐H, Fixed, 95% CI) | Totals not selected | |
| 5.1 Scalp only | 1 | Risk Ratio (M‐H, Fixed, 95% CI) | 0.0 [0.0, 0.0] | |
| 6 Decrease in pruritus score Show forest plot | 1 | Mean Difference (IV, Random, 95% CI) | Totals not selected | |
| 6.1 Scalp only | 1 | Mean Difference (IV, Random, 95% CI) | 0.0 [0.0, 0.0] | |
| 7 Decrease in pruritus score (long term) Show forest plot | 2 | Mean Difference (IV, Fixed, 95% CI) | Totals not selected | |
| 7.1 Scalp only | 2 | Mean Difference (IV, Fixed, 95% CI) | 0.0 [0.0, 0.0] | |
| 8 Decrease in scaling score Show forest plot | 2 | Mean Difference (IV, Random, 95% CI) | Totals not selected | |
| 8.1 Scalp only | 2 | Mean Difference (IV, Random, 95% CI) | 0.0 [0.0, 0.0] | |
| 9 Decrease in scaling score (long term) Show forest plot | 2 | Mean Difference (IV, Fixed, 95% CI) | Totals not selected | |
| 9.1 Scalp only | 2 | Mean Difference (IV, Fixed, 95% CI) | 0.0 [0.0, 0.0] | |
| 10 Scaling ‐ Failure to achieve complete resolution Show forest plot | 1 | Risk Ratio (M‐H, Fixed, 95% CI) | Totals not selected | |
| 10.1 Scalp only | 1 | Risk Ratio (M‐H, Fixed, 95% CI) | 0.0 [0.0, 0.0] | |
| 11 Side effects Show forest plot | 2 | Risk Ratio (M‐H, Random, 95% CI) | Subtotals only | |
| 11.1 Scalp only | 2 | 603 | Risk Ratio (M‐H, Random, 95% CI) | 1.35 [0.54, 3.38] |
| Outcome or subgroup title | No. of studies | No. of participants | Statistical method | Effect size |
| 1 Failure to achieve complete resolution Show forest plot | 1 | Risk Ratio (M‐H, Fixed, 95% CI) | Totals not selected | |
| 1.1 Scalp only | 1 | Risk Ratio (M‐H, Fixed, 95% CI) | 0.0 [0.0, 0.0] | |
| 2 Decrease in pruritus score Show forest plot | 1 | Mean Difference (IV, Fixed, 95% CI) | Totals not selected | |
| 2.1 Scalp only | 1 | Mean Difference (IV, Fixed, 95% CI) | 0.0 [0.0, 0.0] | |
| 3 Side effects Show forest plot | 1 | Risk Ratio (M‐H, Fixed, 95% CI) | Totals not selected | |
| 3.1 Scalp only | 1 | Risk Ratio (M‐H, Fixed, 95% CI) | 0.0 [0.0, 0.0] | |
| Outcome or subgroup title | No. of studies | No. of participants | Statistical method | Effect size |
| 1 Failure to achieve complete resolution (long term) Show forest plot | 1 | Risk Ratio (M‐H, Fixed, 95% CI) | Totals not selected | |
| 1.1 Scalp only | 1 | Risk Ratio (M‐H, Fixed, 95% CI) | 0.0 [0.0, 0.0] | |
| 2 Erythema ‐ Failure to achieve complete resolution Show forest plot | 1 | Risk Ratio (M‐H, Fixed, 95% CI) | Totals not selected | |
| 2.1 Scalp only | 1 | Risk Ratio (M‐H, Fixed, 95% CI) | 0.0 [0.0, 0.0] | |
| 3 Erythema ‐ Failure to achieve complete resolution (long term) Show forest plot | 1 | Risk Ratio (M‐H, Fixed, 95% CI) | Totals not selected | |
| 3.1 Scalp only | 1 | Risk Ratio (M‐H, Fixed, 95% CI) | 0.0 [0.0, 0.0] | |
| 4 Scaling ‐ Erythema ‐ Failure to achieve complete resolution Show forest plot | 1 | Risk Ratio (M‐H, Fixed, 95% CI) | Totals not selected | |
| 4.1 Scalp only | 1 | Risk Ratio (M‐H, Fixed, 95% CI) | 0.0 [0.0, 0.0] | |
| 5 Scaling ‐ Erythema ‐ Failure to achieve complete resolution (long term) Show forest plot | 1 | Risk Ratio (M‐H, Fixed, 95% CI) | Totals not selected | |
| 5.1 Scalp only | 1 | Risk Ratio (M‐H, Fixed, 95% CI) | 0.0 [0.0, 0.0] | |
| Outcome or subgroup title | No. of studies | No. of participants | Statistical method | Effect size |
| 1 Failure to achieve complete resolution Show forest plot | 1 | Risk Ratio (M‐H, Fixed, 95% CI) | Totals not selected | |
| 1.1 Scalp only | 1 | Risk Ratio (M‐H, Fixed, 95% CI) | 0.0 [0.0, 0.0] | |
| Outcome or subgroup title | No. of studies | No. of participants | Statistical method | Effect size |
| 1 Decrease in erythema score (long term) Show forest plot | 1 | Mean Difference (IV, Fixed, 95% CI) | Totals not selected | |
| 1.1 Face and scalp | 1 | Mean Difference (IV, Fixed, 95% CI) | 0.0 [0.0, 0.0] | |
| 2 Decrease in scaling score (long term) Show forest plot | 1 | Mean Difference (IV, Fixed, 95% CI) | Totals not selected | |
| 2.1 Face and scalp | 1 | Mean Difference (IV, Fixed, 95% CI) | 0.0 [0.0, 0.0] | |
| 3 Side effects Show forest plot | 1 | Risk Ratio (M‐H, Fixed, 95% CI) | Totals not selected | |
| 3.1 Face and scalp | 1 | Risk Ratio (M‐H, Fixed, 95% CI) | 0.0 [0.0, 0.0] | |
| Outcome or subgroup title | No. of studies | No. of participants | Statistical method | Effect size |
| 1 Failure to achieve complete resolution Show forest plot | 1 | Risk Ratio (M‐H, Fixed, 95% CI) | Totals not selected | |
| 1.1 Face only | 1 | Risk Ratio (M‐H, Fixed, 95% CI) | 0.0 [0.0, 0.0] | |
| 2 Failure to achieve complete resolution (long term) Show forest plot | 1 | Risk Ratio (M‐H, Fixed, 95% CI) | Totals not selected | |
| 2.1 Face only | 1 | Risk Ratio (M‐H, Fixed, 95% CI) | 0.0 [0.0, 0.0] | |
| 3 Erythema ‐ Failure to achieve complete resolution Show forest plot | 1 | Risk Ratio (M‐H, Fixed, 95% CI) | Totals not selected | |
| 3.1 Face only | 1 | Risk Ratio (M‐H, Fixed, 95% CI) | 0.0 [0.0, 0.0] | |
| 4 Erythema ‐ Failure to achieve complete resolution (long term) Show forest plot | 1 | Risk Ratio (M‐H, Fixed, 95% CI) | Totals not selected | |
| 4.1 Face only | 1 | Risk Ratio (M‐H, Fixed, 95% CI) | 0.0 [0.0, 0.0] | |
| 5 Pruritus ‐ Failure to achieve complete resolution Show forest plot | 1 | Risk Ratio (M‐H, Fixed, 95% CI) | Totals not selected | |
| 5.1 Face only | 1 | Risk Ratio (M‐H, Fixed, 95% CI) | 0.0 [0.0, 0.0] | |
| 6 Pruritus ‐ Failure to achieve complete resolution (long term) Show forest plot | 1 | Risk Ratio (M‐H, Fixed, 95% CI) | Totals not selected | |
| 6.1 Face only | 1 | Risk Ratio (M‐H, Fixed, 95% CI) | 0.0 [0.0, 0.0] | |
| 7 Scaling ‐ Failure to achieve complete resolution Show forest plot | 1 | Risk Ratio (M‐H, Fixed, 95% CI) | Totals not selected | |
| 7.1 Face only | 1 | Risk Ratio (M‐H, Fixed, 95% CI) | 0.0 [0.0, 0.0] | |
| 8 Scaling ‐ Failure to achieve complete resolution (long term) Show forest plot | 1 | Risk Ratio (M‐H, Fixed, 95% CI) | Totals not selected | |
| 8.1 Face only | 1 | Risk Ratio (M‐H, Fixed, 95% CI) | 0.0 [0.0, 0.0] | |
| 9 Side effects Show forest plot | 1 | Risk Ratio (M‐H, Fixed, 95% CI) | Totals not selected | |
| 9.1 Face only | 1 | Risk Ratio (M‐H, Fixed, 95% CI) | 0.0 [0.0, 0.0] | |
| Outcome or subgroup title | No. of studies | No. of participants | Statistical method | Effect size |
| 1 Decrease in scaling score Show forest plot | 1 | Mean Difference (IV, Fixed, 95% CI) | Totals not selected | |
| 1.1 Scalp only | 1 | Mean Difference (IV, Fixed, 95% CI) | 0.0 [0.0, 0.0] | |
| Outcome or subgroup title | No. of studies | No. of participants | Statistical method | Effect size |
| 1 Failure to achieve complete resolution Show forest plot | 1 | Risk Ratio (M‐H, Fixed, 95% CI) | Totals not selected | |
| 1.1 Face | 1 | Risk Ratio (M‐H, Fixed, 95% CI) | 0.0 [0.0, 0.0] | |
| 2 Failure to achieve complete resolution (long term) Show forest plot | 1 | Risk Ratio (M‐H, Fixed, 95% CI) | Totals not selected | |
| 2.1 Face | 1 | Risk Ratio (M‐H, Fixed, 95% CI) | 0.0 [0.0, 0.0] | |
| Outcome or subgroup title | No. of studies | No. of participants | Statistical method | Effect size |
| 1 Failure to achieve complete resolution Show forest plot | 1 | Risk Ratio (M‐H, Fixed, 95% CI) | Totals not selected | |
| 1.1 Face and scalp | 1 | Risk Ratio (M‐H, Fixed, 95% CI) | 0.0 [0.0, 0.0] | |
| 2 Erythema ‐ Failure to achieve complete resolution Show forest plot | 1 | Risk Ratio (M‐H, Fixed, 95% CI) | Totals not selected | |
| 2.1 Face and scalp | 1 | Risk Ratio (M‐H, Fixed, 95% CI) | 0.0 [0.0, 0.0] | |
| 3 Pruritus ‐ Failure to achieve complete resolution Show forest plot | 1 | Risk Ratio (M‐H, Fixed, 95% CI) | Totals not selected | |
| 3.1 Face and scalp | 1 | Risk Ratio (M‐H, Fixed, 95% CI) | 0.0 [0.0, 0.0] | |
| 4 Scaling ‐ Failure to achieve complete resolution Show forest plot | 1 | Risk Ratio (M‐H, Fixed, 95% CI) | Totals not selected | |
| 4.1 Face and scalp | 1 | Risk Ratio (M‐H, Fixed, 95% CI) | 0.0 [0.0, 0.0] | |
| Outcome or subgroup title | No. of studies | No. of participants | Statistical method | Effect size |
| 1 Failure to achieve complete resolution Show forest plot | 1 | Risk Ratio (M‐H, Random, 95% CI) | Totals not selected | |
| 1.1 Scalp only | 1 | Risk Ratio (M‐H, Random, 95% CI) | 0.0 [0.0, 0.0] | |
| 2 Failure to achieve complete resolution (long term) Show forest plot | 1 | Risk Ratio (M‐H, Fixed, 95% CI) | Totals not selected | |
| 2.1 Scalp only | 1 | Risk Ratio (M‐H, Fixed, 95% CI) | 0.0 [0.0, 0.0] | |
| Outcome or subgroup title | No. of studies | No. of participants | Statistical method | Effect size |
| 1 Failure to achieve complete resolution Show forest plot | 1 | Risk Ratio (M‐H, Fixed, 95% CI) | Totals not selected | |
| 1.1 Face only | 1 | Risk Ratio (M‐H, Fixed, 95% CI) | 0.0 [0.0, 0.0] | |
| 2 Failure to achieve complete resolution (long term) Show forest plot | 1 | Risk Ratio (M‐H, Fixed, 95% CI) | Totals not selected | |
| 2.1 Scalp only | 1 | Risk Ratio (M‐H, Fixed, 95% CI) | 0.0 [0.0, 0.0] | |
| 3 Decrease in erythema score Show forest plot | 1 | Mean Difference (IV, Fixed, 95% CI) | Totals not selected | |
| 3.1 Face only | 1 | Mean Difference (IV, Fixed, 95% CI) | 0.0 [0.0, 0.0] | |
| 4 Decrease in erythema score (long term) Show forest plot | 1 | Mean Difference (IV, Fixed, 95% CI) | Totals not selected | |
| 4.1 Scalp only | 1 | Mean Difference (IV, Fixed, 95% CI) | 0.0 [0.0, 0.0] | |
| 5 Decrease in pruritus score Show forest plot | 1 | Mean Difference (IV, Fixed, 95% CI) | Totals not selected | |
| 5.1 Face only | 1 | Mean Difference (IV, Fixed, 95% CI) | 0.0 [0.0, 0.0] | |
| 6 Decrease in pruritus score (long term) Show forest plot | 1 | Mean Difference (IV, Fixed, 95% CI) | Totals not selected | |
| 6.1 Scalp only | 1 | Mean Difference (IV, Fixed, 95% CI) | 0.0 [0.0, 0.0] | |
| 7 Decrease in scaling score Show forest plot | 1 | Mean Difference (IV, Fixed, 95% CI) | Totals not selected | |
| 7.1 Face only | 1 | Mean Difference (IV, Fixed, 95% CI) | 0.0 [0.0, 0.0] | |
| 8 Decrease in scaling score (long term) Show forest plot | 1 | Mean Difference (IV, Fixed, 95% CI) | Totals not selected | |
| 8.1 Scalp only | 1 | Mean Difference (IV, Fixed, 95% CI) | 0.0 [0.0, 0.0] | |
| 9 Side effects Show forest plot | 2 | 136 | Risk Ratio (M‐H, Fixed, 95% CI) | 2.19 [0.75, 6.37] |
| 9.1 Scalp only | 1 | 44 | Risk Ratio (M‐H, Fixed, 95% CI) | 5.0 [0.25, 98.52] |
| 9.2 Face only | 1 | 92 | Risk Ratio (M‐H, Fixed, 95% CI) | 1.83 [0.57, 5.82] |
| Outcome or subgroup title | No. of studies | No. of participants | Statistical method | Effect size |
| 1 Decrease in erythema score Show forest plot | 1 | Mean Difference (IV, Fixed, 95% CI) | Totals not selected | |
| 1.1 Face | 1 | Mean Difference (IV, Fixed, 95% CI) | 0.0 [0.0, 0.0] | |
| 2 Decrease in pruritus score Show forest plot | 1 | Mean Difference (IV, Fixed, 95% CI) | Totals not selected | |
| 2.1 Face | 1 | Mean Difference (IV, Fixed, 95% CI) | 0.0 [0.0, 0.0] | |
| 3 Decrease in scaling score Show forest plot | 1 | Mean Difference (IV, Fixed, 95% CI) | Totals not selected | |
| 3.1 Face | 1 | Mean Difference (IV, Fixed, 95% CI) | 0.0 [0.0, 0.0] | |
| Outcome or subgroup title | No. of studies | No. of participants | Statistical method | Effect size |
| 1 Failure to achieve complete resolution Show forest plot | 1 | Risk Ratio (M‐H, Fixed, 95% CI) | Totals not selected | |
| 1.1 Scalp only | 1 | Risk Ratio (M‐H, Fixed, 95% CI) | 0.0 [0.0, 0.0] | |
| 2 Failure to achieve complete resolution (long term) Show forest plot | 1 | Risk Ratio (M‐H, Fixed, 95% CI) | Totals not selected | |
| 2.1 Scalp only | 1 | Risk Ratio (M‐H, Fixed, 95% CI) | 0.0 [0.0, 0.0] | |
| Outcome or subgroup title | No. of studies | No. of participants | Statistical method | Effect size |
| 1 Itching ‐ Failure to achieve complete resolution Show forest plot | 1 | Risk Ratio (M‐H, Fixed, 95% CI) | Totals not selected | |
| 1.1 Scalp | 1 | Risk Ratio (M‐H, Fixed, 95% CI) | 0.0 [0.0, 0.0] | |
| 2 Scaling ‐ Failure to achieve complete resolution Show forest plot | 1 | Risk Ratio (M‐H, Fixed, 95% CI) | Totals not selected | |
| 2.1 Scalp | 1 | Risk Ratio (M‐H, Fixed, 95% CI) | 0.0 [0.0, 0.0] | |
| Outcome or subgroup title | No. of studies | No. of participants | Statistical method | Effect size |
| 1 Failure to achieve complete resolution Show forest plot | 8 | 1525 | Risk Ratio (M‐H, Random, 95% CI) | 0.79 [0.67, 0.94] |
| 1.1 Scalp only | 5 | 1095 | Risk Ratio (M‐H, Random, 95% CI) | 0.86 [0.68, 1.09] |
| 1.2 Face only | 3 | 430 | Risk Ratio (M‐H, Random, 95% CI) | 0.67 [0.51, 0.89] |
| 2 Failure to achieve complete resolution (long term) Show forest plot | 1 | Risk Ratio (M‐H, Fixed, 95% CI) | Totals not selected | |
| 2.1 Scalp only | 1 | Risk Ratio (M‐H, Fixed, 95% CI) | 0.0 [0.0, 0.0] | |
| 3 Decrease in erythema score Show forest plot | 2 | Std. Mean Difference (IV, Fixed, 95% CI) | Subtotals only | |
| 3.1 Scalp only | 2 | 164 | Std. Mean Difference (IV, Fixed, 95% CI) | ‐0.68 [1.00, ‐0.37] |
| 4 Decrease in erythema score (long term) Show forest plot | 2 | Std. Mean Difference (IV, Random, 95% CI) | Subtotals only | |
| 4.1 Scalp only | 2 | 164 | Std. Mean Difference (IV, Random, 95% CI) | ‐0.44 [‐0.75, ‐0.13] |
| 5 Erythema ‐ Failure to achieve complete resolution Show forest plot | 2 | Risk Ratio (M‐H, Fixed, 95% CI) | Totals not selected | |
| 5.1 Scalp only | 2 | Risk Ratio (M‐H, Fixed, 95% CI) | 0.0 [0.0, 0.0] | |
| 6 Decrease in pruritus score Show forest plot | 1 | Mean Difference (IV, Fixed, 95% CI) | Totals not selected | |
| 6.1 Scalp only | 1 | Mean Difference (IV, Fixed, 95% CI) | 0.0 [0.0, 0.0] | |
| 7 Decrease in pruritus score (long term) Show forest plot | 1 | Mean Difference (IV, Fixed, 95% CI) | Totals not selected | |
| 7.1 Scalp only | 1 | Mean Difference (IV, Fixed, 95% CI) | 0.0 [0.0, 0.0] | |
| 8 Pruritus ‐ Failure to achieve complete resolution Show forest plot | 1 | Risk Ratio (M‐H, Fixed, 95% CI) | Totals not selected | |
| 8.1 Scalp only | 1 | Risk Ratio (M‐H, Fixed, 95% CI) | 0.0 [0.0, 0.0] | |
| 9 Decrease in scaling score Show forest plot | 3 | Std. Mean Difference (IV, Fixed, 95% CI) | Subtotals only | |
| 9.1 Scalp only | 3 | 464 | Std. Mean Difference (IV, Fixed, 95% CI) | ‐0.22 [‐0.40, ‐0.03] |
| 10 Decrease in scaling score (long term) Show forest plot | 2 | Std. Mean Difference (IV, Fixed, 95% CI) | Subtotals only | |
| 10.1 Scalp only | 2 | 164 | Std. Mean Difference (IV, Fixed, 95% CI) | ‐0.67 [‐0.98, ‐0.35] |
| 11 Scaling ‐ Failure to achieve complete resolution Show forest plot | 2 | Risk Ratio (M‐H, Fixed, 95% CI) | Subtotals only | |
| 11.1 Scalp only | 2 | 799 | Risk Ratio (M‐H, Fixed, 95% CI) | 0.86 [0.79, 0.94] |
| 12 Side effects Show forest plot | 4 | 908 | Risk Ratio (M‐H, Fixed, 95% CI) | 0.90 [0.72, 1.11] |
| 12.1 Scalp only | 3 | 779 | Risk Ratio (M‐H, Fixed, 95% CI) | 0.97 [0.76, 1.25] |
| 12.2 Face only | 1 | 129 | Risk Ratio (M‐H, Fixed, 95% CI) | 0.67 [0.43, 1.03] |
| Outcome or subgroup title | No. of studies | No. of participants | Statistical method | Effect size |
| 1 Failure to achieve complete resolution Show forest plot | 2 | Risk Ratio (M‐H, Random, 95% CI) | Subtotals only | |
| 1.1 Scalp only | 2 | 832 | Risk Ratio (M‐H, Random, 95% CI) | 0.65 [0.37, 1.13] |
| Outcome or subgroup title | No. of studies | No. of participants | Statistical method | Effect size |
| 1 Failure to achieve complete resolution Show forest plot | 1 | Risk Ratio (M‐H, Fixed, 95% CI) | Totals not selected | |
| 1.1 Face | 1 | Risk Ratio (M‐H, Fixed, 95% CI) | 0.0 [0.0, 0.0] | |
| 2 Failure to achieve complete resolution (long term) Show forest plot | 1 | Risk Ratio (M‐H, Fixed, 95% CI) | Totals not selected | |
| 2.1 Face | 1 | Risk Ratio (M‐H, Fixed, 95% CI) | 0.0 [0.0, 0.0] | |
| Outcome or subgroup title | No. of studies | No. of participants | Statistical method | Effect size |
| 1 Failure to achieve complete resolution Show forest plot | 1 | Risk Ratio (M‐H, Fixed, 95% CI) | Totals not selected | |
| 1.1 Face only | 1 | Risk Ratio (M‐H, Fixed, 95% CI) | 0.0 [0.0, 0.0] | |
| 2 Failure to achieve complete resolution (long term) Show forest plot | 1 | Risk Ratio (M‐H, Fixed, 95% CI) | Totals not selected | |
| 2.1 Face only | 1 | Risk Ratio (M‐H, Fixed, 95% CI) | 0.0 [0.0, 0.0] | |
| 3 Decrease in erythema score Show forest plot | 1 | Mean Difference (IV, Fixed, 95% CI) | Totals not selected | |
| 3.1 Face only | 1 | Mean Difference (IV, Fixed, 95% CI) | 0.0 [0.0, 0.0] | |
| 4 Decrease in erythema score (long term) Show forest plot | 1 | Mean Difference (IV, Random, 95% CI) | Totals not selected | |
| 4.1 Face only | 1 | Mean Difference (IV, Random, 95% CI) | 0.0 [0.0, 0.0] | |
| 5 Erythema ‐ Failure to achieve complete resolution Show forest plot | 1 | Risk Ratio (M‐H, Fixed, 95% CI) | Totals not selected | |
| 5.1 Face only | 1 | Risk Ratio (M‐H, Fixed, 95% CI) | 0.0 [0.0, 0.0] | |
| 6 Decrease in scaling score Show forest plot | 1 | Mean Difference (IV, Fixed, 95% CI) | Totals not selected | |
| 6.1 Face only | 1 | Mean Difference (IV, Fixed, 95% CI) | 0.0 [0.0, 0.0] | |
| 7 Decrease in scaling score (long term) Show forest plot | 1 | Mean Difference (IV, Fixed, 95% CI) | Totals not selected | |
| 7.1 Face only | 1 | Mean Difference (IV, Fixed, 95% CI) | 0.0 [0.0, 0.0] | |
| 8 Scaling ‐ Failure to achieve complete resolution Show forest plot | 1 | Risk Ratio (M‐H, Fixed, 95% CI) | Totals not selected | |
| 8.1 Face only | 1 | Risk Ratio (M‐H, Fixed, 95% CI) | 0.0 [0.0, 0.0] | |
| 9 Side effects Show forest plot | 1 | Risk Ratio (M‐H, Fixed, 95% CI) | Totals not selected | |
| 9.1 Face only | 1 | Risk Ratio (M‐H, Fixed, 95% CI) | 0.0 [0.0, 0.0] | |
| Outcome or subgroup title | No. of studies | No. of participants | Statistical method | Effect size |
| 1 Failure to achieve complete resolution Show forest plot | 9 | Risk Ratio (M‐H, Fixed, 95% CI) | Subtotals only | |
| 1.1 Studies assessed as having no COI | 5 | 392 | Risk Ratio (M‐H, Fixed, 95% CI) | 0.54 [0.46, 0.64] |
| 1.2 Studies assessed as potentially having COI | 4 | 2167 | Risk Ratio (M‐H, Fixed, 95% CI) | 0.78 [0.73, 0.83] |
| 2 Decrease in erythema score Show forest plot | 2 | Std. Mean Difference (IV, Random, 95% CI) | Totals not selected | |
| 2.1 Studies assessed as potentially having COI | 2 | Std. Mean Difference (IV, Random, 95% CI) | 0.0 [0.0, 0.0] | |
| 3 Decrease in pruritus score Show forest plot | 3 | Std. Mean Difference (IV, Fixed, 95% CI) | Subtotals only | |
| 3.1 Studies assessed as potentially having COI | 3 | 699 | Std. Mean Difference (IV, Fixed, 95% CI) | ‐0.55 [‐0.85, ‐0.26] |
| 4 Side effects Show forest plot | 6 | Risk Ratio (M‐H, Random, 95% CI) | Subtotals only | |
| 4.1 Studies assessed as having no COI | 2 | 206 | Risk Ratio (M‐H, Random, 95% CI) | 1.82 [1.07, 3.09] |
| 4.2 Studies assessed as potentially having COI | 4 | 782 | Risk Ratio (M‐H, Random, 95% CI) | 0.75 [0.52, 1.09] |
| Outcome or subgroup title | No. of studies | No. of participants | Statistical method | Effect size |
| 1 Failure to achieve complete resolution Show forest plot | 6 | 302 | Risk Ratio (M‐H, Fixed, 95% CI) | 1.17 [0.95, 1.44] |
| 1.1 Studies assessed as having no COI | 2 | 71 | Risk Ratio (M‐H, Fixed, 95% CI) | 0.68 [0.32, 1.47] |
| 1.2 Studies assessed as potentially having COI | 4 | 231 | Risk Ratio (M‐H, Fixed, 95% CI) | 1.28 [1.04, 1.58] |
| 2 Failure to achieve complete resolution Show forest plot | 2 | Risk Ratio (M‐H, Random, 95% CI) | Totals not selected | |
| 2.1 Studies judged to be without COI | 1 | Risk Ratio (M‐H, Random, 95% CI) | 0.0 [0.0, 0.0] | |
| 2.2 Studies assessed as potentially having COI | 1 | Risk Ratio (M‐H, Random, 95% CI) | 0.0 [0.0, 0.0] | |
| 3 Decrease in scaling score Show forest plot | 5 | 329 | Std. Mean Difference (IV, Fixed, 95% CI) | 0.18 [‐0.04, 0.40] |
| 3.1 Studies assessed as having no COI | 1 | 40 | Std. Mean Difference (IV, Fixed, 95% CI) | ‐0.32 [‐0.95, 0.30] |
| 3.2 Studies assessed as potentially having COI | 4 | 289 | Std. Mean Difference (IV, Fixed, 95% CI) | 0.25 [0.02, 0.48] |
| Outcome or subgroup title | No. of studies | No. of participants | Statistical method | Effect size |
| 1 Failure to achieve complete resolution Show forest plot | 9 | 2559 | Risk Ratio (M‐H, Random, 95% CI) | 0.67 [0.57, 0.79] |
| 1.1 28% per week | 2 | 1199 | Risk Ratio (M‐H, Random, 95% CI) | 0.66 [0.54, 0.82] |
| 1.2 14% per week | 3 | 179 | Risk Ratio (M‐H, Random, 95% CI) | 0.68 [0.39, 1.16] |
| 1.3 2% to 7% per week | 4 | 1181 | Risk Ratio (M‐H, Random, 95% CI) | 0.68 [0.47, 1.00] |
| 2 Decrease in erythema score Show forest plot | 2 | 104 | Std. Mean Difference (IV, Random, 95% CI) | ‐1.55 [‐3.37, 0.28] |
| 2.1 28% per week | 1 | 40 | Std. Mean Difference (IV, Random, 95% CI) | ‐2.51 [‐3.36, ‐1.66] |
| 2.2 2% to 7% per week | 1 | 64 | Std. Mean Difference (IV, Random, 95% CI) | ‐0.65 [‐1.15, ‐0.14] |
| 3 Erythema ‐ Failure to achieve complete resolution Show forest plot | 2 | 259 | Risk Ratio (M‐H, Random, 95% CI) | 0.54 [0.21, 1.43] |
| 3.1 28% per week | 1 | 59 | Risk Ratio (M‐H, Random, 95% CI) | 0.32 [0.13, 0.77] |
| 3.2 2% to 7% per week | 1 | 200 | Risk Ratio (M‐H, Random, 95% CI) | 0.78 [0.66, 0.92] |
| 4 Decrease in pruritus score Show forest plot | 3 | 699 | Std. Mean Difference (IV, Random, 95% CI) | ‐0.68 [‐1.38, 0.03] |
| 4.1 28% per week | 1 | 40 | Std. Mean Difference (IV, Random, 95% CI) | ‐2.06 [‐2.84, ‐1.28] |
| 4.2 14% per week | 1 | 459 | Std. Mean Difference (IV, Random, 95% CI) | ‐0.07 [‐0.26, 0.11] |
| 4.3 2% to 7% per week | 1 | 200 | Std. Mean Difference (IV, Random, 95% CI) | ‐0.30 [‐0.62, 0.02] |
| 5 Pruritus ‐ Failure to achieve complete resolution Show forest plot | 2 | 73 | Risk Ratio (M‐H, Fixed, 95% CI) | 0.40 [0.22, 0.71] |
| 5.1 28% per week | 1 | 59 | Risk Ratio (M‐H, Fixed, 95% CI) | 0.43 [0.22, 0.83] |
| 5.2 2% to 7% per week | 1 | 14 | Risk Ratio (M‐H, Fixed, 95% CI) | 0.3 [0.09, 1.05] |
| 6 Decrease in scaling score Show forest plot | 3 | 563 | Std. Mean Difference (IV, Random, 95% CI) | ‐0.95 [‐1.80, ‐0.10] |
| 6.1 2% to 7% per week | 1 | 64 | Std. Mean Difference (IV, Random, 95% CI) | ‐0.67 [‐1.17, ‐0.16] |
| 6.2 28% per week | 1 | 40 | Std. Mean Difference (IV, Random, 95% CI) | ‐2.12 [‐2.91, ‐1.33] |
| 6.3 14% per week | 1 | 459 | Std. Mean Difference (IV, Random, 95% CI) | ‐0.30 [‐0.48, ‐0.12] |
| 7 Decrease in scaling (long term) Show forest plot | 2 | 264 | Mean Difference (IV, Fixed, 95% CI) | 1.00 [‐1.50, ‐0.49] |
| 7.1 2% to 7% per week | 2 | 264 | Mean Difference (IV, Fixed, 95% CI) | 1.00 [‐1.50, ‐0.49] |
| 8 Scaling ‐ Failure to achieve complete resolution Show forest plot | 3 | 284 | Risk Ratio (M‐H, Random, 95% CI) | 0.56 [0.29, 1.06] |
| 8.1 28% per week | 1 | 68 | Risk Ratio (M‐H, Random, 95% CI) | 0.22 [0.09, 0.52] |
| 8.2 2% to 7% per week | 2 | 216 | Risk Ratio (M‐H, Random, 95% CI) | 0.77 [0.67, 0.87] |
| 9 Side effects Show forest plot | 6 | 988 | Risk Ratio (M‐H, Fixed, 95% CI) | 0.99 [0.74, 1.33] |
| 9.1 28% per week | 1 | 59 | Risk Ratio (M‐H, Fixed, 95% CI) | 0.55 [0.18, 1.69] |
| 9.2 14% per week | 2 | 489 | Risk Ratio (M‐H, Fixed, 95% CI) | 0.81 [0.55, 1.20] |
| 9.3 2% to 7% per week | 3 | 440 | Risk Ratio (M‐H, Fixed, 95% CI) | 1.59 [0.95, 2.65] |
| Outcome or subgroup title | No. of studies | No. of participants | Statistical method | Effect size |
| 1 Failure to achieve complete resolution Show forest plot | 6 | 302 | Risk Ratio (M‐H, Fixed, 95% CI) | 1.17 [0.95, 1.44] |
| 1.1 28% per week | 2 | 81 | Risk Ratio (M‐H, Fixed, 95% CI) | 1.27 [0.65, 2.50] |
| 1.2 14% per week | 2 | 103 | Risk Ratio (M‐H, Fixed, 95% CI) | 1.06 [0.49, 2.30] |
| 1.3 2% to 7% per week | 2 | 118 | Risk Ratio (M‐H, Fixed, 95% CI) | 1.17 [0.97, 1.42] |
| 2 Failure to achieve complete resolution (long term) Show forest plot | 2 | Risk Ratio (M‐H, Random, 95% CI) | Totals not selected | |
| 2.1 28% per week | 1 | Risk Ratio (M‐H, Random, 95% CI) | 0.0 [0.0, 0.0] | |
| 2.2 2% to 7% per week | 1 | Risk Ratio (M‐H, Random, 95% CI) | 0.0 [0.0, 0.0] | |
| 3 Erythema ‐ Failure to achieve complete resolution Show forest plot | 2 | 195 | Risk Ratio (M‐H, Random, 95% CI) | 0.51 [0.19, 1.38] |
| 3.1 2% to 7% per week | 2 | 195 | Risk Ratio (M‐H, Random, 95% CI) | 0.51 [0.19, 1.38] |
| 4 Decrease in scaling score Show forest plot | 5 | 329 | Std. Mean Difference (IV, Random, 95% CI) | 0.19 [‐0.13, 0.51] |
| 4.1 14% per week | 2 | 110 | Std. Mean Difference (IV, Random, 95% CI) | ‐0.02 [‐0.52, 0.48] |
| 4.2 2% to 7% per week | 3 | 219 | Std. Mean Difference (IV, Random, 95% CI) | 0.32 [‐0.12, 0.77] |
| Outcome or subgroup title | No. of studies | No. of participants | Statistical method | Effect size |
| 1 Failure to achieve complete resolution Show forest plot | 9 | 2559 | Risk Ratio (M‐H, Random, 95% CI) | 0.66 [0.56, 0.78] |
| 1.1 Shampoo | 3 | 248 | Risk Ratio (M‐H, Random, 95% CI) | 0.62 [0.39, 0.99] |
| 1.2 Demulcents | 5 | 531 | Risk Ratio (M‐H, Random, 95% CI) | 0.61 [0.50, 0.74] |
| 1.3 Foam | 1 | 847 | Risk Ratio (M‐H, Random, 95% CI) | 0.76 [0.66, 0.87] |
| 1.4 Gel | 1 | 933 | Risk Ratio (M‐H, Random, 95% CI) | 0.82 [0.77, 0.88] |
| 2 Decrease in erythema score Show forest plot | 2 | Std. Mean Difference (IV, Fixed, 95% CI) | Totals not selected | |
| 2.1 Shampoo | 1 | Std. Mean Difference (IV, Fixed, 95% CI) | 0.0 [0.0, 0.0] | |
| 2.2 Demulcents | 1 | Std. Mean Difference (IV, Fixed, 95% CI) | 0.0 [0.0, 0.0] | |
| 3 Erythema ‐ Failure to achieve complete resolution Show forest plot | 2 | 259 | Risk Ratio (M‐H, Random, 95% CI) | 0.54 [0.21, 1.43] |
| 3.1 Shampoo | 1 | 200 | Risk Ratio (M‐H, Random, 95% CI) | 0.78 [0.66, 0.92] |
| 3.2 Cream | 1 | 59 | Risk Ratio (M‐H, Random, 95% CI) | 0.32 [0.13, 0.77] |
| 4 Decrease in pruritus score Show forest plot | 3 | 699 | Std. Mean Difference (IV, Fixed, 95% CI) | ‐0.55 [‐0.85, ‐0.26] |
| 4.1 Demulcents | 1 | 40 | Std. Mean Difference (IV, Fixed, 95% CI) | ‐2.06 [‐2.84, ‐1.28] |
| 4.2 Gel | 1 | 459 | Std. Mean Difference (IV, Fixed, 95% CI) | 0.0 [0.0, 0.0] |
| 4.3 Shampoo | 1 | 200 | Std. Mean Difference (IV, Fixed, 95% CI) | ‐0.30 [‐0.62, 0.02] |
| 5 Decrease in scaling score Show forest plot | 3 | 304 | Std. Mean Difference (IV, Fixed, 95% CI) | ‐0.65 [‐0.91, ‐0.39] |
| 5.1 Shampoo | 2 | 264 | Std. Mean Difference (IV, Fixed, 95% CI) | ‐0.47 [‐0.75, ‐0.20] |
| 5.2 Demulcent | 1 | 40 | Std. Mean Difference (IV, Fixed, 95% CI) | ‐2.12 [‐2.91, ‐1.33] |
| 6 Decrease in scaling score (long term) Show forest plot | 2 | Std. Mean Difference (IV, Fixed, 95% CI) | Subtotals only | |
| 6.1 Shampoo | 2 | 264 | Std. Mean Difference (IV, Fixed, 95% CI) | ‐0.54 [‐0.82, ‐0.27] |
| 7 Side effects Show forest plot | 6 | 988 | Risk Ratio (M‐H, Random, 95% CI) | 0.97 [0.58, 1.64] |
| 7.1 Shampoo | 3 | 440 | Risk Ratio (M‐H, Random, 95% CI) | 1.27 [0.47, 3.45] |
| 7.2 Demulcents | 2 | 89 | Risk Ratio (M‐H, Random, 95% CI) | 0.69 [0.29, 1.67] |
| 7.3 Gel | 1 | 459 | Risk Ratio (M‐H, Random, 95% CI) | 0.80 [0.53, 1.20] |
| Outcome or subgroup title | No. of studies | No. of participants | Statistical method | Effect size |
| 1 Failure to achieve complete resolution Show forest plot | 6 | 302 | Risk Ratio (M‐H, Fixed, 95% CI) | 1.17 [0.95, 1.44] |
| 1.1 Shampoo | 1 | 49 | Risk Ratio (M‐H, Fixed, 95% CI) | 1.29 [0.98, 1.71] |
| 1.2 Demulcents | 5 | 253 | Risk Ratio (M‐H, Fixed, 95% CI) | 1.13 [0.86, 1.48] |
| 2 Decrease in scaling score Show forest plot | 5 | 329 | Std. Mean Difference (IV, Random, 95% CI) | 0.19 [‐0.13, 0.51] |
| 2.1 Shampoo | 2 | 150 | Std. Mean Difference (IV, Random, 95% CI) | 0.19 [‐0.37, 0.76] |
| 2.2 Demulcent | 3 | 179 | Std. Mean Difference (IV, Random, 95% CI) | 0.19 [‐0.30, 0.67] |