Scolaris Content Display Scolaris Content Display

Study flow diagram
Figures and Tables -
Figure 1

Study flow diagram

Risk of bias summary: review authors' judgements about each risk of bias item for each included study
Figures and Tables -
Figure 2

Risk of bias summary: review authors' judgements about each risk of bias item for each included study

Comparison 1 Upright position versus recumbent position, Outcome 1 Operative birth (caesarean or instrumental vaginal).
Figures and Tables -
Analysis 1.1

Comparison 1 Upright position versus recumbent position, Outcome 1 Operative birth (caesarean or instrumental vaginal).

Comparison 1 Upright position versus recumbent position, Outcome 2 Duration of second stage labour (minutes) (from time of randomisation to birth).
Figures and Tables -
Analysis 1.2

Comparison 1 Upright position versus recumbent position, Outcome 2 Duration of second stage labour (minutes) (from time of randomisation to birth).

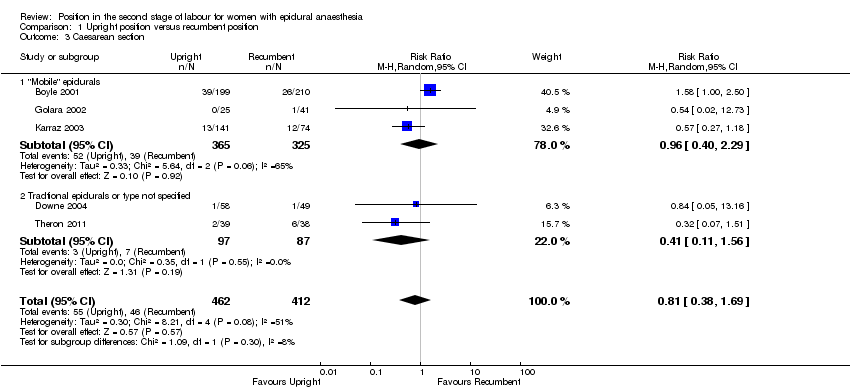
Comparison 1 Upright position versus recumbent position, Outcome 3 Caesarean section.
Figures and Tables -
Analysis 1.3

Comparison 1 Upright position versus recumbent position, Outcome 3 Caesarean section.

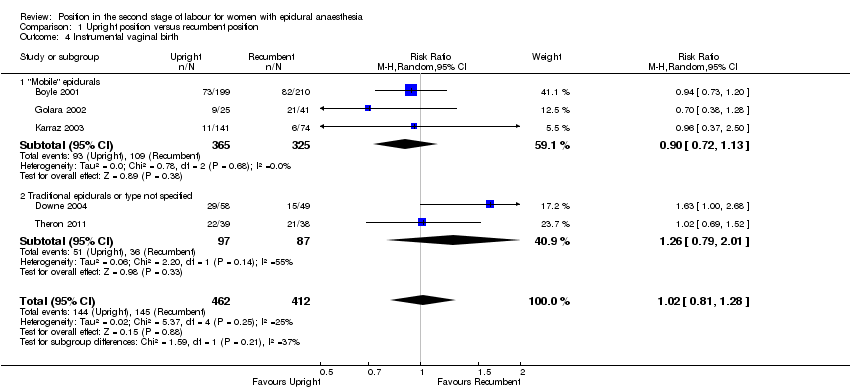
Comparison 1 Upright position versus recumbent position, Outcome 4 Instrumental vaginal birth.
Figures and Tables -
Analysis 1.4

Comparison 1 Upright position versus recumbent position, Outcome 4 Instrumental vaginal birth.

Comparison 1 Upright position versus recumbent position, Outcome 5 Trauma to birth canal requiring suturing.
Figures and Tables -
Analysis 1.5

Comparison 1 Upright position versus recumbent position, Outcome 5 Trauma to birth canal requiring suturing.

Comparison 1 Upright position versus recumbent position, Outcome 6 Abnormal fetal heart rate patterns, requiring intervention.
Figures and Tables -
Analysis 1.6

Comparison 1 Upright position versus recumbent position, Outcome 6 Abnormal fetal heart rate patterns, requiring intervention.

Comparison 1 Upright position versus recumbent position, Outcome 7 Low cord pH.
Figures and Tables -
Analysis 1.7

Comparison 1 Upright position versus recumbent position, Outcome 7 Low cord pH.

Comparison 1 Upright position versus recumbent position, Outcome 8 Admission to neonatal intensive care unit.
Figures and Tables -
Analysis 1.8

Comparison 1 Upright position versus recumbent position, Outcome 8 Admission to neonatal intensive care unit.

Summary of findings for the main comparison. Upright position compared to recumbent position for the second stage of labour for women with epidural anaesthesia

Upright position compared to recumbent position for the second stage of labour for women with epidural anaesthesia

Patient or population: women with epidural anaesthesia in the second stage of labour
Setting: hospitals in France (1 study) and the UK (4 studies)
Intervention: upright position
Comparison: recumbent position

Outcomes

Anticipated absolute effects* (95% CI)

Relative effect
(95% CI)

№ of participants
(studies)

Quality of the evidence
(GRADE)

Comments

Risk with recumbent position

Risk with upright position

Operative birth (caesarean or instrumental vaginal)

Study population

RR 0.97
(0.76 to 1.25)

874
(5 RCTs)

⊕⊕⊕⊝
Moderate1,2

464 per 1000

450 per 1000
(352 to 579)

Duration of second stage labour (minutes) (from time of randomisation to birth)

The mean duration of second stage labour was 22.98 minutes less for women in the upright position (99.09 minutes less to 53.13 minutes more)

322
(2 RCTs)

⊕⊝⊝⊝
Very low3,4

Trauma to birth canal requiring suturing

Study population

RR 0.95
(0.66 to 1.37)

173
(2 RCTs)

⊕⊝⊝⊝
Very low4,5,6

800 per 1000

760 per 1000
(528 to 1000)

Blood loss (greater than 500 mL) (or as defined by trial authors)

Study population

(0 studies)

No trial reported this outcome

see comment

see comment

Abnormal fetal heart rate patterns, requiring intervention

Study population

RR 1.69
(0.32 to 8.84)

107
(1 RCT)

⊕⊝⊝⊝
Very low7,8

41 per 1000

69 per 1000
(13 to 361)

Low cord pH less than 7.1 (or as defined by trial authors)

Study population

RR 0.61
(0.18 to 2.10)

66
(1 RCT)

⊕⊝⊝⊝
Very low7,8

195 per 1000

119 per 1000
(35 to 410)

Admission to neonatal intensive care unit

Study population

RR 0.54
(0.02 to 12.73)

66
(1 RCT)

⊕⊝⊝⊝
Very low7,8

24 per 1000

13 per 1000
(0 to 310)

*The risk in the intervention group (and its 95% confidence interval) is based on the assumed risk in the comparison group and the relative effect of the intervention (and its 95% CI).

CI: Confidence interval; RR: Risk ratio

GRADE Working Group grades of evidence
High quality: we are very confident that the true effect lies close to that of the estimate of the effect
Moderate quality: we are moderately confident in the effect estimate: the true effect is likely to be close to the estimate of the effect, but there is a possibility that it is substantially different
Low quality: our confidence in the effect estimate is limited: the true effect may be substantially different from the estimate of the effect
Very low quality: we have very little confidence in the effect estimate: the true effect is likely to be substantially different from the estimate of effect

1All studies had design limitations. One trial contributing 24.2% weight had serious design limitations (‐1).
2Heterogeneity, I2 = 54% (not downgraded).
3Severe heterogeneity, I2 = 92% (‐1).
4Small sample size and very wide confidence intervals that cross the line of no effect (‐2).
5Both studies contributing data had design limitations (‐1).
6High heterogeneity, I2 = 74% (‐1).
7One study with design limitations. (‐1).
8Very small sample size, few events and wide confidence intervals that cross the line of no effect (‐2).

Figures and Tables -
Summary of findings for the main comparison. Upright position compared to recumbent position for the second stage of labour for women with epidural anaesthesia
Comparison 1. Upright position versus recumbent position

Outcome or subgroup title

No. of studies

No. of participants

Statistical method

Effect size

1 Operative birth (caesarean or instrumental vaginal) Show forest plot

5

874

Risk Ratio (M‐H, Random, 95% CI)

0.97 [0.76, 1.25]

1.1 "Mobile" epidurals

3

690

Risk Ratio (M‐H, Random, 95% CI)

0.87 [0.61, 1.26]

1.2 Traditional epidurals or type not specified

2

184

Risk Ratio (M‐H, Random, 95% CI)

1.14 [0.62, 2.12]

2 Duration of second stage labour (minutes) (from time of randomisation to birth) Show forest plot

2

322

Mean Difference (IV, Random, 95% CI)

‐22.98 [‐99.09, 53.13]

2.1 "Mobile" epidurals

1

215

Mean Difference (IV, Random, 95% CI)

‐63.0 [‐97.94, ‐28.06]

2.2 Traditional epidurals or type not specified

1

107

Mean Difference (IV, Random, 95% CI)

14.70 [‐8.14, 37.54]

3 Caesarean section Show forest plot

5

874

Risk Ratio (M‐H, Random, 95% CI)

0.81 [0.38, 1.69]

3.1 "Mobile" epidurals

3

690

Risk Ratio (M‐H, Random, 95% CI)

0.96 [0.40, 2.29]

3.2 Tradtional epidurals or type not specified

2

184

Risk Ratio (M‐H, Random, 95% CI)

0.41 [0.11, 1.56]

4 Instrumental vaginal birth Show forest plot

5

874

Risk Ratio (M‐H, Random, 95% CI)

1.02 [0.81, 1.28]

4.1 "Mobile" epidurals

3

690

Risk Ratio (M‐H, Random, 95% CI)

0.90 [0.72, 1.13]

4.2 Traditional epidurals or type not specified

2

184

Risk Ratio (M‐H, Random, 95% CI)

1.26 [0.79, 2.01]

5 Trauma to birth canal requiring suturing Show forest plot

2

173

Risk Ratio (M‐H, Random, 95% CI)

0.95 [0.66, 1.37]

6 Abnormal fetal heart rate patterns, requiring intervention Show forest plot

1

107

Risk Ratio (M‐H, Random, 95% CI)

1.69 [0.32, 8.84]

7 Low cord pH Show forest plot

1

66

Risk Ratio (M‐H, Random, 95% CI)

0.62 [0.18, 2.10]

8 Admission to neonatal intensive care unit Show forest plot

1

66

Risk Ratio (M‐H, Random, 95% CI)

0.54 [0.02, 12.73]

Figures and Tables -
Comparison 1. Upright position versus recumbent position