Intervenciones de reducción de los niveles de homocisteína para la prevención de eventos cardiovasculares
Information
- DOI:
- https://doi.org/10.1002/14651858.CD006612.pub5Copy DOI

- Database:
-
- Cochrane Database of Systematic Reviews
- Version published:
-
- 17 August 2017see what's new
- Type:
-
- Intervention
- Stage:
-
- Review
- Cochrane Editorial Group:
-
Cochrane Heart Group
- Copyright:
-
- Copyright © 2017 The Cochrane Collaboration. Published by John Wiley & Sons, Ltd.
Article metrics
Altmetric:
Cited by:
Authors
Contributions of authors
Arturo Marti‐Carvajal took the lead on writing up the review.
Ivan Solà identified trials, extracted data, edited the 'Summary of findings' tables and drafted the review.
Dimitris Lathyris extracted and checked the data and reviewed the review.
Mark Dayer critically reviewed and amended the manuscript.
Sources of support
Internal sources
-
No sources of support provided
External sources
-
Iberoamerican Cochrane Centre, Spain
Academic
-
Cochrane Heart Group, UK
Academic
Declarations of interest
Arturo Marti‐Carvajal: In 2004, Arturo Martí‐Carvajal was employed by Eli Lilly to run a four‐hour workshop on 'How to critically appraise clinical trials on osteoporosis and how to teach this'. This activity was not related to his work with Cochrane or any Cochrane review. In 2007, Arturo Martí‐Carvajal was employed by Merck to run a four‐hour workshop 'How to critically appraise clinical trials and how to teach this'. This activity was not related to his work with Cochrane or any Cochrane review.
Ivan Solà: none known.
Dimitris Lathyris: none known.
Mark Dayer: none known.
Acknowledgements
We express our gratitude to the Cochrane Heart Group and peer referees for the suggestions made to enhance the quality of this review. In addition, we acknowledge Carmen Verônica Abdala from BIREME/OPS/OMS for her help in developing the search strategy for LILACS. In addition, we want express our deep gratitude to Georgia Salanti for teaching us how to conduct the first version of this Cochrane review.
We want express our gratitude to Dr. Zoltan Dienes for helping us to conduct the Bayes factor estimation.
Version history
| Published | Title | Stage | Authors | Version |
| 2017 Aug 17 | Homocysteine‐lowering interventions for preventing cardiovascular events | Review | Arturo J Martí-Carvajal, Ivan Solà, Dimitrios Lathyris, Mark Dayer | |
| 2015 Jan 15 | Homocysteine‐lowering interventions for preventing cardiovascular events | Review | Arturo J Martí‐Carvajal, Ivan Solà, Dimitrios Lathyris | |
| 2013 Jan 31 | Homocysteine‐lowering interventions for preventing cardiovascular events | Review | Arturo J Martí‐Carvajal, Ivan Solà, Dimitrios Lathyris, Despoina‐Elvira Karakitsiou, Daniel Simancas‐Racines | |
| 2009 Oct 07 | Homocysteine lowering interventions for preventing cardiovascular events | Review | Arturo J Martí‐Carvajal, Ivan Solà, Dimitrios Lathyris, Georgia Salanti | |
| 2009 Jul 08 | Homocysteine lowering interventions for preventing cardiovascular events | Protocol | Arturo J Martí‐Carvajal, Georgia Salanti, Ricardo Hidalgo, Agustín Ciapponi | |
Differences between protocol and review
-
Number needed to treat for an additional beneficial outcome if the risk reduction was significant (P value = < 0.05)
-
Harbord and Peters tests for estimation publication bias.
-
Bayes factors
-
Fragility Indices
-
Trials including participants without cardiovascular disease versus trials including participants with cardiovascular disease (considered post‐hoc).
-
We considered studies to have an overall low risk of bias if they did not have high risk of bias in any of six individual domains (random sequence generation, allocation concealment, blinding of participants and personnel, blinding of outcome assessment, incomplete outcome data or selective reporting), and if a definitive 'Risk of bias' assessment could be made for the majority (at least five of six) of domains. We did not include ‘Other bias’ in our overall assessment.
Second update (Martí‐Carvajal 2015): included trial sequential analyses.
First update (Martí‐Carvajal 2013): In the first version of the review (Martí‐Carvajal 2009), we searched the Allied and Complementary Medicine ‐ AMED database (accessed through Ovid) and the Cochrane Stroke Group Specialised Register. For this update, we did not search either database.
This review has been updated at each step to current recommendations of Cochrane, including updates to the Plain Language Summary and inclusion of the quality of the evidence assessed according to GRADE ('Summary of findings').
Keywords
MeSH
Medical Subject Headings (MeSH) Keywords
- Angina Pectoris [prevention & control];
- Cardiovascular Diseases [etiology, *prevention & control];
- Cause of Death;
- Folic Acid [therapeutic use];
- Hyperhomocysteinemia [complications, *therapy];
- Myocardial Infarction [epidemiology, prevention & control];
- Randomized Controlled Trials as Topic;
- Risk Factors;
- Stroke [epidemiology, prevention & control];
- Vitamin B 12 [therapeutic use];
- Vitamin B 6 [therapeutic use];
- Vitamin B Complex [*therapeutic use];
Medical Subject Headings Check Words
Humans;
PICOs


Risk of bias graph: review authors' judgements about each risk of bias item presented as percentages across all included studies.

Risk of bias summary: review authors' judgements about each risk of bias item for each included study.

Trial Sequential Analysis for homocysteine‐lowering interventions versus placebo on myocardial infarction. The diversity‐adjusted required information size (DARIS) was calculated based on an expected relative risk reduction (RRR) of 10% from proportion event in control (Pc) group of 5.95% with an alpha of 5% and beta of 20%. Cumulative Z‐curve (blue line) reached futility area which means that no more trials are needed.
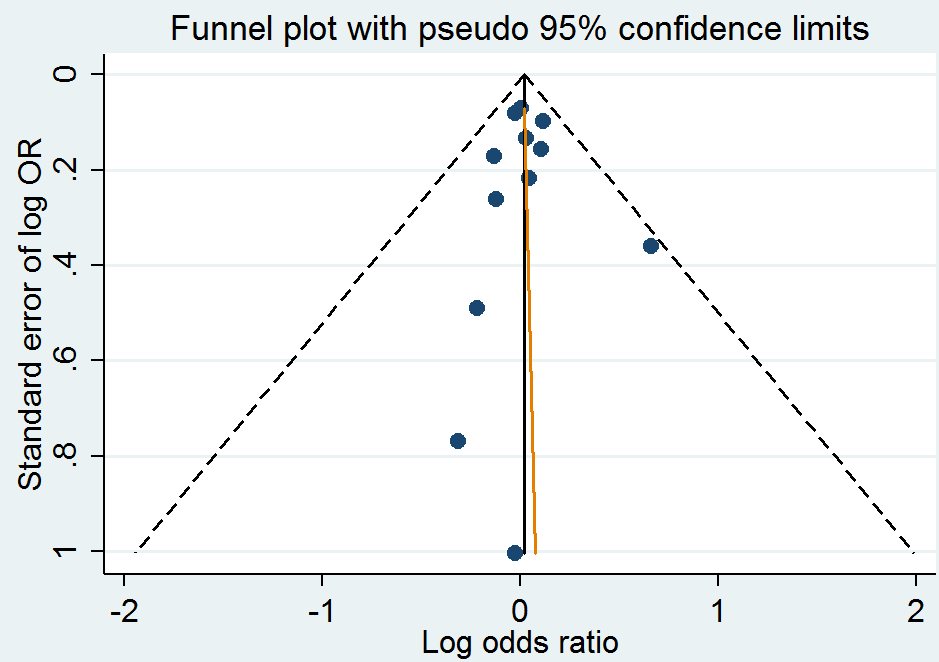
Funnel plot of comparison: 1 Homocysteine‐lowering interventions versus placebo, outcome: 1.1 Myocardial infarction.

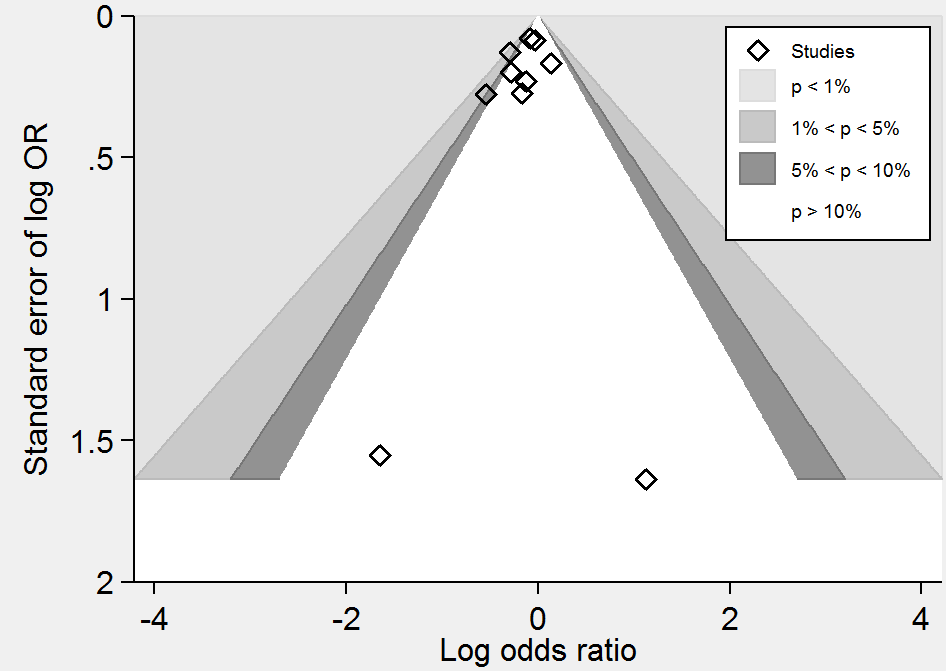
Contour‐enhanced funnel plot of comparison: 1 Homocysteine‐lowering interventions versus placebo, outcome: 1.1 Myocardial infarction.

Trial Sequential Analysis for homocysteine‐lowering interventions versus placebo on stroke. The diversity‐adjusted required information size (DARIS) was calculated based on an expected relative risk reduction (RRR) of 10% from proportion event in control (Pc) group of 5% with an alpha of 5% and beta of 20%.

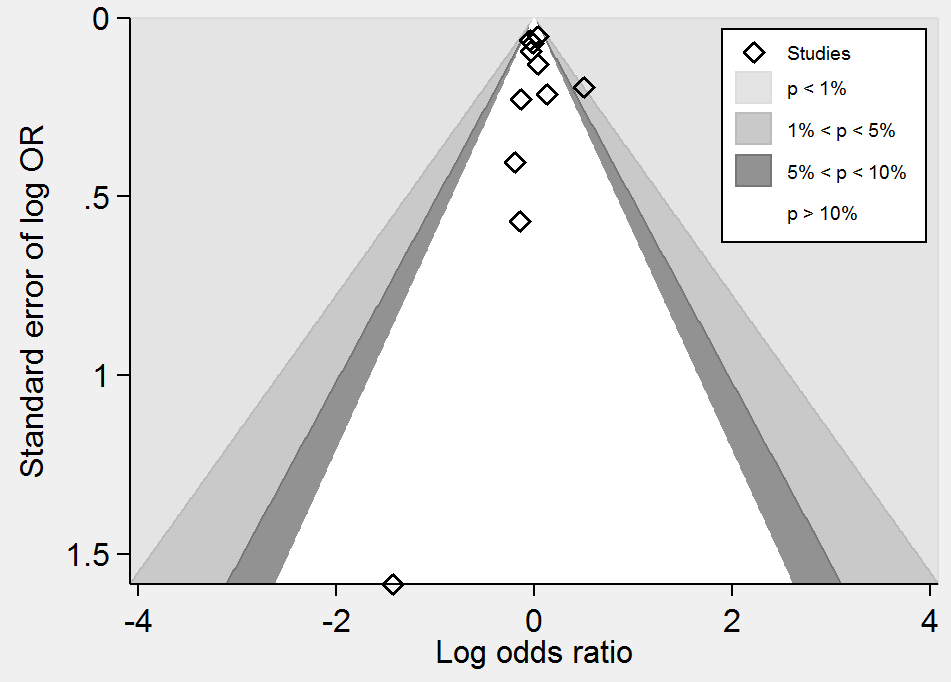
Funnel plot of comparison: 1 Homocysteine‐lowering interventions versus placebo, outcome: 1.2 Stroke.
Contour‐enhanced funnel plot of comparison: 1 Homocysteine‐lowering interventions versus placebo, outcome: 1.2 Stroke.

Trial Sequential Analysis for homocysteine‐lowering interventions versus placebo on death from any cause. The diversity‐adjusted required information size (DARIS) was calculated based on an expected relative risk reduction (RRR) of 12% from proportion event in control (Pc) group of 11.7% with an alpha of 5% and beta of 20%. Cumulative Z‐curve (blue line) reached futility area which means that no more trials are needed.

Funnel plot of comparison: 1 Homocysteine‐lowering interventions versus placebo, outcome: 1.4 Death from any cause.
Contour‐enhanced funnel plot of comparison: 1 Homocysteine‐lowering interventions versus placebo, outcome: 1.4 Death from any cause.
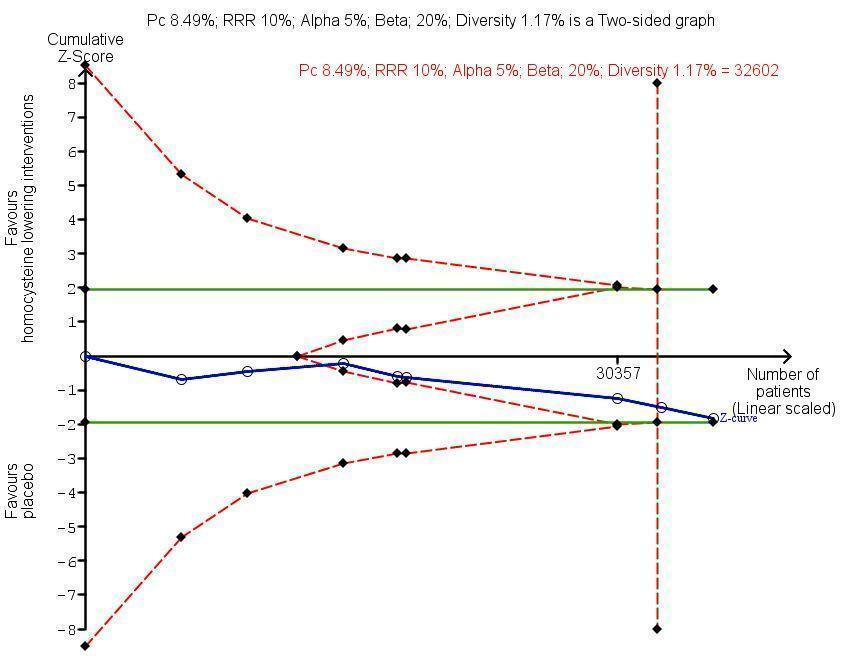
Trial Sequential Analysis for homocysteine‐lowering interventions versus placebo on adverse events (cancer). The diversity‐adjusted required information size (DARIS) was calculated based on an expected relative risk reduction (RRR) of 10% from proportion event in control (Pc) group of 8.49% with an alpha of 5% and beta of 20%. Cumulative Z‐curve (blue line) reached futility area which means that no more trials are needed.

Comparison 1: Homocysteine‐lowering treatment versus other (any comparisons), Outcome 1: Myocardial infarction

Comparison 1: Homocysteine‐lowering treatment versus other (any comparisons), Outcome 2: Stroke

Comparison 1: Homocysteine‐lowering treatment versus other (any comparisons), Outcome 3: First unstable angina pectoris episode requiring hospitalisation

Comparison 1: Homocysteine‐lowering treatment versus other (any comparisons), Outcome 4: Death from any cause

Comparison 1: Homocysteine‐lowering treatment versus other (any comparisons), Outcome 5: Serious adverse events (cancer)

Comparison 1: Homocysteine‐lowering treatment versus other (any comparisons), Outcome 6: Adverse events (serious and non‐serious) excluding cancer

Comparison 2: Homocysteine‐lowering treatment versus placebo or standard care (Sensitivity analysis), Outcome 1: Myocardial infarction

Comparison 2: Homocysteine‐lowering treatment versus placebo or standard care (Sensitivity analysis), Outcome 2: Stroke

Comparison 2: Homocysteine‐lowering treatment versus placebo or standard care (Sensitivity analysis), Outcome 3: Death from any cause

Comparison 3: Homocysteine‐lowering treatment versus placebo (Subgoup analysis), Outcome 1: Myocardial Infarction

Comparison 3: Homocysteine‐lowering treatment versus placebo (Subgoup analysis), Outcome 2: Stroke

Comparison 3: Homocysteine‐lowering treatment versus placebo (Subgoup analysis), Outcome 3: Death

Comparison 4: Homocysteine‐lowering treatment (folic acid) plus antihypertensive therapy (enalapril) versus antihypertensive therapy (enalapril) (Sensitivity analysis), Outcome 1: Myocardial infarction

Comparison 4: Homocysteine‐lowering treatment (folic acid) plus antihypertensive therapy (enalapril) versus antihypertensive therapy (enalapril) (Sensitivity analysis), Outcome 2: Stroke

Comparison 4: Homocysteine‐lowering treatment (folic acid) plus antihypertensive therapy (enalapril) versus antihypertensive therapy (enalapril) (Sensitivity analysis), Outcome 3: Death from any cause

Comparison 5: Homocysteine‐lowering treatment at high dose versus low dose (Subgoup analysis), Outcome 1: Stroke

Comparison 6: Homocysteine‐lowering treatment (high dose) versus Homocysteine‐lowering treatment (low dose) (Sensitivity analysis), Outcome 1: Stroke
| Homocysteine‐lowering interventions (vitamins B6 (pyridoxine; pyridoxal); B9 (folic acid) or B12 (cyanocobalamin) compared with placebo or standard care for preventing cardiovascular events | ||||||
| Patient or population: adults at risk of or with established cardiovascular disease | ||||||
| Outcomes | Illustrative comparative risks* (95% CI) | Relative effect | No of Participants | Quality of the evidence | Comments | |
|---|---|---|---|---|---|---|
| Assumed risk | Corresponding risk | |||||
| Placebo or standard care | Homocysteine‐lowering interventions | |||||
| Myocardial infarction | 60 per 1000 | 61 per 1000 | RR 1.02 | 46,699 | ⊕⊕⊕⊕ | |
| Stroke | 51 per 1000 | 46 per 1000 | RR 0.90 | 44,224 | ⊕⊕⊕⊕ | |
| Death by any cause | 123 per 1000 | 124 per 1000 | RR 1.01 | 44,817 | ⊕⊕⊕⊕ | |
| Adverse events | 85 per 1000 | 91 per 1000 | RR 1.07 | 35,788 | ⊕⊕⊕⊕ | Cancer is the only reported adverse event. |
| *The basis for the assumed risk (e.g. the median control group risk across studies) is the outcomes of the study control arms. The corresponding risk (and its 95% confidence interval) is based on the assumed risk in the comparison group and the relative effect of the intervention (and its 95% CI). | ||||||
| GRADE Working Group grades of evidence | ||||||
| Homocysteine‐lowering interventions (high dose) compared with homocysteine lowering interventions (low dose) for preventing cardiovascular events | ||||||
| Patient or population: adults at risk of or with established cardiovascular disease | ||||||
| Outcomes | Illustrative comparative risks* (95% CI) | Relative effect | No of Participants | Quality of the evidence | Comments | |
|---|---|---|---|---|---|---|
| Assumed risk | Corresponding risk | |||||
| Homocysteine‐lowering interventions (low‐dose) | Homocysteine‐lowering interventions (high‐dose) | |||||
| Myocardial infarction | 44 per 1000 | 40 per 1000 | RR 0.90 | 3649 | ⊕⊕⊕⊝ |
|
| Stroke | 112 per 1000 | 101 per 1000 | RR 0.90 | 3929 | ⊕⊝⊝⊝ | 1. Li 2015a was conducted including only Chinese elderly females.Trial used only folic acid as homocysteine‐lowering intervention.
2. VISP 2004:
|
| Death by any cause | 64 per 1000 | 55 per 1000 | RR 0.86 | 3649 | ⊕⊕⊕⊝ |
|
| Cancer | Not estimable | ‐ | Li 2015a and VISP 2004 reported no information on this outcome. | |||
| *The basis for the assumed risk (e.g. the median control group risk across studies) is the outcomes of the study control arms. The corresponding risk (and its 95% confidence interval) is based on the assumed risk in the comparison group and the relative effect of the intervention (and its 95% CI). | ||||||
| GRADE Working Group grades of evidence | ||||||
| 1 Downgraded one level for imprecision due to low number of events | ||||||
| Enalapril plus folic acid compared with folic acid for adults with hypertension | ||||||
| Patient or population: adults with hypertension | ||||||
| Outcomes | Illustrative comparative risks* (95% CI) | Relative effect | No of Participants | Quality of the evidence | Comments | |
|---|---|---|---|---|---|---|
| Assumed risk | Corresponding risk | |||||
| Folic acid | Enalapril plus folic acid | |||||
| Myocardial infarction | 2 per 1000 | 2 per 1000 | RR 1.04 | 20,702 | ⊕⊕⊕⊝ | |
| Stroke | 34 per 1000 | 27 per 1000 | RR 0.79 | 20,702 | ⊕⊕⊕⊕ | |
| First unstable angina pectoris episode requiring hospitalisation | Not estimable | ‐ | CSPPT 2015 did not assess this outcome. | |||
| Death from any cause | 31 per 1000 | 29 per 1000 | RR 0.94 | 20,702 | ⊕⊕⊕⊕ | |
| Serious adverse event (cancer) | 8 per 1000 | 8 per 1000 | RR 0.96 | 20,243 | ⊕⊕⊕⊝ | CSPPT 2015 included either neoplasms benign, malignant or unspecified |
| *The basis for the assumed risk (e.g. the median control group risk across studies) is the outcomes of the study control arms. The corresponding risk (and its 95% confidence interval) is based on the assumed risk in the comparison group and the relative effect of the intervention (and its 95% CI). | ||||||
| GRADE Working Group grades of evidence | ||||||
| 1Downgraded one level for imprecision due to low number of events. | ||||||
| Outcome or subgroup title | No. of studies | No. of participants | Statistical method | Effect size |
| 1.1 Myocardial infarction Show forest plot | 14 | Risk Ratio (M‐H, Random, 95% CI) | Subtotals only | |
| 1.1.1 Homocysteine‐lowering versus placebo | 12 | 46699 | Risk Ratio (M‐H, Random, 95% CI) | 1.02 [0.95, 1.10] |
| 1.1.2 Homocysteine‐lowering treatment at high dose versus low dose | 1 | 3649 | Risk Ratio (M‐H, Random, 95% CI) | 0.90 [0.66, 1.23] |
| 1.1.3 Homocysteine‐lowering treatment (folic acid) plus antihypertensive therapy (enalapril) versus antihypertensive therapy (enalapril) | 1 | 20702 | Risk Ratio (M‐H, Random, 95% CI) | 1.04 [0.60, 1.82] |
| 1.2 Stroke Show forest plot | 13 | Risk Ratio (M‐H, Random, 95% CI) | Subtotals only | |
| 1.2.1 Homocysteine‐lowering treatment versus placebo | 10 | 44224 | Risk Ratio (M‐H, Random, 95% CI) | 0.90 [0.82, 0.99] |
| 1.2.2 Homocysteine‐lowering treatment at high dose versus low dose | 2 | 3929 | Risk Ratio (M‐H, Random, 95% CI) | 0.90 [0.66, 1.22] |
| 1.2.3 Homocysteine‐lowering treatment (folic acid) plus antihypertensive therapy (enalapril) versus antihypertensive therapy (enalapril) | 1 | 20702 | Risk Ratio (M‐H, Random, 95% CI) | 0.79 [0.68, 0.93] |
| 1.3 First unstable angina pectoris episode requiring hospitalisation Show forest plot | 4 | 12644 | Risk Ratio (M‐H, Random, 95% CI) | 0.98 [0.80, 1.21] |
| 1.4 Death from any cause Show forest plot | 13 | Risk Ratio (M‐H, Random, 95% CI) | Subtotals only | |
| 1.4.1 Homocysteine‐lowering treatment versus placebo | 11 | 44817 | Risk Ratio (M‐H, Random, 95% CI) | 1.01 [0.96, 1.06] |
| 1.4.2 Homocysteine‐lowering treatments at high dose versus low dose | 1 | 3649 | Risk Ratio (M‐H, Random, 95% CI) | 0.86 [0.66, 1.11] |
| 1.4.3 Homocysteine‐lowering treatment (folic acid) plus antihypertensive therapy (enalapril) versus antihypertensive therapy (enalapril) | 1 | 20702 | Risk Ratio (M‐H, Random, 95% CI) | 0.94 [0.81, 1.10] |
| 1.5 Serious adverse events (cancer) Show forest plot | 9 | Risk Ratio (M‐H, Random, 95% CI) | Subtotals only | |
| 1.5.1 Homocysteine‐lowering versus placebo | 8 | 35788 | Risk Ratio (M‐H, Random, 95% CI) | 1.07 [1.00, 1.14] |
| 1.5.2 Homocysteine‐lowering treatment (folic acid) plus antihypertensive therapy (enalapril) versus antihypertensive therapy (enalapril) | 1 | 20243 | Risk Ratio (M‐H, Random, 95% CI) | 0.96 [0.71, 1.31] |
| 1.6 Adverse events (serious and non‐serious) excluding cancer Show forest plot | 3 | 13802 | Risk Ratio (M‐H, Random, 95% CI) | 1.02 [0.88, 1.19] |
| 1.6.1 Homocysteine‐lowering versus placebo | 3 | 13802 | Risk Ratio (M‐H, Random, 95% CI) | 1.02 [0.88, 1.19] |
| Outcome or subgroup title | No. of studies | No. of participants | Statistical method | Effect size |
| 2.1 Myocardial infarction Show forest plot | 6 | 37442 | Risk Ratio (M‐H, Random, 95% CI) | 1.01 [0.94, 1.09] |
| 2.1.1 Trials with low risk of bias | 6 | 37442 | Risk Ratio (M‐H, Random, 95% CI) | 1.01 [0.94, 1.09] |
| 2.2 Stroke Show forest plot | 6 | 37442 | Risk Ratio (M‐H, Random, 95% CI) | 0.90 [0.80, 1.02] |
| 2.2.1 Trials with low risk of bias | 6 | 37442 | Risk Ratio (M‐H, Random, 95% CI) | 0.90 [0.80, 1.02] |
| 2.3 Death from any cause Show forest plot | 7 | 37932 | Risk Ratio (M‐H, Random, 95% CI) | 1.03 [0.95, 1.12] |
| 2.3.1 Trials with low risk of bias | 7 | 37932 | Risk Ratio (M‐H, Random, 95% CI) | 1.03 [0.95, 1.12] |
| Outcome or subgroup title | No. of studies | No. of participants | Statistical method | Effect size |
| 3.1 Myocardial Infarction Show forest plot | 12 | 46699 | Risk Ratio (M‐H, Random, 95% CI) | 1.02 [0.95, 1.10] |
| 3.1.1 Without history of cardiovascular disease | 1 | 490 | Risk Ratio (M‐H, Random, 95% CI) | 0.98 [0.14, 6.87] |
| 3.1.2 With history of cardiovascular disease | 11 | 46209 | Risk Ratio (M‐H, Random, 95% CI) | 1.02 [0.95, 1.10] |
| 3.2 Stroke Show forest plot | 10 | 44224 | Risk Ratio (M‐H, Random, 95% CI) | 0.90 [0.82, 0.99] |
| 3.2.1 Without history of cardiovascular disease | 1 | 490 | Risk Ratio (M‐H, Random, 95% CI) | 0.20 [0.01, 4.04] |
| 3.2.2 With history of cardiovascular disease | 9 | 43734 | Risk Ratio (M‐H, Random, 95% CI) | 0.90 [0.82, 0.99] |
| 3.3 Death Show forest plot | 11 | 44817 | Risk Ratio (M‐H, Random, 95% CI) | 1.01 [0.96, 1.06] |
| 3.3.1 Without history of cardiovascular disease | 1 | 490 | Risk Ratio (M‐H, Random, 95% CI) | 0.20 [0.01, 4.04] |
| 3.3.2 With history of cardiovascular disease | 10 | 44327 | Risk Ratio (M‐H, Random, 95% CI) | 1.01 [0.96, 1.06] |
| Outcome or subgroup title | No. of studies | No. of participants | Statistical method | Effect size |
| 4.1 Myocardial infarction Show forest plot | 1 | Risk Ratio (M‐H, Random, 95% CI) | Subtotals only | |
| 4.1.1 Per protocol analysis | 1 | 20635 | Risk Ratio (M‐H, Random, 95% CI) | 1.04 [0.60, 1.82] |
| 4.1.2 Best‐worst scenario | 1 | 20702 | Risk Ratio (M‐H, Random, 95% CI) | 0.42 [0.27, 0.68] |
| 4.1.3 Worst‐best scenario | 1 | 20702 | Risk Ratio (M‐H, Random, 95% CI) | 2.38 [1.48, 3.83] |
| 4.2 Stroke Show forest plot | 1 | Risk Ratio (M‐H, Random, 95% CI) | Subtotals only | |
| 4.2.1 Per protocol analysis | 1 | 20635 | Risk Ratio (M‐H, Random, 95% CI) | 0.79 [0.68, 0.93] |
| 4.2.2 Best‐worst scenario | 1 | 20702 | Risk Ratio (M‐H, Random, 95% CI) | 0.72 [0.62, 0.84] |
| 4.2.3 Worst‐best scenario | 1 | 20702 | Risk Ratio (M‐H, Random, 95% CI) | 0.88 [0.76, 1.03] |
| 4.3 Death from any cause Show forest plot | 1 | Risk Ratio (M‐H, Random, 95% CI) | Subtotals only | |
| 4.3.1 Per protocol analysis | 1 | 20635 | Risk Ratio (M‐H, Random, 95% CI) | 0.94 [0.81, 1.10] |
| 4.3.2 Best‐worst scenario | 1 | 20702 | Risk Ratio (M‐H, Random, 95% CI) | 0.85 [0.73, 0.99] |
| 4.3.3 Worst‐best scenario | 1 | 20702 | Risk Ratio (M‐H, Random, 95% CI) | 1.04 [0.90, 1.21] |
| Outcome or subgroup title | No. of studies | No. of participants | Statistical method | Effect size |
| 5.1 Stroke Show forest plot | 2 | 3929 | Risk Ratio (M‐H, Random, 95% CI) | 0.90 [0.66, 1.22] |
| 5.1.1 Combined (folic acid, vitamin B6 and vitamin B12) | 1 | 3649 | Risk Ratio (M‐H, Random, 95% CI) | 1.04 [0.84, 1.29] |
| 5.1.2 Folic acid alone | 1 | 280 | Risk Ratio (M‐H, Random, 95% CI) | 0.76 [0.59, 0.98] |
| Outcome or subgroup title | No. of studies | No. of participants | Statistical method | Effect size |
| 6.1 Stroke Show forest plot | 2 | 3929 | Risk Ratio (M‐H, Random, 95% CI) | 0.90 [0.66, 1.22] |
| 6.1.1 Trials with low risk of bias | 1 | 3649 | Risk Ratio (M‐H, Random, 95% CI) | 1.04 [0.84, 1.29] |
| 6.1.2 Trials with high risk of bias | 1 | 280 | Risk Ratio (M‐H, Random, 95% CI) | 0.76 [0.59, 0.98] |