Pancreatoduodenectomía (Whipple clásica) versus pancreatoduodenectomía conservadora del píloro (Whipple pp) para el tratamiento quirúrgico del carcinoma periampular y pancreático
Information
- DOI:
- https://doi.org/10.1002/14651858.CD006053.pub6Copy DOI

- Database:
-
- Cochrane Database of Systematic Reviews
- Version published:
-
- 16 February 2016see what's new
- Type:
-
- Intervention
- Stage:
-
- Review
- Cochrane Editorial Group:
-
Cochrane Gut Group
- Copyright:
-
- Copyright © 2016 The Cochrane Collaboration. Published by John Wiley & Sons, Ltd.
Article metrics
Altmetric:
Cited by:
Authors
Contributions of authors
MKD:
-
Designing the review.
-
Collecting data for the review.
-
Undertaking searches.
-
Screening search results.
-
Organising retrieval of papers.
-
Screening retrieved papers against inclusion criteria.
-
Appraising quality of papers.
-
Extracting data from papers.
-
Writing to authors of papers to ask for additional information.
-
Providing additional data about papers.
-
Obtaining and screening data on unpublished studies.
-
Managing data for the review.
-
Entering data into RevMan 2014.
-
Analysing data.
-
Interpreting data.
-
Providing a methodological perspective.
-
Providing a clinical perspective.
-
Providing a consumer perspective.
-
Writing the review.
-
Performing previous work that served as the foundation of the current study.
CF:
-
Collecting data for the review.
-
Designing search strategies.
-
Undertaking searches.
-
Screening search results.
-
Organising retrieval of papers.
-
Screening retrieved papers against inclusion criteria.
-
Appraising quality of papers.
-
Extracting data from papers.
-
Writing to authors of papers to ask for additional information.
-
Providing additional data about papers.
-
Obtaining and screening data on unpublished studies.
-
Managing data for the review.
-
Entering data into RevMan 2014.
-
Analysing data.
-
Interpreting data.
-
Writing the review.
-
Revising the review after peer review.
GS:
-
Extracting data from papers.
-
Analysing data.
-
Interpreting data.
CMS:
-
Providing a methodological perspective.
-
Providing general advice on the review.
-
Interpreting the data.
-
Providing a clinical perspective.
-
Providing a policy perspective.
FJH:
-
Collecting data for the review.
-
Undertaking searches.
-
Screening search results.
-
Organising retrieval of papers.
-
Screening retrieved papers against inclusion criteria.
-
Appraising quality of papers.
-
Extracting data from papers.
-
Writing to authors of papers to ask for additional information.
-
Providing additional data about papers.
-
Obtaining and screening data on unpublished studies.
-
Managing data for the review.
-
Entering data into RevMan 2014.
-
Analysing data.
-
Interpreting data.
-
Providing a clinical perspective.
-
Updating the review.
-
Writing the updated review.
GA:
-
Providing a methodological perspective.
-
Providing general advice on the review.
MWB:
-
Providing a clinical perspective.
-
Providing a policy perspective.
-
Providing general advice on the review.
Declarations of interest
MKD: none known.
CF: holds a T32 NIH training grant (United States of America).
GS: none known.
CMS: none known.
FJH: none known.
GA: none known.
MWB: none known.
Acknowledgements
This review was carried out on the basis of a systematic review and meta‐analysis published elsewhere (Diener 2007).
Christina Fitzmaurice holds a T32 NIH training grant (United States of America).
We thank Professor Dr Hanns‐Peter Knaebel for his contribution to the design and conduct of the formerly published versions of this review. He has since become Chief Executive Officer of Aesculap AG, a medical device company that produces surgical instruments, and as such is now in breach of Cochrane's commercial sponsorship policy. He is therefore no longer an author of the current and subsequent versions of this Cochrane review.
Version history
| Published | Title | Stage | Authors | Version |
| 2016 Feb 16 | Pylorus‐preserving pancreaticoduodenectomy (pp Whipple) versus pancreaticoduodenectomy (classic Whipple) for surgical treatment of periampullary and pancreatic carcinoma | Review | Felix J Hüttner, Christina Fitzmaurice, Guido Schwarzer, Christoph M Seiler, Gerd Antes, Markus W Büchler, Markus K Diener | |
| 2014 Nov 11 | Pylorus‐preserving pancreaticoduodenectomy (pp Whipple) versus pancreaticoduodenectomy (classic Whipple) for surgical treatment of periampullary and pancreatic carcinoma | Review | Markus K Diener, Christina Fitzmaurice, Guido Schwarzer, Christoph M Seiler, Felix J Hüttner, Gerd Antes, Hanns‐Peter Knaebel, Markus W Büchler | |
| 2011 May 11 | Pylorus‐preserving pancreaticoduodenectomy (pp Whipple) versus pancreaticoduodenectomy (classic Whipple) for surgical treatment of periampullary and pancreatic carcinoma | Review | Markus K Diener, Christina Fitzmaurice, Guido Schwarzer, Christoph M Seiler, Gerd Antes, Hanns‐Peter Knaebel, Markus W Büchler | |
| 2011 Feb 16 | Pancreaticoduodenectomy (classic Whipple) versus pylorus‐preserving pancreaticoduodenectomy (pp Whipple) for surgical treatment of periampullary and pancreatic carcinoma | Review | Markus K Diener, Christina Heukaeufer, Guido Schwarzer, Christoph M Seiler, Gerd Antes, Hanns‐Peter Knaebel, Markus W Büchler | |
| 2008 Apr 23 | Pancreaticoduodenectomy (classic Whipple) versus pylorus‐preserving pancreaticoduodenectomy (pp Whipple) for surgical treatment of periampullary and pancreatic carcinoma | Review | Markus K Diener, Christina Heukaeufer, Guido Schwarzer, Christoph M Seiler, Gerd Antes, Hanns‐Peter Knaebel, Markus W Büchler | |
| 2006 Apr 19 | Pancreaticoduodenectomy (classical Whipple) versus pylorus‐preserving pancreaticoduodenectomy (pp Whipple) for surgical treatment of periampullary and pancreatic carcinoma | Protocol | Markus Diener, C Heukaufer, Christoph M Seiler, Gerd Antes, Markus W Büchler, Hanns‐Peter Knaebel, C Heukaeufer | |
Differences between protocol and review
The review differs in five points from the previously published protocol.
-
We combined the outcomes of postoperative bleeding and postoperative gastrointestinal bleeding.
-
We discarded the outcomes of intra‐abdominal fluid collection/abscess, duration of intensive care unit stay, early and late dumping, postoperative reflux, number and status of removed lymph nodes, shock, sepsis, renal failure, weight loss, and endocrine and exocrine insufficiency because no usable data were available.
-
We performed an additional quality assessment on the basis of a checklist developed by Downs et al (Downs 1998).
-
We performed a subgroup analysis for pancreatic head cancer and periampullary cancer for survival.
-
We performed a sensitivity analysis for delayed gastric emptying by using different definitions.
-
We calculated means and standard deviations according to the methods by Hozo et al for trials that provided only medians and ranges (Hozo 2005).
Keywords
MeSH
Medical Subject Headings (MeSH) Keywords
- *Pylorus;
- Ampulla of Vater [*surgery];
- Blood Loss, Surgical;
- Common Bile Duct Neoplasms [mortality, *surgery];
- Gastric Emptying;
- Operative Time;
- Organ Sparing Treatments [*methods];
- Pancreatic Fistula [etiology];
- Pancreatic Neoplasms [mortality, *surgery];
- Pancreaticoduodenectomy [adverse effects, *methods, mortality];
- Quality of Life;
- Randomized Controlled Trials as Topic;
Medical Subject Headings Check Words
Female; Humans; Male;
PICOs

Risk of bias graph: review authors' judgements about each risk of bias item presented as percentages across all included studies.
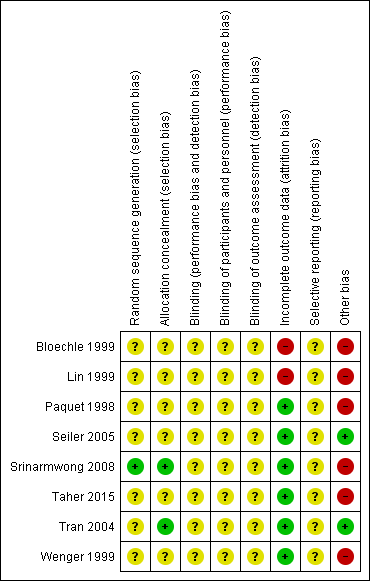
Risk of bias summary: review authors' judgements about each risk of bias item for each included study.


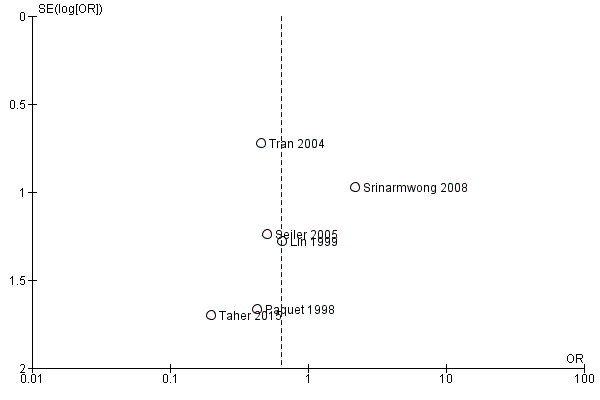
Funnel plot of comparison: 1 Survival, outcome: 1.1 Overall.
Funnel plot of comparison: 2 Postoperative mortality, outcome: 2.1 Postoperative mortality.

Funnel plot of comparison: 3 Pancreatic fistula, outcome: 3.1 Pancreatic fistula.

Comparison 1 Pancreatic fistula, Outcome 1 Pancreatic fistula.

Comparison 2 Delayed gastric emptying (with sensitivity analysis), Outcome 1 All studies.

Comparison 2 Delayed gastric emptying (with sensitivity analysis), Outcome 2 Studies in which DGE was defined (includes different definitions).

Comparison 2 Delayed gastric emptying (with sensitivity analysis), Outcome 3 Studies with the same definitions of DGE.

Comparison 3 Biliary leakage, Outcome 1 Biliary leakage.

Comparison 4 Survival, Outcome 1 Overall.

Comparison 4 Survival, Outcome 2 Pancreatic head carcinoma.

Comparison 4 Survival, Outcome 3 Periampullary cancer.

Comparison 5 Postoperative mortality, Outcome 1 Postoperative mortality.

Comparison 6 Intraoperative blood loss, Outcome 1 Intraoperative blood loss (litres).

Comparison 7 Red blood cell transfusion, Outcome 1 Red blood cell transfusion.

Comparison 8 Operating time, Outcome 1 Operating time (minutes).

Comparison 9 Postoperative bleeding, Outcome 1 Postoperative bleeding.

Comparison 10 Wound infection, Outcome 1 Wound infection.

Comparison 11 Pulmonary complications, Outcome 1 Pulmonary complications.

Comparison 12 Necessity for reoperation, Outcome 1 Necessity for reoperation.

Comparison 13 Duration of hospital stay, Outcome 1 Hospital stay (days).

Comparison 14 R0 resection rate, Outcome 1 R0 resection rate.
| Postoperative mortality and DGE after surgical treatment for periampullary or pancreatic carcinoma | ||||||
| Patient or population: people with surgical treatment for periampullary or pancreatic carcinoma Comparison: CW | ||||||
| Outcomes | Illustrative comparative risks* (95% CI) | Relative effect | Number of participants | Quality of the evidence | Comments | |
| Assumed risk | Corresponding risk | |||||
| CW | PPW | |||||
| Postoperative mortality | 60 per 1000 | 39 per 1000 | OR 0.64 | 464 | ⊕⊕⊕⊝ | |
| Pancreatic fistula | 93 per 1000 | 88 per 1000 (48 to 158) | OR 0.95 (0.49 to 1.84) | 468 (7 trials) | ⊕⊕⊝⊝ lowa,b | |
| DGE | 235 per 1000 | 482 per 1000 (244 to 728) | OR 3.03 (1.05 to 8.70) | 459 (7 trials) | ⊕⊕⊝⊝ | |
| *The basis for the assumed risk was the mean risk in the control group across studies. The corresponding risk (and its 95% confidence interval) is based on the assumed risk in the comparison group and the relative effect of the intervention (and its 95% CI). | ||||||
| GRADE Working Group grades of evidence. | ||||||
| aConfidence intervals are wide due to small number of events. No sample size calculation was reported for trials except for Seiler 2005 and Tran 2004. | ||||||
| Survival after surgical treatment for periampullary or pancreatic carcinoma | ||||||
| Patient or population: people with surgical treatment for periampullary or pancreatic carcinoma Comparison: CW | ||||||
| Outcomes | Illustrative comparative risks* (95% CI) | Relative effect | Number of participants | Quality of the evidence | Comments | |
| Assumed risk | Corresponding risk | |||||
| CW | PPW | |||||
| Overall survival | Medium‐risk population | HR 0.84 | 284 | ⊕⊕⊝⊝ | ||
| *The basis for the assumed risk (e.g. median control group risk across studies) is provided in footnotes. The corresponding risk (and its 95% confidence interval) is based on the assumed risk in the comparison group and the relative effect of the intervention (and its 95% CI). | ||||||
| GRADE Working Group grades of evidence. | ||||||
| aInadequate information about sequence generation and allocation concealment. No intention‐to‐treat analysis. | ||||||
| Operating time, intraoperative blood loss, and red blood cell transfusion in surgical treatment for periampullary or pancreatic carcinoma | |||||
| Patient or population: people with surgical treatment for periampullary or pancreatic carcinoma Comparison: CW | |||||
| Outcomes | Illustrative comparative risks (95% CI) | Relative effect | Number of participants | Quality of the evidence | Comments |
| CW vs PPW | |||||
| Intraoperative blood loss (millilitres) | Mean intraoperative blood loss in the intervention group was than in the control group | MD ‐0.32 (‐0.62 to ‐0.03) | 404 | ⊕⊕⊝⊝ | |
| Red blood cell transfusion (units) | Mean red blood cell transfusion in the intervention group was 0.47 units lower than in the control group (0.86 to 0.07 lower) | MD ‐0.47 (‐0.86 to ‐0.07) | 273 (5 trials) | ⊕⊕⊝⊝ | |
| Operating time (minutes) | Mean operating time in the intervention group was than in the control group | MD ‐45.22 (‐74.67 to ‐15.78) | 472 | ⊕⊕⊝⊝ | |
| CI: confidence interval; CW: classic Whipple; MD: mean difference; PPW: pylorus‐preserving Whipple | |||||
| GRADE Working Group grades of evidence. | |||||
| aSerious limitations in the study design of Bloechle 1999, Lin 1999, Taher 2015, and Wenger 1999 are a potential source of bias. All are characterised by small sample sizes, lack of blinding, and incomplete outcome reporting. | |||||
| Outcome or subgroup title | No. of studies | No. of participants | Statistical method | Effect size |
| 1 Pancreatic fistula Show forest plot | 7 | 468 | Odds Ratio (M‐H, Random, 95% CI) | 0.95 [0.49, 1.84] |
| Outcome or subgroup title | No. of studies | No. of participants | Statistical method | Effect size |
| 1 All studies Show forest plot | 7 | 459 | Odds Ratio (M‐H, Random, 95% CI) | 3.03 [1.05, 8.70] |
| 2 Studies in which DGE was defined (includes different definitions) Show forest plot | 4 | 355 | Odds Ratio (M‐H, Random, 95% CI) | 2.00 [0.55, 7.22] |
| 3 Studies with the same definitions of DGE Show forest plot | 2 | 198 | Odds Ratio (M‐H, Random, 95% CI) | 4.02 [0.14, 119.16] |
| Outcome or subgroup title | No. of studies | No. of participants | Statistical method | Effect size |
| 1 Biliary leakage Show forest plot | 5 | 380 | Odds Ratio (M‐H, Random, 95% CI) | 0.96 [0.15, 6.17] |
| Outcome or subgroup title | No. of studies | No. of participants | Statistical method | Effect size |
| 1 Overall Show forest plot | 3 | 284 | Hazard ratio (Random, 95% CI) | 0.84 [0.61, 1.16] |
| 2 Pancreatic head carcinoma Show forest plot | 3 | 203 | Hazard ratio (Random, 95% CI) | 0.73 [0.43, 1.22] |
| 3 Periampullary cancer Show forest plot | 2 | 74 | Hazard ratio (Random, 95% CI) | 0.83 [0.39, 1.76] |
| Outcome or subgroup title | No. of studies | No. of participants | Statistical method | Effect size |
| 1 Postoperative mortality Show forest plot | 7 | 464 | Odds Ratio (M‐H, Random, 95% CI) | 0.64 [0.26, 1.54] |
| Outcome or subgroup title | No. of studies | No. of participants | Statistical method | Effect size |
| 1 Intraoperative blood loss (litres) Show forest plot | 5 | 404 | Mean Difference (IV, Random, 95% CI) | ‐0.32 [‐0.62, ‐0.03] |
| Outcome or subgroup title | No. of studies | No. of participants | Statistical method | Effect size |
| 1 Red blood cell transfusion Show forest plot | 5 | 273 | Mean Difference (IV, Random, 95% CI) | ‐0.47 [‐0.86, ‐0.07] |
| Outcome or subgroup title | No. of studies | No. of participants | Statistical method | Effect size |
| 1 Operating time (minutes) Show forest plot | 7 | 472 | Mean Difference (IV, Random, 95% CI) | ‐45.22 [‐74.67, ‐15.78] |
| Outcome or subgroup title | No. of studies | No. of participants | Statistical method | Effect size |
| 1 Postoperative bleeding Show forest plot | 5 | 380 | Odds Ratio (M‐H, Random, 95% CI) | 0.74 [0.32, 1.74] |
| Outcome or subgroup title | No. of studies | No. of participants | Statistical method | Effect size |
| 1 Wound infection Show forest plot | 4 | 251 | Odds Ratio (M‐H, Random, 95% CI) | 0.85 [0.35, 2.05] |
| Outcome or subgroup title | No. of studies | No. of participants | Statistical method | Effect size |
| 1 Pulmonary complications Show forest plot | 3 | 218 | Odds Ratio (M‐H, Random, 95% CI) | 0.67 [0.29, 1.58] |
| Outcome or subgroup title | No. of studies | No. of participants | Statistical method | Effect size |
| 1 Necessity for reoperation Show forest plot | 3 | 320 | Odds Ratio (M‐H, Random, 95% CI) | 0.80 [0.38, 1.68] |
| Outcome or subgroup title | No. of studies | No. of participants | Statistical method | Effect size |
| 1 Hospital stay (days) Show forest plot | 5 | 366 | Mean Difference (IV, Random, 95% CI) | 0.26 [‐2.04, 2.56] |
| Outcome or subgroup title | No. of studies | No. of participants | Statistical method | Effect size |
| 1 R0 resection rate Show forest plot | 4 | 359 | Odds Ratio (M‐H, Random, 95% CI) | 0.92 [0.39, 2.15] |