مداخلات در منزل برای پیشگیری ثانویه از قرار گرفتن کودکان در معرض سرب خانگی
Information
- DOI:
- https://doi.org/10.1002/14651858.CD006047.pub6Copy DOI

- Database:
-
- Cochrane Database of Systematic Reviews
- Version published:
-
- 06 October 2020see what's new
- Type:
-
- Intervention
- Stage:
-
- Review
- Cochrane Editorial Group:
-
Cochrane Developmental, Psychosocial and Learning Problems Group
- Copyright:
-
- Copyright © 2020 The Cochrane Collaboration. Published by John Wiley & Sons, Ltd.
Article metrics
Altmetric:
Cited by:
Authors
Contributions of authors
BNS, VM, AD, GW, AC, LMP, SL, SKL, LKB and GG wrote the updated the text of the review.
VM, AD, GW, AC, LKB, LMP, SL, SKL, and BNS screened titles, abstracts and full‐text reports, and resolved conflicts regarding inclusion/exclusion of an article.
VM and GW extracted data from the three new studies identified by this update into data extraction forms and conducted the 'Risk of bias' assessment.
BNS transferred the data to Review Manager 5 (Review Manager 2020).
BNS and VM performed the GRADE assessment.
All authors critically read the manuscript and provided feedback.
BNS is the guarantor for the review.
Sources of support
Internal sources
-
None, Other
External sources
-
World Health Organization (WHO), Switzerland
WHO, Evidence & Policy on Environmental Health (EPE), financially supported the update of the review as part of a guideline development process.
Declarations of interest
WHO financially supported the update of this review as part of its guideline development process. The review authors are responsible for the views expressed in this publication, and they do not necessarily represent the decisions or policies of the WHO.
BNS: none known.
VM: none known.
AD: none known.
GW: none known.
AC: none known.
LMP: none known.
SL: none known.
SKL: none known.
LKB: none known.
GG: none known.
Acknowledgements
The authors would like to thank the trial authors who provided us with information. We thank Dr Katrina Williams for her advice and assistance with methods and meta‐analysis. We commend and appreciate the continued efforts of Cochrane Developmental, Psychosocial and Learning Problems (CDPLP) for their help with literature searching, review and editing, in particular the support of Jane Dennis, former Managing Editor; and Joanne Duffield, current Managing Editor; Geraldine Macdonald, Co‐ordinating Editor; and to Margaret Anderson, Information Specialist, who updated and performed the search. We would also like to thank Danielle Wheeler for her contribution to the original review. The authors of this updated version of the Cochrane Review want to thank the authors of the previous versions of this review who did not remain authors of this update, but supported us as external experts: Berlinda Yeoh (BY), Susan Woolfenden (SW), Bruce Lanphear (BL), Greta F Ridley (GR), Nuala Livingstone (NL), Emile Jorgensen (EJ) and Ursula Griebler (UG). We would also like to thank Evelyn Auer for her organisational support throughout the update. We highly appreciate the financial support of the World Health Organization (WHO), who commissioned this update.
The Editorial Team are grateful to the following peer reviewers for their time and comments: Helen J Binns MD MPH, Ann & Robert H Lurie Children's Hospital of Chicago; Mary Jean Brown ScD RN, Harvard TH Chan School of Public Health; Brian Duncan, USA; Hege Kornør, Norwegian Institute of Public Health; Areti Angeliki Veroniki, Cochrane Statistical Methods Group.
Version history
| Published | Title | Stage | Authors | Version |
| 2020 Oct 06 | Household interventions for secondary prevention of domestic lead exposure in children | Review | Barbara Nussbaumer-Streit, Verena Mayr, Andreea Iulia Dobrescu, Gernot Wagner, Andrea Chapman, Lisa M Pfadenhauer, Szimonetta Lohner, Stefan K Lhachimi, Laura K Busert, Gerald Gartlehner | |
| 2016 Oct 16 | Household interventions for preventing domestic lead exposure in children | Review | Barbara Nussbaumer‐Streit, Berlinda Yeoh, Ursula Griebler, Lisa M Pfadenhauer, Laura K Busert, Stefan K Lhachimi, Szimonetta Lohner, Gerald Gartlehner | |
| 2014 Dec 15 | Household interventions for preventing domestic lead exposure in children | Review | Berlinda Yeoh, Susan Woolfenden, Bruce Lanphear, Greta F Ridley, Nuala Livingstone, Emile Jorgensen | |
| 2012 Apr 18 | Household interventions for preventing domestic lead exposure in children | Review | Berlinda Yeoh, Susan Woolfenden, Bruce Lanphear, Greta F Ridley, Nuala Livingstone | |
| 2008 Apr 23 | Household interventions for prevention of domestic lead exposure in children | Review | Berlinda Yeoh, Susan Woolfenden, Danielle M Wheeler, Garth Alperstein, Bruce Lanphear | |
| 2006 Apr 19 | Household interventions for prevention of domestic lead exposure in children | Protocol | Berlinda Yeoh, Susan Woolfenden, Danielle M Wheeler, Garth Alperstein, Bruce Lanphear | |
Differences between protocol and review
Search methods for identification of studies
We revised the search strategies used for the original review for the 2012 update by introducing additional search strings in which 'lead' is found in proximity to other terms (rather than searching for 'lead' as a single term). We reran the revised strategies for this 2016 update, and searched two additional databases: Cochrane Database of Systematic Reviews (CDSR) and Database of Abstracts of Reviews of Effects (DARE). We also searched Conference Proceedings Citation Index‐Science (CPCI‐S) as a substitute for searching for conference papers in ZETOC, because of its more advanced search interface.
In 2020, we searched two additional MEDLINE segments, which are updated daily: MEDLINE In‐Process and Other Non‐Indexed Citations, and MEDLINE Epub Ahead of Print. We were unable to access WHO ICTRP for this update because it was only accessible to WHO staff due to increased demand for COVID‐19 research. Additionally, we did not search DARE as no new content has been added since 2015.
Searching other resources
In our update in 2020, we searched Google Scholar for potentially relevant studies; we screened the hits on the first two pages. In addition, we examined the reference lists of relevant studies, and contacted experts to determine whether any unpublished or ongoing trials existed.
Data collection and analysis
Data extraction and management
We used Review Manager 5.4 for this update (Review Manager 2020).
Measures of treatment effect
Binary data
We did not calculate risk differences because they strongly depend on the baseline risk and are not as stable as risk ratios (Higgins 2019).
Continuous data
For continuous data, we compared post‐treatment means between intervention and control groups, and calculated MDs instead of comparing mean changes (from baseline to post‐treatment) between intervention and control groups, because baseline data were comparable in the included studies.
Confidence in cumulative evidence
We used the GRADE method to assess the certainty of the evidence from meta‐analyses per outcome.
Assessment of heterogeneity
We reported Tau², an estimate of the between‐study variance in a random‐effects meta‐analysis.
Changes in author team
Berlinda Yeoh (BY), Susan Woolfenden (SW), Danielle M Wheeler (DMW), Garth Aperstein (GA), and Bruce Lanphear (BL) developed and wrote the text of the original review (Yeoh 2006). In 2012, BY, SW, BL, Greta F Ridley (GFR), and Nuala Livingstone (NL) updated the original review. In 2014, BY, SW, BL, GFR, NL, and Emile Jorgensen (EJ) updated the review again. In 2016, the author team changed: BNS took over first authorship; BY remained as an author, and UG, LMP, LKB, SKL, SL, GG joined the team. In 2020, the team updated the review; however, BY and UG did not remain as authors and VM, AD, GW and AC joined the team.
Appendix 2 lists the unused methods.
Keywords
MeSH
Medical Subject Headings (MeSH) Keywords
- Bias;
- Dust [analysis, *prevention & control];
- Environmental Exposure [*prevention & control];
- Environmental Restoration and Remediation [*methods];
- Floors and Floorcoverings;
- Lead [blood];
- Lead Poisoning [*prevention & control];
- Paint [toxicity];
- Randomized Controlled Trials as Topic;
- Secondary Prevention [*methods];
- Soil Pollutants;
Medical Subject Headings Check Words
Child, Preschool; Female; Humans; Infant; Male;
PICOs

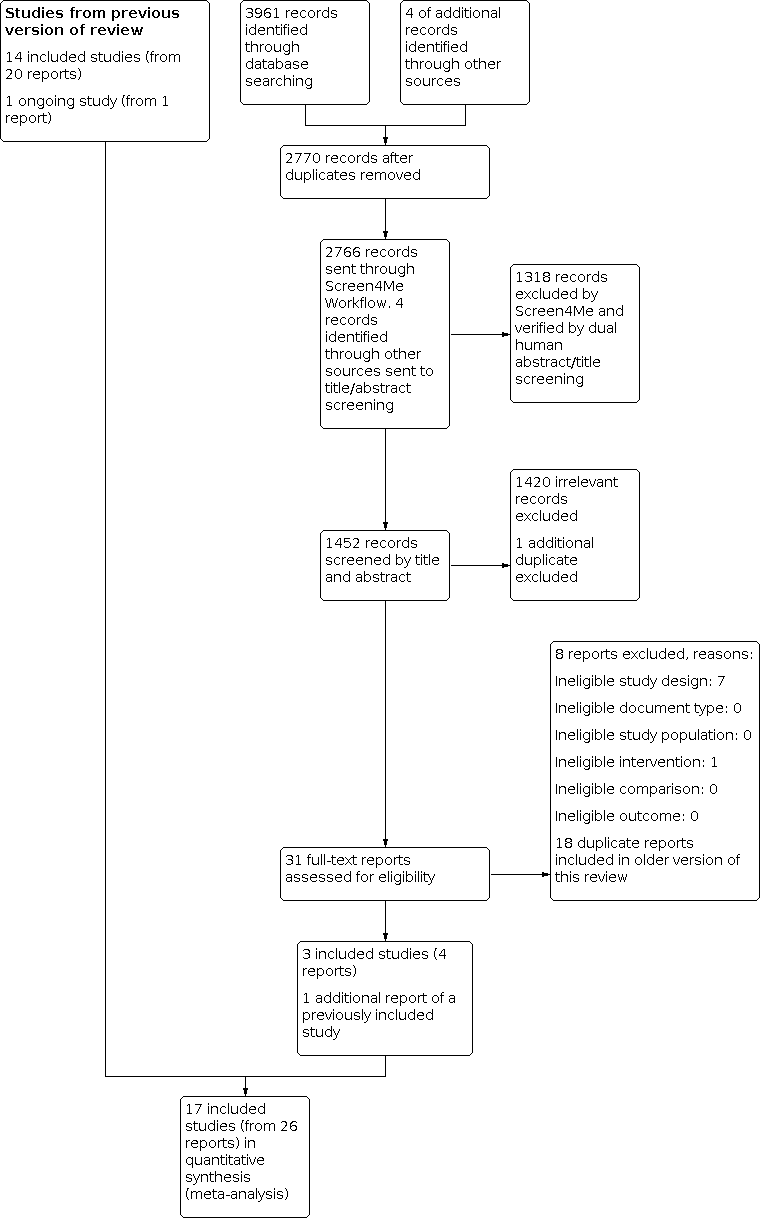
Screen4Me summary diagram. RCT: randomised controlled trial.

Risk of bias graph: review authors' judgements about each risk of bias item presented as percentages across all included studies.

Risk of bias summary: review authors' judgements about each risk of bias item for each included study.

Comparison 1: Education interventions compared to no intervention or standard education, Outcome 1: Blood lead level (continuous)

Comparison 1: Education interventions compared to no intervention or standard education, Outcome 2: Blood lead level ≥ 10.0 µg/dL (dichotomous)

Comparison 1: Education interventions compared to no intervention or standard education, Outcome 3: Blood lead level ≥ 15.0 µg/dL (dichotomous)

Comparison 1: Education interventions compared to no intervention or standard education, Outcome 4: Floor dust – hard floor

Comparison 2: Environmental interventions (dust control) compared to no intervention or another intervention not aimed to influence domestic lead exposure, Outcome 1: Blood lead level (continuous)

Comparison 2: Environmental interventions (dust control) compared to no intervention or another intervention not aimed to influence domestic lead exposure, Outcome 2: Blood lead level ≥ 10.0 µg/dL (dichotomous)

Comparison 2: Environmental interventions (dust control) compared to no intervention or another intervention not aimed to influence domestic lead exposure, Outcome 3: Blood lead level ≥ 15.0 µg/dL (dichotomous)

Comparison 2: Environmental interventions (dust control) compared to no intervention or another intervention not aimed to influence domestic lead exposure, Outcome 4: Blood lead level ≥ 10.0 µg/dL (dichotomous): intraclass correlation coefficient (ICC) 0.01

Comparison 2: Environmental interventions (dust control) compared to no intervention or another intervention not aimed to influence domestic lead exposure, Outcome 5: Blood lead level ≥ 10.0 µg/dL (dichotomous): ICC 0.1

Comparison 2: Environmental interventions (dust control) compared to no intervention or another intervention not aimed to influence domestic lead exposure, Outcome 6: Blood lead level ≥ 10.0 µg/dL (dichotomous): ICC 0.2

Comparison 2: Environmental interventions (dust control) compared to no intervention or another intervention not aimed to influence domestic lead exposure, Outcome 7: Blood lead level ≥ 15.0 µg/dL (dichotomous): ICC 0.01

Comparison 2: Environmental interventions (dust control) compared to no intervention or another intervention not aimed to influence domestic lead exposure, Outcome 8: Blood lead level ≥ 15.0 µg/dL (dichotomous): ICC 0.1

Comparison 2: Environmental interventions (dust control) compared to no intervention or another intervention not aimed to influence domestic lead exposure, Outcome 9: Blood lead level ≥ 15.0 µg/dL (dichotomous): ICC 0.2
| Education interventions versus no intervention for preventing domestic lead exposure in children | ||||||
| Patient or population: children (aged 0–2 years) | ||||||
| Outcomes | Illustrative comparative risks* (95% CI) | Relative effect | Number of participants (studies) | Certainty of the evidence | Comments | |
|---|---|---|---|---|---|---|
| Assumed risk | Corresponding risk | |||||
| No intervention | Educational interventions | |||||
| Cognitive and neurobehavioural outcomes | None of the included studies assessed effects on cognitive or neurobehavioural outcomes | — | — | — | — | |
| Adverse events | None of the included studies assessed adverse event outcomes | — | — | — | — | |
| Blood lead levels (continuous) Scale: 0–30 Follow‐up: 3–18 months | The mean blood lead level (continuous, log transformed) ranged across control groups from 1.24 to 2.51a,b | The mean blood lead level (continuous, log transformed) in the intervention groups was 0.03 lower (0.13 lower to 0.07 higher) a | — | 815 | ⊕⊕⊕⊝ | Included studies: Lanphear 1996a; Lanphear 1999; Wasserman 2002; Jordan 2003; Brown 2006 |
| Household dust: hard floor dust lead levels (continuous) Scale: 0–40 Follow‐up: 6 months | The mean floor dust level – hard floor – ranged across control groups from 1.65 to 2.28a,b | The mean floor dust level – hard floor – in the intervention groups was 0.07 lower (0.37 lower to 0.24 higher) b | — | 318 | ⊕⊕⊕⊝ | Included studies: Lanphear 1996a; Lanphear 1999 |
| *The basis for the assumed risk (e.g. the median control group risk across studies) is provided in footnotes. The corresponding risk (and its 95% CI) is based on the assumed risk in the comparison group and the relative effect of the intervention (and its 95% CI). CI: confidence interval; RR: risk ratio. | ||||||
| GRADE Working Group grades of evidence | ||||||
| aPost‐treatment value. | ||||||
| Environmental interventions versus no intervention for preventing domestic lead exposure in children | ||||||
| Patient or population: children (aged 0–6 years) | ||||||
| Outcomes | Illustrative comparative risks* (95% CI) | Relative effect (95% CI) | Number of participants (studies) | Certainty of the evidence | Comments | |
|---|---|---|---|---|---|---|
| Assumed risk | Corresponding risk | |||||
| No intervention | Environmental interventions | |||||
| Dust control interventions | ||||||
| Cognitive and neurobehavioural outcomes Scale Wechsler IQ: BRIEF: Follow‐up: 3–8 years | Children in the intervention group had numerically better cognitive and neurobehavioural outcomes, but differences were small and 95% CI included beneficial and non‐beneficial effects. Difference of mean scores after 8 years of selected scales:
For detailed results of subscales and additional scales reported see Effects of interventions. | — | 224–302 (1 study) | ⊕⊕⊝⊝ | Included study: Braun 2018 | |
| Adverse events Follow‐up: 3–8 years | 1 study reported that after 8 years they did not observe any adverse events in the intervention group. In the control group, 1 child had an injury because of a stair gateway installed and another child had elevated blood lead concentrations (28 µg/dL). | — | 355 (1 study) | ⊕⊝⊝⊝ | ||
| Blood lead levels (continuous) Scale: 0–30 Follow‐up: 6–24 months | The mean blood lead level (continuous, log transformed) ranged across control groups from 0.53to 2.9e | The mean blood lead level (continuous, log transformed) in the intervention groups was 0.02 lower (0.09 lower to 0.06 higher) e | — | 565 (4 studies) | ⊕⊕⊕⊝ | Included studies: Hilts 1995; Rhoads 1999; Boreland 2009; Braun 2018 |
| Household dust: floor dust lead levels | None of the included studies assessed floor dust lead levels. | — | — | — | — | |
| Soil abatement interventions | ||||||
| Cognitive and neurobehavioural outcomes | None of the included studies assessed cognitive and neurobehavioural outcomes. | — | — | — | — | |
| Adverse events | None of the included studies assessed adverse events. | — | — | — | — | |
| Blood lead levels (continuous) Scale: 0–30 Follow‐up: 11–24 months | 2 studies performed soil abatement interventions (Weitzman 1993; Farrell 1998). Farrell 1998 reported results as a "total effect" showing no statistical significance, and no data were available for our analyses. Weitzman 1993 reported a statistically significant effect in favour of the intervention. The difference in mean change scores between the intervention group and control group A (loose interior dust abatement and paint removal) was –1.5 µg/dL (SD 4.9), and between the intervention group and control group B (loose interior paint removal only) was –1.9 µg/dL (SD 5.0). No measure of variance was available for post‐treatment means or mean change scores, so further analysis was not possible in this review. | — | 378 (2 studies) | ⊕⊝⊝⊝ Very lowf,g | Included studies Weitzman 1993; Farrell 1998 | |
| Household dust: floor dust lead levels | None of the included studies reported floor dust lead levels. | — | — | — | — | |
| *The basis for the assumed risk (for example, the median control group risk across studies) is provided in footnotes. The corresponding risk (and its 95% CI) is based on the assumed risk in the comparison group and the relative effect of the intervention (and its 95% CI). CI: confidence interval; IQ: intelligence quotient; MD: mean difference; n: number of study participants with a measurement; SD: standard deviation. | ||||||
| GRADE Working Group grades of evidence | ||||||
| aDowngraded one level because of imprecision: total population size was fewer than 400 and the 95% confidence interval included both a benefit and no benefit of the intervention. | ||||||
| Combination interventions versus no intervention for preventing domestic lead exposure in children | ||||||
| Patient or population: children (aged 0–4 years) | ||||||
| Outcomes | Illustrative comparative risks* (95% CI) | Relative effect (95% CI) | Number of participants (studies) | Certainty of the evidence | Comments | |
|---|---|---|---|---|---|---|
| Assumed risk | Corresponding risk | |||||
| Standard education | Combination interventions | |||||
| Cognitive and neurobehavioural outcomes | None of the included studies assessed cognitive and neurobehavioural outcomes. | — | — | — | — | |
| Adverse events | None of the included studies assessed adverse events. | — | — | — | — | |
| Blood lead levels (continuous) Scale: 0–30 Follow‐up: 6–24 months | The 4 studies that used a combination of interventions compared to standard education showed inconclusive results. While Charney 1983 reported a significant effect favouring treatment with arithmetic means for post‐treatment blood lead levels of 31.7 µg/dL (SD 2.6) in the intervention group and 37.8 µg/dL (SD 7.9) in the control group, Aschengrau 1998, Campbell 2011, and Sterling 2004 showed little to no difference between combination interventions and standard education on blood lead levels. | — | 426 (4 studies) | ⊕⊝⊝⊝ Very lowa,b | Included studies Charney 1983; Aschengrau 1998; Sterling 2004; Campbell 2011 | |
| Household dust: floor dust lead levels Follow‐up: 6–12 months | Aschengrau 1998 found no evidence for an effect on floor dust lead levels, with median changes for floor dust lead level being –0.002 mg/m² (–0.2 µg/feet², SD 0.8 µg/feet²) in the intervention group and 0.001 mg/m² (0.0 µg/feet², SD 0.2 µg/feet²) in the control group. A second study also found no evidence for an effect on floor dust lead levels (Campbell 2011). | — | 336 (2 studies) | ⊕⊝⊝⊝ Very lowa,b | ||
| *The basis for the assumed risk (for example, the median control group risk across studies) is provided in footnotes. The corresponding risk (and its 95% CI) is based on the assumed risk in the comparison group and the relative effect of the intervention (and its 95% CI). CI: confidence interval; MD: mean difference; SD: standard deviation. | ||||||
| GRADE Working Group grades of evidence | ||||||
| aDowngraded one level because of imprecision; inconclusive and contradicting results of studies. | ||||||
| Study ID | Mean blood lead level at baseline (µg/dL) | Age at baseline (months) |
|---|---|---|
| 15.0–19.0 | 24–36 | |
| 15.0–19.0 | 42 | |
| 0.7 | 0 | |
| 15.0–19.0 | 12–24 | |
| 2.6–2.7 | 8–14 | |
| 38 | 43–45 | |
| 10.0–14.0 | 6–72 | |
| 10.0–14.0 | 24–36 | |
| < 10.0 | < 12 | |
| 6.6–6.8 | 12–24 | |
| 2.8–2.9 | 6.7 | |
| 5.28 | 47 | |
| 10.0–14.0 | 12–24 | |
| 15.0–19.0 | 49 | |
| 10.0–14.0 | 34–43 | |
| 2.6–4.5 | 22–24 | |
| 10.0–14.0 | 4–36 |
| Study ID | Education | Dust control | Soil abatement | Combination |
|---|---|---|---|---|
| — | — | — | Yes | |
| — | Yes | — | — | |
| — | Yes | — | — | |
| Yes | — | — | — | |
| — | — | — | Yes | |
| — | — | — | Yes | |
| — | — | Yes | — | |
| — | Yes | — | — | |
| Yes | — | — | — | |
| Yes | — | — | — | |
| Yes | — | — | — | |
| — | Yes | — | — | |
| — | Yes | — | — | |
| Yes | — | — | — | |
| — | — | — | Yes | |
| Yes | — | — | — | |
| — | — | Yes | — |
| Study ID | Neurobehavioural and cognitive outcomes | Adverse events | Blood lead (continuous) | Blood lead (dichotomous) | Household dust lead levels: floors | Household dust lead levels: windows | Cost | Other |
|---|---|---|---|---|---|---|---|---|
| — | — | Yes | — | Yes | Yes | — | — | |
| — | — | Yes | — | — | — | Yes | — | |
| Yes | Yes | Yes | — | Yes | Yes | — | ||
| — | — | Yes | Yes | Yes | — | Yes | Parent‐Child Interaction scale | |
| — | — | Yes | — | Yes | Yes | — | Chicago Parents Knowledge Test | |
| — | — | Yes | Yes | — | — | — | — | |
| — | — | — | — | — | — | Yes | Total effect (blood lead levels) | |
| — | — | Yes | Yes | Yes | — | Yes | — | |
| — | — | Yes | — | — | — | — | — | |
| — | — | Yes | Yes | Yes | Yes | — | — | |
| — | — | Yes | Yes | Yes | Yes | — | — | |
| — | — | Yes | — | — | — | — | Lead exposure risk, brochure effectiveness, cleaning home repair behaviour, lead knowledge | |
| — | — | Yes | Yes | Yes | Yes | — | Maternal knowledge lead poisoning | |
| — | — | Yes | — | — | — | — | ||
| — | — | — | Yes | — | — | Yes | — | |
| — | — | Yes | Yes | — | — | Yes | Chicago Parents Knowledge Test | |
| — | — | Yes | — | — | — | — | — |
| Outcome or subgroup title | No. of studies | No. of participants | Statistical method | Effect size |
| 1.1 Blood lead level (continuous) Show forest plot | 5 | 815 | Mean Difference (IV, Random, 95% CI) | ‐0.03 [‐0.13, 0.07] |
| 1.2 Blood lead level ≥ 10.0 µg/dL (dichotomous) Show forest plot | 4 | 520 | Risk Ratio (M‐H, Random, 95% CI) | 1.02 [0.79, 1.30] |
| 1.3 Blood lead level ≥ 15.0 µg/dL (dichotomous) Show forest plot | 4 | 520 | Risk Ratio (M‐H, Random, 95% CI) | 0.60 [0.33, 1.09] |
| 1.4 Floor dust – hard floor Show forest plot | 2 | 318 | Mean Difference (IV, Random, 95% CI) | ‐0.07 [‐0.37, 0.24] |
| Outcome or subgroup title | No. of studies | No. of participants | Statistical method | Effect size |
| 2.1 Blood lead level (continuous) Show forest plot | 4 | 565 | Mean Difference (IV, Random, 95% CI) | ‐0.02 [‐0.09, 0.06] |
| 2.2 Blood lead level ≥ 10.0 µg/dL (dichotomous) Show forest plot | 2 | 210 | Risk Ratio (M‐H, Random, 95% CI) | 0.93 [0.73, 1.18] |
| 2.3 Blood lead level ≥ 15.0 µg/dL (dichotomous) Show forest plot | 2 | 210 | Risk Ratio (M‐H, Random, 95% CI) | 0.86 [0.35, 2.07] |
| 2.4 Blood lead level ≥ 10.0 µg/dL (dichotomous): intraclass correlation coefficient (ICC) 0.01 Show forest plot | 2 | 204 | Risk Ratio (M‐H, Random, 95% CI) | 0.93 [0.73, 1.18] |
| 2.5 Blood lead level ≥ 10.0 µg/dL (dichotomous): ICC 0.1 Show forest plot | 2 | 173 | Risk Ratio (M‐H, Random, 95% CI) | 0.95 [0.72, 1.24] |
| 2.6 Blood lead level ≥ 10.0 µg/dL (dichotomous): ICC 0.2 Show forest plot | 2 | 155 | Risk Ratio (M‐H, Random, 95% CI) | 0.97 [0.72, 1.29] |
| 2.7 Blood lead level ≥ 15.0 µg/dL (dichotomous): ICC 0.01 Show forest plot | 2 | 204 | Risk Ratio (M‐H, Random, 95% CI) | 0.82 [0.37, 1.81] |
| 2.8 Blood lead level ≥ 15.0 µg/dL (dichotomous): ICC 0.1 Show forest plot | 2 | 173 | Risk Ratio (M‐H, Random, 95% CI) | 0.83 [0.34, 2.03] |
| 2.9 Blood lead level ≥ 15.0 µg/dL (dichotomous): ICC 0.2 Show forest plot | 2 | 155 | Risk Ratio (M‐H, Random, 95% CI) | 0.75 [0.34, 1.66] |